experimental study of the valve-bend interaction in …
TRANSCRIPT
EXPERIMENTAL STUDY OF THE VALVE-BEND INTERACTION
IN AN AIRCRAFT ECS SYSTEM
Vanierschot M.*, Denayer H., De Roeck W., and Desmet W.
*Author for correspondence
Department of Mechanical Engineering,
University of Leuven,
3000 Leuven,
Belgium,
E-mail: [email protected]
ABSTRACT
Aircraft ventilation systems are crucial in maintaining a good
air quality during flight. The aim is delivering both fresh and
recirculated air to the cabin and cockpit of the plane. Typical
components in a ventilation system are heat units, fans, filters and
valves. The latter are usually electronically controlled butterfly
valves which regulate the flow rate in the system. These devices
have a significant impact and the flow field after the valve affects
the working of every component downstream in the network. In
this paper the flow fields before and after a butterfly valve are
studied using hotwire and stereoscopic PIV measurements. Two
configurations are tested: one configuration consisting of a single
valve (single valve configuration) and one configuration
consisting of a valve closely coupled after a 90° bend (valve +
bend configuration). The velocity is measured in both a horizontal
and vertical measurement plane to study the spatial structure of
the flow. Both PIV and hotwire measurements show good
agreement. In both configurations, the flow field is highly 3
dimensional. The bend has a large impact on the flow field after
the valve. The central wake is significantly increased in length
and the turbulence intensities increase from around 50% for the
single valve configuration to more than 75% for the valve + bend
configuration. This significant impact shows the importance of the
interaction of different components in a ventilation network on the
general characteristics such as pressure drop or noise propagation.
NOMENCLATURE
U [m/s] Axial velocity component
TI [%] Turbulence intensity
D [mm] Diameter
x [m] Cartesian axis direction, direction along pipe
y [m] Cartesian axis direction, horizontal direction
z [m] Cartesian axis direction, vertical direction
Subscripts
rms Root mean square
x Axial
0 Time averaged value
INTRODUCTION
Most studies related to the reduction of aircraft noise focus
on externally propagated noise such as for instance noise during
take-off and landing. However in aircrafts, the internal cooling
and ventilation system (called Environmental Control System
or ECS) also generates a significant amount of internal noise.
This noise propagates through the piping system and a strong
coupling with the internal flow may result in unwanted noise
levels in the cockpit and cabin. The physical mechanisms
responsible for this propagation are much more complex than
for exterior noise propagation since the separation between
flow and acoustic fields becomes much more arbitrary and
more difficult to be described with classical modelling
approaches. Therefore, most studies on ECS components just
focus on one component in the system [1-5]. However, many
interactions take place between different components in the
network such as the blower units, control valves and bends.
These interactions will influence the characteristics such as
noise propagation and total pressure drop and need to be known
to model accurately.
In this study, a first step is made in describing the
interaction between two components in an ECS system, namely
a 90° bend and an electronically controlled butterfly valve. The
influence of the bend upstream of the valve on the flow field
after the valve is studied. Particle Image Velocimetry (PIV) and
Hot Wire Anemometry (HWA) are used to measure the flow
field and the turbulence statistics. The result of this study helps
in understanding the component interaction in an ECS system,
which can serve as a base for understanding the flow/noise
interaction.
EXPERIMENTAL SETUP AND METHODS
The ECS valve, measured in this study, is a butterfly valve
which is installed in a piping network with inner diameter
D=84,9mm. The valve opening is adjustable between 0°
(closed) and 90° (open) and typical operating positions are
situated between 10° and 30°. Under normal operating
conditions in an aircraft ECS system, the inlet valve
temperature is situated between 80°C and 110°C and a typical
relative inlet pressure is between 1,25bar and 3,00bar,
11th International Conference on Heat Transfer, Fluid Mechanics and Thermodynamics
281

corresponding to typical mass flow rates of 0-1350g/s. In this
paper two pipe networks are measured. One configuration is a
single valve (further on called the valve configuration) and the
other is the same valve with a 90° bend placed upstream
(further on called valve + bend configuration). The curvature of
the bend equals the internal diameter D of the casing. The
length L between the bend and the valve is 1.5D in order to
enable measurements in between the bend and valve. A
schematic top view of the valve + bend configuration is shown
in Figure 1. The valve and valve + bend configurations are both
embedded in a network with 17D upstream tubing and 8D
downstream tubing.
Figure 1 Schematic top view of the valve + bend
configuration.
A uniform flow speed is generated using a parallel Roots’
blower configuration. Due to the working principle of the
blower, the maximum relative pressure at the outlet is limited to
1,1bar with a maximum volumetric flow rate equal to
approximately 13m3/min. Both compressors have three lobes to
minimize both noise generation and small time-pulsations of
the flow. On one of the Roots’ blowers, a frequency regulator
with PID controller is installed. The latter is used to couple the
Roots’ blower with a pressure sensor, located upstream of both
configurations, in order to ensure identical inlet conditions
between the different measurement campaigns and test
configurations. Furthermore, a Schiltknecht MiniAir20 Turbine
flow meter is installed at the downstream end of the test rig to
measure the downstream centerline velocity and temperature.
During all measurements, the outgoing flow velocity at the
centerline is kept constant at 32 m/s. Also a heat exchanger
coupled after the blower ensures a constant temperature of
31°C in all experiments.
The flow field is independently measured by both Particle
Image Velocimetry (PIV) and Hot Wire Anemometry (HWA).
In such way, the advantage of both methods can be combined
and both can be used to validate each other. The cartesian
measurement coordinate system has its x-axis along the pipe
symmetry line, the y-axis along the horizontal direction and the
z-axis along the vertical direction. For the PIV measurements, a
laser sheet with a thickness of 0.5 mm is generated using a Dual
Cavity Nd:YLF Pegasus- PIV laser with a wavelength of 527
nm and a pulse energy of 10 mJ @ 1,000 Hz. Two positions of
the laser sheet are taken: one in the xy-plane (horizontal plane)
and one in the xz-plane (vertical plane). Due to the finite
thickness of the laser sheet in combination with the, relatively,
Figure 2 Direction of the laser sheet with respect to the
piping network
small radius of the ducts, diffraction effects made it impossible
to yield accurate results when inserting the laser shield through
the tube wall along the y-axis. Therefore the laser is aligned
with the symmetry axis (x-axis) of the pipe and enters the setup
from the outlet, as shown in Figure 2. Hence, PIV upstream of
the valve is not feasible. The images are recorded using a
‘HighSpeedStar 5’ CMOS camera with a resolution of 1,024 x
1,024 pixels. The camera is positioned, as shown in Figure 2,
perpendicular to the laser sheet plane, in close vicinity of the
plexi-glass measurement section, for both the horizontal and
vertical laser sheet alignment. The calculation of the velocity
vectors is done using the DaVis 7.2 software of LaVision
GmbH. Due to refraction issues near the wall, the measurement
plane is limited to, approximately, [-30mm, 30mm] in the flow
x direction and [-35mm, 35mm] in the horizontal y and vertical
z direction with a spatial resolution of 1.6579 mm between two
adjacent vectors. In this framework, the HWA measurements
provide more detailed information about the flow field in the
vicinity of the wall as well as the ‘high’-frequency content of
the turbulent velocity field.
The hot wire measurements are carried out to obtain high
frequency information on the aerodynamic field including data
in close vicinity of the walls. The measurements are carried out
on both a horizontal (y) and vertical (z) line. The raw data pre-
and post-processing is carried out using Dantec Streamware Pro
V10. For all hot-wire measurement an L-shaped probe (type:
Dantec 55P14) is used. The probes are calibrated using a
Dantec 90H02 Flow Unit. The calibration is carried out for a
logarithmic distribution of 35 velocities ranging from 2m/s up
to 70 m/s with a continuous monitoring of the flow
temperature. In order to take into account the varying
temperature of the measured flow, a temperature correction is
added during acquisition to take into account the variation in
the voltage of the hot-wire probe with varying temperature. For
the unsteady flow measurements the data acquisition is carried
out using a Dantec Streamline acquisition system and the
voltages of the hot-wire sensors are sent to the processing
software using a multifunctional I/O with correlated digital I/O
for USB (NI USB-6229).
D
L
Valve
11th International Conference on Heat Transfer, Fluid Mechanics and Thermodynamics
282

RESULTS AND DISCUSSION
Upstream HWA measurements
Figure 3 shows the axial velocity profiles upstream of the
valve, obtained with HWA, for both the horizontal and vertical
Figure 3 Hot wire measurements of the inlet axial velocity
profile 5D upstream of the valve and valve + bend
configuration.
axis. Due to refraction/reflection PIV can’t be used in this
region of the flow. A sudden increase in velocity is observed at
large (positive) values of the radial position. This is caused by
leakage effects of the insertion of the hot-wire probe. These
holes are sealed as much as possible. However due to the
relatively high pressures in the upstream section of the valve
and the traversing of the probe, leakage is unavoidable. For the
valve + bend configuration, this leakage is higher due to the
increased pressure in the upstream tubing. As such the HWA
measurements near the insertion can be discarded. Figure 3
shows that the inlet velocity profiles are axisymmetric and
similar for both configurations. The turbulent intensity profiles
(not shown here) indicate values of around 12% in the
boundary layer and 6% near the pipe center. These medium
turbulence levels are caused by the fact that inside the duct
system no turbulence decreasing measures, such as e.g.
expansion chambers, turbulent screens or honeycomb
structures, are present. This to ensure the setup is representative
for real ECS systems.
HWA measurements between bend and valve
The axial velocity profile along a horizontal measurement
line at the outlet of the bend is shown in Figure 4. The profile is
asymmetric with higher velocities near the outer radius of the
bend. Note that due to leakage of the probe, the velocities
below y = -30 mm can be discarded. The asymmetry in the flow
is only in the symmetry plane of the bend as the profiles along a
vertical symmetry plane (not shown here) are symmetric. The
profile shown in Figure 4 is typical for a 90° bend as the
centrifugal forces move fluid towards the outer wall, creating a
zone of low velocity near the inner radius. As a result, due to
the imbalance between the centrifugal force and radial pressure
gradient, secondary flow structures, called Dean vortices, are
created [6-8]. These vortices move fluid from the inner side of
the pipe towards the outer side and as such significantly change
the wake of the valve as shown later.
Figure 4 Hot wire measurements of the axial velocity 1.5D
upstream of the valve + bend configuration. The horizontal
measurement line is located at the outlet of the bend.
Downstream HWA measurements
The mean axial velocity profiles at a distance of 1.5D
downstream of the valve are shown in Figures 5 and 6 for both
the valve alone and the valve + bend configuration. As the
pressure after the valve is atmospheric, no leakage is present
near the probes’ insertion. The velocity profiles are asymmetric
and wake-like in both horizontal and vertical directions. The
asymmetry is induced by the asymmetric wake behind the valve
Figure 5 Axial velocity profile along the central horizontal
axis at x/D=1.5 after the valve.
disc [9]. As the valve is opened (Figure 1), more fluid is
flowing through the upper section, creating an asymmetric
wake. If a bend is placed upstream of the valve, this uneven
distribution of flow along the valve is compensated by the extra
11th International Conference on Heat Transfer, Fluid Mechanics and Thermodynamics
283
fluid near the outer radius of the valve (Figure 4). As such, the
profiles tend to be more symmetric. Comparing the minimal
axial velocity near the center between the valve alone and the
valve + bend configuration shows that the value for the
configuration with valve is significantly lower. As such, the
length of the wake behind the valve increases if a bend is
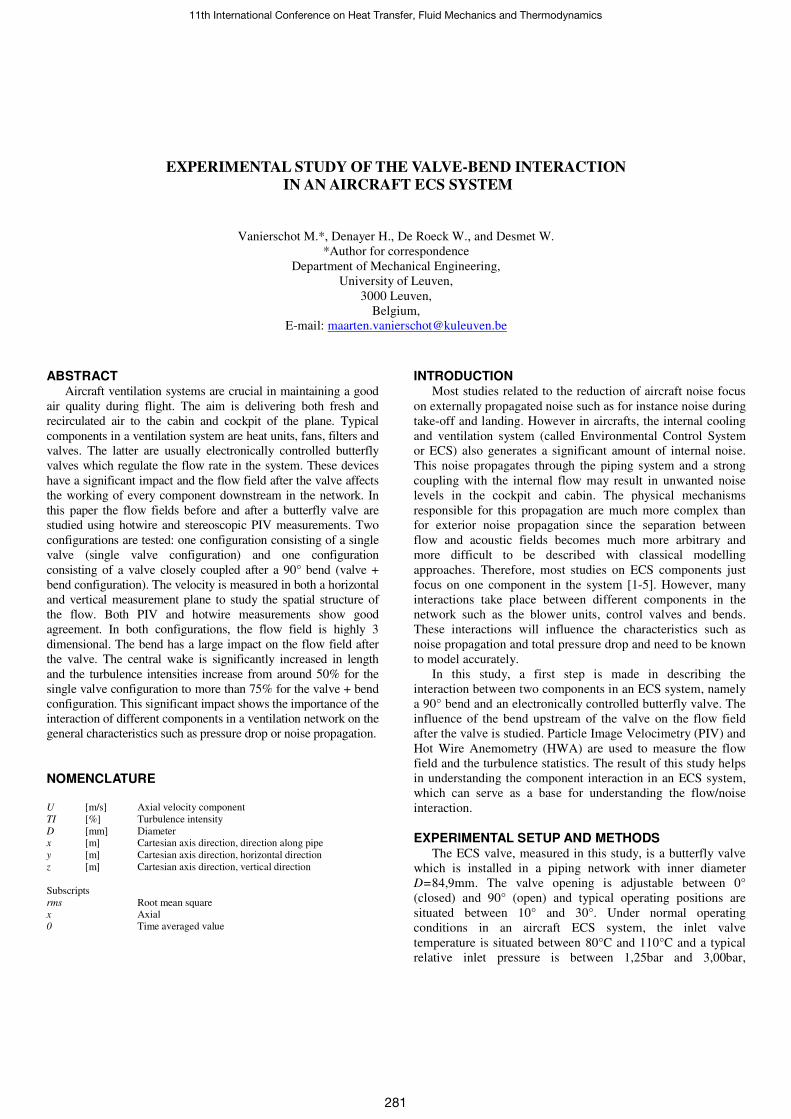
placed upstream. The turbulence intensity levels of the axial
velocity component, defined as
( )( )'
0
%x rms
x
uTI
U= , (1)
are shown in Figures 7 and 8. The maximum values are situated
near the central pipe axis as is typical for wake flows behind a
disc [10]. The intensities are in the order of 55% for the valve
alone and 75% for the valve + bend configuration. Figures 5 to
8 show the significant impact of the bend on the valve ‘s wake
and therefore the characteristic for a single valve, like for
instance the flow coefficient or pressure drop, should not be
extrapolated to a valve + bend configuration.
Figure 6 Axial velocity profile along the central vertical
axis at x/D=1.5
Figure 7 Turbulence intensities profile along the central
horizontal axis at x/D=1.5 after the valve.
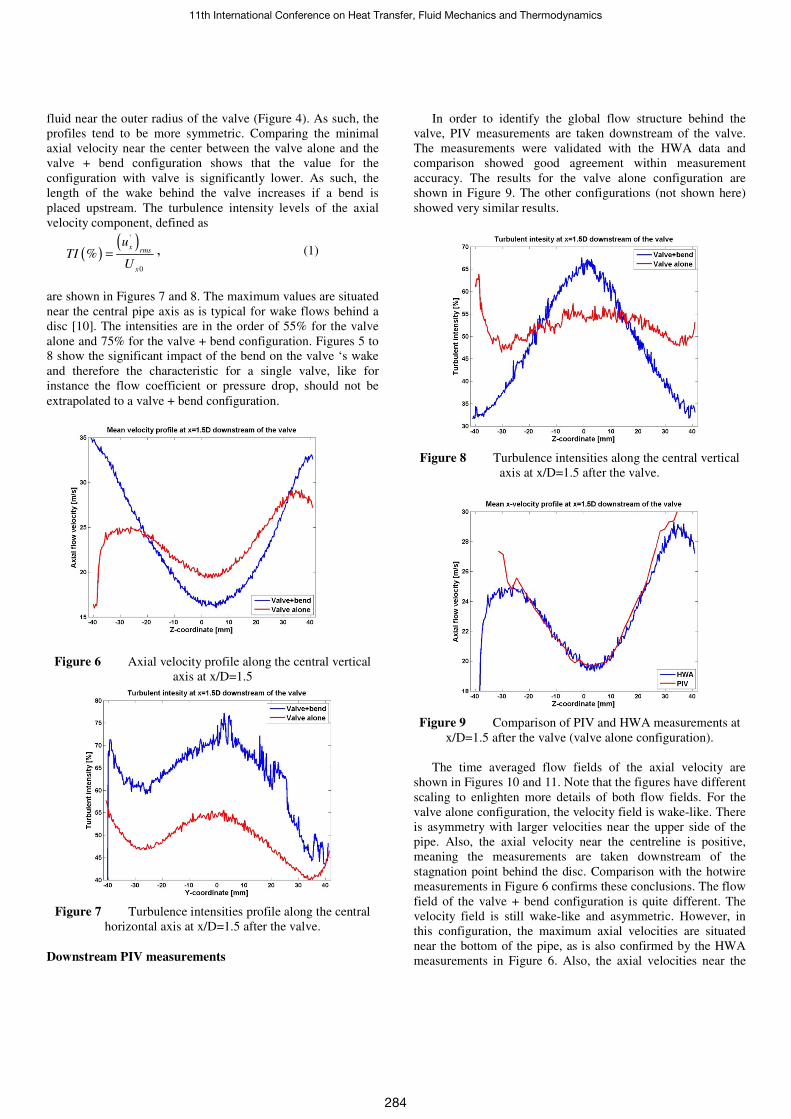
Downstream PIV measurements
In order to identify the global flow structure behind the
valve, PIV measurements are taken downstream of the valve.
The measurements were validated with the HWA data and
comparison showed good agreement within measurement
accuracy. The results for the valve alone configuration are
shown in Figure 9. The other configurations (not shown here)
showed very similar results.
Figure 8 Turbulence intensities along the central vertical
axis at x/D=1.5 after the valve.
Figure 9 Comparison of PIV and HWA measurements at
x/D=1.5 after the valve (valve alone configuration).
The time averaged flow fields of the axial velocity are
shown in Figures 10 and 11. Note that the figures have different
scaling to enlighten more details of both flow fields. For the
valve alone configuration, the velocity field is wake-like. There
is asymmetry with larger velocities near the upper side of the
pipe. Also, the axial velocity near the centreline is positive,
meaning the measurements are taken downstream of the
stagnation point behind the disc. Comparison with the hotwire
measurements in Figure 6 confirms these conclusions. The flow
field of the valve + bend configuration is quite different. The
velocity field is still wake-like and asymmetric. However, in
this configuration, the maximum axial velocities are situated
near the bottom of the pipe, as is also confirmed by the HWA
measurements in Figure 6. Also, the axial velocities near the
11th International Conference on Heat Transfer, Fluid Mechanics and Thermodynamics
284
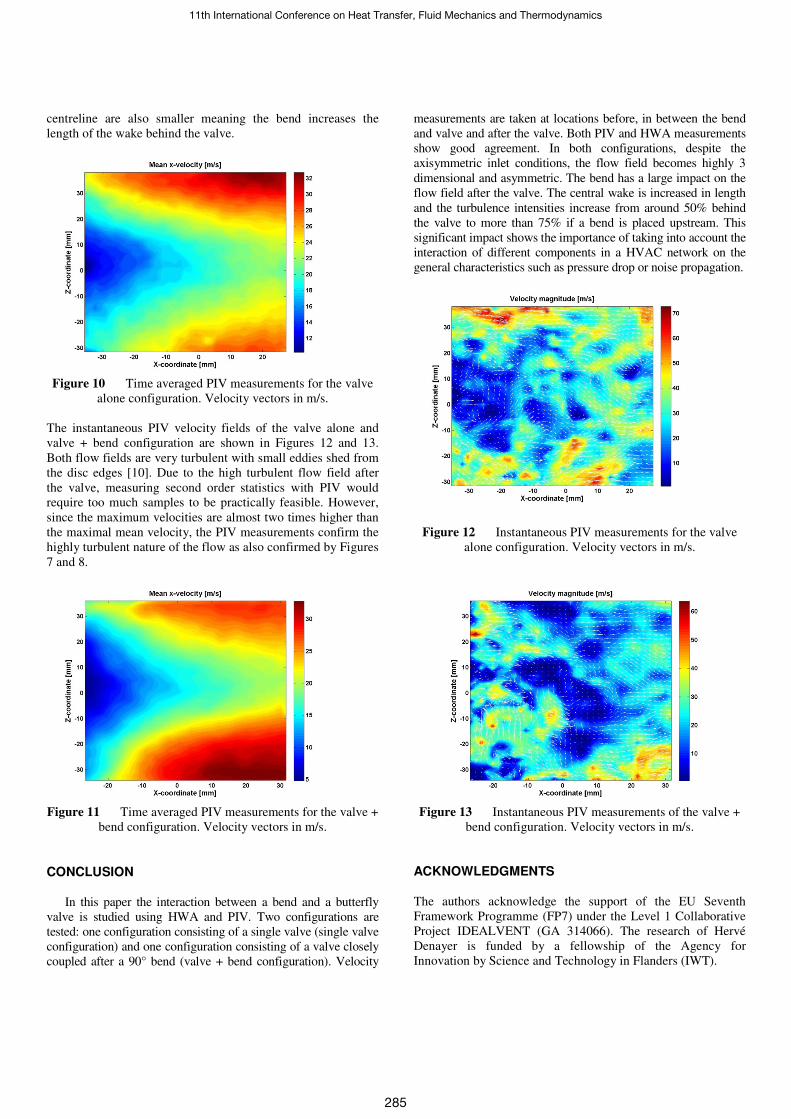
centreline are also smaller meaning the bend increases the
length of the wake behind the valve.
Figure 10 Time averaged PIV measurements for the valve
alone configuration. Velocity vectors in m/s.
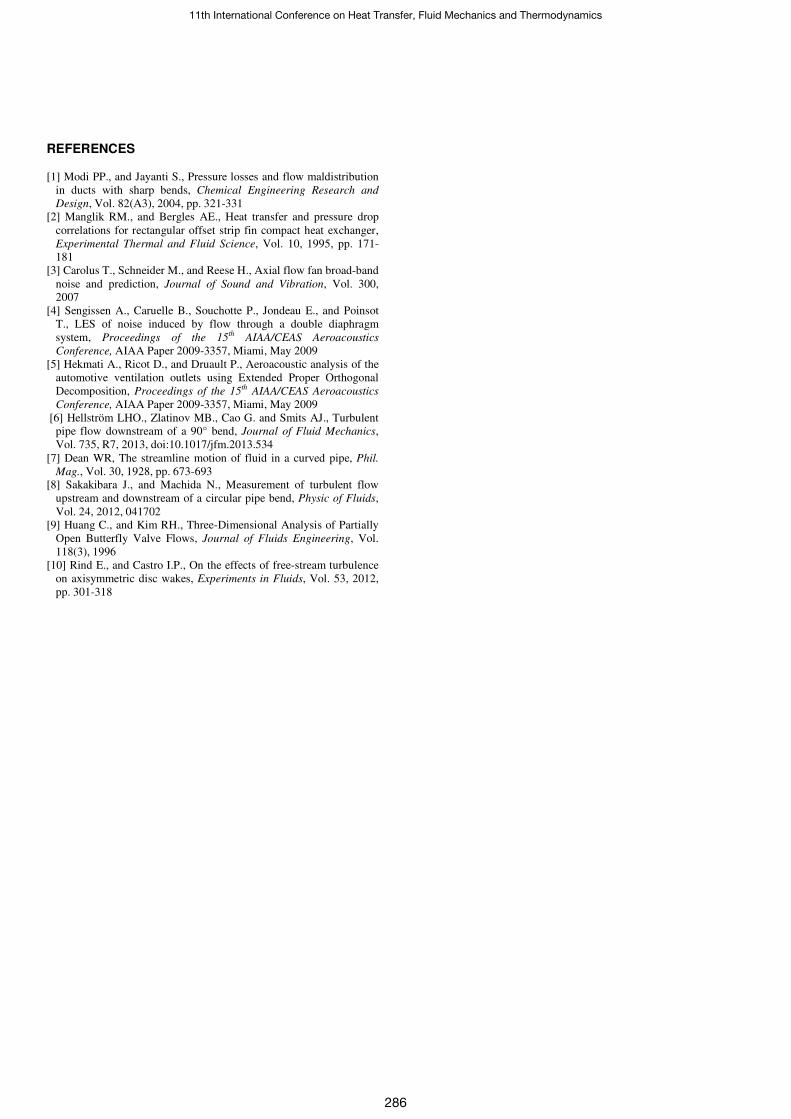
The instantaneous PIV velocity fields of the valve alone and
valve + bend configuration are shown in Figures 12 and 13.
Both flow fields are very turbulent with small eddies shed from
the disc edges [10]. Due to the high turbulent flow field after
the valve, measuring second order statistics with PIV would
require too much samples to be practically feasible. However,
since the maximum velocities are almost two times higher than
the maximal mean velocity, the PIV measurements confirm the
highly turbulent nature of the flow as also confirmed by Figures
7 and 8.
Figure 11 Time averaged PIV measurements for the valve +
bend configuration. Velocity vectors in m/s.
CONCLUSION
In this paper the interaction between a bend and a butterfly
valve is studied using HWA and PIV. Two configurations are
tested: one configuration consisting of a single valve (single valve
configuration) and one configuration consisting of a valve closely
coupled after a 90° bend (valve + bend configuration). Velocity
measurements are taken at locations before, in between the bend
and valve and after the valve. Both PIV and HWA measurements
show good agreement. In both configurations, despite the
axisymmetric inlet conditions, the flow field becomes highly 3
dimensional and asymmetric. The bend has a large impact on the
flow field after the valve. The central wake is increased in length
and the turbulence intensities increase from around 50% behind
the valve to more than 75% if a bend is placed upstream. This
significant impact shows the importance of taking into account the
interaction of different components in a HVAC network on the
general characteristics such as pressure drop or noise propagation.
Figure 12 Instantaneous PIV measurements for the valve
alone configuration. Velocity vectors in m/s.
Figure 13 Instantaneous PIV measurements of the valve +
bend configuration. Velocity vectors in m/s.
ACKNOWLEDGMENTS
The authors acknowledge the support of the EU Seventh
Framework Programme (FP7) under the Level 1 Collaborative
Project IDEALVENT (GA 314066). The research of Hervé
Denayer is funded by a fellowship of the Agency for
Innovation by Science and Technology in Flanders (IWT).
11th International Conference on Heat Transfer, Fluid Mechanics and Thermodynamics
285
REFERENCES
[1] Modi PP., and Jayanti S., Pressure losses and flow maldistribution
in ducts with sharp bends, Chemical Engineering Research and
Design, Vol. 82(A3), 2004, pp. 321-331
[2] Manglik RM., and Bergles AE., Heat transfer and pressure drop
correlations for rectangular offset strip fin compact heat exchanger,
Experimental Thermal and Fluid Science, Vol. 10, 1995, pp. 171-
181
[3] Carolus T., Schneider M., and Reese H., Axial flow fan broad-band
noise and prediction, Journal of Sound and Vibration, Vol. 300,
2007
[4] Sengissen A., Caruelle B., Souchotte P., Jondeau E., and Poinsot
T., LES of noise induced by flow through a double diaphragm
system, Proceedings of the 15th AIAA/CEAS Aeroacoustics
Conference, AIAA Paper 2009-3357, Miami, May 2009
[5] Hekmati A., Ricot D., and Druault P., Aeroacoustic analysis of the
automotive ventilation outlets using Extended Proper Orthogonal
Decomposition, Proceedings of the 15th AIAA/CEAS Aeroacoustics
Conference, AIAA Paper 2009-3357, Miami, May 2009
[6] Hellström LHO., Zlatinov MB., Cao G. and Smits AJ., Turbulent
pipe flow downstream of a 90° bend, Journal of Fluid Mechanics,
Vol. 735, R7, 2013, doi:10.1017/jfm.2013.534
[7] Dean WR, The streamline motion of fluid in a curved pipe, Phil.
Mag., Vol. 30, 1928, pp. 673-693
[8] Sakakibara J., and Machida N., Measurement of turbulent flow
upstream and downstream of a circular pipe bend, Physic of Fluids,
Vol. 24, 2012, 041702
[9] Huang C., and Kim RH., Three-Dimensional Analysis of Partially
Open Butterfly Valve Flows, Journal of Fluids Engineering, Vol.
118(3), 1996
[10] Rind E., and Castro I.P., On the effects of free-stream turbulence
on axisymmetric disc wakes, Experiments in Fluids, Vol. 53, 2012,
pp. 301-318
11th International Conference on Heat Transfer, Fluid Mechanics and Thermodynamics
286