experimental research on aeroelasticity - nato educational notes/rto-en... · the present document...
TRANSCRIPT
Damian M. Vogt
Energy Technology, Royal Institute of Technology, Sweden
1. Introduction The present document aims at giving an introduction to experimental research methods in turbomachinery aeroelasticity. Experimental research is conducted such as to test components, study specific aspects of aeroelasticity in detail as well as to acquire validation data for the assessment of numerical tools. Despite the degree of sophistication attained in modeling of aerodynamics, structural dynamics as well as fluid-structure interaction, experimental research plays still an important role in the investigation of physical mechanisms of turbomachinery flow phenomena (Srinivasan, 1997). In order to serving the needs, any experimental investigation must have clear objectives, followed by a appropriate definition of the experimental apparatus. Below various aspects of aeroelasticity are elucidated first providing fundamental methods for performing experimental research in aeroelasticity. An overview over various test facilities is then given followed by a review of relevant measuring techniques.
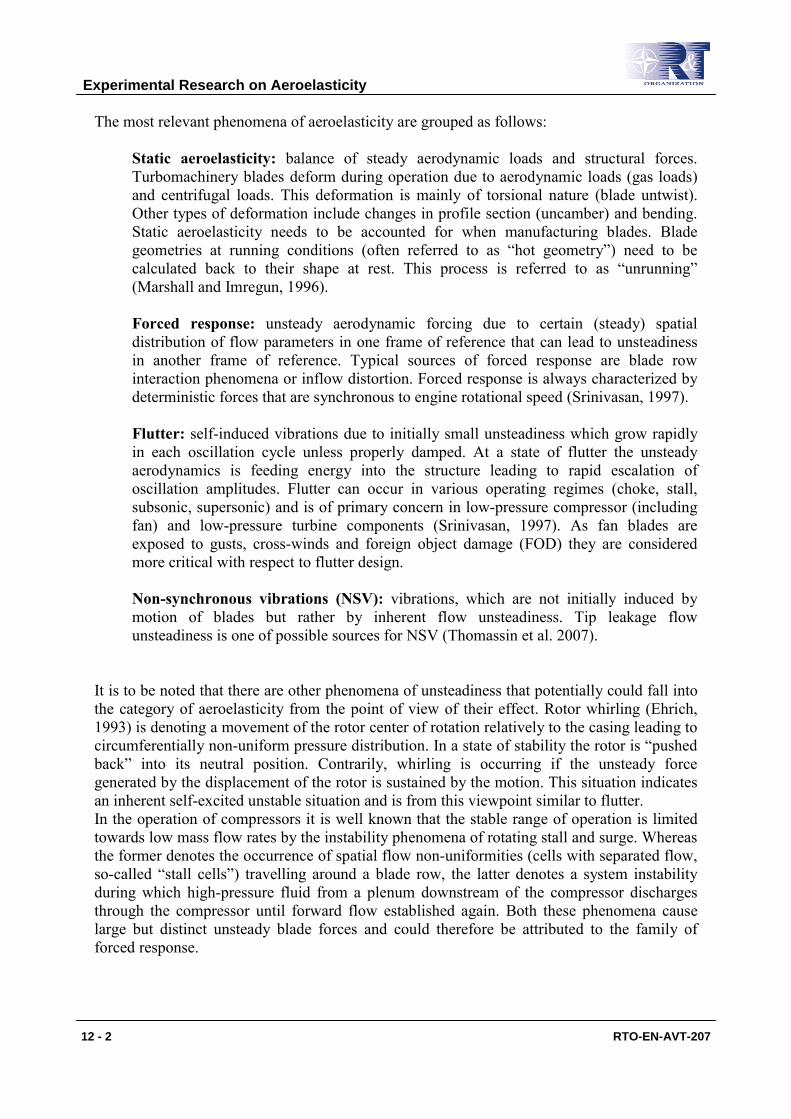
2. Turbomachinery Aeroelasticity Aeroelasticity denotes a family of phenomena arising due to interaction of fluid and structure. These phenomena can be of steady (static aeroelasticity) or of unsteady nature (dynamic aeroelasticity). Dynamic aeroelasticity typically causes vibration that can harm mechanical integrity of components unless properly damped. Static aeroelasticity is concerned with the balance of steady aerodynamic loads and elastic structural forces. In case of dynamic aeroelasticity the sources of excitation might be of distinct nature arising for example from blade row interaction phenomena or they might be of self-excited nature indicating that the vibration is a result of the balance between unsteady aerodynamic forces and dynamic structural forces. The former case is referred to as “forced response” whereas the latter case is referred to as “flutter”. Collar (1946) has given a phenomenological expression of aeroelasticity as included in Figure 2-1.
Figure 2-1. Collar’s triangle of forces
RTO-EN-AVT-207 12 - 1
Experimental Research on Aeroelasticity
The most relevant phenomena of aeroelasticity are grouped as follows:
Static aeroelasticity: balance of steady aerodynamic loads and structural forces. Turbomachinery blades deform during operation due to aerodynamic loads (gas loads) and centrifugal loads. This deformation is mainly of torsional nature (blade untwist). Other types of deformation include changes in profile section (uncamber) and bending. Static aeroelasticity needs to be accounted for when manufacturing blades. Blade geometries at running conditions (often referred to as “hot geometry”) need to be calculated back to their shape at rest. This process is referred to as “unrunning” (Marshall and Imregun, 1996). Forced response: unsteady aerodynamic forcing due to certain (steady) spatial distribution of flow parameters in one frame of reference that can lead to unsteadiness in another frame of reference. Typical sources of forced response are blade row interaction phenomena or inflow distortion. Forced response is always characterized by deterministic forces that are synchronous to engine rotational speed (Srinivasan, 1997). Flutter: self-induced vibrations due to initially small unsteadiness which grow rapidly in each oscillation cycle unless properly damped. At a state of flutter the unsteady aerodynamics is feeding energy into the structure leading to rapid escalation of oscillation amplitudes. Flutter can occur in various operating regimes (choke, stall, subsonic, supersonic) and is of primary concern in low-pressure compressor (including fan) and low-pressure turbine components (Srinivasan, 1997). As fan blades are exposed to gusts, cross-winds and foreign object damage (FOD) they are considered more critical with respect to flutter design. Non-synchronous vibrations (NSV): vibrations, which are not initially induced by motion of blades but rather by inherent flow unsteadiness. Tip leakage flow unsteadiness is one of possible sources for NSV (Thomassin et al. 2007).
It is to be noted that there are other phenomena of unsteadiness that potentially could fall into the category of aeroelasticity from the point of view of their effect. Rotor whirling (Ehrich, 1993) is denoting a movement of the rotor center of rotation relatively to the casing leading to circumferentially non-uniform pressure distribution. In a state of stability the rotor is “pushed back” into its neutral position. Contrarily, whirling is occurring if the unsteady force generated by the displacement of the rotor is sustained by the motion. This situation indicates an inherent self-excited unstable situation and is from this viewpoint similar to flutter. In the operation of compressors it is well known that the stable range of operation is limited towards low mass flow rates by the instability phenomena of rotating stall and surge. Whereas the former denotes the occurrence of spatial flow non-uniformities (cells with separated flow, so-called “stall cells”) travelling around a blade row, the latter denotes a system instability during which high-pressure fluid from a plenum downstream of the compressor discharges through the compressor until forward flow established again. Both these phenomena cause large but distinct unsteady blade forces and could therefore be attributed to the family of forced response.
Experimental Research on Aeroelasticity
12 - 2 RTO-EN-AVT-207
Regardless the type of aeroelastic phenomenon under study, it always includes some kind of aerodynamic unsteadiness and structural vibration. When performing experimental research in this field the test setup must be conceived such that it allows studying the phenomenon of interest. When studying forced response it would be appropriate to provide aerodynamic unsteadiness while measuring structural vibrations. On the other hand, if aerodynamic damping during flutter is of interest, one could provide structural vibration while focusing on the determination of the induced aerodynamic unsteadiness, i.e. the aerodynamic damping. Furthermore it has to be kept in mind that turbomachines are complex engines whereas experiments should be simple but still representative. Therefore a basic understanding of turbomachinery aeroelasticity is seen as prerequisite before conceiving experimental research in this field. Below it is aimed at giving an introduction into this field focusing on relevant parameters for experimental research. This is done step-by-step starting with an isolated airfoil, then leading over to the blade row environment and last ending up with the multistage environment.
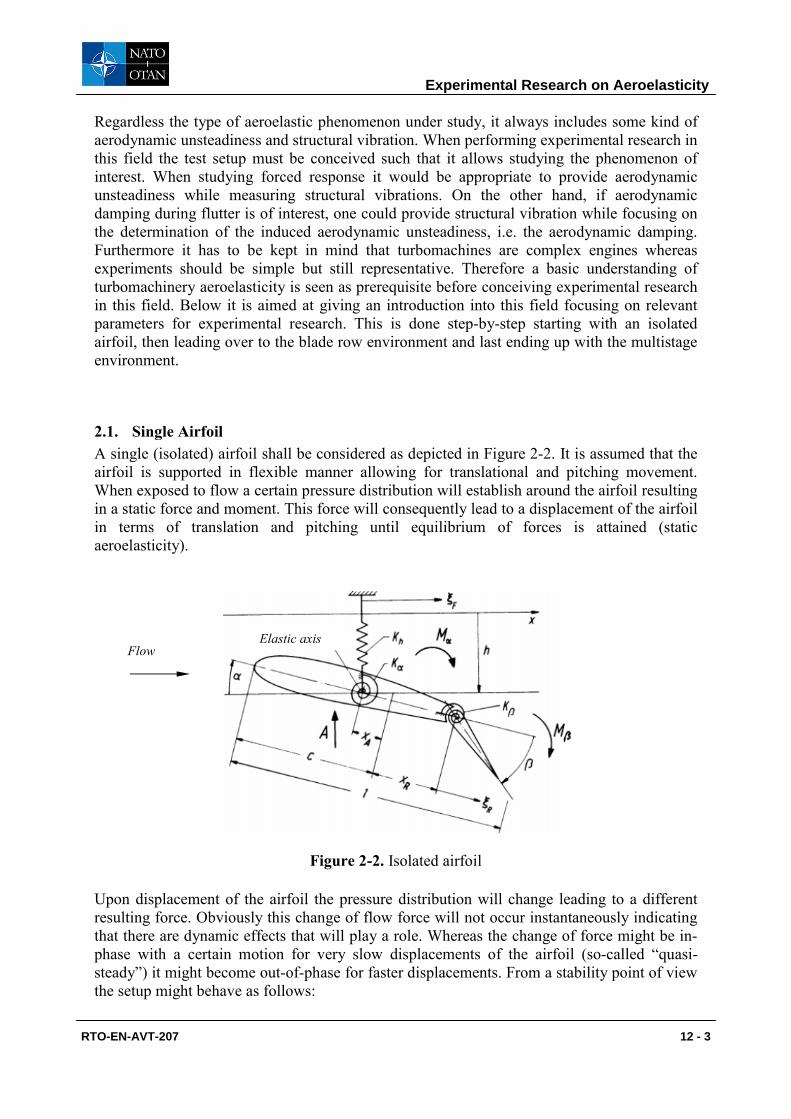
2.1. Single Airfoil A single (isolated) airfoil shall be considered as depicted in Figure 2-2. It is assumed that the airfoil is supported in flexible manner allowing for translational and pitching movement. When exposed to flow a certain pressure distribution will establish around the airfoil resulting in a static force and moment. This force will consequently lead to a displacement of the airfoil in terms of translation and pitching until equilibrium of forces is attained (static aeroelasticity).
Figure 2-2. Isolated airfoil
Upon displacement of the airfoil the pressure distribution will change leading to a different resulting force. Obviously this change of flow force will not occur instantaneously indicating that there are dynamic effects that will play a role. Whereas the change of force might be in-phase with a certain motion for very slow displacements of the airfoil (so-called “quasi-steady”) it might become out-of-phase for faster displacements. From a stability point of view the setup might behave as follows:
Flow Elastic axis
Experimental Research on Aeroelasticity
RTO-EN-AVT-207 12 - 3

i) The flow acts damped (i.e. stabilizing): this implies that an initial displacement of
the airfoil due to an external force would be damped out after a certain number of cycles (depending on the amount of damping provided by the structure). In each oscillation cycle the flow would extract energy from the structure. The flow would thus behave similar to structural damping.
ii) The flow augments a movement (i.e. destabilizing): this implies that the airfoil motion would escalate upon initial displacement due to an external force. In each oscillation cycle the flow would add energy to the structure.
It gets obvious that the phase of the aerodynamic force with respect to the airfoil motion determines stability. A mathematical treatment of this aspect is provided below. Another basic situation is the effect change on incoming flow on airfoil position. Such change might be of the following type:
i) Change from flow condition A to flow condition B. Upon changing the flow conditions a new pressure distribution will establish around the airfoil leading to a new equilibrium. Dynamic effects might occur depending on the speed of change.
ii) Rapid change from mean flow condition A to B and back to A. Also referred to as gust. This change will lead to an instantaneous force inducing a displacement of the airfoil that might then be subject to one of the two aforementioned cases (damped, unstable oscillation)
iii) Harmonic variation around a mean flow condition. This will lead to a harmonic force on the airfoil then behaving as a forced harmonic oscillator.
With respect to dynamic behavior of the flow it has been recognized in early years of airplane aeroelasticity research that a ratio of airfoil weight to the mass of surrounding fluid plays an important role. This ratio, referred to as mass ratio, is given by
20
4c
mπρ
μ = , Eq. 2-1
where m is the mass per unit blade span, 0ρ the air density and c the blade chord. As the mass ratio decreases flutter susceptibility increases. In turbomachines the mass ratio attains comparatively large values and thus does not gain the same importance. Meldahl (1946) has found that flutter in turbomachine blade rows occurs above certain flow velocities and that it is rather the ratio of flow velocity, blade chord and oscillation frequency that dominates flutter stability. The ratio is known as reduced frequency and relates the time of flight for a fluid particle needed to travel across blade chord to the oscillation period as is
ufc
Ttk π2
== , Eq. 2-2
Experimental Research on Aeroelasticity
12 - 4 RTO-EN-AVT-207

where f is the oscillation frequency, c the blade chord and u the flow velocity. Another though equivalent interpretation of the reduced frequency is that it relates to the blade chord to the wavelength drawn out by a sinusoidal oscillation as given by
λck = , where
fuuπω
λ2
== Eq. 2-3
Small values of reduced frequency indicate that the time of flight is short compared to the oscillation period, in other words that the flow is able to settle to changed conditions and thus has a quasi-steady character. For each setup a value of critical reduced frequency can be found below which flutter can occur. For a certain oscillation frequency this indicates that the value of critical reduced frequency is approached as flow velocity increases. For turbomachine blades critical reduced frequencies have been reported in the range between 0.1 and 1.0. A graphical interpretation of mass ratio and reduced frequency is included in Figure 2-3.
0 20 40 60 80 100 120 140 160 180 200
20
10
0
10
20
30
Mass ratio Reduced frequency
Figure 2-3. Graphical interpretation of mass ratio and reduced frequency
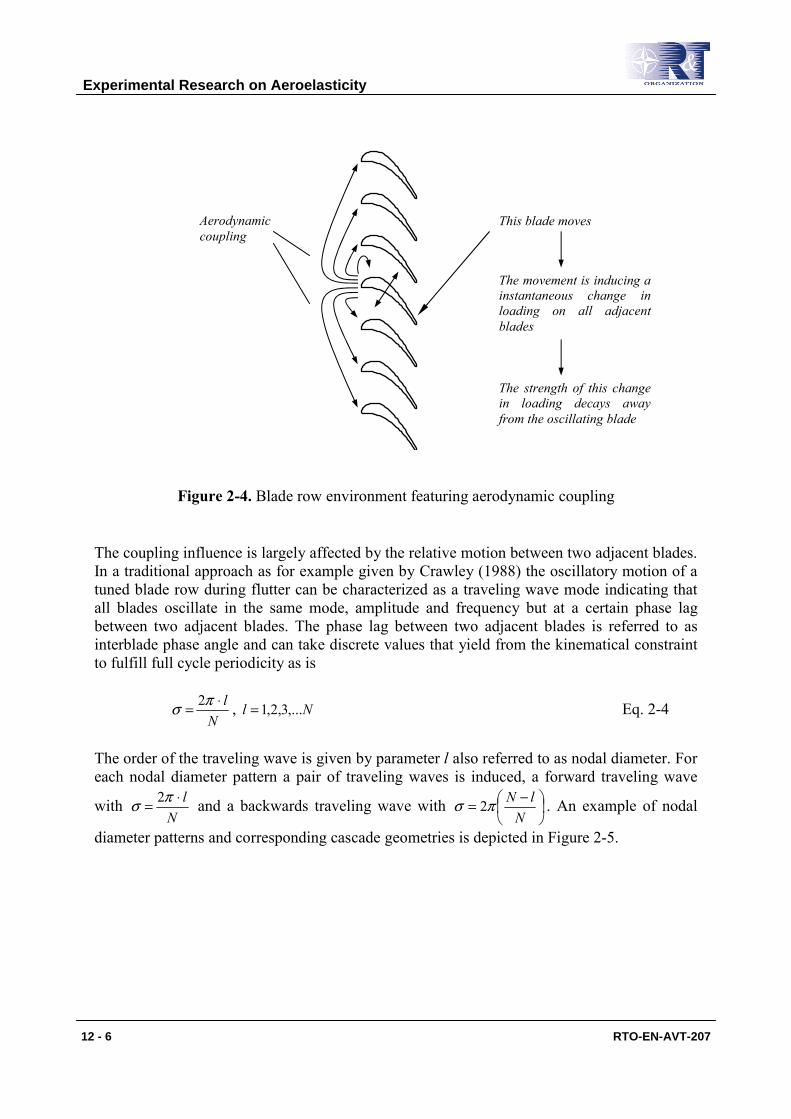
2.2. Blade Row In turbomachines blades are arranged in blade rows. Although they behave similarly as isolated airfoils (blades) from an aeroelastic point of view, there is a major difference, namely the mutual influence of individual blades as depicted in Figure 2-4. As one blade moves it is not only affecting the flow in its direct vicinity and by this the pressure distribution on itself but also inducing a response on its direct neighbors. This phenomenon is referred to as aerodynamic coupling. In one of the early studies Bellenot and Lalive d‘Epinay (1950) have recognized that an arrangement of blades might become aeroelastically unstable although a comparable isolated blade would not flutter. Several efforts have been dedicated to the coupling phenomena with the aim to understand the effect of coupling on cascade aeroelastic stability. Triebstein (1976), Kirschner et al. (1976) and Carta and St.Hilaire (1980) can be cited as early studies addressing the coupling phenomena in blade rows. All investigations concluded that the aerodynamic response on the blades in an oscillating blade row is influenced to a large degree by coupling effects. Széchényi (1985) has indicated that the aptitude of a single blade to flutter was of the same importance as coupling effects in a cascade (blade row). In a systematic categorization of unsteady flow phenomena in turbomachines Greitzer et al. (1994) classify the phenomenon of flutter being one order of magnitude larger in extent than the blade pitch.
ρ0 m
c c
λ
Experimental Research on Aeroelasticity
RTO-EN-AVT-207 12 - 5
0 20 40 60
2
2
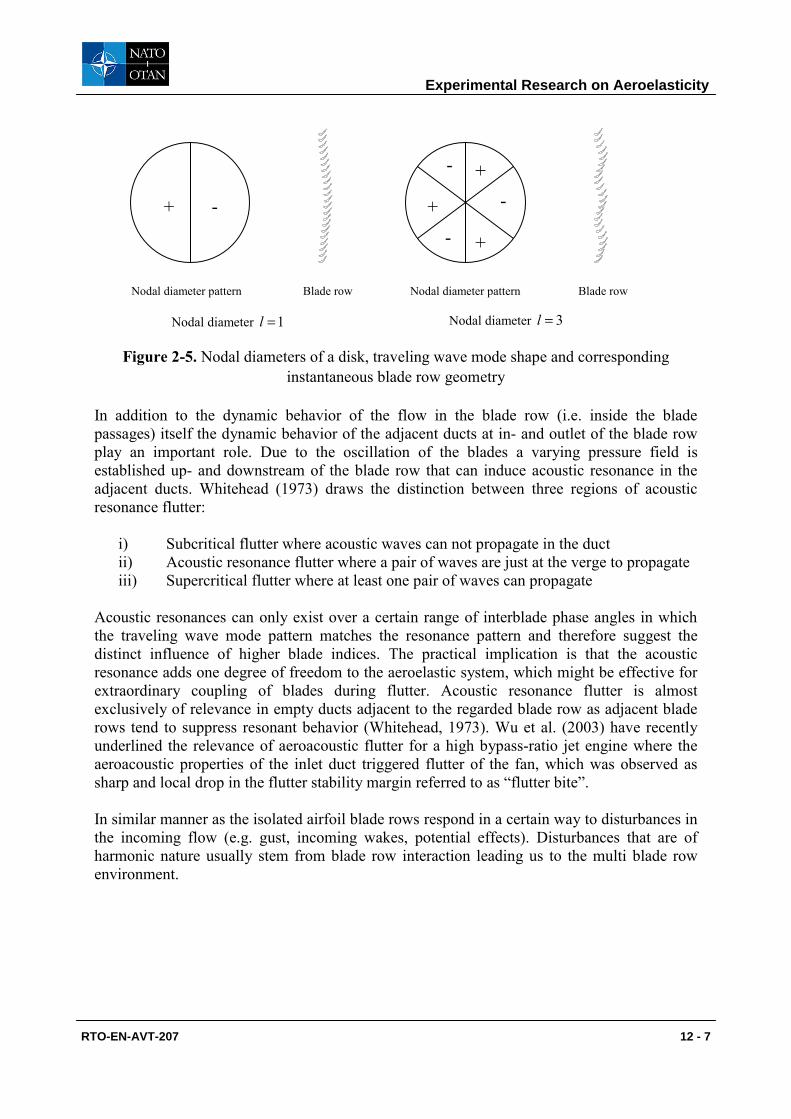
Figure 2-4. Blade row environment featuring aerodynamic coupling The coupling influence is largely affected by the relative motion between two adjacent blades. In a traditional approach as for example given by Crawley (1988) the oscillatory motion of a tuned blade row during flutter can be characterized as a traveling wave mode indicating that all blades oscillate in the same mode, amplitude and frequency but at a certain phase lag between two adjacent blades. The phase lag between two adjacent blades is referred to as interblade phase angle and can take discrete values that yield from the kinematical constraint to fulfill full cycle periodicity as is
Nl⋅= πσ 2 , Nl ,...3,2,1= Eq. 2-4
The order of the traveling wave is given by parameter l also referred to as nodal diameter. For each nodal diameter pattern a pair of traveling waves is induced, a forward traveling wave
with N
l⋅= πσ 2 and a backwards traveling wave with ⎟⎠⎞
⎜⎝⎛ −=
NlNπσ 2 . An example of nodal
diameter patterns and corresponding cascade geometries is depicted in Figure 2-5.
This blade moves
The movement is inducing a instantaneous change in loading on all adjacent blades
The strength of this change in loading decays away from the oscillating blade
Aerodynamic coupling
Experimental Research on Aeroelasticity
12 - 6 RTO-EN-AVT-207
−100 0 100
−300
−200
−100
0
100
200
300
400
−100 0 100
−300
−200
−100
0
100
200
300
400
Nodal diameter pattern Blade row Nodal diameter pattern Blade row
Nodal diameter 1=l
Nodal diameter 3=l
Figure 2-5. Nodal diameters of a disk, traveling wave mode shape and corresponding
instantaneous blade row geometry In addition to the dynamic behavior of the flow in the blade row (i.e. inside the blade passages) itself the dynamic behavior of the adjacent ducts at in- and outlet of the blade row play an important role. Due to the oscillation of the blades a varying pressure field is established up- and downstream of the blade row that can induce acoustic resonance in the adjacent ducts. Whitehead (1973) draws the distinction between three regions of acoustic resonance flutter:
i) Subcritical flutter where acoustic waves can not propagate in the duct ii) Acoustic resonance flutter where a pair of waves are just at the verge to propagate iii) Supercritical flutter where at least one pair of waves can propagate
Acoustic resonances can only exist over a certain range of interblade phase angles in which the traveling wave mode pattern matches the resonance pattern and therefore suggest the distinct influence of higher blade indices. The practical implication is that the acoustic resonance adds one degree of freedom to the aeroelastic system, which might be effective for extraordinary coupling of blades during flutter. Acoustic resonance flutter is almost exclusively of relevance in empty ducts adjacent to the regarded blade row as adjacent blade rows tend to suppress resonant behavior (Whitehead, 1973). Wu et al. (2003) have recently underlined the relevance of aeroacoustic flutter for a high bypass-ratio jet engine where the aeroacoustic properties of the inlet duct triggered flutter of the fan, which was observed as sharp and local drop in the flutter stability margin referred to as “flutter bite”. In similar manner as the isolated airfoil blade rows respond in a certain way to disturbances in the incoming flow (e.g. gust, incoming wakes, potential effects). Disturbances that are of harmonic nature usually stem from blade row interaction leading us to the multi blade row environment.
+ - +
+
+ -
-
-
Experimental Research on Aeroelasticity
RTO-EN-AVT-207 12 - 7
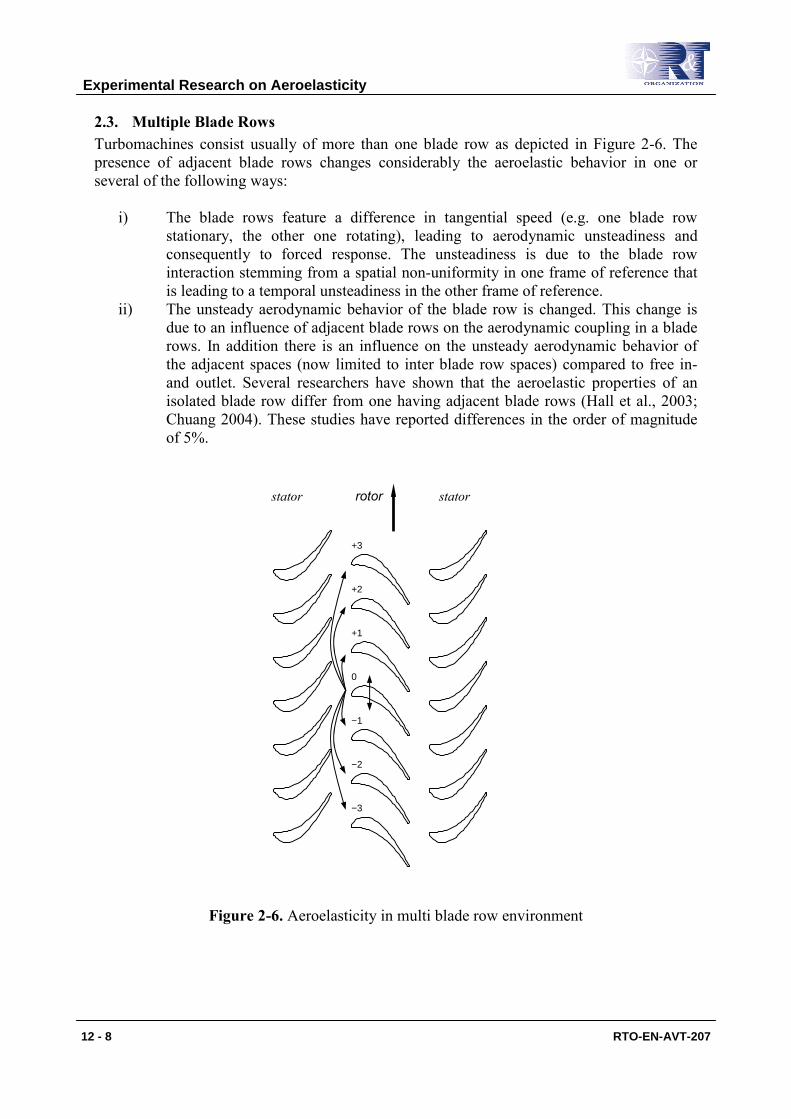
2.3. Multiple Blade Rows Turbomachines consist usually of more than one blade row as depicted in Figure 2-6. The presence of adjacent blade rows changes considerably the aeroelastic behavior in one or several of the following ways:
i) The blade rows feature a difference in tangential speed (e.g. one blade row stationary, the other one rotating), leading to aerodynamic unsteadiness and consequently to forced response. The unsteadiness is due to the blade row interaction stemming from a spatial non-uniformity in one frame of reference that is leading to a temporal unsteadiness in the other frame of reference.
ii) The unsteady aerodynamic behavior of the blade row is changed. This change is due to an influence of adjacent blade rows on the aerodynamic coupling in a blade rows. In addition there is an influence on the unsteady aerodynamic behavior of the adjacent spaces (now limited to inter blade row spaces) compared to free in- and outlet. Several researchers have shown that the aeroelastic properties of an isolated blade row differ from one having adjacent blade rows (Hall et al., 2003; Chuang 2004). These studies have reported differences in the order of magnitude of 5%.
−100 −50 0 50 100 150
−100
−50
0
50
100
+3
+2
+1
0
−1
−2
−3
Figure 2-6. Aeroelasticity in multi blade row environment
stator stator rotor
Experimental Research on Aeroelasticity
12 - 8 RTO-EN-AVT-207

Blade row interaction phenomena differ in terms of their underlying physical mechanisms and can be characterized as follows:
Potential interaction: interaction phenomenon of inviscid nature arising from variations in velocity potential or pressure fields (Verdon 1987; Whitehead, 1987). In case of subsonic flow potential distortions propagate both up- and downstream usually featuring a stronger downstream part (Dietz and Ainsworth, 1992). Potential interaction decays rapidly in axial direction at a length scale of about one axial chord indicating that this type of blade row interaction is of serious concern if the axial spacing between adjacent blade rows is smaller than one chord. In transonic and supersonic flow only downstream potential effects occur. Wake interaction: interaction phenomenon of viscous nature due to low momentum fluid downstream of blade trailing edges (Binder et al. 1985; Hodson, 1985). Upstream regions are not affected. The decay rate determined by the viscous mixing with the core fluid is much smaller than in case of potential effects leading to the presence of wake disturbances several axial chord lengths downstream of a blade rows. Secondary flow interaction: propagation of secondary flow features such as horseshoe vortices, tip leakage vortices and passage vortices to downstream blade rows. Similar to wake interaction, this phenomenon is of viscous nature. The overall flow unsteadiness can increase due to interaction between secondary flow structures and wake flow, which then impinge together onto a downstream blade row.
Figure 2-7. Campbell diagram indicating the occurrence of synchronous vibrations (forced
response) and flutter; adapted from Fransson (1999) In order to recognize potential harmful blade row interaction phenomena a Campbell diagram is used as included in Figure 2-7. The diagram features excitation lines that are proportional to engine rotational speed. In addition the natural frequencies of the component being excited
Flutter occurrences
Synchronous vibrations
Experimental Research on Aeroelasticity
RTO-EN-AVT-207 12 - 9
are included. It is to be noted that these natural frequencies are also dependent on engine speed as components tend to show changed elastic behavior with increasing speed (centrifugal stiffening, spin softening). Often, only a few low order modes are considered as it is the case in the example diagram. Forced response occurrences (also referred to as synchronous vibrations) are occurring at crossings between excitation lines and natural frequencies. In addition to forced response phenomena, flutter phenomena can be identified as these do not occur at distinct frequency crossings as well as tend to extend over a wider range in operating speed.
3. Fundamental Concepts In order to give a numerical model of the various phenomena of aeroelasticity a complete equation of motion is set up featuring a right-hand term. This aeroelastic equation reflects the balance between structural and aerodynamic forces as is
[ ]{ } [ ]{ } [ ]{ } { })(tFXKXGXM ae=++ &&& , Eq. 3-1 where [ ]M denotes the modal mass matrix, [ ]G the modal damping matrix and [ ]K the modal stiffness matrix. }{X denotes the modal coordinate comprising the bending and torsion part. The unsteady modal forcing by the fluid flow is included on the right-hand side containing the following elements
)()()( tFtFtF edisturbancdampingae += Eq. 3-2
dampingF represents the aerodynamic damping forces that result from the motion of the airfoil
in the fluid. The forces due to upstream and downstream disturbances are contained in edisturbancF . It is important to note that in cases where the structural damping is
inhomogeneous and not necessarily proportional to the temporal derivative of the modal coordinate the structural damping part [ ] }{XG & is moved to the right-hand side of Eq. 3-1 (Crawley, 1988). When focusing on aerodynamic damping the disturbance contribution included on the right hand side is set to zero simplifying the aerodynamic forces to )()( tFtF dampingae = . As the damping part is a function of the movement of the airfoil it is commonly moved to the left-hand side. A common way to solve the aeroelastic equation is to introduce a model coordinate system
{ } [ ]{ } tieQtX ⋅= ωϕ)( , Eq. 3-3 where ω denotes the frequency, Q the modal displacement and ϕ the mode shape. Eq. 3-1 can be reformulated to yield the following modal equation
Experimental Research on Aeroelasticity
12 - 10 RTO-EN-AVT-207
[ ] [ ] [ ] [ ] [ ] { } 0*2 =⎭⎬⎫
⎩⎨⎧ −++− QAKGiM
Tmmm ϕωω Eq. 3-4
[ ]A denotes therein a matrix containing the modal unsteady aerodynamic forces. Eq. 3-4 represents a complex eigenvalue problem the solution of which, i.e. the eigenvalues, is describing the stability of the system. In turbomachines the structural terms are comparatively large in comparison to the aerodynamic damping term due to high mass ratio. The practical implication of this is that the structural and the aerodynamic part can be treated decoupled, which greatly simplifies the aeroelastic problem; the structural eigenmodes are in such approach determined assuming no-flow conditions (i.e. vacuum), while the character of the aerodynamic contribution with regard to stability is yielding from a purely unsteady aerodynamic analysis as lined out below.
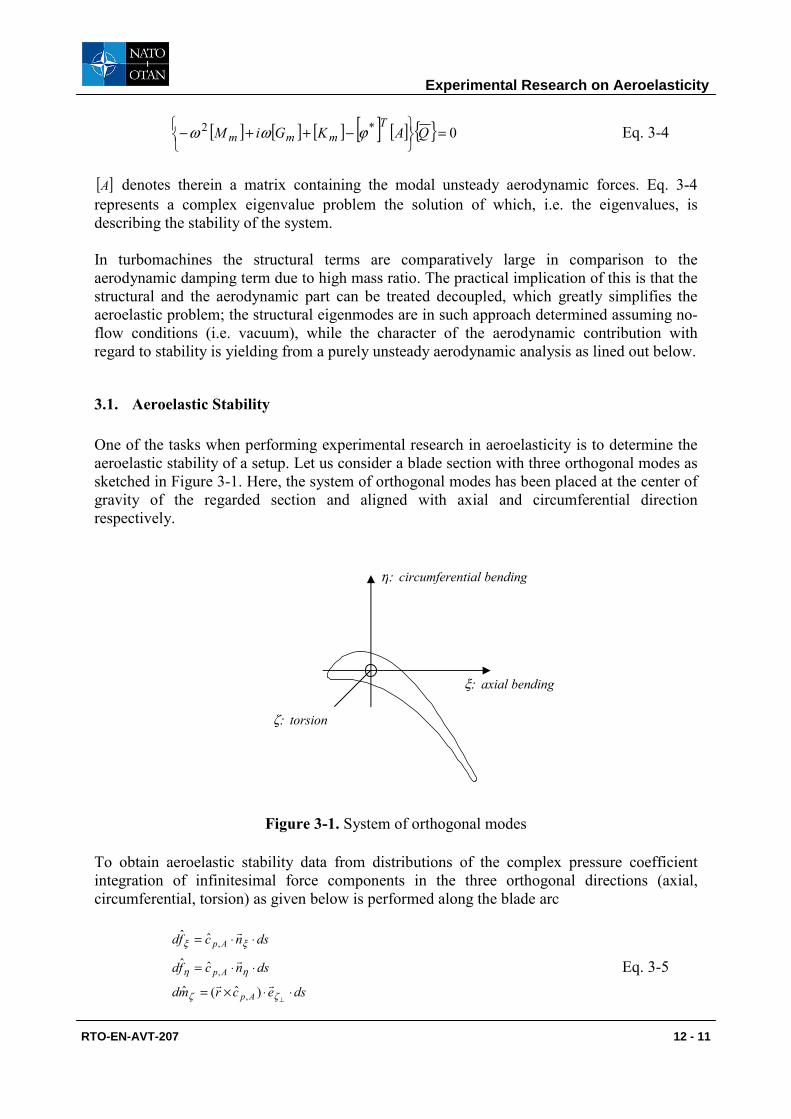
3.1. Aeroelastic Stability One of the tasks when performing experimental research in aeroelasticity is to determine the aeroelastic stability of a setup. Let us consider a blade section with three orthogonal modes as sketched in Figure 3-1. Here, the system of orthogonal modes has been placed at the center of gravity of the regarded section and aligned with axial and circumferential direction respectively.
−30
−20
−10
0
10
20
Figure 3-1. System of orthogonal modes
To obtain aeroelastic stability data from distributions of the complex pressure coefficient integration of infinitesimal force components in the three orthogonal directions (axial, circumferential, torsion) as given below is performed along the blade arc
dsncfd Ap ⋅⋅= ξξr
,ˆˆ
dsncfd Ap ⋅⋅= ηηr
,ˆˆ Eq. 3-5 dsecrmd Ap ⋅⋅×=
⊥ζζrr
)ˆ(ˆ ,
η: circumferential bending
ξ: axial bending
ζ: torsion
Experimental Research on Aeroelasticity
RTO-EN-AVT-207 12 - 11

Considering all investigated orthogonal modes the integration yields a force matrix
[ ]⎥⎥⎥
⎦
⎤
⎢⎢⎢
⎣
⎡
=
ζζζηζξ
ηζηηηξ
ξζξηξξ
fffffffff
F̂ , Eq. 3-6
wherein the first index refers to the mode causing the force and the second to the direction in which the force is acting. The diagonal terms thus represent forces done by the unsteady response on the mode causing the response. The off-diagonal terms reflect forces done by the response on the other modes. For an arbitrary mode the aeroelastic force is a combination of the orthogonal forces given by
{ } [ ]{ }iT
ii hFhF ˆˆˆˆ = , Eq. 3-7 where { } { }ζηξ ahhhi ˆ,ˆ,ˆˆ = denotes a mode shape vector. The aeroelastic stability is yielding from integrating the force over one oscillation cycle as
∫ ⋅=T
tiiicycle dtehFW ωˆˆ Eq. 3-8
The definition of the work is such that a positive value indicates energy transfer from the fluid to the structure, i.e. a situation of instability. After solving Eq. 3-8 it is apparent that only the imaginary part enters the work per cycle. In accordance with Verdon (1987) a stability parameter Ξ is used, which represents the normalized negative work per cycle given by
)Im( ii
i fhW −=−=Ξ
π Eq. 3-9
Figure 3-2. Torsion mode representation of rigid-body modes
Fictional center of torsion mode A
Mode A
Fictional center of torsion mode B
Mode B
Experimental Research on Aeroelasticity
12 - 12 RTO-EN-AVT-207
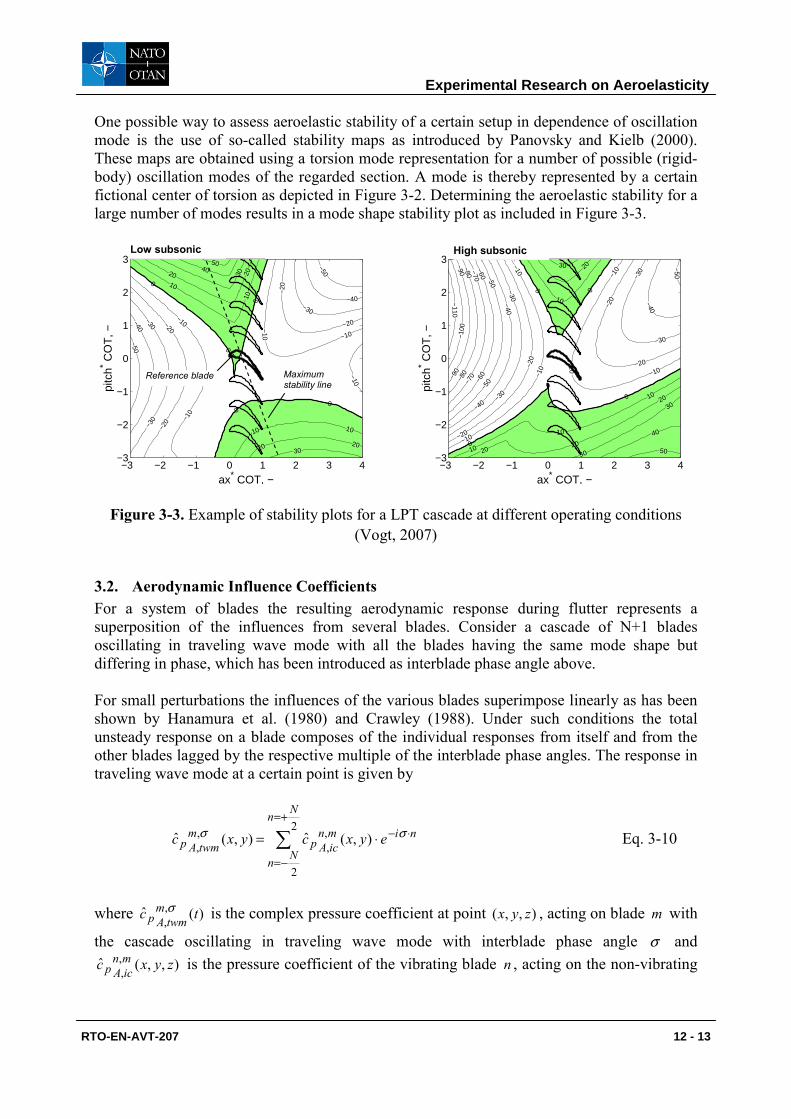
One possible way to assess aeroelastic stability of a certain setup in dependence of oscillation mode is the use of so-called stability maps as introduced by Panovsky and Kielb (2000). These maps are obtained using a torsion mode representation for a number of possible (rigid-body) oscillation modes of the regarded section. A mode is thereby represented by a certain fictional center of torsion as depicted in Figure 3-2. Determining the aeroelastic stability for a large number of modes results in a mode shape stability plot as included in Figure 3-3.
−3 −2 −1 0 1 2 3 4−3
−2
−1
0
1
2
3
ax* COT, −
pitc
h* CO
T, −
−50
−50
−40
−40
−30
−30
−30
−20
−20
−20
−20
−10
−10
−10 −10
−10
00
0
0
0 10
10
10 10
20 20
20 20
30
30
4050
−3 −2 −1 0 1 2 3 4−3
−2
−1
0
1
2
3
ax* COT, −
pitc
h* CO
T, −
−110
−100
−90
−90
−80
−80
−70
−70
−60
−60
−50
−50
−50
−40
−40
−40
−30
−30
−30
−30
−20
−20
−20
−20
−10
−10
−10
−10
−10
−10
0 0
0
0
0
10
10
10
10
2020
20
2030
30
30
40
50
Figure 3-3. Example of stability plots for a LPT cascade at different operating conditions
(Vogt, 2007)
3.2. Aerodynamic Influence Coefficients For a system of blades the resulting aerodynamic response during flutter represents a superposition of the influences from several blades. Consider a cascade of N+1 blades oscillating in traveling wave mode with all the blades having the same mode shape but differing in phase, which has been introduced as interblade phase angle above. For small perturbations the influences of the various blades superimpose linearly as has been shown by Hanamura et al. (1980) and Crawley (1988). Under such conditions the total unsteady response on a blade composes of the individual responses from itself and from the other blades lagged by the respective multiple of the interblade phase angles. The response in traveling wave mode at a certain point is given by
∑+=
−=
⋅−⋅=2
2
,,
,, ),(ˆ),(ˆ
Nn
Nn
nimnicAp
mtwmAp eyxcyxc σσ Eq. 3-10
where )(ˆ ,
, tc mtwmApσ is the complex pressure coefficient at point ),,( zyx , acting on blade m with
the cascade oscillating in traveling wave mode with interblade phase angle σ and ),,(ˆ ,
, zyxc mnicAp is the pressure coefficient of the vibrating blade n , acting on the non-vibrating
Maximum stability line
Reference blade
Low subsonic High subsonic
Experimental Research on Aeroelasticity
RTO-EN-AVT-207 12 - 13
reference blade m at point ),,( zyx . The coefficients mnicApc ,,
ˆ are commonly referred to as local
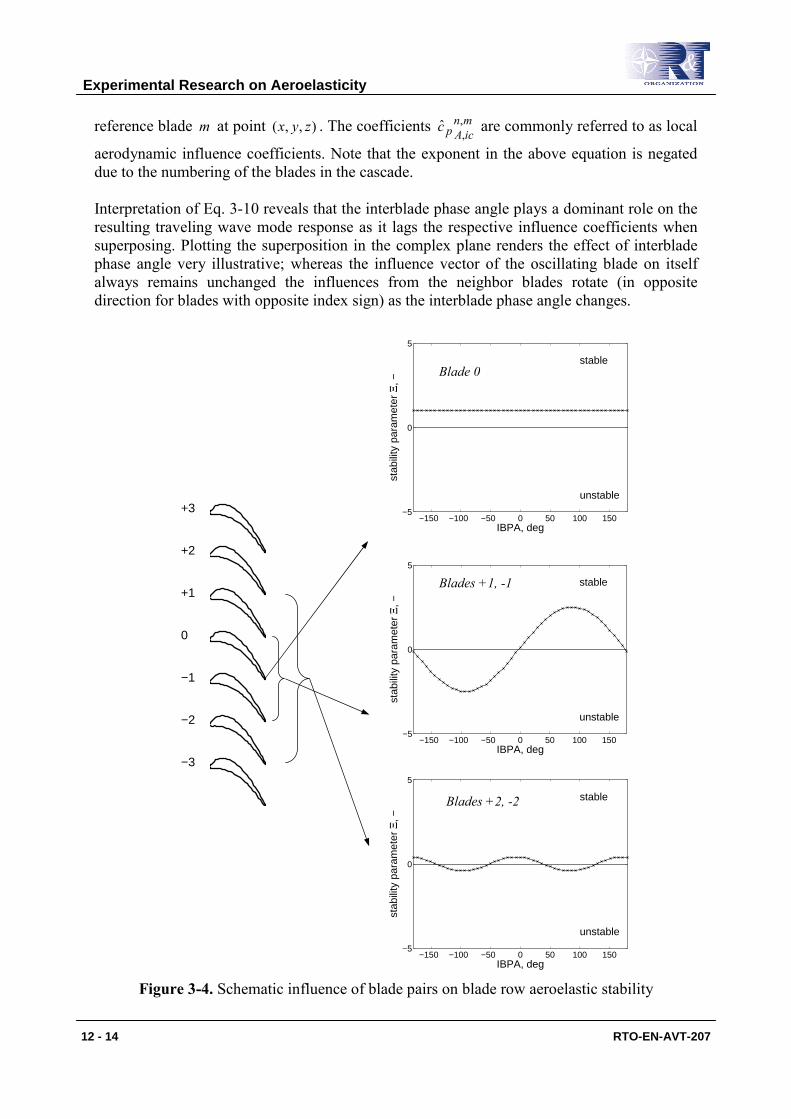
aerodynamic influence coefficients. Note that the exponent in the above equation is negated due to the numbering of the blades in the cascade. Interpretation of Eq. 3-10 reveals that the interblade phase angle plays a dominant role on the resulting traveling wave mode response as it lags the respective influence coefficients when superposing. Plotting the superposition in the complex plane renders the effect of interblade phase angle very illustrative; whereas the influence vector of the oscillating blade on itself always remains unchanged the influences from the neighbor blades rotate (in opposite direction for blades with opposite index sign) as the interblade phase angle changes.
−150 −100 −50 0 50 100 150−5
0
5
IBPA, deg
stab
ility
par
amet
er Ξ
, −
unstable
stable
−150 −100 −50 0 50 100 150−5
0
5
IBPA, deg
stab
ility
par
amet
er Ξ
, −
unstable
stable
0 20 40
−100
−50
0
50
100+3
+2
+1
0
−1
−2
−3
−150 −100 −50 0 50 100 150−5
0
5
IBPA, deg
stab
ility
par
amet
er Ξ
, −
unstable
stable
Figure 3-4. Schematic influence of blade pairs on blade row aeroelastic stability
Blade 0
Blades +1, -1
Blades +2, -2
Experimental Research on Aeroelasticity
12 - 14 RTO-EN-AVT-207
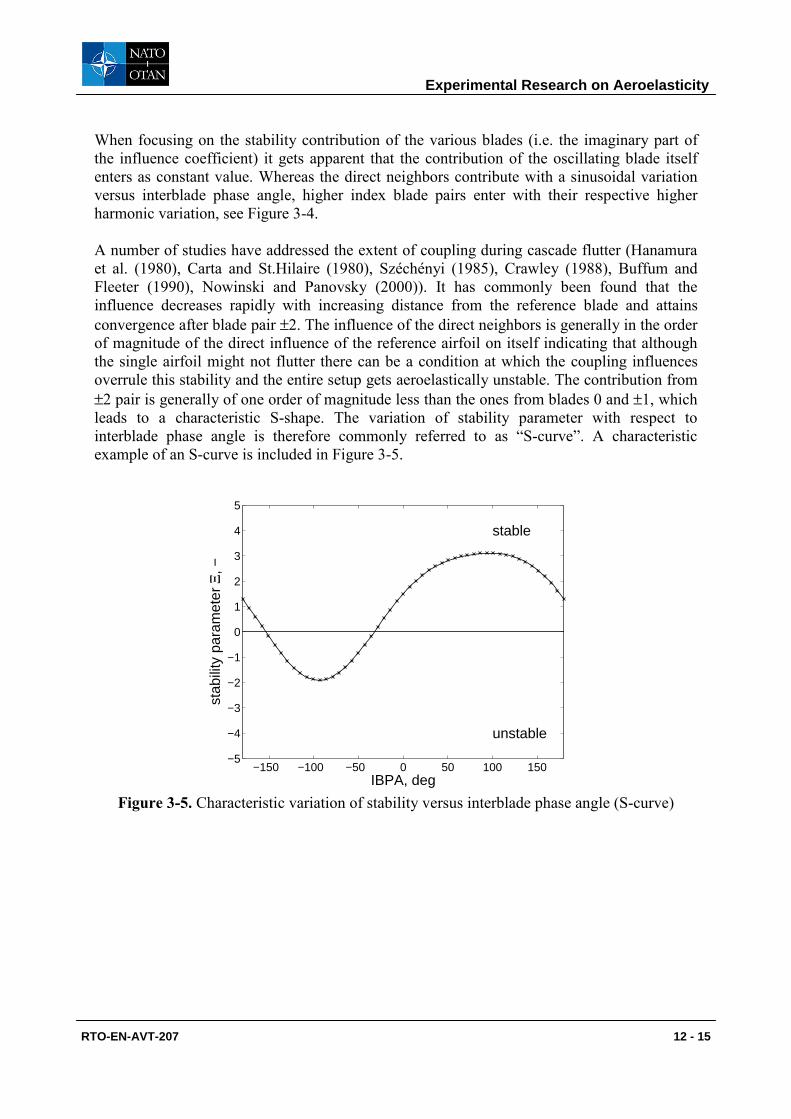
When focusing on the stability contribution of the various blades (i.e. the imaginary part of the influence coefficient) it gets apparent that the contribution of the oscillating blade itself enters as constant value. Whereas the direct neighbors contribute with a sinusoidal variation versus interblade phase angle, higher index blade pairs enter with their respective higher harmonic variation, see Figure 3-4. A number of studies have addressed the extent of coupling during cascade flutter (Hanamura et al. (1980), Carta and St.Hilaire (1980), Széchényi (1985), Crawley (1988), Buffum and Fleeter (1990), Nowinski and Panovsky (2000)). It has commonly been found that the influence decreases rapidly with increasing distance from the reference blade and attains convergence after blade pair ±2. The influence of the direct neighbors is generally in the order of magnitude of the direct influence of the reference airfoil on itself indicating that although the single airfoil might not flutter there can be a condition at which the coupling influences overrule this stability and the entire setup gets aeroelastically unstable. The contribution from ±2 pair is generally of one order of magnitude less than the ones from blades 0 and ±1, which leads to a characteristic S-shape. The variation of stability parameter with respect to interblade phase angle is therefore commonly referred to as “S-curve”. A characteristic example of an S-curve is included in Figure 3-5.
−150 −100 −50 0 50 100 150−5
−4
−3
−2
−1
0
1
2
3
4
5
IBPA, deg
stab
ility
par
amet
er Ξ
, −
unstable
stable
Figure 3-5. Characteristic variation of stability versus interblade phase angle (S-curve)
Experimental Research on Aeroelasticity
RTO-EN-AVT-207 12 - 15
4. Experimental Facilities In this section a treatment of possible experimental setups for the investigation of turbomachinery aeroelasticity is included. Examples of existing test facilities are included to illustrate further various testing setups.
4.1. Facilities for Investigating Aerodynamic Forcing When studying aerodynamic forcing, a setup is used in which a test object is operated at representative conditions while a source of excitation is provided. Possible experimental setups can be organized into the following types:
Steady test object: the test object is not moving and an unsteady excitation is provided. Setups can range from very generic ones (e.g. a bump in a straight wind tunnel featuring some sort of flow excitation) to more engine representative ones (e.g. a cascade of blades featuring an inlet wake generator) Moving test object: this category includes more engine representative setups such as multi-stage turbomachinery facilities. As in the real case the aerodynamic forcing is introduced from adjacent blade rows. The test object itself (i.e. the rotor) is moving (rotating). In order to keep the complexity of the setup low single stage or 1 ½ stage setups are often used. Apart from real engine tests multi-stage facilities are used rather rarely.
Further, experimental setups for studying aerodynamic forcing can be grouped depending on the objective of the investigation and thus the physical being measured.
Focus put on aerodynamic loads: when focusing on the aerodynamic forcing directly rigid test objects can be chosen while measuring the pressure at location of interest. Typical examples include cascade comprising rigid blades that are instrumented with fast-response pressure transducers and subject to aerodynamic forcing from an upstream wake generator. Another typical setup of this family would be rotating facilities in which the unsteady pressure is measured on rotor (and/or stator) blades. Focus put on vibrations: instead of measuring the cause of forcing the focus is rather put on the effect, i.e. the resulting vibration. Such facilities often feature test object supports with reduced mechanical stiffness such as to promote the effects being measured. A typical example would be an elastically supported airfoil in a wind tunnel being exposed to inflow gust. Another typical setup would be a rotating facility with flexible blade support (even flexible disk) such as to allow for structural vibrations. In many cases components with realistic support as well as test object stiffness are used.
Experimental facilities can further be distinguished into continuous working and intermittent operation. Compressor test setups are mostly of continuous working type as there is no compressed gas source needed. On the other hand turbine setups benefit largely from intermittent operation in terms of facility investments as well as operating costs. Intermittent
Experimental Research on Aeroelasticity
12 - 16 RTO-EN-AVT-207
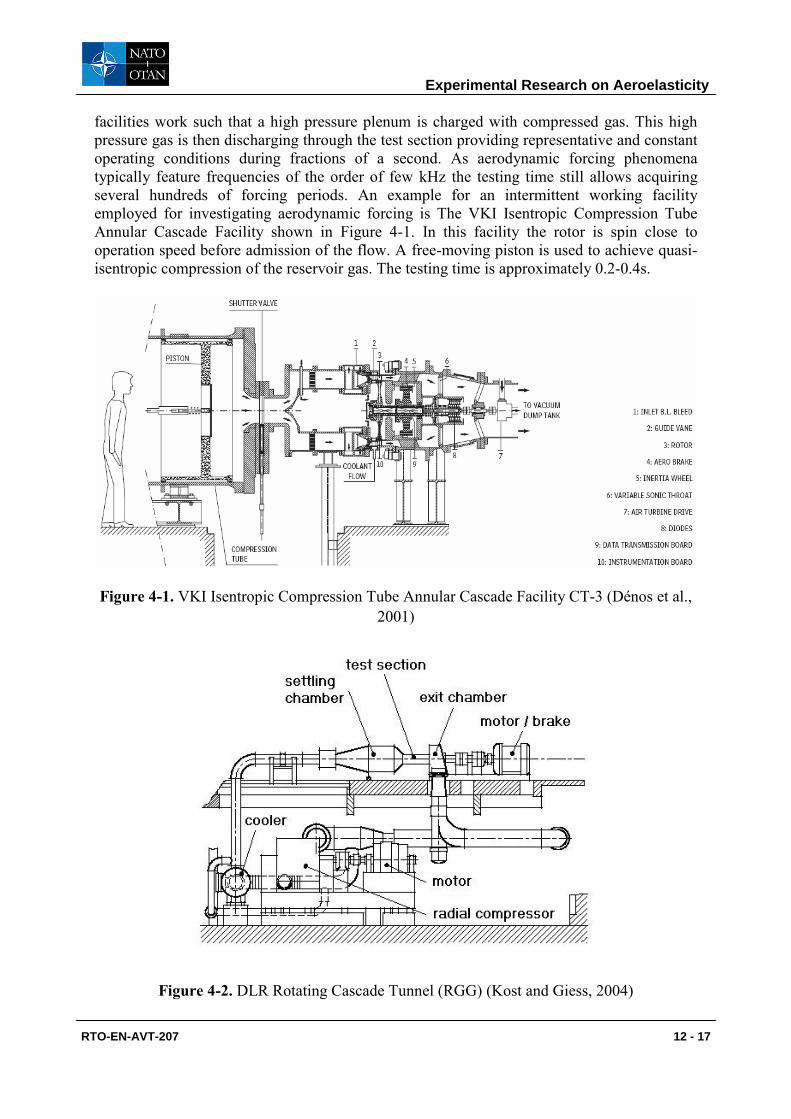
facilities work such that a high pressure plenum is charged with compressed gas. This high pressure gas is then discharging through the test section providing representative and constant operating conditions during fractions of a second. As aerodynamic forcing phenomena typically feature frequencies of the order of few kHz the testing time still allows acquiring several hundreds of forcing periods. An example for an intermittent working facility employed for investigating aerodynamic forcing is The VKI Isentropic Compression Tube Annular Cascade Facility shown in Figure 4-1. In this facility the rotor is spin close to operation speed before admission of the flow. A free-moving piston is used to achieve quasi-isentropic compression of the reservoir gas. The testing time is approximately 0.2-0.4s.
Figure 4-1. VKI Isentropic Compression Tube Annular Cascade Facility CT-3 (Dénos et al., 2001)
Figure 4-2. DLR Rotating Cascade Tunnel (RGG) (Kost and Giess, 2004)
Experimental Research on Aeroelasticity
RTO-EN-AVT-207 12 - 17
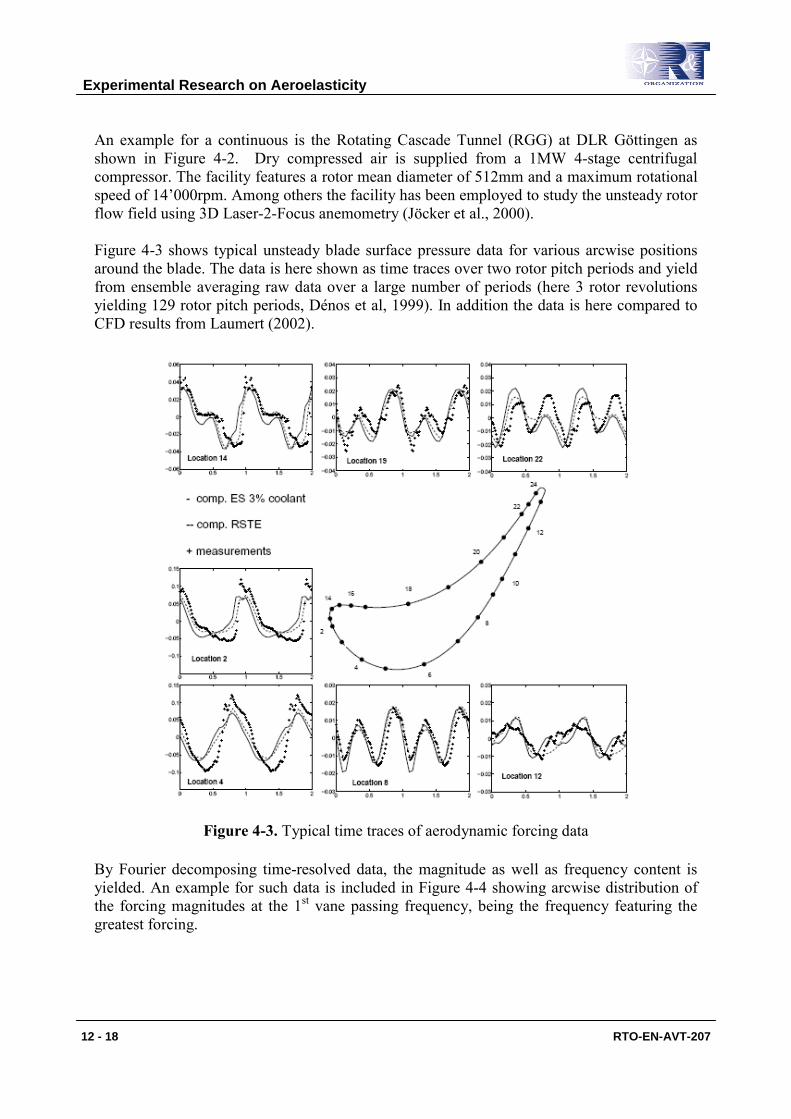
An example for a continuous is the Rotating Cascade Tunnel (RGG) at DLR Göttingen as shown in Figure 4-2. Dry compressed air is supplied from a 1MW 4-stage centrifugal compressor. The facility features a rotor mean diameter of 512mm and a maximum rotational speed of 14’000rpm. Among others the facility has been employed to study the unsteady rotor flow field using 3D Laser-2-Focus anemometry (Jöcker et al., 2000). Figure 4-3 shows typical unsteady blade surface pressure data for various arcwise positions around the blade. The data is here shown as time traces over two rotor pitch periods and yield from ensemble averaging raw data over a large number of periods (here 3 rotor revolutions yielding 129 rotor pitch periods, Dénos et al, 1999). In addition the data is here compared to CFD results from Laumert (2002).
Figure 4-3. Typical time traces of aerodynamic forcing data
By Fourier decomposing time-resolved data, the magnitude as well as frequency content is yielded. An example for such data is included in Figure 4-4 showing arcwise distribution of the forcing magnitudes at the 1st vane passing frequency, being the frequency featuring the greatest forcing.
Experimental Research on Aeroelasticity
12 - 18 RTO-EN-AVT-207

Figure 4-4. Arcwise distribution of forcing magnitude at 1st vane passing frequency (Laumert, 2002)
4.2. Facilities for Investigating Aerodynamic Damping The experimental investigation of aerodynamic damping requires a setup in which a certain motion of the test object is made possible (free oscillation setup) or introduced in controlled manner (controlled oscillation setup). Tying up with this consideration possible experimental setups can be organized into the following types:
Free oscillation setup: the test object is supported in a way that allows free movement in one or several modes. The modes can be of rigid-body type or of real deforming type. An example would be flexible supports of blades in cascades allowing a bending motion. By varying operating condition self-induced oscillations of the test object can be provoked. Alternatively the test object can be released from an initial displacement such as to monitor the further development of displacement coordinate (decaying, escalating). Real engine flutter tests fall also into the category of free vibration setups. Controlled oscillation setup: controlled oscillation of one or several blades is induced in a specific manner. The modes can be of rigid-body or of real deforming type. To induce controlled oscillation actuators of mechanical, electromagnetic, hydraulic or piezoelectric type are used. The latter is preferably being used for deforming test objects. Typically cascades with one or several blades oscillated in controlled mode are used for investigating aerodynamic damping.
Controlled oscillation testing is widely used in aeroelasticity research on simplified turbomachine components such as cascades (i.e. isolated blade rows). Following the influence coefficient approach as elucidated above the following approaches of controlled oscillation testing can be employed:
Experimental Research on Aeroelasticity
RTO-EN-AVT-207 12 - 19

Traveling wave mode approach: all blades in the cascade are oscillated at identical mode shape and at various interblade phase angles. The response is measured on one blade. Influence coefficient approach: only one blade is oscillated and the response is measured on all the blades in cascade. The data are superimposed at different interblade phase angles according to the theory presented below such as to yield damping data in the traveling wave mode domain.
These two testing approaches have their advantages and disadvantages. Whereas a full annular cascade with all the blades oscillating represents the condition in turbomachines most accurately the complexity of the experimental apparatus is rather high. On the other hand a linear cascade with only one blade oscillating presents a simple but attractive alternative. The results obtained with respect to the determination of aerodynamic damping are nevertheless highly representative as long as the validity of linear superposition theory (small disturbances) is ensured. One of the shortcomings of blade rows with limited circumferential extent are the different dynamic properties of the adjacent ducts thus not being able to reproduce representative acoustic resonances. In most cases this shortcoming does not harm the relevance of the experiment. An example for a free vibration setup is the study performed by Kirschner et al. (1976), see Figure 4-5. Friction in the blade suspension has been minimized with the aim to cancel out the damping contribution in the aeroelastic balance. The tests performed aimed at acquiring stability characteristics of damping and frequency versus reduced flow velocity (inverse of reduced frequency) for the cascade oscillating in bending mode, torsion modes with different center of torsion as well as combined modes. The cited investigation is one of the first ones addressing the importance of blade mode shape on the aerodynamic damping.
Test section
Blade support
Figure 4-5. Free oscillation test setup for variable mode testing; Kirschner et al. (1976)
An example for controlled oscillation testing in the traveling wave mode domain is the EPFL annular cascade facility described by Bölcs and Fransson (1986), see Fig. The cascade is operated in continuous mode and features elastically supported blades that can be made oscillating individually by means of electromagnetic actuators. The facility is one of few in
Experimental Research on Aeroelasticity
12 - 20 RTO-EN-AVT-207
which conclusive studies have been performed with respect to linear superposition theory underlying the aerodynamic influence coefficient approach.
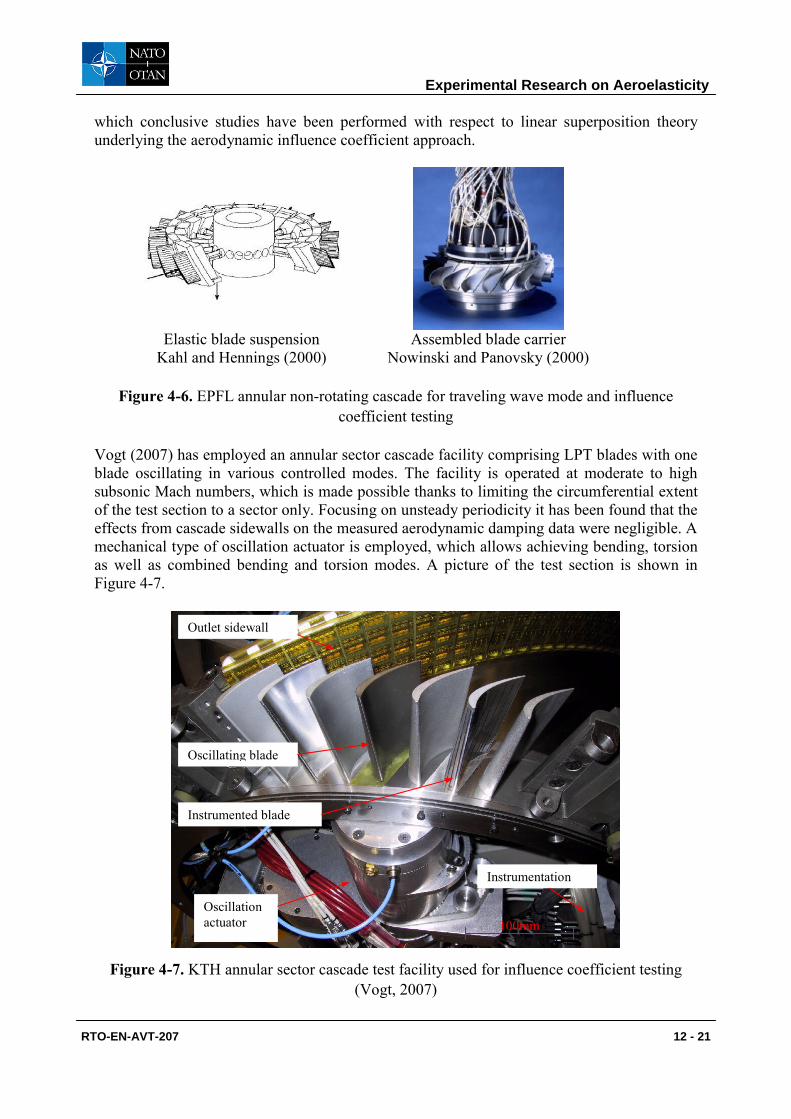
Elastic blade suspension Kahl and Hennings (2000)
Assembled blade carrier Nowinski and Panovsky (2000)
Figure 4-6. EPFL annular non-rotating cascade for traveling wave mode and influence
coefficient testing Vogt (2007) has employed an annular sector cascade facility comprising LPT blades with one blade oscillating in various controlled modes. The facility is operated at moderate to high subsonic Mach numbers, which is made possible thanks to limiting the circumferential extent of the test section to a sector only. Focusing on unsteady periodicity it has been found that the effects from cascade sidewalls on the measured aerodynamic damping data were negligible. A mechanical type of oscillation actuator is employed, which allows achieving bending, torsion as well as combined bending and torsion modes. A picture of the test section is shown in Figure 4-7.
Figure 4-7. KTH annular sector cascade test facility used for influence coefficient testing (Vogt, 2007)
100mm
Outlet sidewall
Oscillation actuator
Oscillating blade
Instrumentation
Instrumented blade
Experimental Research on Aeroelasticity
RTO-EN-AVT-207 12 - 21

The use of low-speed large-scale wind tunnels is popular in aerodynamic damping testing as it greatly reduces the complexity of the setup. The important parameters being conserved when moving from real engine situation to low speed testing are here the reduced frequency and preferably the Reynolds number. As the power needed to oscillate a blade in controlled manner increases with the square of the oscillation frequency, blade oscillation mechanisms for low speed wind tunnels do not need to be designed for high power densities. Furthermore as the frequencies of the pressure signal being measured usually is of the order of magnitude of 10…50Hz pressure measurement techniques featuring moderate frequency resolution might be used. Bell and He (2000) have used a linear low-speed cascade with a single blade pitch extent to study the aerodynamic damping on a turbine blade in bending mode. The maximum oscillation frequency was 21Hz yielding a reduced frequency of k=0.75 at a flow speed of M=0.1. One of the shortcomings of low-speed testing setups is the inability to achieve compressible flow conditions. Turbomachinery aeroelasticity however often occurs in flow regimes with considerable compressibility effects such as in low-pressure compression systems (fans, LPC) and low-pressure turbine components. In contrary to the aforementioned low-speed test, the investigations performed by Vogt (2005) require an oscillation frequency of 425Hz such as to achieve a reduced frequency of k=0.5 at a flow speed of M=0.8. The complexity of the setup is thereby much larger than the one used by Bell and He (2000). Aerodynamically induced controlled flutter testing can rather be seen as exception but shall shortly be revised here for the sake of completeness. Crawley (1981) has presented a flutter testing method in which the forcing is induced by aerodynamic disturbance forces rather than a controlled motion. Tests were performed in the MIT blowdown facility on a transonic compressor rotor with flexible blades. The disturbance was introduced as steady in the absolute frame of reference by upstream injectors the pattern of which resulted in excitation of a certain interblade phase angle. The facility and the injection device are shown in Figure 4-8. After speeding-up of the rotor gas was injected upstream of the rotor and then abruptly shut down to have the rotor oscillating freely. The structural response was measured by means of piezo-electric transducers and strain gauges.
Test Section Injection device
Figure 4-8. Controlled flutter testing by aerodynamic excitation; Crawley (1981) Blade oscillation systems used in controlled oscillation testing vary widely in type and achievable oscillation parameters. The purpose of the systems is to induce a controlled oscillation of one or several airfoils at well-defined oscillation parameters as are oscillation
Experimental Research on Aeroelasticity
12 - 22 RTO-EN-AVT-207
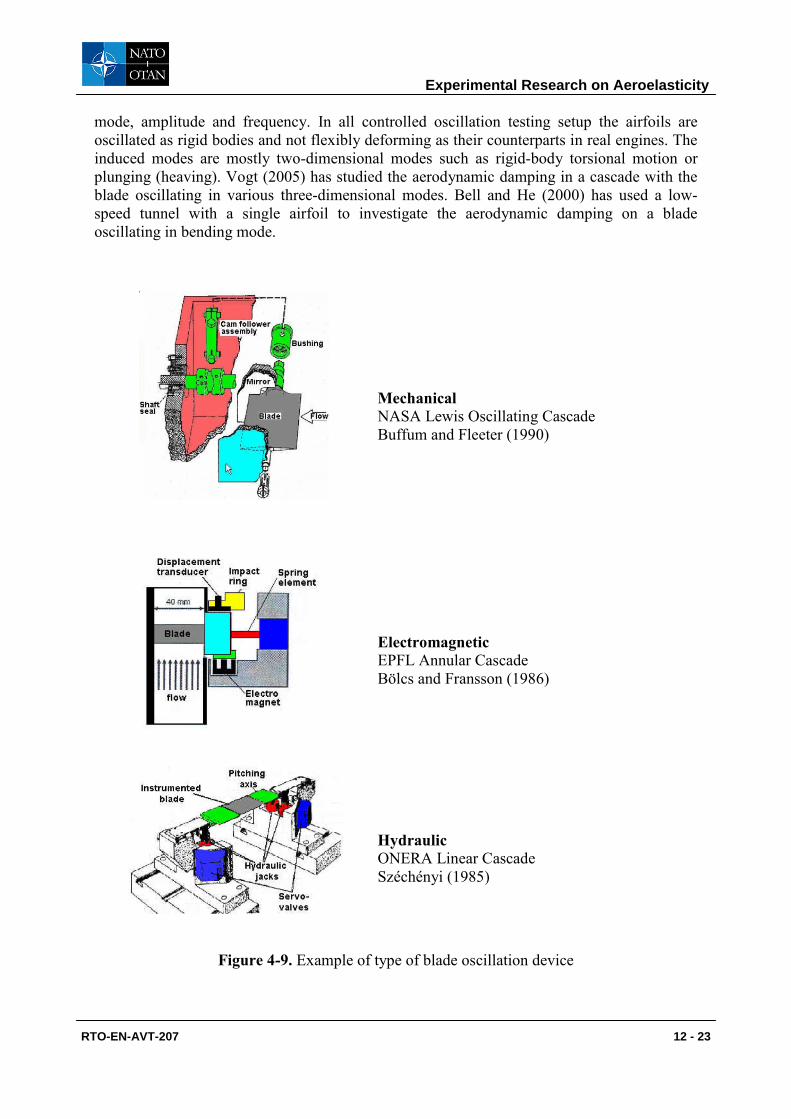
mode, amplitude and frequency. In all controlled oscillation testing setup the airfoils are oscillated as rigid bodies and not flexibly deforming as their counterparts in real engines. The induced modes are mostly two-dimensional modes such as rigid-body torsional motion or plunging (heaving). Vogt (2005) has studied the aerodynamic damping in a cascade with the blade oscillating in various three-dimensional modes. Bell and He (2000) has used a low-speed tunnel with a single airfoil to investigate the aerodynamic damping on a blade oscillating in bending mode.
Mechanical NASA Lewis Oscillating Cascade Buffum and Fleeter (1990)
Electromagnetic EPFL Annular Cascade Bölcs and Fransson (1986)
Hydraulic ONERA Linear Cascade Széchényi (1985)
Figure 4-9. Example of type of blade oscillation device
Experimental Research on Aeroelasticity
RTO-EN-AVT-207 12 - 23
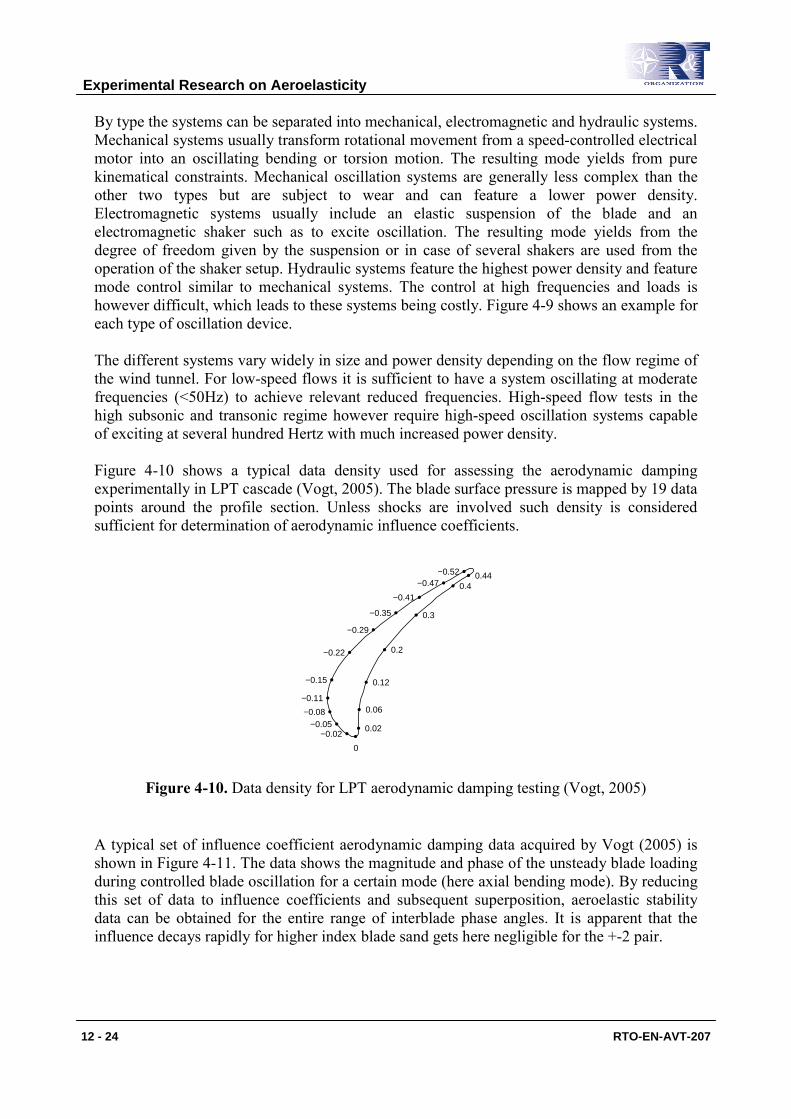
By type the systems can be separated into mechanical, electromagnetic and hydraulic systems. Mechanical systems usually transform rotational movement from a speed-controlled electrical motor into an oscillating bending or torsion motion. The resulting mode yields from pure kinematical constraints. Mechanical oscillation systems are generally less complex than the other two types but are subject to wear and can feature a lower power density. Electromagnetic systems usually include an elastic suspension of the blade and an electromagnetic shaker such as to excite oscillation. The resulting mode yields from the degree of freedom given by the suspension or in case of several shakers are used from the operation of the shaker setup. Hydraulic systems feature the highest power density and feature mode control similar to mechanical systems. The control at high frequencies and loads is however difficult, which leads to these systems being costly. Figure 4-9 shows an example for each type of oscillation device. The different systems vary widely in size and power density depending on the flow regime of the wind tunnel. For low-speed flows it is sufficient to have a system oscillating at moderate frequencies (<50Hz) to achieve relevant reduced frequencies. High-speed flow tests in the high subsonic and transonic regime however require high-speed oscillation systems capable of exciting at several hundred Hertz with much increased power density. Figure 4-10 shows a typical data density used for assessing the aerodynamic damping experimentally in LPT cascade (Vogt, 2005). The blade surface pressure is mapped by 19 data points around the profile section. Unless shocks are involved such density is considered sufficient for determination of aerodynamic influence coefficients.
−0.02 −0.015 −0.01 −0.005 0 0.005 0.01 0.015 0.02 0.025 0.030
0.005
0.01
0.015
0.02
0.025
0.03
0.035
0.04
0.440.4
0.3
0.2
0.12
0.06
0.02
0
−0.02−0.05
−0.08
−0.11
−0.15
−0.22
−0.29
−0.35
−0.41
−0.47−0.52
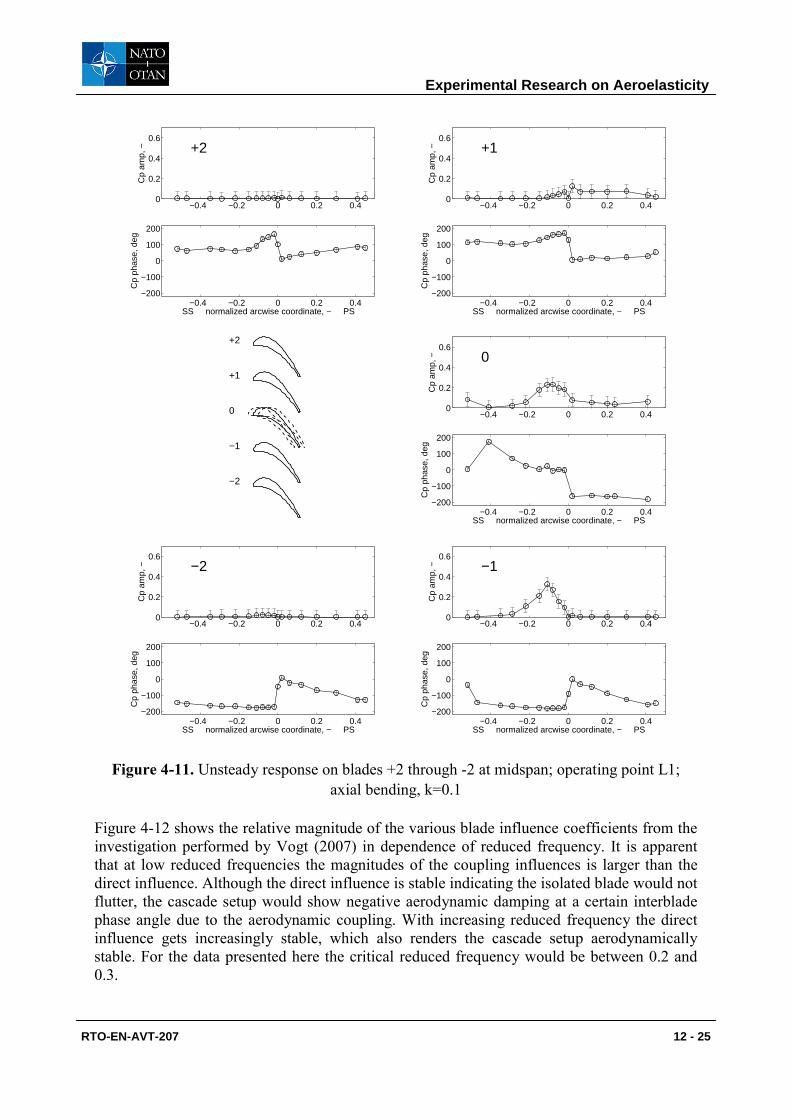
Figure 4-10. Data density for LPT aerodynamic damping testing (Vogt, 2005) A typical set of influence coefficient aerodynamic damping data acquired by Vogt (2005) is shown in Figure 4-11. The data shows the magnitude and phase of the unsteady blade loading during controlled blade oscillation for a certain mode (here axial bending mode). By reducing this set of data to influence coefficients and subsequent superposition, aeroelastic stability data can be obtained for the entire range of interblade phase angles. It is apparent that the influence decays rapidly for higher index blade sand gets here negligible for the +-2 pair.
Experimental Research on Aeroelasticity
12 - 24 RTO-EN-AVT-207
−0.4 −0.2 0 0.2 0.40
0.2
0.4
0.6C
p am
p, −
−0.4 −0.2 0 0.2 0.4−200
−100
0
100
200
Cp
phas
e, d
eg
SS normalized arcwise coordinate, − PS
+2
−0.4 −0.2 0 0.2 0.40
0.2
0.4
0.6
Cp
amp,
−
−0.4 −0.2 0 0.2 0.4−200
−100
0
100
200
Cp
phas
e, d
eg
SS normalized arcwise coordinate, − PS
+1
0 20 40
−80
−60
−40
−20
0
20
40
60
80+2
+1
0
−1
−2
−0.4 −0.2 0 0.2 0.40
0.2
0.4
0.6
Cp
amp,
−
−0.4 −0.2 0 0.2 0.4−200
−100
0
100
200
Cp
phas
e, d
eg
SS normalized arcwise coordinate, − PS
0
−0.4 −0.2 0 0.2 0.40
0.2
0.4
0.6
Cp
amp,
−
−0.4 −0.2 0 0.2 0.4−200
−100
0
100
200
Cp
phas
e, d
eg
SS normalized arcwise coordinate, − PS
−2
−0.4 −0.2 0 0.2 0.40
0.2
0.4
0.6
Cp
amp,
−
−0.4 −0.2 0 0.2 0.4−200
−100
0
100
200
Cp
phas
e, d
eg
SS normalized arcwise coordinate, − PS
−1
Figure 4-11. Unsteady response on blades +2 through -2 at midspan; operating point L1;
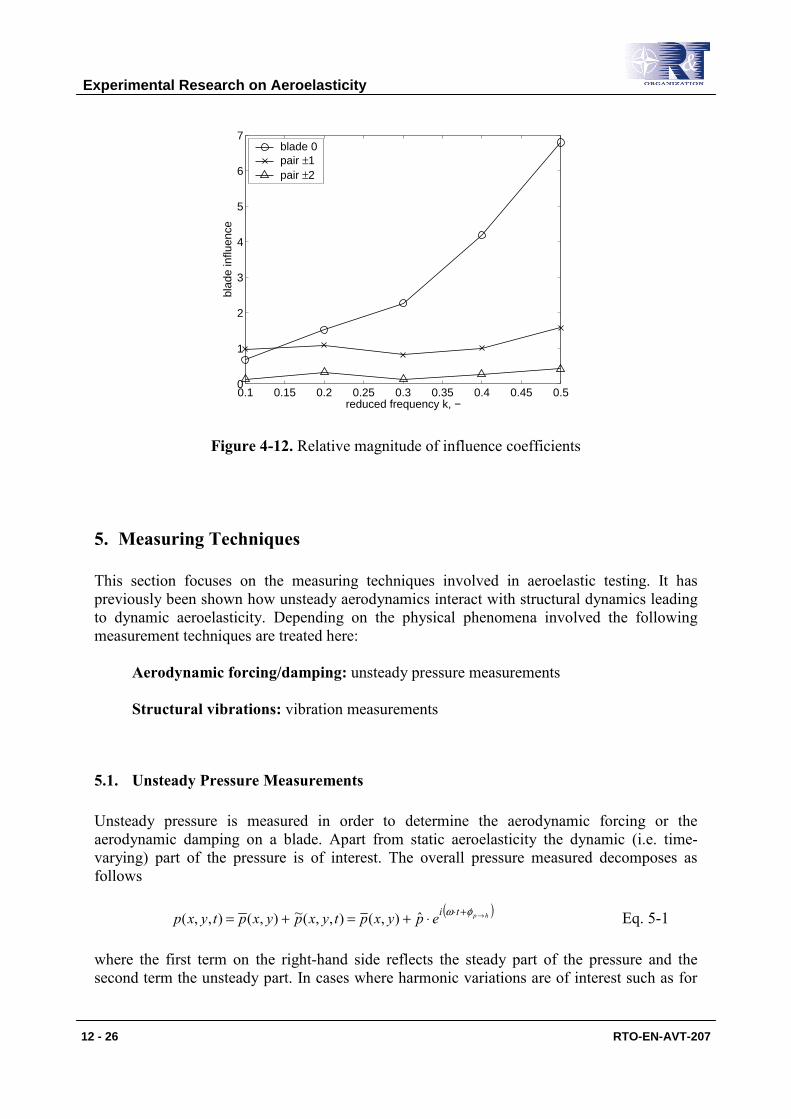
axial bending, k=0.1 Figure 4-12 shows the relative magnitude of the various blade influence coefficients from the investigation performed by Vogt (2007) in dependence of reduced frequency. It is apparent that at low reduced frequencies the magnitudes of the coupling influences is larger than the direct influence. Although the direct influence is stable indicating the isolated blade would not flutter, the cascade setup would show negative aerodynamic damping at a certain interblade phase angle due to the aerodynamic coupling. With increasing reduced frequency the direct influence gets increasingly stable, which also renders the cascade setup aerodynamically stable. For the data presented here the critical reduced frequency would be between 0.2 and 0.3.
Experimental Research on Aeroelasticity
RTO-EN-AVT-207 12 - 25
0.1 0.15 0.2 0.25 0.3 0.35 0.4 0.45 0.50
1
2
3
4
5
6
7
reduced frequency k, −
blad
e in
fluen
ce
blade 0pair ±1pair ±2
Figure 4-12. Relative magnitude of influence coefficients
5. Measuring Techniques This section focuses on the measuring techniques involved in aeroelastic testing. It has previously been shown how unsteady aerodynamics interact with structural dynamics leading to dynamic aeroelasticity. Depending on the physical phenomena involved the following measurement techniques are treated here:
Aerodynamic forcing/damping: unsteady pressure measurements Structural vibrations: vibration measurements
5.1. Unsteady Pressure Measurements Unsteady pressure is measured in order to determine the aerodynamic forcing or the aerodynamic damping on a blade. Apart from static aeroelasticity the dynamic (i.e. time-varying) part of the pressure is of interest. The overall pressure measured decomposes as follows
( )hptiepyxptyxpyxptyxp →+⋅⋅+=+= φωˆ),(),,(~),(),,( Eq. 5-1 where the first term on the right-hand side reflects the steady part of the pressure and the second term the unsteady part. In cases where harmonic variations are of interest such as for
Experimental Research on Aeroelasticity
12 - 26 RTO-EN-AVT-207
the determination of aerodynamic damping the pressure can further be decomposed into a real steady part and a complex harmonic part. The unsteady pressure measurement techniques can be distinguished further into techniques used for measuring blade surface pressure and techniques used for measuring flow field pressure. With respect to blade surface pressure measurements the following techniques are used nowadays:
Miniature pressure transducers: fast-response transducers that are mostly of piezo-resistive type featuring very high natural frequencies (order 100kHz). These transducers are operated as Wheatstone bridge yielding a voltage signal proportional to pressure upon bridge excitation. As the transducers are robust, fairly constant over time and small they are preferably used for these types of measurements. A more complete treatment of this type of technique is given by Ainsworth et al. (2000). Recessed-mounted pressure transducers: this technique might still make use of the aforementioned piezo-resistive transducers, however as they are used in recessed manner the size requirements are not as stringent. Using recessed-mounted transducers has the advantage of placing the transducer away from harsh environment (temperature, vibration) but requires for dynamic compensation of the transfer between measurement location and transducer location. This is done by dynamic calibration as for example reported by Paniagua and Dénos (2000) and Vogt (2004). Pressure-sensitive paint (PSP): a technique that has been used for steady wind tunnel experiments over the last few decades. Only very recently it has been employed successfully for the measurement of unsteady pressure due to the following reasons: i) the technique features inherently large time-scales as it makes use of the oxygen quenching phenomenon that requires diffusion of oxygen into the paint layer; ii) only recently digital image acquisition devices (CCD cameras) feature the capabilities of acquiring images at high frequency as well as high image depth. A more complete treatment of this technique is given by Klein (2008).
Recently, Vogt et al. (2008) has presented the potential in using electret thin-film sensors for turbomachinery aeroelasticity research. Such transducers have the advantage of much reduced cost per data point as well as opening up for sensor arraying. Development work is still ongoing and to date no relevant application with respect to aerodynamic forcing or damping measurements has been reported. Miniature pressure transducers are often placed directly at the measurement location then featuring the advantage of having optimum frequency response. Examples for mounting conventional pressure transducers in pre-milled pockets on turbomachinery blades are shown in Figure 5-1.
Experimental Research on Aeroelasticity
RTO-EN-AVT-207 12 - 27

Lakshminarayana (1980) Sanders et al. (2002)
Figure 5-1. Example of mounting conventional piezo-resistive pressure transducers Ainsworth et al (1991) is using a so-called “chip-on” mounting technique in which the transducer silicon diaphragm is directly mounted on turbomachinery blades without the housing otherwise included for conventional transducers. This technique has the great advantage that favorable spatial data resolution can be achieved as well as that it opens up for instrumentation of thin airfoil sections. At the transducer location the original blade surface is reconstructed using a silastomer cover. An example for “chip-on” mounting technology is shown in Figure 5-2.
Figure 5-2. “Chip-on” piezo-resistive transducer mounting technology (Ainsworth et al., 1991)
Vogt (2005) has used recessed-mounted miniature pressure transducers for investigating the aerodynamic damping in a LPT cascade. The transducers were connected at a short distance underneath the blade by means of miniature quick disconnects opening up for mapping the
Experimental Research on Aeroelasticity
12 - 28 RTO-EN-AVT-207
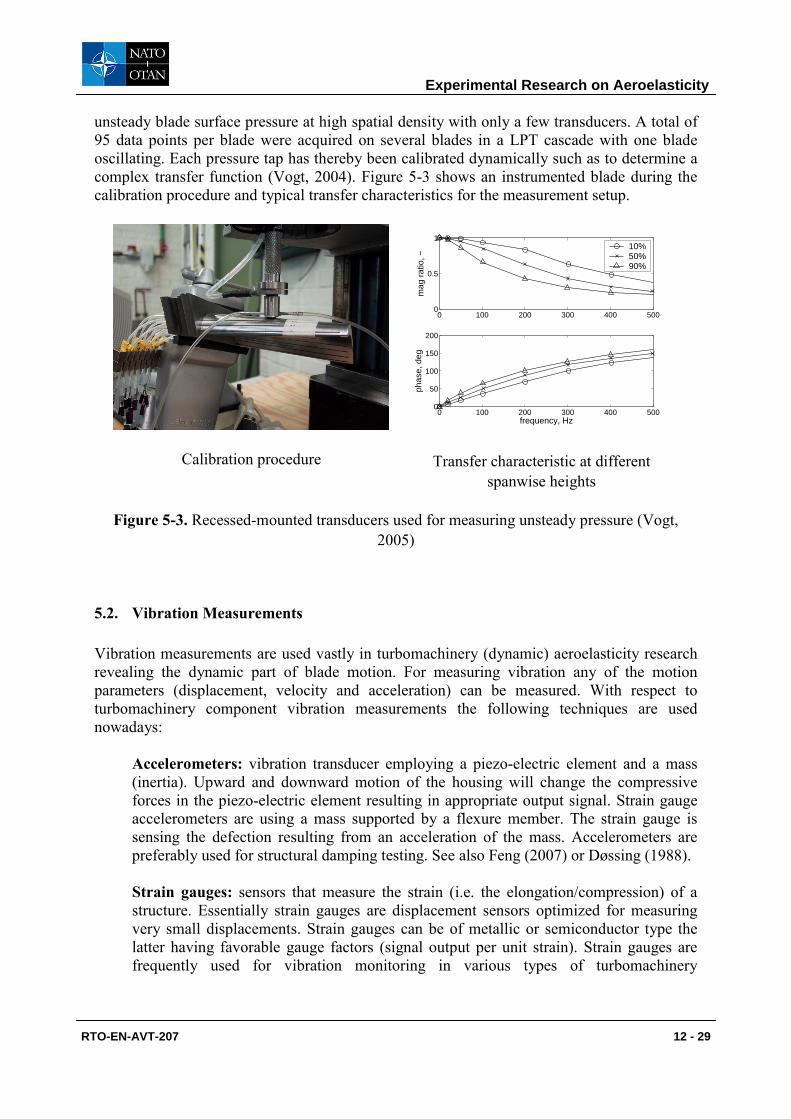
unsteady blade surface pressure at high spatial density with only a few transducers. A total of 95 data points per blade were acquired on several blades in a LPT cascade with one blade oscillating. Each pressure tap has thereby been calibrated dynamically such as to determine a complex transfer function (Vogt, 2004). Figure 5-3 shows an instrumented blade during the calibration procedure and typical transfer characteristics for the measurement setup.
0 100 200 300 400 5000
0.5
1
mag
rat
io, −
0 100 200 300 400 5000
50
100
150
200
phas
e, d
egfrequency, Hz
10%50%90%
Calibration procedure
Transfer characteristic at different
spanwise heights
Figure 5-3. Recessed-mounted transducers used for measuring unsteady pressure (Vogt, 2005)
5.2. Vibration Measurements Vibration measurements are used vastly in turbomachinery (dynamic) aeroelasticity research revealing the dynamic part of blade motion. For measuring vibration any of the motion parameters (displacement, velocity and acceleration) can be measured. With respect to turbomachinery component vibration measurements the following techniques are used nowadays:
Accelerometers: vibration transducer employing a piezo-electric element and a mass (inertia). Upward and downward motion of the housing will change the compressive forces in the piezo-electric element resulting in appropriate output signal. Strain gauge accelerometers are using a mass supported by a flexure member. The strain gauge is sensing the defection resulting from an acceleration of the mass. Accelerometers are preferably used for structural damping testing. See also Feng (2007) or Døssing (1988). Strain gauges: sensors that measure the strain (i.e. the elongation/compression) of a structure. Essentially strain gauges are displacement sensors optimized for measuring very small displacements. Strain gauges can be of metallic or semiconductor type the latter having favorable gauge factors (signal output per unit strain). Strain gauges are frequently used for vibration monitoring in various types of turbomachinery
Experimental Research on Aeroelasticity
RTO-EN-AVT-207 12 - 29
aeroelasticity experiments ranging from simple component tests to full engine tests. See also Srinivasan (1997) or Figliola and Beasley (2006). Optical measurement techniques: various types of Laser-based measurements are used to measure structural vibrations either measuring displacement or velocity. Laser-based techniques monitor these vibration parameters point-wise. There are systems that scan a pre-defined mesh of data points sequentially in automatic manner (so-called Laser scanning vibrometers). Other optical techniques are based on interferometry allowing for area vibration monitoring.
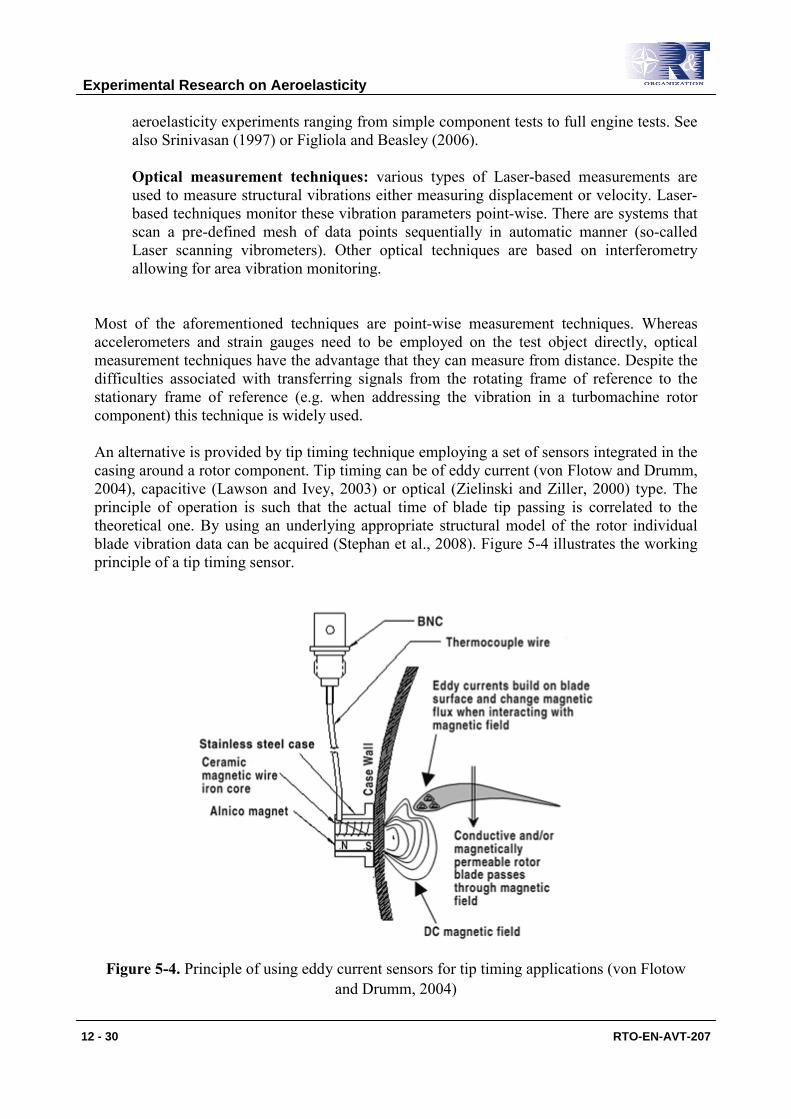
Most of the aforementioned techniques are point-wise measurement techniques. Whereas accelerometers and strain gauges need to be employed on the test object directly, optical measurement techniques have the advantage that they can measure from distance. Despite the difficulties associated with transferring signals from the rotating frame of reference to the stationary frame of reference (e.g. when addressing the vibration in a turbomachine rotor component) this technique is widely used. An alternative is provided by tip timing technique employing a set of sensors integrated in the casing around a rotor component. Tip timing can be of eddy current (von Flotow and Drumm, 2004), capacitive (Lawson and Ivey, 2003) or optical (Zielinski and Ziller, 2000) type. The principle of operation is such that the actual time of blade tip passing is correlated to the theoretical one. By using an underlying appropriate structural model of the rotor individual blade vibration data can be acquired (Stephan et al., 2008). Figure 5-4 illustrates the working principle of a tip timing sensor.
Figure 5-4. Principle of using eddy current sensors for tip timing applications (von Flotow and Drumm, 2004)
Experimental Research on Aeroelasticity
12 - 30 RTO-EN-AVT-207
6. Summary An introduction into experimental research has been given. First, various aspects of turbomachinery aeroelasticity have been elucidated. Phenomena of interest have been discussed on different levels of complexity ranging from single airfoils to the multistage environment as present in turbomachines. Fundamental concepts with relevance to turbomachinery aeroelasticity have been presented in detail such as to give the reader the necessary knowledge for planning experiments in the field of aeroelasticity. A review of experimental facilities has been given with the focus put on the experimental study of aerodynamic forcing and aerodynamic damping. Finally the subject has been wrapped up by giving an overview into measurement techniques used in experimental research in aeroelasticity. The present document should give the reader an introduction into the field of aeroelasticity with respect to experimental research. The knowledge of basic underlying physical mechanisms and methods as presented herein should allow for planning experiments in this challenging field. As mentioned initially, numerical tools have not yet reached a state of absolute reliability and therefore experimental research is still of utmost importance be it for the investigation of a specific phenomenon, acquisition of validation data or component/engine tests.
7. References Ainsworth, R.W., Miller, R.J., Moss, R.W., Thorpe, S.J., 2000, “Unsteady Pressure Measurement”, Measurement Science and Technology, 11, 2000, pp.1055-1076 Ainsworth, R.W., Dietz, A.J., Nunn, T.A., 1991, “The Use of Semiconductor Sensors for Blade Surface Pressure Measurement”, ASME J. of Engineering for Gas Turbines and Power, 113, 1991, pp.261-268 Bell, D.L., He, L., 2000, “Three-Dimensional Unsteady Flow for an Oscillating Turbine Blade and the Influence of Tip Leakage”, ASME J. of Turbomachinery, Vol. 122, 2000, pp.93-101 Bellenot, C., Lalive d’Epinay, J., 1950, “Selbsterregte Schaufelschwingungen”, Brown Boveri Mitteilungen, October 1950, pp.368-376 Binder, A., Förster, W., Kruse, H., Rogge, H., 1985, ”An Experimental Investigation into the Effects of Wakes on the Unsteady Turbine Rotor Flow”, ASME J. of Engineering for Power, 117, 1985, pp-458-466 Bölcs, A., Fransson, T.H., 1986, “Aeroelasticity in Turbomachines – Comparison of Theoretical and Experimental Results”, Communication du Laboratoire de Thermique Appliqué et de Turbomachines, No. 13, EPFL, Lausanne, Switzerland, 1986 Buffum, D.H., Fleeter, S., 1990, “Oscillating Cascade Aerodynamics by an Experimental Influence Coefficient Technique”, AIAA J. of Propulsion, Vol. 6, 1990, pp.612-620 Carta, F.O., 1983, “Unsteady Gapwise Periodicity of Oscillating Cascaded Airfoils”, ASME J. of Engineering for Gas Turbines and Power, Vol. 105, 1983, pp.565-574 Collar, A.R., 1946, “The Expanding Domain of Aeroelasticity”, The Royal Aeronautical Society, London, UK, 1946, pp.613-636
Experimental Research on Aeroelasticity
RTO-EN-AVT-207 12 - 31
Chuang, A.H., 2004, “Evaluation and Validation of Multistage Coupling for Flutter Analysis”, Paper presented at the 9th National Turbine Engine High Cycle Fatigue (HCF) conference, Pinehurst, North Carolina, USA, 2004 Crawley, E.F., 1981, "Measurements of Aerodynamic Damping in the MIT Transonic Rotor" MIT GTL Report, No. 157, 1981 Crawley, E.F., 1988, “Aeroelastic Formulation for Tuned and Mistuned Rotors”, AGARD Manual on Aeroelasticity in Axial-Flow Turbomachines, Vol. 2, Structural Dynamics and Aeroelasticity, Chapter 19, AGARD-AG-298 Denos, R., Sieverding, C. H., Arts, T., Brouckaert, J. F., Paniagua, G. and Michelassi, V., 1999, “Experimental Investigation of the Unsteady Rotor Aerodynamics of a Transonic Turbine Stage”, IMECH Conference Transactions, 3. European Conference on Turbomachinery, pp.271-287 Dénos, R., Arts, T., Paniagua, G., Michelassi, V., Martelli, F., 2001, “Investigation of the Unsteady Rotor Aerodynamics in a Transonic Turbine Stage”, ASME J. of Turbomachinery, 123, 2001, pp.81-89 Dietz, A.J., Ainsworth, R.W., 1992, “Unsteady Pressure Measurements on the Rotor of a Model Turbine Stage in a Transient Flow Facility”, ASME Paper 92-GT-156 Døssing, O., 1988, “Structural Testing – Part I: Mechanical Mobility Measurements”, Brüel&Kjær lecture notes Ehrich F., 1993, “Rotor Whirl Forces Induced by the Tip Clearance Effect in Axial Flow Compressors”, ASME J. of Vibration and Acoustics, 115, 1993, pp.509–515 Feng, L., 2007, “Acoustical Measurements”, Lecture notes, Royal Institute of Technology, TRITA-AVE 2007:07, ISSN 1651-7660, Stockholm, Sweden, 2007 Figliola, R.S., Beasley D.E., 2006, “Theory and Design for Mechanical Measurements”, ISBN 978-0-471-44593-7, John Wiley & Sons, Inc., 2006 Fransson, T.H., 1999, “Aeroelasticity in Turbomachines”, VKI lecture series, May 1999, Rhode-Saint-Genèse, Belgium Greitzer, E.M., Tan, C.S., Wisler, D.C., Adamczyk, J.J., Strazisar, A.J., 1994, “Unsteady Flow in Turbomachines: Where’s the Beef?”, Paper presented at the 1994 ASME Winter Meeting, Chicago, Illinois, USA Hall, K.C., Ekici, K., Voytovych, D.M., 2003, “Multistage Coupling for Unsteady Flows in Turbomachinery”, Proceedings 10th International Symposium on Aerodynamics, Aeroacoustics and Aeroelasticity of Turbomachines (ISUAAAT), Durham, North Carolina, USA, 2003 Hanamura, Y., Tanaka, H., Yamaguchi, Y., 1980, “A Simplified Method to Measure Unsteady Forces Acting on the Vibrating Blades in Cascade”, Bulletin of JSME, Vol. 23, 1980 Hodson, H.P., 1985, “Measurements of Wake-Generated Unsteadiness in the Rotor Passage of Axial Flow Turbines”, ASME J. of Engineering for Gas Turbines and Power, 107, 1985, pp.476-476 Jöcker, M., Freudenreich, K., Fransson, T.H., Rehder, H.-J., 2000, “Parametric Studies of the Aerodynamic Excitation in High Pressure Turbines“, 9th International Symposium on Unsteady Aerodynamics, Aeroacoustics and Aeroelasticity of Turbomachines (ISUAAAT), Lyon, France, Sep., 4-8, 2000 Kahl, G., Hennings, H., 2000, “Computational Investigation of an Oscillating Compressor Cascade Experiment”, Proceedings 9th International Symposium on Unsteady Aerodynamics, Aeroacoustics and Aeroelasticity of Turbomachines (ISUAAAT), Lyon, France, 2000
Experimental Research on Aeroelasticity
12 - 32 RTO-EN-AVT-207

Kirschner, A., Pelet C., Gyarmathy, G., 1976, “Investigation of Blade Flutter in a Subsonic Turbine”, Revue Française de Mécanique, numéro spécial 1976, pp.97-104 Klein, C., 2008, “Application of Pressure Sensitive Paint for Determination of the Pressure Field of Aircraft Models in Wind Tunnels”, Keynote lecture held at the 19th Symposium on Measuring Techniques in Transonic and Supersonic Flows in Cascades and Turbomachines, Brussels, Belgium, 2008 Kost, F., Giess, P.A., 2004, ”Experimental Turbine Research at DLR Göttingen”, Journal of the Gas Turbine Society of Japan, 32, No. 6., 2004, pp.485-493 Lakshminarayana, B., 1980, “Techniques for Aerodynamics and Turbulence Measurements in Turbomachine Rotors”, Measurement Methods in Rotating Components of Turbomachinery, ed. B. Lakshminarayana (New York: ASME) Laumert, B., 2002, “Numerical Investigation of Aerodynamic Blade Excitation Mechanisms in Transonic Turbine Stages”, PhD thesis, Royal Institute of Technology, Sweden, ISBN 91-7283-354-8, Stockholm, 2002 Lawson P.L., Ivey, P.C., 2003, “Compressor Blade Tip Timing using Capacitance Tip Clearance Probes”, ASME Paper GT2003-38284 Marshall, J.G., Imregun, M., 1996, „A Review of Aeroelasticity Methods with Emphasis on Turbomachinery Applications“, Journal of Fluids and Structures, 10, 1996, pp.237-276 Meldahl, A., 1946, “Selbsterregte Flügelschwingungen mit einem Freiheitsgrad”, Brown Boveri Mitteilungen, Nr. 12, 1946, pp.386-393 Nowinski, M., Panovsky, J., 2000, “Flutter Mechanisms in Low Pressure Turbine Blades”, ASME J. of Engineering for Gas Turbines and Power, Vol. 122, 2000, pp.82-88 Paniagua, G., Dénos, R., 2000, “Numerical Compensation in the Time Domain of Pressure Sensors“, Paper presented at the 15th Symposium on Measuring Techniques in Transonic and Supersonic Flows in Cascades and Turbomachines, Florence, Italy, 2000 Sanders, A.J., Rabe, D., Fost, R., 2002, “An Experimental Investigation of Stall Flutter in an Advanced Design Low-Aspect Ratio Fan Blisk”, Proceedings 7th National Turbine Engine High Cycle Fatigue Conference, Palm Beach Gardens, Florida, USA, 2002 Széchényi, E., 1985, “Fan Blade Flutter – Single Blade Instability or Blade to Blade Coupling”, ASME Paper 85-GT-216 Srinivasan, AV., 1997, “Flutter and Resonant Vibration Characteristics of Engine Blades”, ASME J. of Engineering for Gas Turbines and Power, 119, 1997, pp.742-775 Stephan, C., Berthillier, M., Lardies, J., Talon, A., 2008, “Turbomachinery Blades Spectral Estimation from Tip-Timing Data”, Paper presented at the 19th Symposium on Measuring Techniques in Transonic and Supersonic Flows in Cascades and Turbomachines, Brussels, Belgium, 2008 Thomassin, J., Duc Vo., H., Mureithi, N.W., 2007, “Blade Tip Clearance Flow and Compressor NSV: the Jet Core Feedback Theory as the Coupling Mechanism”, ASME Paper GT2007-27286 Triebstein, H., 1976, “Unsteady Pressure on a Harmonically Oscillating Staggered Cascade in Incompressible and Compressible Flow”, Revue Française de Mécanique, numéro spécial 1976, pp.115-122 Verdon, J.M., 1987, “Linearized Unsteady Aerodynamic Theory”, AGARD Manual on Aeroelasticity in Axial-Flow Turbomachines, Vol. 1, Unsteady Turbomachinery Aerodynamics, Chapter 2, AGARD-AG-298
Experimental Research on Aeroelasticity
RTO-EN-AVT-207 12 - 33
Vogt, D.M., Fransson, T.H., 2004, “A Technique for Using Recessed-Mounted Pressure Transducers to Measure Unsteady Pressure”, Paper presented at the 17th Symposium on Measuring Techniques in Transonic and Supersonic Flows in Cascades and Turbomachines, Stockholm, Sweden, 2004 Vogt, D.M., 2005, “Experimental Investigation of Three-Dimensional Mechanisms in Low-Pressure Turbine Flutter”, PhD thesis, Royal Institute of Technology, Sweden, ISBN 91-7178-034-3, Stockholm, 2005 Vogt, D.M., Fransson, T.H., 2007, “Experimental Investigation of Mode Shape Sensitivity of an Oscillating LPT Cascade at Design and Off-Design Conditions”, ASME J. of Engineering for Gas Turbines and Power, 129, 2007, pp.530-541 Vogt, D.M., Fridh, J.E., Fransson, T.H., 2008, “Characterization and First Application of a Thin-Film Electret Unsteady Pressure Measurement Technique”, Paper presented at the 19th Symposium on Measuring Techniques in Transonic and Supersonic Flows in Cascades and Turbomachines, Brussels, Belgium, 2008 von Flotow, A., Drumm, M.J., 2004, “High Temperature, Through the Case, Eddy Current Blade Tip Sensor”, Sensors and Transducers e-Digest, No. 6., June 2004 Whitehead, D.S., 1973, “The Effect of Compressibility on Unstalled Torsion Flutter”, Report CUED/A-Turbo/TR-51-1973, Cambridge, UK Whitehead, D.S., 1987, “Classical Two-Dimensional Methods”, AGARD Manual on Aeroelasticity in Axial-Flow Turbomachines, Vol. 1, Unsteady Turbomachinery Aerodynamics, Chapter 3, AGARD-AG-298 Wu, X., Vahdati, M., Sayma, A.I., Imregun, M., 2003, “A Numerical Investigation of Aeroacoustic Fan Blade Flutter”, ASME Paper GT2003-38454 Zielinski, M., Ziller, G., 2000, “Noncontact Vibration Measurements on Compressor Blades”, Measurement Science and Technology, 11, July, pp.847-856
Experimental Research on Aeroelasticity
12 - 34 RTO-EN-AVT-207