experimental characterization of leak detection 6ystems in
TRANSCRIPT

PRE-PRINT VERSION
Paper published on Nuclear Technology: https://doi.org/10.1080/00295450.2020.1749480
Experimental Characterization of Leak Detection Systems in HLM Pool using
LIFUS5/Mod3 Facility
Marica Eboli, Alessandro Del Nevo
ENEA FSN-ING C.R. Brasimone
40032 Camugnano (BO), Italy
[email protected]; [email protected]
Nicola Forgione
University of Pisa, DICI,
56122 Pisa, Italy
Fabio Giannetti
Sapienza University of Rome
00185 Roma, Italy
Daniele Mazzi
S.R.S. S.r.l.
00186 Roma, Italy
Marco Ramacciotti
ISE S.r.l.
55014 Lucca, Italy
ABSTRACT
In the framework of EU MAXSIMA project, the safety of the Steam Generator adopted in the
primary loop of the Heavy Liquid Metal Fast Reactors has been studied investigating the
consequences and damage propagation of a Steam Generator Tube Rupture event and
characterizing leak rates from typical cracks. Indeed, instrumentation able to promptly detect the
presence of a crack in the steam generator tubes may be used to prevent its further propagation,
which would lead to a full rupture of the tube. Indeed, the application of the leak before break
concept is relevant for improving the safety of a reactor system and decreasing the probability of
the pipe break event. In this framework, a new experimental campaign (Test Series C) has been
carried out in LIFUS5/Mod3 facility, installed at ENEA C.R. Brasimone, in order to characterize
and to correlate the leak rate through typical cracks occurring in the pressurized tubes with
signals detected by proper transducers. Test C1.3_60 was executed injecting water at about 20 bar
and 200°C into Lead Bismuth Eutectic alloy. The injection was performed through a laser micro-
holed plate of 60 micrometers in diameter. The analysis of the thermo-hydraulic data permitted to
characterize the leakage through typical cracks which can occur in pressurized tubes of steam
generator, while the analysis of the data acquired by the microphones and accelerometers
highlighted that is possible to correlate the signals to the leakage, and the rate of release.
KEYWORDS
SGTR, safety, Generation IV, LIFUS5/Mod3, Leak detection
I. INTRODUCTION
The new generation IV Heavy Liquid Metal Fast Reactors (HLMFR) is designed as pool type
reactor, implementing the Steam Generators (SG) into the primary pool, where also the core,
primary pumps and main components are set [1]. This design feature allows increasing the
reactor performance and simplifying the whole layout. However, in such configuration, the
secondary coolant (water), flowing in the heat exchanger tube bundle, at high pressure and
subcooled conditions, could come into contact with the primary heavy liquid metal coolant, at
higher temperature and lower pressure, in a hypothetical SG Tube Rupture (SGTR) accident [2,
3]. During such event, high pressure water enters in the low pressure liquid metal pool and
rapidly evaporates. The consequent sudden increase of the water specific volume entails pressure
waves propagation, which could affect the structural integrity of the surrounding components,
and cover gas pressurization [4, 5]. Moreover, the rupture of a single SG tube could affect, in
principle, the integrity of the neighboring tubes (domino effect), making worse the consequences
of the accidental scenario. Besides the damaging of the internal structures, a SGTR event could
potentially induce an insertion of positive reactivity into the system or reduce cooling efficiency
due to steam dragging into the core. It will also have an effect on the chemistry control of the
cooling. These consequences may compromise the safety and the reliability of the system.
Instrumentation able to promptly detect the presence of a crack in the SG tube may be used to
prevent its further propagation which would possibly lead to a full rupture of the tube. Indeed, the
application of the leak before break concept is relevant for improving the safety of a reactor
system. In particular, it decreases the probability of the pipe break event.
The paper describes Test C1.3_60 of the new experimental campaign (Series C) executed in
LIFUS5/Mod3 facility in order to characterize and correlate the leak rate through typical cracks
occurring in the pressurized tubes with signals detected by proper transducers [6, 7]. The layout
of the LIFUS5/Mod3 facility, the water injection line and injection device and the installed
instrumentation have been reported and described in section II. The test matrix of the
experimental campaign is reported in section III while section IV describes the execution and
experimental data of Test C1.3_60. Water at about 20 bar and 200°C was injected into Lead
Bismuth Eutectic (LBE). The injection was performed through a laser micro-holed plate of 60
micrometer. The experimental analyses aim to provide engineering feedbacks to promptly detect
the presence of a crack in the SG tubes, which may be used to prevent its further propagation.
Different instrumentation are installed and tested in the experimental campaign. Moreover, the
acquired experimental data can be used for the validation of numerical models and calculation
codes.
II. LIFUS5/MOD3 FACILITY DESCRIPTION

LIFUS5/Mod3 is a multi-purpose experimental facility installed at ENEA CR Brasimone (Fig. 1
and Ref. [7, 8]). It is designed to be operated with different heavy liquid metals like Lithium-
Lead alloy, Lead-Bismuth eutectic alloy and pure lead. The test section S1A is devoted to the
small leakage detection activity and can be operated at maximum temperature of 500 °C and
maximum pressure of 200 bar, according to Pressure Equipment Directive (PED). The main parts
characterizing LIFUS5/Mod3 facility are listed hereafter:
1. the interaction vessel S1A, where LBE/water interaction occurs;
2. S2V vessel, where demineralized water is stored for the injection in S1A by means of a
pressurized gas cylinder connected to the top;
3. S4A is the storage tank of LBE;
4. S3V is a dump tank, used to collect vapor and gases during the test.
II.A. Main components description
The interaction vessel S1A is about 100 liters, and it is partially filled with LBE during the tests.
A top flange closes it by means of a graphite gasket spiral wound. Penetrations are made in S1A
top flange for allowing the installation of the instrumentation and connections, in particular for
two on/off level meters (LV), for five Acoustic Detection Systems (ADS), for one absolute
pressure transducer (PC), for two accelerometers and an Acoustic Emission detection system, and
for the connection to S3V dump tank. Internally, S1A can be divided into an upper cylindrical
part and a lower hemispherical part. The main diameter is 420 mm and the overall height is 780
mm. The cylindrical shell of S1A has penetrations allowing the passage of the instrumentation,
which consist of one fast pressure transducers (PT) and two thermocouples (TC). At the bottom
of the vessel, a 2" sch.80 penetration provides the connection with the injection line and the LBE
charging/discharging system.
The water tank S2V is a pipe, closed at the edges with two flanges. It has a volume of about 14
liters. It is connected on the top with the gas line, which is used for setting and keeping the
pressure of the water according with the test specifications. On S2V top flange, a threaded
penetration is provided allowing the passage of a magnetostrictive level measurement device,
having a volume of 3 liters. The filling level in the S2V vessel is continuously monitored also by
a Differential Pressure (DP) meter inserted between the lower part of S2V and bottom part of
injection line, for a height of about 2.15 m. At bottom, S2V is connected to the water injection
line. LBE in S1A is filled and drained, just before and after the test respectively. It is stored in the
liquid metal storage tank S4A, which is connected to the bottom of the main vessel S1A. On
lateral surface of S4A penetrations are provided allowing the passage of instrumentation, in
particular one absolute pressure transducer (PC), one thermocouple (TC), two on/off and one
continuous level meters (LV).
The dump tank S3V is connected by means of a 3” line to the top flange of S1A. The S3V
volume is equal to 2 m3 and the design pressure is 10 bar. It represents a safety volume used to
collect the vapour and the gas generated by the interaction between LBE and water.
II.B. Injection line

The injection line (Fig. 2) starts from S2V water storage tank and it is connected to the S1A
reaction vessel. A Coriolis mass flow meter (MT-S2L-01) is placed between the pneumatic
valves VP-S2L-07 and VP-S2L-08, in order to measure the mass of water that flows in the line
and is injected in reaction tank S1A. A manual drainage valve (VM-S2L-11) is located
downstream the mass flow meter, with the aim to empty the line after every experimental
procedure. The Coriolis has the capability to measure the mass flow rate in the range of 50-2000
g/h. The water injection line is heated from VP-S2L-08 (downstream the Coriolis) to S1A. There
are 5 heating wires in charge to warm-up the water before its entering in the reaction vessel (up to
200°C). These heating wires are controlled by means of thermocouples for both safety and
regulation. The temperature of the fluid is controlled by 4 thermo wells. Line is insulated from
the external environment by an insulating layer, this reduces the heat losses and therefore limits
the power of heating wires.
II.C. Injection system and injector device
The injection system (Fig. 3) is constituted by two separate parts, connected by a 2”ANSI 2500
Ring Joint flange. The first one is completely integrated and welded to the bottom of S1A vessel.
The second one is manufactured by four coaxial tubes and it can be dissembled at the end of each
test to allow the replacement of the injector device. The water injection line enters into a second
tube which permits the inlet of the gas for the injection system cooling. The gas flows towards up
to the injector device and then flows in counter-current direction into a third tube, designed for
the gas outlet. The LBE is charged and discharged through the fourth tube.
The injector device (Fig. 3) is characterized by a micro-holed AISI 316 plate with a thickness of
1 mm and a diameter of 1” (25.4 mm). At the center of the plate, a single micro-hole is
manufactured by laser technology. The orifice diameter varies from 40 to 200 μm according to
the test specification. The injector penetrates into S1A interaction tank of 170 mm. The plate is
installed into the injector device between two sealing rings. An injector cap closes the injector
device by means of a spanner, designed ad hoc. In this way, at each test, the injector device can
be disassembled and the plate can be replaced with another one with different micro-hole
diameter. All of these components are manufactured by ENEA workshop.
II.D. Detection System: Real Time Data Acquisition for Microphones, Accelerometers and
Acoustic Emission Sensor
The top flange of the LIFUS5/Mod3 facility has 5 penetrations where microphones are installed.
Moreover, a series of alternative detection system, which are constituted by accelerometers and
acoustic emission sensor, are placed on the flange and inside the vessel of the LIFUS5/Mod3
facility. The layouts are depicted in Fig. 4. These are:
1. One microphone at high temperature in central position (i.e. HT ADS).
2. Four microphones at low temperature along the same circumference (i.e. LT ADS);
3. Inductive proximity sensor (i.e. High Sensitivity Accelerometer – HSA) installed outside
the vessel;
4. Accelerometer sensor installed inside the vessel (i.e. High Temperature Accelerometer –
HTA) on a metallic support;

5. Acoustic Emission (AE) sensor installed outside the vessel, measuring the high frequency
signals by means of a waveguide.
Figure 1. LIFUS5/Mod3 synoptic.
HTA
AE HSA
ADS
Water
injection line
LBE fill and
drain line
Air cooling
system

Figure 2. LIFUS5/Mod3 view of S1A flange penetrations and water injection line.
Figure 3. LIFUS5/Mod3 sketch of the injection system and injector system device.
Water tank S2V
LVL meter
DP Meter and top
connection
DP Meter and
bottom connection
Helical coil water
line
1/ H2 injection
2 sch. L E
charge/discharge
Injector device
1/ into S1A
as inlet
cooling
1 as
outlet
Sealing Laser micro-
holed plate
Injector device Injector
cap
Spanner to seal the
injector cap

Figure 4. ADS and Accelerometers positions on LIFUS5/Mod3 facility.
III. TEST MATRIX AND OBJECTIVES OF THE EXPERIMENTAL CAMPAIGN
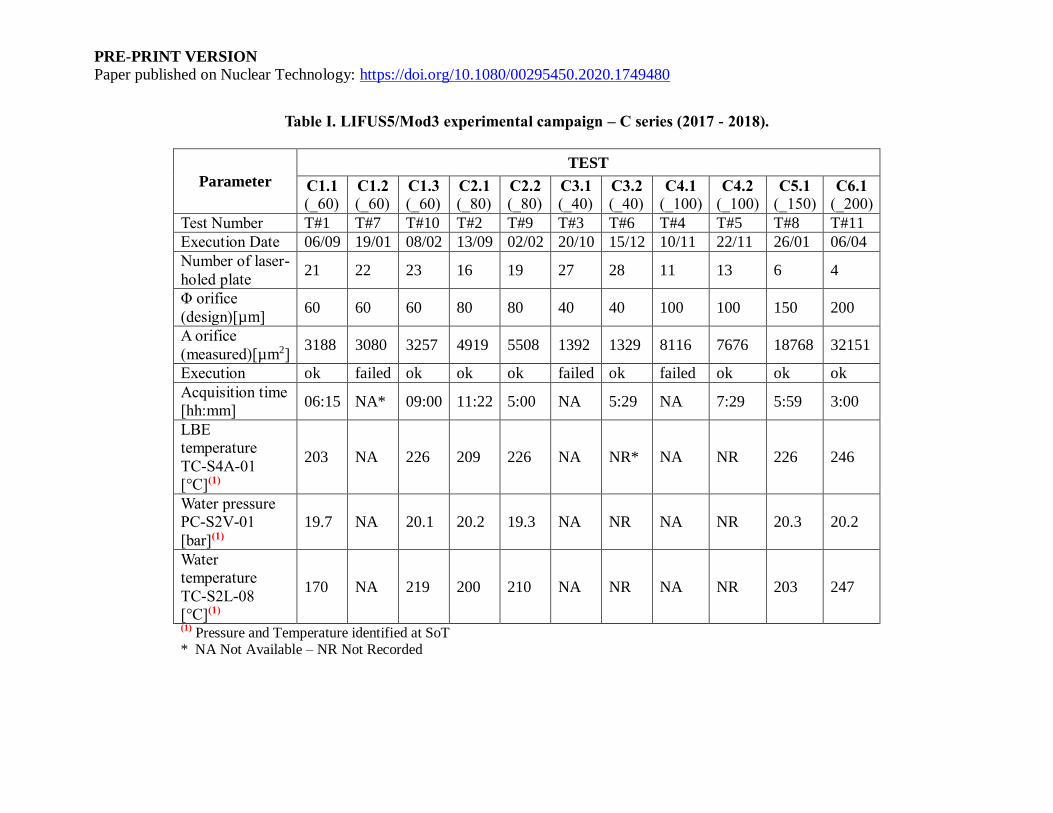
A Test Matrix (TM) of 10 experiments was proposed in the framework of the EU MAXSIMA
Project [9] (Tab. I). Tests were performed adopting injection laser micro-holed plates having the
diameter of 40, 60, 80, 100, 150 and 200 micrometers.
The objective of the experimental campaign is connected with the SGTR accidental scenario. In
particular, the aim is to investigate and correlate the size of a micro-crack in a tube of MYRRHA
Primary Heat exchanger tubes bundle with the signal induced by the vapor bubbles formed and
flowing in the liquid metal. The expected outcomes of the tests are:
1. the generation of reliable experimental data;
2. the evaluation of the water mass flow rate in LBE through a characterized crack;
3. the correlation of the crack sizes with proper signals;
4. the enlargement of the database for code validation.
LT ADS
HT ADS
HSA sensor
HTA sensor
AE sensor
PRE-PRINT VERSION
Paper published on Nuclear Technology: https://doi.org/10.1080/00295450.2020.1749480
Table I. LIFUS5/Mod3 experimental campaign – C series 2 17 - 2 1 .
Parameter
TEST
C1.1
(_60) C1.2
(_60) C1.3
(_60) C2.1
(_80) C2.2
(_80) C3.1
(_40) C3.2
(_40) C4.1
(_100) C4.2
(_100) C5.1
(_150) C6.1
(_200)
Test Number T#1 T#7 T#10 T#2 T#9 T#3 T#6 T#4 T#5 T#8 T#11
Execution Date 06/09 19/01 08/02 13/09 02/02 20/10 15/12 10/11 22/11 26/01 06/04
Number of laser-
holed plate 21 22 23 16 19 27 28 11 13 6 4
Φ orifice
(design)[µm] 60 60 60 80 80 40 40 100 100 150 200
A orifice
(measured)[µm2] 3188 3080 3257 4919 5508 1392 1329 8116 7676 18768 32151
Execution ok failed ok ok ok failed ok failed ok ok ok
Acquisition time
[hh:mm] 06:15 NA* 09:00 11:22 5:00 NA 5:29 NA 7:29 5:59 3:00
LBE
temperature
TC-S4A-01
[°C] 1
203 NA 226 209 226 NA NR* NA NR 226 246
Water pressure
PC-S2V-01
[bar] 1
19.7 NA 20.1 20.2 19.3 NA NR NA NR 20.3 20.2
Water
temperature
TC-S2L-08
[°C] 1
170 NA 219 200 210 NA NR NA NR 203 247
(1) Pressure and Temperature identified at SoT
* NA Not Available – NR Not Recorded

PRE-PRINT VERSION
Paper published on Nuclear Technology: https://doi.org/10.1080/00295450.2020.1749480
IV. DESCRIPTION OF THE EXPERIMENT – TEST C1.3_60
The Test LIFUS5/Mod3 C1.3_60 [10] corresponds to test #10 of the test matrix above. The
micro-holed injector plates used in the test was characterized by Scanning Electron Microscope
(SEM) analyses ([6]): a mean diameter of 63.7 μm and an area of 3257 μm2 were measured.
IV.A. RELAP5/Mod3.3 characterization prior to test
RELAP5/Mod3.3 code ([11]) is used to investigate the injection across the orifice at different
temperature conditions. The nodalization (Fig. 5) is set-up modeling the actual geometry of
LIFUS5/Mod3 injection line, as built (Fig. 1). The injection pressure is set to 19 bar. The LBE
system (i.e. S1A) is modeled as a boundary condition, where pressure and temperature are
imposed (i.e. 1.1 bar and 200 °C). No heat transfer is simulated between the LBE and the water
system. The water temperature is varied stepwise in the range of 15–275 °C.
The results (Fig. 6) show that during the time interval of 0-2000 s (corresponding to the water
temperature range of 15-50°C), the calculated mass flow is about 560 g/h. The amount of injected
water in this time interval is about 0.3 kg. Considering the temperature range of 150-200 °C,
which is representative of the experimental test conditions, the mass flow rate calculated by
RELAP5 decreases once the temperature of the fluid is closer to the saturation. The two-phase
chocked flow is established in the time interval 9000-12000 s. In this condition, the mass flow
rate varies from 530 g/h to 320 g/h. Then, single phase gas flow conditions are achieved.
IV.B. Analysis of the Test
The initial test conditions are achieved accordingly with the specifications with satisfactory
accuracy. The water injection is executed using the valves VP-S2L-07 and VP-S2L-08 across the
Coriolis flow meter. The time schedule of the test execution is summarized in Tab. II.
The main parameter trends are reported in selected time scales in Fig. 7 and Fig. 8. The Test
C1.3_60 can be divided in 2 main phases:
1. Water injection without LBE
2. Water injection in LBE
Time 0 s is assumed at 07:30:00, when the acquisition system is activated. The acquisition time
lasts 32400 s.
In order to prevent a plugging of the micro-holed injector plate during the LBE filling phase, the
injection of water is started in advance. Therefore, the first phase corresponds to water injection
without LBE in the interaction vessel (S1A). This phase ends when the LBE filling procedure
starts. The ADS and accelerometers acquisition systems are already activated.
When the LBE level is stable in S1A, accordingly with the continuum level meter LV-S4A-03,
the filling procedure is completed (Fig. 7). The Start of the Test (SoT) occurs, at time t = 5158 s,
whereas it ends at time equal 27017 s. During the test, the amount of water injected is measured
according with the data of the level meter LV-S2V-01. The mass flow rate is derived from this
measure. The Coriolis flow meter results out of calibration, therefore, only the qualitative trend is
considered in the analysis, being consistent with the level measurement and the signals recorded
by the accelerometers.
During the test, the water level decreases from 676 to 406 mm. The decrease of 270 mm in level
leads to an overall mass of injected water corresponding to 2.40±0.088 kg in 21859 s. The
average mass flow rate in this time span is therefore 395.2±1.5 g/h, in particular, it varies during
the test from an average value of 586.7±1.5 g/h to 253.2±1.5 g/h, as shown from the qualitative
trend of the Coriolis mass flow meter in Fig. 7. The measured data confirm the RELAP5/Mod3.3
results.
The second phase ends with the drainage of the LBE from S1A interaction vessel towards the
storage tank at t = 27544 s. Meanwhile, the water continues to be injected up to t = 27669 s, when
the injection stops
Concerning the temperatures (Fig. 8), the thermocouples TC-S1A-01 and TC-S1A-02, installed
in the interaction vessel S1A, show a rapid increase of about 20 °C, when are in contact with the
LBE. Indeed, the LBE stored in S4A is maintained at temperature of 230 °C, while the vessel
S1A is pre-heated at about 210 °C.
During the test (between Start of Test - SoT and End of Test - EoT), the thermocouples in the
water injection line from TC-S2L-03 to TC-S2L-06 record a maximum temperature of 130 °C.
The water heating occurs in the last section of the injection line. TC-S2L-07 records an average
temperature of 192 °C, which decreases when the heating cables of the injection line is switched
off. On the opposite, the TC-S2L-08, installed just before the injector, measures a nearly constant
temperature during the injection, below the saturation.
IV.C. Analysis of Acoustic Detection System data and interpretation
The main target of this application is to correlate the dimension of the orifice with the sound
pressure wave generated inside the tank. In order to achieve this result, the idea is to check the
frequency response of the sound pressure waves and to correlate the frequency change with the
diameter of the orifice.
The raw data recorded by microphones are sequentially loaded and continuously transformed in
order to have a series of Fast Fourier Transform (FFT) files from which extracting the frequency
spectrum of the bubbles.
During Test C1.3_60, the high temperature microphone in channel 1 (HT ADS) is available for
the measure and records data from 0 to 23000 s. The results of bubble frequency analysis show
two different peaks. The peak at 3300 Hz is observed during the acquisition constantly, thus both
when the water injection is on and off. Therefore, it is concluded that the signal at the frequency
of 3300 Hz represents a background noise. The other peak is measured at 1400 Hz, which is
associated with the sound of bubble rising and appearing on the melt surface. Fig. 9 reports the
FFT of a period of time during which a bubble is recorded. In this test, the characteristic
frequency for the bubble generated from the 60 μm orifice is 1400 Hz.
IV.D. Analysis of the Accelerometers and Acoustic Emission sensors data and interpretation
The analysis of the acquisitions related to HTA (high temperature accelerometer), HSA (high
sensitivity accelerometer) and AE (acoustic emission) sensors are divided into the two
phenomenological windows of the test:
1. Water injection without LBE (up to t = 5158 s)
2. Water injection in LBE (from t=5158 s SoT to t=27017 s EoT,)
During the first phase (Fig. 10), the mass flow rate of injected water into empty S1A is about 797
g/h. When the LBE starts to be charged into the interaction vessel S1A, the HTA sensor (placed
inside the vessel) records an average value of 0.07 g Root Mean Square (RMS), which represents
the HLM-water interaction. During the second phase, the mass flow rate of injected water
decreases from 586 g/h to 253 g/h, leading to HTA data trend variations from 0.12 g RMS to 0.09
g RMS, as shown in Fig. 10, which depicts the trend of the mean RMS value calculated over time
intervals of 0.5 s.
The analysis of the data acquired by the Dewesoft system and recorded by the HTA, HSA, AE
sensors highlighted the following:
1. the AE and HSA sensors, installed on the upper flange of the S1A vessel, recorded data
affected by external interferences, i.e. the compressed air flow of the sensors cooling
system. This correlation is evaluated by analyzing the start/stop signal of the sensor
cooling system and checking the correspondence between the opening/closing times of
the compressed air circuit within the acquisition of the sensors installed on the upper
flange. Thus, the data acquired in these time intervals are excluded. During the phase
“Water injection in LBE” the HSA records 0.01 g RMS and the AE records 0.35 V RMS;
2. the HTA sensor, positioned inside the S1A vessel, during the phase “Water injection in
LBE” measured different values according to the mass flow rate variation, in particular
for mass flow rate equal to 586 g/h, the HTA recorded an average value of 0.12 g RMS
and for mass flow rate equal to 253 g/h, the HTA recorded an average value of 0.09 g
RMS.
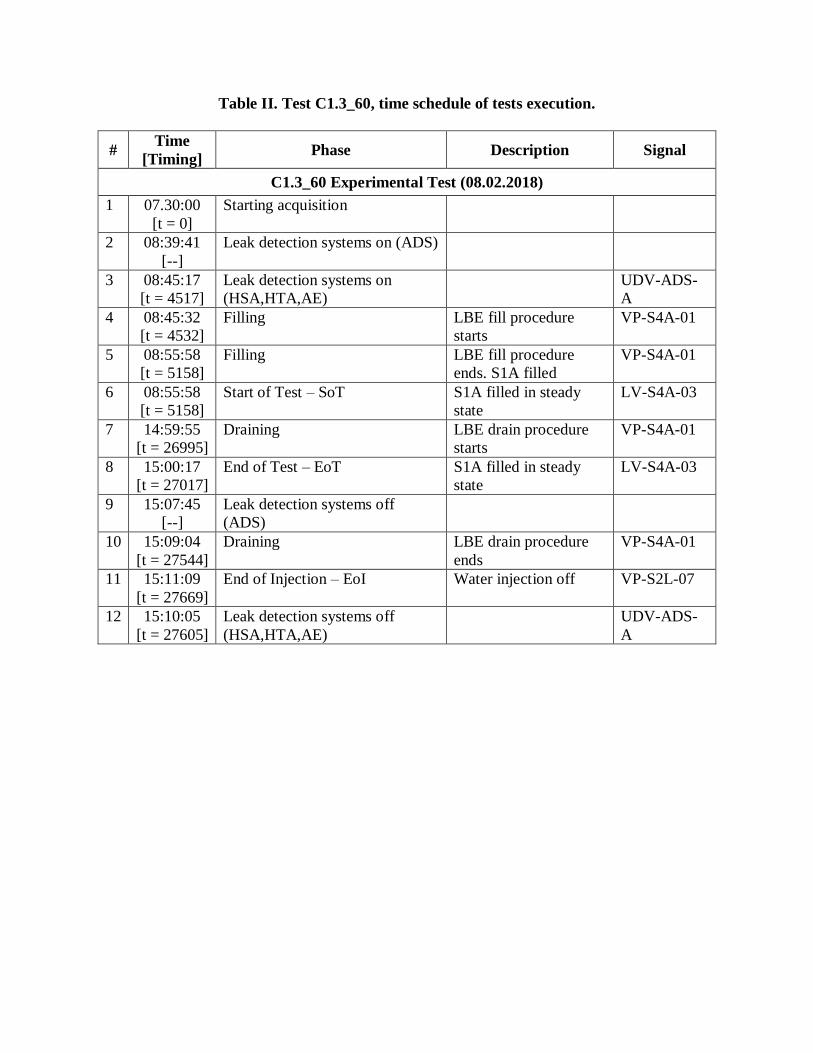
Table II. Test C1.3_60, time schedule of tests execution.
# Time
[Timing] Phase Description Signal
C1.3_60 Experimental Test (08.02.2018)
1 07.30:00
[t = 0]
Starting acquisition
2 08:39:41
[--]
Leak detection systems on (ADS)
3 08:45:17
[t = 4517]
Leak detection systems on
(HSA,HTA,AE)
UDV-ADS-
A
4 08:45:32
[t = 4532]
Filling LBE fill procedure
starts
VP-S4A-01
5 08:55:58
[t = 5158]
Filling LBE fill procedure
ends. S1A filled
VP-S4A-01
6 08:55:58
[t = 5158]
Start of Test – SoT S1A filled in steady
state
LV-S4A-03
7 14:59:55
[t = 26995]
Draining LBE drain procedure
starts
VP-S4A-01
8 15:00:17
[t = 27017]
End of Test – EoT S1A filled in steady
state
LV-S4A-03
9 15:07:45
[--]
Leak detection systems off
(ADS)
10 15:09:04
[t = 27544]
Draining LBE drain procedure
ends
VP-S4A-01
11 15:11:09
[t = 27669]
End of Injection – EoI Water injection off VP-S2L-07
12 15:10:05
[t = 27605]
Leak detection systems off
(HSA,HTA,AE)
UDV-ADS-
A
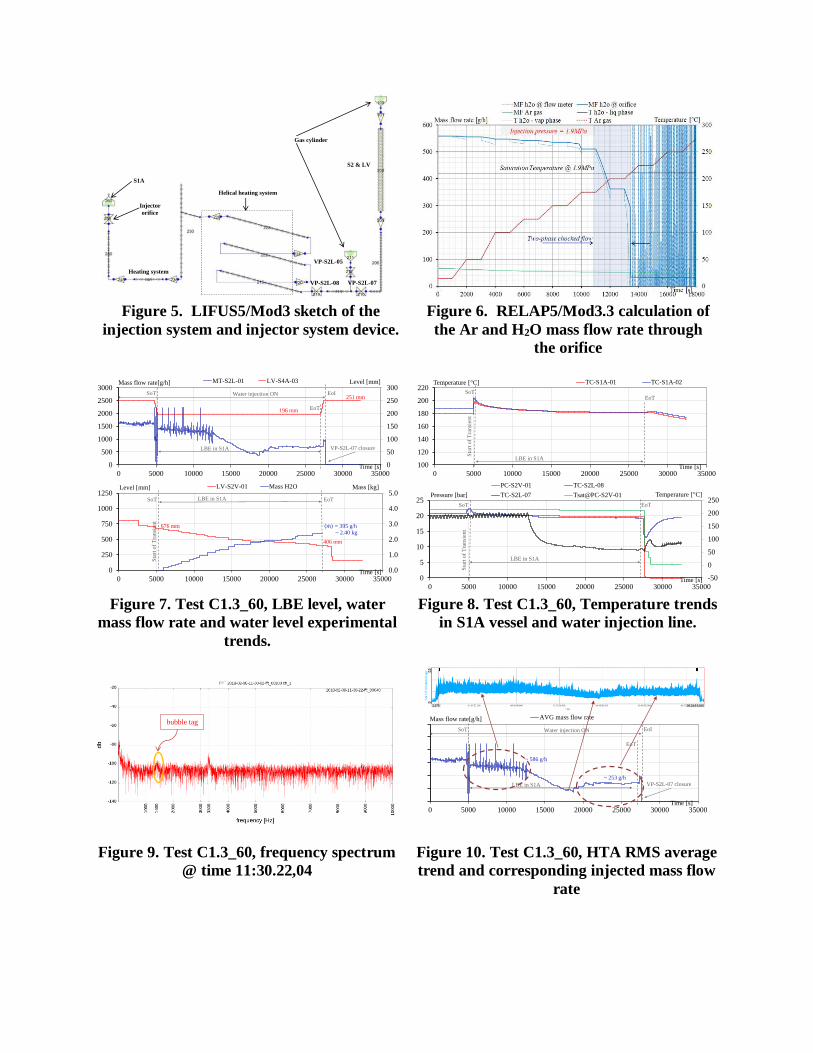
Figure 5. LIFUS5/Mod3 sketch of the
injection system and injector system device.
Figure 6. RELAP5/Mod3.3 calculation of
the Ar and H2O mass flow rate through
the orifice
Figure 7. Test C1.3_60, LBE level, water
mass flow rate and water level experimental
trends.
Figure 8. Test C1.3_60, Temperature trends
in S1A vessel and water injection line.
Figure 9. Test C1.3_60, frequency spectrum
@ time 11:30.22,04
Figure 10. Test C1.3_60, HTA RMS average
trend and corresponding injected mass flow
rate
VP-S2L-05
VP-S2L-08 VP-S2L-07
S2 & LV
Helical heating system
S1A
Injector
orifice
Gas cylinder
Heating system
0
50
100
150
200
250
300
0
500
1000
1500
2000
2500
3000
0 5000 10000 15000 20000 25000 30000 35000
Level [mm]Mass flow rate[g/h]
Time [s]
MT-S2L-01 LV-S4A-03
Water injection ON
LBE in S1A
EoI
VP-S2L-07 closure
251 mm
196 mm
SoT
EoT
100
120
140
160
180
200
220
0 5000 10000 15000 20000 25000 30000 35000
Temperature [°C]
Time [s]
TC-S1A-01 TC-S1A-02
LBE in S1A
SoT
Sta
rt o
f T
ran
sien
t
EoT
0.0
1.0
2.0
3.0
4.0
5.0
0
250
500
750
1000
1250
0 5000 10000 15000 20000 25000 30000 35000
Mass [kg]Level [mm]
Time [s]
LV-S2V-01 Mass H2O
LBE in S1ASoT
Sta
rt o
f T
ran
sien
t
EoT
~ 2.40 kg= 395 g/h676 mm
406 mm
-50
0
50
100
150
200
250
0
5
10
15
20
25
0 5000 10000 15000 20000 25000 30000 35000
Temperature [°C]Pressure [bar]
Time [s]
PC-S2V-01 TC-S2L-08
TC-S2L-07 Tsat@PC-S2V-01
LBE in S1A
SoT
Sta
rt o
f T
ran
sien
t
EoT
bubble tag
0
500
1000
1500
2000
2500
3000
0 5000 10000 15000 20000 25000 30000 35000
Mass flow rate[g/h]
Time [s]
AVG mass flow rate
Water injection ON
LBE in S1A
EoI
VP-S2L-07 closure~ 253 g/h
~ 586 g/h
SoT
EoT

V. CONCLUSIONS
Test C1.3_60 has been executed on the basis of the planned test matrix. Main objectives of the
experimental campaign are to provide experimental data to characterize the leak rate through
typical cracks occurring in the pressurized tubes and to correlate the flow rates of the leakage
with signals detected by proper transducers. The objectives of the Test C1.3_60 are successfully
achieved and the measurements will be complemented with other tests in order to verify the
correlation between orifice dimensions and signals.
The analysis of the ADS permits to recognize the energy variation and the characteristic
frequency of the bubbles generated from this orifice size. For this test, the characteristic
frequency for the bubble generated from the 60 μm orifice is 1400 Hz.
The analysis of the data acquired by the HTA, HSA, and AE sensors highlights the correlation of
the signals with the mass flow rate across the orifice (thus the leakage). In particular, during the
phase “Water injection in LBE”, the HSA and AE record 0.01 g RMS and 0.35 V RMS. The
HTA records signals with average values of 0.12 g RMS and 0.09 g RMS, when the mass flow
rate is equal to 586 g/h and 253 g/h, respectively.
ACKNOWLEDGMENTS
This work was performed in the framework of EUFP7 MAXSIMA project. This project has
funded by the European Commission under grant agreement No 323312.
REFERENCES
1. P. Lorusso, et al., “GEN-IV LFR development: Status & perspectives”, Prog. Nucl. Energy,
105 (2018), pp. 318-331, DOI: 10.1016/j.pnucene.2018.02.005.
2. A. Pesetti, A. Del Nevo, N. Forgione, Experimental investigation of spiral tubes steam
generator rupture scenarios in LIFUS5/Mod2 facility for ELFR, Proc. of ICONE24,
Charlotte, North Carolina, June 26-30, 2016, Paper No. ICONE24-60715, pp 1-11, DOI:
10.1115/ICONE24-60715.
3. A. Del Nevo, N. Giannini, A. Pesetti, N. Forgione, Experimental and Numerical
Investigations of Interaction between Heavy Liquid Metal and Water for supporting the
Safety of LFR Gen. IV Reactor Design, NURETH 2015, Vol. 9, 2015, pp. 7448-7461.
4. A. Del Nevo, et. Al., “Addressing the heavy liquid metal – Water interaction issue in LBE
system”, Prog. Nucl. Energy, 89 (2016), pp. 204-212, DOI: 10.1016/j.pnucene.2015.05.006
5. A. Del Nevo, A Pesetti, N Forgione, M. Eboli, “Experimental campaign in support of the
safety studies of the STGR in LFR”, Proc. of 18th Int. Topical Meeting on Nuclear Reactor
Thermal Hydraulics (NURETH-2019), Portland, OR, August 18-23, 2019, pp. 2398-2410, 13
pages.
6. A. Del Nevo et al., “Deliverable D4.4 – SGTR Bubbles Characteristics”, MAXSIMA Project,
April 2015.
7. A. Del Nevo et al., “Deliverable D4.6 – Final Report on the Experimental Characterization of
the Bubbles and Post Test Analysis”, MAXSIMA Project, June 2016.
8. M. Eboli, et al., “Experimental activities for in-box LOCA of WCLL BB in LIFUS5/Mod3
facility”, Fusion Eng. Des., 146 (2019), pp. 914-919, DOI: 10.1016/j.fusengdes.2019.01.113

9. 7th FP THEME [Fission-2012-2.3.1] [R&D activities in support of the implementation of the
Strategic Research Agenda of SNE-TP Nuclear Fission and Radiation Protection] – Annex I -
"Description of Work"” Grant agreement no.:FP7- 323312, October 9, 2012.
10. M. Eboli, et al., “Test C1.3_60 – EDTAR”, Technical Report L5-T-R-357, November 2018.
11. ISL Inc, “RELAP5/MOD3.3 Code Manual Volume I: Code Structure, System Models, and
Solution Methods”, Nuclear Safety Analysis Division, July 2003.