experimental characterization of
TRANSCRIPT

EXPERIMENTAL CHARACTERIZATION OF
IN-PLANE PERMEABILITY OF GAS DIFFUSION LAYERS:
INFLUENCE OF THE SATURATION LEVEL
by Amir Reza Sedigh Haghighat
A thesis submitted to the faculty of the University of Delaware in partial fulfillment of the requirements for the degree of Bachelor of Mechanical Engineering with Distinction
Spring 2009
Copyright 2009 Amir Reza Sedigh Haghighat All Rights Reserved

EXPERIMENTAL CHARACTERIZATION OF
IN-PLANE PERMEABILITY OF GAS DIFFUSION LAYERS:
INFLUENCE OF THE SATURATION LEVEL
by
Amir Reza Sedigh Haghighat
Approved: ________________________________________________ Ajay K. Prasad, Ph.D. Professor in charge of the thesis on behalf of the advisory committee Approved: ________________________________________________ Suresh G. Advani, Ph.D. Committee member from the Department of Mechanical Engineering Approved: ________________________________________________ Pei Chiu, Ph. D. Committee member from the Board of Senior Thesis Readers Approved: ________________________________________________ Ismat Shah, Ph. D. Chair of the University Committee on Student and Faculty Honors

iii
ACKNOWLEDGMENTS
I gratefully acknowledge the contribution and assistance of the following individuals and departments in the preparation of this work.
Department of Mechanical Engineering
My advisors
Dr. Ajay K. Prasad and Dr. Suresh G. Advani
My peer and mentor Dusan Spernjak, Ph. D. Candidate
Master Machinist Steve Beard
Team Mates
Justin Merotte and Tejas Canchi
Lab Coordinator Roger F. Stahl
Lab Mates
Dr. Feng Yuan Zhang and Dr. Krishnan Palanichamy Srikanth Arisetty Ph. D. Candidate
Toray Industries Inc for providing the testing material
Undergraduate Research Program
I would also like to thank Center for Composite Materials (CCM), Physics Department (Sharp Lab), Mrs. Amy Adams, Mrs. Elizabeth Bonavita, Mrs. Ann Connor, and Mrs. Lisa Katzmire for their generous help.

iv
TABLE OF CONTENT
LIST OF FIGURES ..................................................................................................... v ABSTRACT ................................................................................................................. vi Chapter 1 INTRODUCTION 1.1 Introduction and Literature Review ...................................................... 1 1.2 Purpose .................................................................................................. 6 1.3 Materials ................................................................................................ 6 1.4 Radial Flow in Porous Media ................................................................ 6
2 EXPERIMENTAL METHODS 2.1 Experimental Procedure ........................................................................ 8
3 RESULTS and DISCUSSION 3.1 Results ................................................................................................. 26 3.1.1 Continuous Runs ............................................................... 26 3.1.2 Discontinuous Runs........................................................... 37 3.2 Discussion ........................................................................................... 39 3.2.1 Equipment Checks and Improvements .............................. 39 3.2.2 Calibration – Correction Factor......................................... 40 4 CONCLUSION ............................................................................................... 42 REFERENCES ........................................................................................................... 48 APPENDIX A ............................................................................................................ 50
ARBIN TEST STAND HUMIDITY CORRECTION FACTOR

v
LIST OF FIGURES
1.1.a PEMFC Input/output ......................................................................................... 2 1.1.b PEMFC Schematic ............................................................................................ 3 1.2.a Examples of different structures of the GDL materials ..................................... 5 1.2.b Water condensation within the GDL pores ....................................................... 5 2.3 Excel Template ................................................................................................ 10 2.4 Schematic of Land regions, the Channel, GDL, MEA and Flow of Fluids .... 11 2.5 Four Dry GDL ready to weighted ................................................................... 12 2.6 Submerged GDLs in Pure Water ..................................................................... 13 2.7 Arbin Instrument Fuel Cell Test Stand ........................................................... 15 2.8 Press, Pressure Sensors, Heater Controller, Heater, and Chamber ................. 16 2.9 DC Power Supply, Fan, Data Acquisition Laptop .......................................... 17 2.10 Schematic of the Experimental setup to simultaneously measure permeability and monitor water content.......................................................... 19 2.11 Open Chamber, Shim Stocks, O-Ring, Heater, Inlet, Outlet .......................... 20 2.12 Air Inlet and Outlet ......................................................................................... 21 2.13 Scale, Insulating Box, Separating Shims, Drierite Desiccants ........................ 22 2.14 Overall picture of the experiment set up ......................................................... 23 2.15 Scale Data Acquisition computer .................................................................... 24 2.16 Arbin Test Stand Computer............................................................................. 25 3.17 Pressure Difference Across Inlet and Outlet ................................................... 28 3.18 Captured Water in Drierite Desiccant ............................................................. 29 3.19 Flow Rate, Dew Point, Inlet, and chamber Temperature, Pressure Difference Across Inlet and Outlet, Mass of Water Capture by Drierite Desiccant ......... 30 3.20 Direct Inverse relation of Pressure Difference Drop vs. Permeability ............ 31 3.21 Inlet, Outlet Water and Removed Water from GDLs ..................................... 32 3.22 GDL Saturation vs. Pressure Difference Drop ................................................ 35 3.23 Permeability vs. GDL Saturation (continuous Runs) ...................................... 36 3.24 Permeability vs. GDL Saturation (Discontinuous Runs) ................................ 38 3.25 Dry GDL test, Step Function Running from 0.5 to 4 SLPM – 4 Run Over Lapping ..................................................................................... 41 4.26 Toray Trial 13 Showing Water captured, Calculated, and Removed Along with Permeability and Saturation of GDLs .......................................... 45 4.27 Toray Trial 15 Showing Water captured, Calculated, and Removed Along with Permeability and Saturation of GDLs .......................................... 46 4.28 Preliminary Results of Discontinuous Runs.................................................... 47

vi
ABSTRACT
Proton Exchange Membrane Fuel Cell or Polymer Electrolyte Membrane Fuel
Cell (PEMFC) is a promising energy conversion device due to its clean and efficient
operation. Gas Diffusion Layer (GDL), a thin porous material, is one of its key
components. It has been shown that by tailoring the GDL properties one can increase the
PEMFC performance significantly. Characterizing the material properties is very
important for material selection in a design process. The focus of this work is to
experimentally measure an important property of the GDL material: permeability (or
more specifically in-plane permeability, since the material is typically not isotropic).
Water is the byproduct of the fuel cell reaction. During the PEMFC operation,
water often condenses within the GDL pores thus hindering the gas flow and blocking the
gas access to the reaction sites (catalyst layers). The main goal of our experiments is to
measure the influence of the water content within the porous GDL (or, saturation) on the
in-plane permeability.
Convection is often a key mode of reactant transport, and its influence varies
depending on the channel configuration. As the materials are porous, one can use the
porous media theory of Darcy’s law to describe the convective transport for which one
should first characterize the permeability of the material which is an input required in
Darcy’s law which relates the flow rate through a porous material with the pressure drop
experienced by the fluid. So convection is important and to model convection, one needs

vii
to measure permeability of the GDL. GDL is anisotropic; hence one must characterize
in-plane (and through-plane) permeability. Water condenses in the GDL pores, so one
must be able to describe permeability as a function of the saturation level.
For the purpose of this investigation, the in-plane permeability of the dry GDLs
was compared to the in-plane permeability of the wet (i.e. water-saturated) GDL’s for
different saturation levels. . For future work, different types GDLs are to be compared to
each other in addition to the effect of coating GDL with Teflon, to change the
hydrophobicity level of the GDL, and its permeability and saturation level.
Findings and results of this project include the measurements for plain carbon
paper (TGP-H-060 by Toray Industries, Inc.). Due to several major problems, primarily
coming from the complexity of the experimental setup, accruing more reliable data for
the above GDL type, as well as comparing the data for different GDL types, has been
postponed for the future. During the project, we have encountered several difficulties as
follows: Scale malfunction, test stand inaccuracy, a number of hidden leaks in the
plumbing of humid air, and condensation of water in the chamber manifolds. All the
former problems have been addressed and the only problem left to solve to get very
accurate data is to find out where water condenses in the tubes. This would help
explaining less water collected at the end of the experiments compare to how much it is
put in. The condensation problem is greatly reduced by running experiments with dry
inlet air.
Exponentially increase of permeability in the beginning of the run could be due
to the water being pushed out by force rather than drying over time which is actually

viii
desired. Result curves start to smooth out for permeability around 40% saturation and
flatten out until GDLs gets dry.
1
Chapter 1
INTRODUCTION
1.1 Introduction and Literature Review
PEM fuel cell combines hydrogen and oxygen to produce electric power, with
heat and water as byproducts (Figure 1a-b). The gases on either side of the cell (H2 on
cathode and O2 on the anode) are transported through the channels of the bipolar plates,
then through the porous gas diffusion layers (GDLs) to finally reach the catalyst layers
where the reactions take place (see figure 1b for details). GDL is one of the main
components of the cell. This complex porous material provides a pathway for reactant
supply and product removal. It also provides mechanical support for the Membrane
Electrode Assemblies (MEA), electronic conductivity, path for heat removal, and water
transport through supply and exhaust gases coming and going out respectively. MEA is
the heart of a fuel cell. It consists of the ion-exchange membrane, anode and cathode
catalyst electrodes.

Considerable amount of work has been devoted to characterization of the GDL properties
for this multifunctional material, and examining how individual material properties affect
the cell performance. Figure 2 shows the microstructure of various types of GD
materials which are made of carbon fibers which may be woven or present in loose strand
form or discontinuous direct function of the GDL’s permeability
Fenton, 2004).
2
Figure 1a: PEMFC Input/output
Considerable amount of work has been devoted to characterization of the GDL properties
for this multifunctional material, and examining how individual material properties affect
the cell performance. Figure 2 shows the microstructure of various types of GD
materials which are made of carbon fibers which may be woven or present in loose strand
form or discontinuous direct function of the GDL’s permeability (Williams, Kunz, &
Considerable amount of work has been devoted to characterization of the GDL properties
for this multifunctional material, and examining how individual material properties affect
the cell performance. Figure 2 shows the microstructure of various types of GDL
materials which are made of carbon fibers which may be woven or present in loose strand
(Williams, Kunz, &

3
Figure 1b: PEMFC Schematic (Spernjak, Advani, & Prasad)
Permeability is one of the major parameters controlling fresh gases coming in and
produced water going out of PEMFC as shown in Figure 3. Ahmed et al (Ahmed, Sung,
& Bae, 2008a) believe transportation of reactant and water in and out of the PEM fuel
cells depend strongly on permeability of GDL. Permeability functions of GDL become
more important in land region as it is under compression due to the clamping force versus
the channel region. Numerical investigations have been performed by Ahmed et al
(Ahmed, Sung, & Bae, 2008b) to explore characteristics of GDL under clamped force
since not only does the permeability decrease due to compaction but too much force can
also damage the membrane. Pore network modeling of GDL has been done by Gostick et
al (Gostick, Ioannidis, Fowler, & Pritzker, 2007) to highlight an imperative need to
confirm all the modeling and numerical methods with experimental measurements and
study the effects of water saturation on permeability of GDLs. A desired GDL, pointed
out by Hung et al (Hung et al., 2008) , should have a flexible surface for better contact

4
with neighboring components, low electric resistivity for transmission of electrons,
optimal hydrophobicity for good water removal, and has an effective transportation path
for fresh gases entering the cell and products exiting the cell. Convective transport plays
an important role in a serpentine cell, Williams et al (Williams et al., 2004).
Convection is often a key mode of reactant transport, and its influence varies
depending on the channel configuration (i.e. the flow field of the bipolar plate). In a
serpentine channel, portion of the flow goes under the ribs between the adjacent lands so
it means more flow under the lands. In dead ended (or, interdigitated) channels, the entire
flow is convected under the lands so higher permeability translates into requirements of
less pumping power. As the materials are porous, one can use the porous media theory of
Darcy’s law to describe the convective transport for which one should first characterize
the permeability of the material which is an input required in Darcy’s law which relates
the flow rate through a porous material with the pressure drop experienced by the fluid.
To summarize:
• Convection is an important mode of transport in an operating PEMFC
• To model convection via Darcy’s law, one needs to measure the permeability of the GDL
• GDL is anisotropic, hence one must characterize in-plane (and through-plane) permeability
• Water condenses in the GDL pores, so one must be able to describe permeability as a function of the saturation level

5
Figure 2b: Water condensation within the GDL pores [(Nam & Kaviany, 2003)] ESEM
Figure 2a: Examples of different structures of the GDL materials [(Spernjak, Prasad, & Advani, 2007)]
5

6
1.2 PURPOSE
The focus of this work is to experimentally measure an important property of the
GDL material: permeability (or more specifically in-plane permeability, since the
material is typically not isotropic). Water is the byproduct of the fuel cell reaction, and it
often condenses within the GDL pores thus hindering the gas flow. The main goal of our
experiments is to measure the influence of the water content within the porous GDL (or,
saturation) on the in-plane permeability. Permeability of different GDLs with different
hydrophobicity is intended to be measured and compared containing different water
contents. The ultimate goal is to characterize the in-plane permeability as a function of
water saturation in the GDL.
1.3 MATERIALS
Two different GDLs (Toray and SGL) were used. Only Toray GDLs was treated
with Teflon solution to change the hydrophobicity level of the GDL. Thin layers of
stainless steel shim stock are used to separate GDLs during the experiments. Water and
humidified air was used to perform the experiments. The testing material was donated by
Toray Industries Inc.
1.4 RADIAL FLOW IN POROUS MEDIA
One can solve for flow rate and pressure drop relationship for flow of a
compressible fluid through a porous media using Darcy’s law and mass balance (Feser,
Prasad, and Advani 2006, 1226-1231). This relation is listed in Equation (1) as follows.
Eq (1),
7
)/ln( iror
hPiK
outQµ
π= Eq (2),
where Q is the volume flow rate, h is the thickness, µ is dynamic viscosity, ro and ri are
outer and inner radii of the sample, ki is permeability, h is the thickness of the sample,
and Pi and Po are inlet and outlet pressures. For our experimental setup, ki is the in-plane
permeability. The only unknown in this equation is ki since everything else is known or
can be measured. By controlling the flow rate by the Arbin test stand and by measuring
the inlet and outlet pressures (i.e. pressure differential), one can calculate the
permeability.
Eq 1 is non-linear equation while Eq 2 is linear equation that it is used in the calculation
of permeability. Eq 2 was used since the pressure differential between inlet and outlet
was big enough and changes in those pressure relatively were small, so linear equation is
valid in this case.
The second part of our experiment is to independently evaluate the saturation level of the
GDL samples. GDLs are weighed before and after they are wetted so the amounts of
water hold by GDLs are known when experiment starts. At the end of the run GDLs are
measured again to record water quantity left inside. Knowing all this plus relative
humidity supplied would give the total amount of water.

8
Chapter 2
EXPERIMENTAL METHODS
2.1 EXPERIMENTAL PROCEDURE
The experimental procedure involves evaluation of two quantities: in-plane permeability
and the saturation level. Related to the latter quantity, we have explored two
experimental procedures:
(a) the saturation level was continuously varied and determined via water balance.
(b) short, discontinuous tests where saturation level was pre-determined (not
involving the water balance setup, thus eliminating the influence of water
collecting in the setup on the measurement accuracy).
To avoid race-tracking, we have opted for a radial setup, similar to the one used
previously by Feser et. al (also in Fig.9). Thus, the GDL samples were cut into donut
shapes, with 6 inches outside and 4 ½ inches inside diameters. To mitigate the effect of
race-tracking between the GDL samples and the compression plates, as well as to ensure
a sufficient cross-section for the average flow (since the GDLs are very thin, 0.2 mm),

9
four GDL ‘donuts’ were stacked in the radial-flow chamber, To avoid ‘nesting’ of the
carbon fibers between the GDL sheets, the ‘donuts’ in the chamber were separated by
shim-stock cut to the same size as the samples.
Experimental procedure includes the following steps:
1. Measuring the weight of the dry GDL samples
2. Pre-impregnating the GDL samples with water
3. Setting the desired saturation level of the samples
4. In-plane permeability measurements (by controlling the air flow through the test
chamber while measuring the pressure differential between the chamber inlet and
outlet).
5. Post-measurement procedure: checking the water content retained in the samples after
the test.
The five steps above were mainly used to runs experiments and they constitute the
continuous runs. There are discontinuous runs used to collect data after modifying the
set up and using stop and start method to directly measure water content in GDLs, hence
no water balance used to measure water in the exit air, but instead used to measure the
weight of GDL directly.

10
Excel template generated by Mr. Spernjak is used to keep track of experiments
conditions such as GDL porosity, thickness, compression ration, saturation level, before
and after test weight of GDLs.
Figure 3 : Excel Template

11
The goal of this experiment set up is to regenerate the same conditions as if the
GDLs were in an operating fuel cell. The following schematic shows water condensation
in paths of the fluids in an operating fuel cell. This is the main driving force behind the
hypothesis. In- plane permeability of GDL is a function of degree of saturation.
Figure 4: Schematic of Land regions, the Channel, GDL, MEA and flow of fluids

12
Figure 5: Four Dry GDL ready to weighted
First, dry weight of the 4 donuts together is measured and recorded. Samples are
then submerged in de-ionized water and placed in the vacuum chamber to force the water
into the GDL pores. Without the vacuum, water does not fully penetrate into GDL pores
since the GDL material is slightly hydrophobic. GDLs are under vacuum, about −28
inHg, for about 3 min and after vacuuming they are kept under water until other
preparation steps are done. Thus, at the end of the pre-impregnation step, GDL samples
are fully saturated with water (saturation = 100 %). Effectiveness of the pore-filling was
evidenced by taking images of the water-filled pores via optical microscope. Fully
saturated, wet samples are then placed on a scale and left for water to evaporate until the

13
desired saturation level of the samples is reached. Initial saturation level for continuous
tests was around 60 %, to avoid forcing water out of the GDL pores when the samples are
compressed in the test chamber.
Figure 6: Submerged GDLs in Pure Water

14
While the GDL samples are dried to the desired saturation level, test stand is
turned on so it can get ready to supply the air at desired flow rate, temperature, and
humidity. The test stand requires a certain warm-up time to reach steady operation. Dew
point temperature (DPT) is set at 23 degree Celsius and exit air temperature is set at 27
degree Celsius so about 80% humidity is achieved. Air is fed to the testing chamber at 1.5
standard liters per minute (SLPM).

15
Figure 7: Arbin Instrument Fuel Cell Test Stand
While test stand is warming up the test chamber it also needs to be heated to the
desired temperature. This is done with heaters around the chamber. To avoid
condensation, chamber temperature is set from 28 to 30° C. Chamber is placed in a press
16
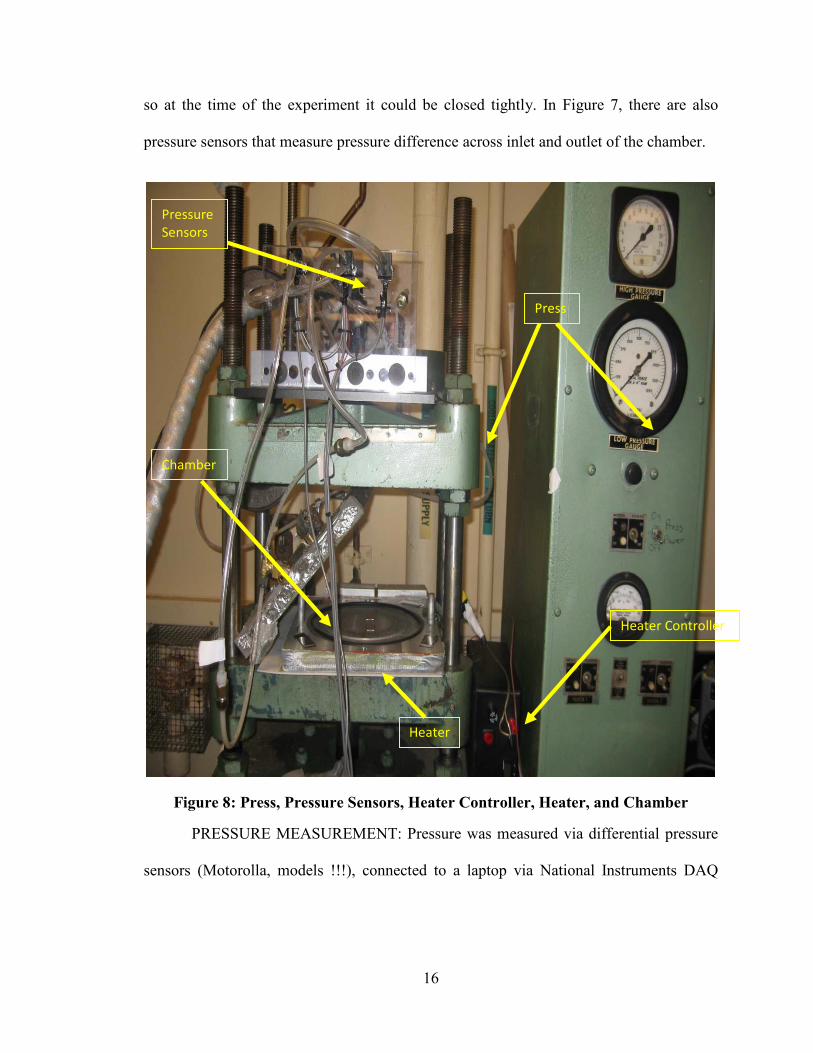
so at the time of the experiment it could be closed tightly. In Figure 7, there are also
pressure sensors that measure pressure difference across inlet and outlet of the chamber.
Figure 8: Press, Pressure Sensors, Heater Controller, Heater, and Chamber
PRESSURE MEASUREMENT: Pressure was measured via differential pressure
sensors (Motorolla, models !!!), connected to a laptop via National Instruments DAQ
Chamber
Pressure Sensors
Heater Controller
Press
Heater

17
card. Data was recorded using LabView, while the pressure sensors were powered with a
DC supply as shown in the picture in Figure 8.
Figure 9: DC Power Supply, Fan, Data Acquisition Laptop
Fan
DC Supply
Data Acquisition Unit

18
CHAMBER TEMPERATURE CONTROL: A fan is used to cool down the
chamber and maintain a more uniform temperature. Heaters are controlled via Omega
temperature controller, and are shown in red/orange color and cover around the chamber .
The chamber temperature was maintained between 28 and 30° C (figures 7 and 9).
COMPRESSION and THICKNESS CONTROL: The GDL samples in the
chambers were compressed to a desired thickness, which was controlled by shim stocks
with very precise thickness. Ratio of compressed and uncompressed GDL thickness was
0.8, which is a value commonly encountered in a fuel cell assembly. Chamber has shim
stocks in its corners and in the middle so correct compression ratio is achieved within the
GDLs across the chamber area. O-ring is used here to ensure the chamber is sealed.

19
Figure 10: Schematic of the Experimental setup to simultaneously measure permeability and monitor water content (i.e. saturation)
Convection of humid warm air into wetted GDLs is schematically shown in Figure 15.
Figure 16 shows the experimental set-up that is used to measure the permeability and
simultaneously record the water content within the GDL.

20
Figure 11: Open Chamber, Shim Stocks, O-Ring, Heater, Inlet, Outlet
Shim Stocks
O-Ring Heater
Inlet
Outlet

21
Figure 12: Air Inlet and Outlet
Inlet Air
Outlet Air
Inlet Air
Inlet Air

22
GDL SATURATION LEVEL MEASUREMENT DURING CONTINUOUS
TESTS: The air was passed through a water balance setup placed downstream from the
test chamber. The air passed through a dessicant column placed on a scale: water is
removed from the air stream while passing through the dessicant, while the weight
change over time was recorded by the scale. To insulate the scale a transparent box is
made to hold the scale and the water trapping unit (drierite desiccant) so any vibration
and air flow would be kept outside of the box helping the readings from the scale to be
more accurate.
Figure 13: Scale, Insulating Box, Separating Shims, Drierite Desiccants
Drierite Desiccants
Insulating Box
Separating Shims
Scale

23
Figure 14: Overall picture of the experiment set up
Connection Tube, Exit from the Chamber
Supply Air from Test Stand

Computer is used as Data Acquisition to record scale data and the Arbin test stand data.
Scale C
omputer24
Figure 15: Scale Data Acquisition computer

In addition
compared to the c
used (commonly us
Arbin C
omputer25
Figure 16: Arbin Test Stand Computer
, untreated Toray carbon paper is used as a base case, and will be
ase where treated GDL with PTFE, to make it more hydrophobic, is
ed for passive water management in fuel cells).

26
Chapter 3
RESULTS and DISCUSSION
3.1 RESULTS
3.1.1 CONTINUOUS RUNS
Data shows same correlation in each test and among them. All the errors are taken
care of by this point and results are promising but the only problem left to address is the
final water content? which is still less than initial water content. Matlab codes, courtesy
of Mr. Spernjak, are used to process the data and to plot the data. Plots are self
explanatory hence only a brief explanation will be provided. More detailed explanation
will be given is the results chapter. I have chosen two sets of data out of many runs to
show the results and their consistence correlation and the fact that I could reproduce same
results in each run. It is known that different kind of GDLs have different performance
but here I am trying to show that this performance is depended on the saturation of the
GDLs within one kind or manufacture brand. There are calibrations and correction
factors that are used to process and plot these data; these calibrations and corrections are
explained in more detail in Equipment Checks and Improvements, section 3.2.1.
Following figures are all taking in the same testing conditions such as 1.5 Standard liters
Per Minute (SLPM), 80% relative humidity for inlet air, 60% initial GDL saturation,

27
chamber temperature is from 28 to 30 degree Celsius, Air temperature going to set up is
27 degree Celsius with 23 degree Celsius dew point temperature.

28
Figure 17: Pressure Differential between Inlet and Outlet

29
Figure 18: Captured Water in Drierite Desiccant

30
Figure 19: Flow Rate, Dew Point, Inlet, and chamber Temperature, Pressure Difference Across Inlet and Outlet, Mass of Water Capture by Drierite Desiccant

31
Figure 20: Direct Inverse relation of Pressure Difference Drop vs. Permeability

32
Figure 21: Inlet, Outlet Water and Removed Water from GDLs

33
Figure 21 shows water balance in two of trial (trials 13 and 15). All conditions are
the same for these two runs and other runs which are not shown here. The Y-axis on the
left side of the plot measures the water mass in grams for the green and blue lines in both
plots. The other Y-axis on the right side of the plot has the same unit, water mass in
grams, but has a smaller range since the red line has a smaller magnitude relatively to the
other two, green and blue, lines. Green line represents the amount of water which was
introduced by inlet air to the testing chamber. Inlet air to the testing chamber comes from
the test stand with 23 degree Celsius dew point temperature and 27 degree Celsius exit
temperature making it about 80% humid at time of the entrance to the testing chamber.
Blue line shows the total water captured at the exit of the chamber and it should
be consisted of water inside the humid inlet air plus the total amount of water that existed
in the GDL when the test had began (GDLs are about 60% saturated before the start of
the experiments).
So red line plus green line gives the blue line, but there is a problem with these
results. As I will mention in conclusion, it turn out that the amount of water presented by
the red line is not the complete representation of the water that existed in the GDL. It is
desired to see red line to finish at about four gram of water which is what it is in the
GDLs when the test starts. In other words, even thought air passing through the chamber
picks up water from the GDL and leaves it almost completely dry, all that water, that was
picked up by air, doesn’t show up in the water capturing system at the exit of the

34
chamber. In consequence of water being lost, water output doesn’t equal the water input
and this is the area that needs more work to be fixed.
In other words,
1. water leaving the GDL sample, but NOT recorded by the scale, resulting in an
inaccurate evaluation of the saturation level (this is why we switched to
discontinuous short tests)
2. Additional issue with Arbin humidifiers: this is why we switched from humid to
dry air.

35
Figure 22: GDL Saturation vs. Pressure Difference Drop

36
Figure 23: Permeability vs. GDL Saturation (Continuous Runs)

37
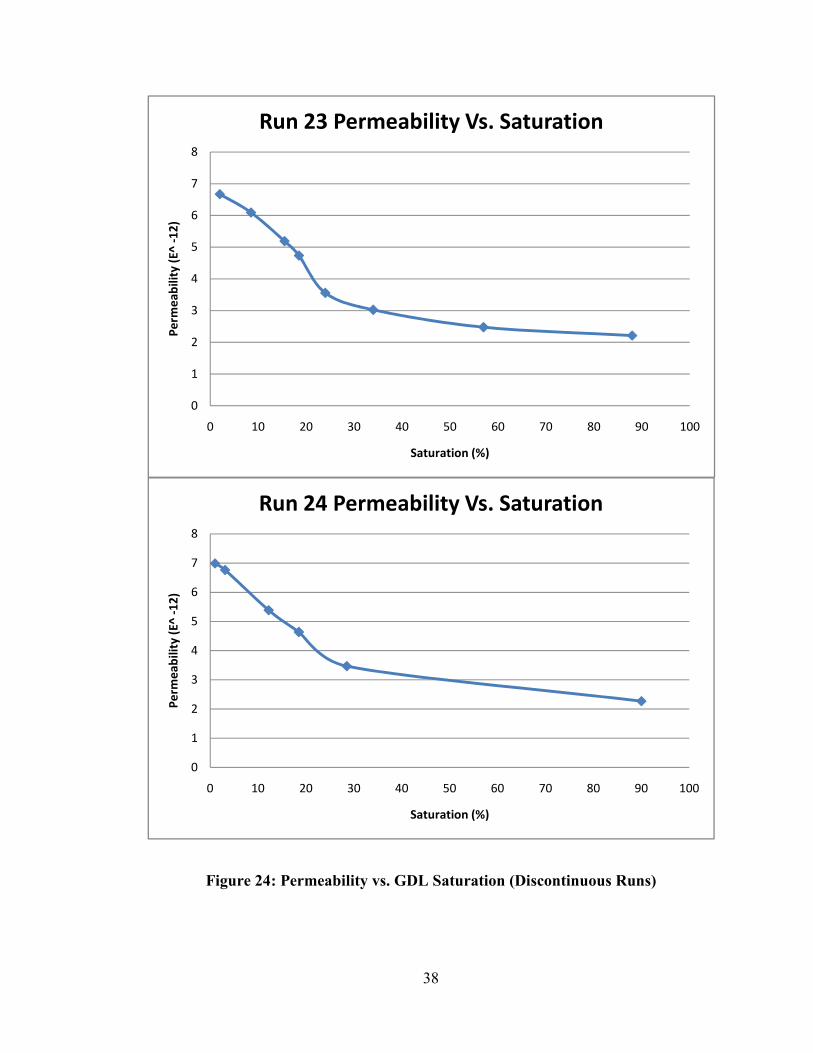
3.1.2 DISCONTINUOUS RUNS
To be sure the results in the continuous runs are accurate repeatable even when
experiments are not run continuously, discontinuous runs were performed. In these runs
instead of a long few hours runs, in each run the test was periodically stopped and started
in order to manually measure and observe the behavior of GDL and its water content. In
this process instead of measuring the water content of exit air of the testing chamber, the
test was interrupted and samples were taken out to be measured directly on scale and
quickly put back in the chamber to continue the test. In this way one can have direct
measurement and understanding of water content in the running GDLs.
CORRECTION: Reason for switching to discontinuous tests is to avoid the issue
with the water balance.
Emphasize that in the short tests, we are only considering INITIAL data points,
while the saturation level of the GDL was measured BEFORE placing the sample in the
chamber. (How much water remains in the sample after the test is ONLY important for
the subsequent test, and it has nothing to do with the previous test.)
38
Figure 24: Permeability vs. GDL Saturation (Discontinuous Runs)
0
1
2
3
4
5
6
7
8
0 10 20 30 40 50 60 70 80 90 100
Perm
eabi
lity
(E^
-12)
Saturation (%)
Run 23 Permeability Vs. Saturation
0
1
2
3
4
5
6
7
8
0 10 20 30 40 50 60 70 80 90 100
Perm
eabi
lity
(E^
-12)
Saturation (%)
Run 24 Permeability Vs. Saturation
39
3.2 DISCUSSION
Both continuous and discontinuous runs gave very close matching comparable
results; but since the results are not consistent with what is expected, it was decided to
investigate the function of all the equipment. Flow meters and humidity of air supply
from test stand, scale, heaters, pressure sensors, drierite desiccant, and shim stocks were
all checked. The flow rate was altered and dew point temperature was changed to
improve the overall outcome of the tests. Some inaccuracies were uncovered in the
equipment that is offset by correction factor and other improvements, but at one point
scale malfunctioning was discovered and needed to be repaired. Overall improvement has
been made to the overall testing procedure and equipments.
3.2.1 EQUIPMENT CHECKS AND IMPROVEMENTS
Flow rate of the supply air from Arbin Instrument fuel cell test stand is checked
and it is in agreement with manufacturer specifications. I checked the test stand at 1, 1.5,
and 2 SLPM and results were 0.99, 1.48, and 2.07 respectively.
Original set up with bigger scale and bigger drierite desiccant had large error
associated with it. Setup has been modified to eliminate those errors. New scale with
much smaller weight detection range and new smaller drierite desiccant replaced the old
set up. Since the previous flow rates and dew point temperature were selected for old set
up these quantities were also changed. Flow rate is decreased from 2 SLPM to 1.5 SLPM,

40
and dew point temperature was decreased to 20 degree Celsius from 23 degree but then
since there was not any sensible effect from this change to the dew point temperature, it
ended up going back to 23 degree Celsius.
Heaters were added to the set up since the old heaters had a hard time keeping up
the chamber temperature, especially on cold days of winter.
New shim stocks were added to the set up for two reasons. First the old shim
stocks were not capable of given me the exact compression I intended to have and having
only four set of them on four corners raised the concern that chamber might cave in under
eight ton of pressure in the middle (only) from the press during few hours of experiment.
New shim stocks gave me the exact compression ratio and in addition to four corners two
more set of them were added to the middle on the chamber to insure the chamber doesn’t
cave in during the test (please see figures 8 and 11).
3.2.2 CALIBRATION – CORRECTION FACTOR
One of the corrections is to Arbin test stand that provided humidity in supply air.
In practice the humidity of the air provided is less than 80% which the set value for
Arbin. The correction factor came out to be 0.82585 after running few direct scale run
where the air is feed directly to the scale and water content is measured. Plots and
calculation for this correction factor is provided in the appendix A.

41
Very small but effective leaks were detected in more than couple of places during
months of experiment done. The following plot shows three runs before the leak was
fixed and then the fourth dry run is with the fixed leaks. The result is corrected pressure
difference drop I should be expecting at the end of the wet GDL test.
Figure 25: Dry GDL test, Step Function Running from 0.5 to 4 SLPM – 4 Run Over Lapping

42
Chapter 4
CONCLUSIONS
From both continuous and discontinuous runs, it is understood that in-plane
permeability as function of saturation has a big jump as saturation level shifts either up or
down around 40% saturation. In general permeability has inverse reaction to saturation,
meaning as saturation changes permeability also shows similar behavior, except around
40% saturation. The reason for this sudden jump in not well understood and need further
investigation beyond scope of this work. But there is at least one or more fixes that is
needed to be done to finally get the results that is expected. Water is still lost during the
experiment meaning water inlet from test stand humid air plus water inside of the wet
GDL doesn’t all end up collected in the drierite desiccant sitting on the scale. Following
figures 26 and 27 will explain the problem with the water being lost in the process. Upper
graph in each figure has three lines, total water captured in the desiccant (blue line),
humidity/water supplied by test stand (green line) and their difference (red line) which
should the total amount of water initially in the wet GDL, but it is not. Equation 1)
following each figure adds up red line final amount, the first number, to the water
retained in the chamber, second number, to calculate total water capture from GDL after
the test. All of the tests are run with GDLs at about 60% saturated so all have about 3.93
grams of water in them. Equation 2) subtracts total water captured from GDLs in
43
equation 1) from initial water amount; the result is how much water is lost in the process.
Possible reason is condensation in different connections and tubes even though most of
them are heated (see figure 14 for heater wrapped chamber exit). Two different checks
will be done in the attempt to fix this problem. First I will run direct scale test with empty
chamber. Everything will be exactly the same as the real test except that the chamber will
be empty and no GDL will be placed in it. This will show indeed if there is water
condensation anywhere in the set up. Second chamber will be flipped upside down to
prevent any condensation in the current upward going outlet.
Lower part of figures 26 and 27 shows the relation between the GDLs saturation
and Permeability of them. The start and ending correlations are correct and expected.
When the saturation level is high permeability is low, 2.25 E^-12, and vice versa, 7 E^-12
when it is dry (from discontinuous runs). The only problem is that the saturation curve
doesn’t show the sudden jumps that is visible in the permeability curve and I think it is
due to the water lost problem. The reason I think the water lost is the reason for not
exactly inversely matching these two curves is because recording points are not the same.
Permeability inversely exactly follows the pressure drop difference across inlet and outlet
(please see the figure 20) since recording point of the data is the same place, in the
chamber. But the water collected is about 3 feet away from the chamber and there is no
other good way to shorten this distance. The tube connection is well wrapped with
heaters (see figure 14) but there is possibility of condensation along the way. There is
also the problem of drierite desiccant acting very transient to the changes. The big
changes and sudden jump are smoothen out in saturation curve since the desiccant is

44
away from the chamber and for water to reach desiccant there always be a lagging in
time. Permeability curve start concaving down then up and finally down again and if one
take a close look at the saturation curve about the same time inverse of those take place.
Saturation curve start with concaving up then down and finally up again but just doesn’t
shows the dramatic changes seen in the permeability curve.

45
Figure 26: Toray Trial 13 Showing Water captured, Calculated, and Removed Along with Permeability and Saturation of GDLs
1) 2.837 + 0.355= 3.192g (total Water captured) 2) 3.93 – 3.192 = 0.738 g (lost, missing water)

46
Figure 27: Toray Trial 15 Showing Water captured, Calculated, and Removed Along with Permeability and Saturation of GDLs
1) 2.897 + 0.28 = 3.177 g (total Water captured) 2) 3.93 – 3.177 = 0.753 g (lost, missing water)

47
Figure 28: Preliminary Results of Discontinuous Runs
Above plot is a preliminary result of discontinuous runs which combines result of
discontinuous runs. Only four discontinuous runs were performed compared to more than
thirty runs of continuous, so more tests are needed to ensure reliability of measurements.
From data obtained from discontinuous runs, we see that the permeability reduces from
0.7 E-11 m2 (for dry GDL) to 0.225 E-11 m2 (for saturation level of 60 %). Thus, the
relative change in permeability is 2.8 times! (or, permeability decreases 2.8 times when
saturation level increases from zero to 60 %).
Combined Runs Permeability Vs. Saturation
y = -4E-06x3 + 0.0014x2 - 0.1429x + 7.2078
R2 = 0.9221
0
1
2
3
4
5
6
7
8
0 10 20 30 40 50 60 70 80 90 100
Saturation (%)
Perm
eabi
lity
(E^
-12)
Permeability Vs. Saturation

48
REFERENCES
Ahmed, D. H., Sung, H. J., & Bae, J. (2008a). Effect of GDL permeability on water and thermal management in PEMFCs—I. isotropic and anisotropic permeability. International Journal of Hydrogen Energy, 33(14), 3767-3785.
Ahmed, D. H., Sung, H. J., & Bae, J. (2008b). Effect of GDL permeability on water and thermal management in PEMFCs—II. clamping force. International Journal of Hydrogen Energy, 33(14), 3786-3800.
Feser, J. P., A. K. Prasad, and S. G. Advani. 2006. Experimental characterization of in-plane permeability of gas diffusion layers. Journal of Power Sources, 162, (2) (11/22): 1226-31.
Gostick, J. T., Ioannidis, M. A., Fowler, M. W., & Pritzker, M. D. (2007). Pore network modeling of fibrous gas diffusion layers for polymer electrolyte membrane fuel cells. Journal of Power Sources, 173(1), 277-290.
Hung, T. F., Huang, J., Chuang, H. J., Bai, S. H., Lai, Y. J., & Chen-Yang, Y. W. (2008). Highly efficient single-layer gas diffusion layers for the proton exchange membrane fuel cell. Journal of Power Sources, 184(1), 165-171.
Nam, J. H., & Kaviany, M. (2003). Effective diffusivity and water-saturation distribution in single- and two-layer PEMFC diffusion medium. International Journal of Heat and Mass Transfer, 46(24), 4595-4611.
Spernjak, D., Advani, S. G., & Prasad, A. K. Simultaneous neutron and optical imaging in PEM fuel cells.
Spernjak, D., Prasad, A. K., & Advani, S. G. (2007). Experimental investigation of liquid water formation and transport in a transparent single-serpentine PEM fuel cell. Journal of Power Sources, 170(2), 334-344.

49
Williams, M. V., Kunz, H. R., & Fenton, J. M. (2004). Influence of convection through gas-diffusion layers on limiting current in PEM FCs using a serpentine flow field. Journal of the Electrochemical Society, 151(10), A1617-A1627.

50
Appendix A
ARBIN TEST STAND HUMIDITY CORRECTION FACTOR

51
DirectScale-Run1: 1.5 SLPM
Measured: 10.54g/23000s = 4.58 e-4 g/s Calculated: 13.21g/23000s = 5.74 e-4 g/s (factor 0.7979)
DirectScale-Run2: 1.5 SLPM

52
Measured: 5.137g/21600s = 2.37 e-4 g/s Calculated: 6.192g/21600s = 2.86 e-4 g/s (factor 0.8287)
DirectScale-Run3: 1.5 SLPM
Measured: 16.88g/39210s = 4.305 e-4 g/s Calculated: 20.8g/39210s = 5.304 e-4 g/s (factor 0.8116)
53
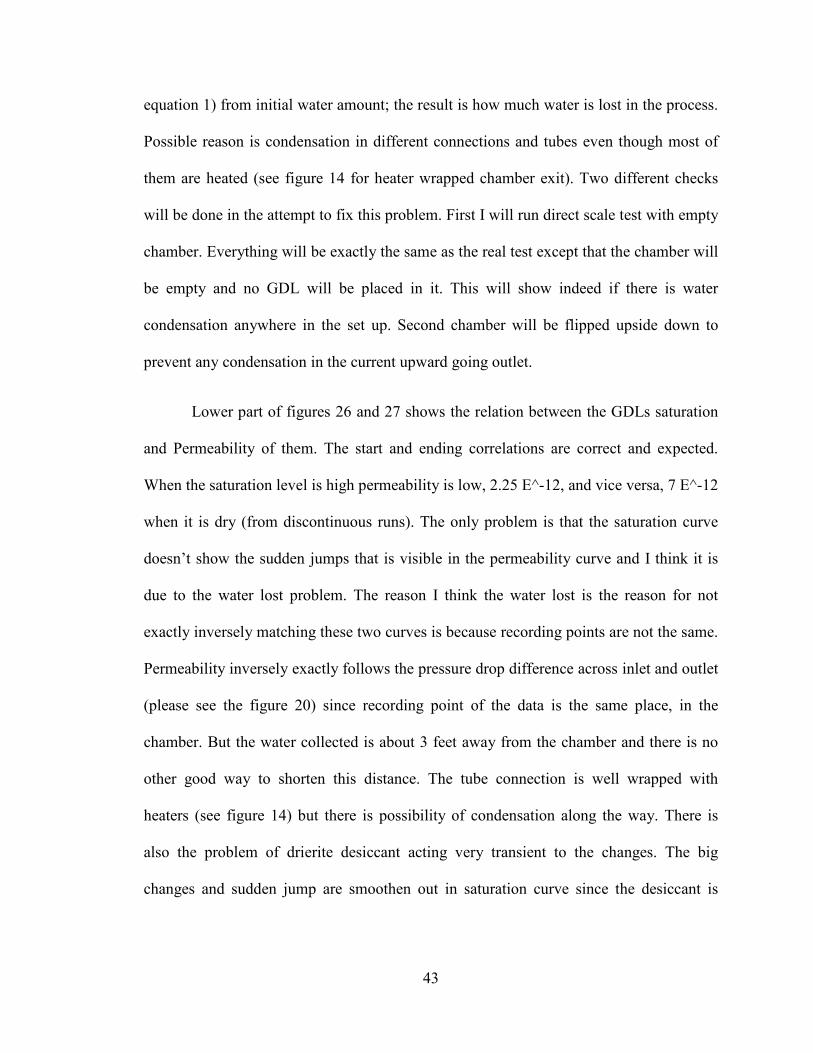
DirectScale-Run4: 1.5 SLPM
Measured: 15.62g/38510s = 4.056 e-4 g/s Calculated: 18.87g/38510s = 4.9 e-4 g/s (factor 0.8277)
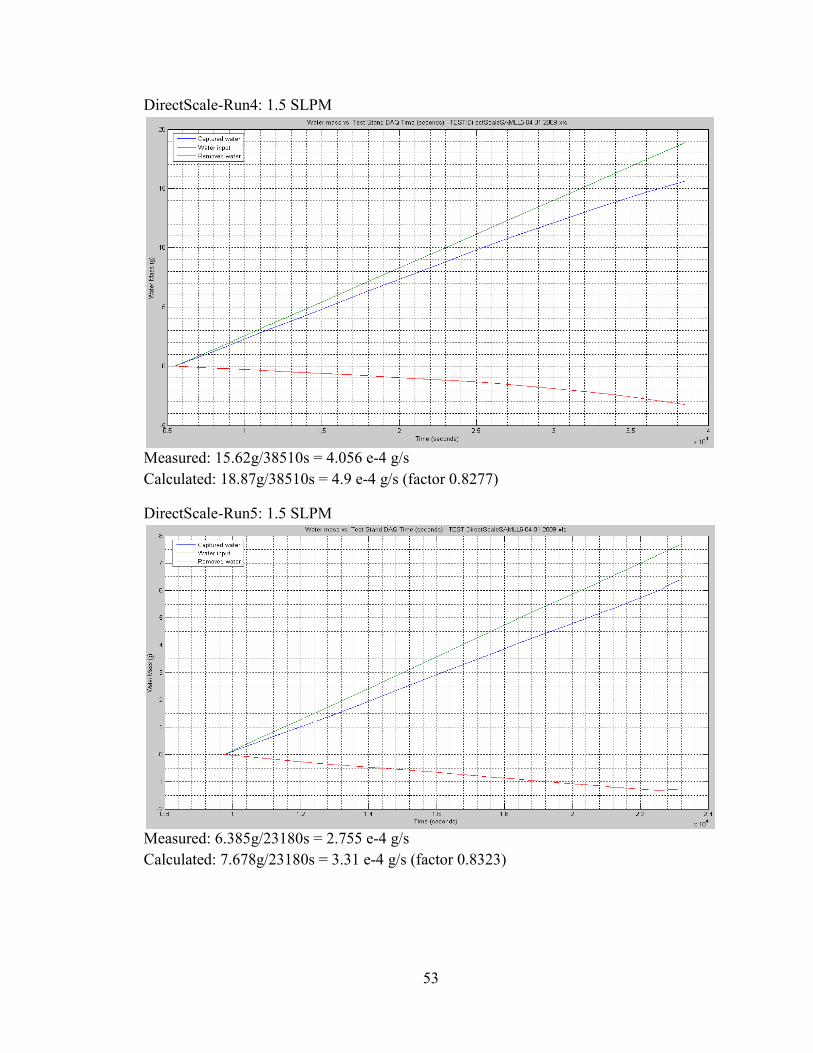
DirectScale-Run5: 1.5 SLPM
Measured: 6.385g/23180s = 2.755 e-4 g/s Calculated: 7.678g/23180s = 3.31 e-4 g/s (factor 0.8323)

54
DirectScale-Run6: SLPM
Measured: 11.09g/22860s = 4.8513 e-4 g/s Calculated: 12.94g/22860s = 5.661 e-4 g/s (factor 0.8569)
Average of all six runs is: 0.82585