experimental analysis of small solar unmanned aerial
TRANSCRIPT
INCAS BULLETIN, Volume 12, Issue 4/ 2020, pp. 173 – 182 (P) ISSN 2066-8201, (E) ISSN 2247-4528
Experimental Analysis of Small Solar Unmanned Aerial Vehicle to Predict Aerodynamic Performance
Parvathy RAJENDRAN*,1, Howard SMITH2
*Corresponding author 1School of Aerospace Engineering, Universiti Sains Malaysia Engineering Campus,
14300 Nibong Tebal, Pulau Pinang, Malaysia, [email protected]*
2Aircraft Design Group, School of Engineering, Cranfield University, MK43 0AL Cranfield, England, [email protected]
DOI: 10.13111/2066-8201.2020.12.4.16
Received: 21 July 2020/ Accepted: 03 November 2020/ Published: December 2020 Copyright © 2020. Published by INCAS. This is an “open access” article under the CC BY-NC-ND license (http://creativecommons.org/licenses/by-nc-nd/4.0/)
Abstract: Various studies have been done in recent years on unmanned solar-powered aircraft for non-stop flight at a specified location or area. However, if a solar-powered unmanned aerial vehicle (UAV) can achieve a non-stop flight around the world, it may lead to the possibility of a pseudolite (i.e., pseudo-satellite) operation. These solar UAVs capable of operating as a satellite enable sustainable aviation that provides cheaper communication accessibility. Recently, we have developed a mathematical model for solar UAVs that was followed by the fabrication of a solar UAV model. Both the mathematical design model and the prototype model have been published. Thus, this work aims to determine the actual flight performance characteristics of the fabricated solar UAV. In this work, the bench and flight tests of the prototype solar and non-solar UAV model were compared in terms of aerodynamic characteristics and performance. These characteristics are determined using the flight test data and then compared with simulation data using a mathematical design model published earlier. Both accelerated and un-accelerated methods have been applied to predict the polar drag curve, and a distinct band of data obtained for both UAV prototypes. The predicted zero-lift drag coefficients were similar to the theoretical prediction in these UAVs.
Key Words: SUAV design, solar-powered UAV, drone, UAV, UAS, flight test, drag polar, accelerated method
1. INTRODUCTION
UAVs can accomplish dangerous and critical mission without concerning the safety of pilots [1]. A small platform with lower cost is another major factor that arouses huge interest among the research community [2, 3]. It has been applied on a large scale not only in the military field but also in commercial applications [4, 5]. Some of the commercial applications are traffic monitoring, coast and harbor patrolling, and pipeline inspection, while military applications include surveillance, target acquisition, and reconnaissance [1, 6].
Solar energy is renewable energy with zero-emission, and it is widely applied in the military, commercial as well as the industry fields. [7-11]. Recently, research focused on the augmentation of solar cells in UAVs [12]. The purpose of this experimental work development
Parvathy RAJENDRAN, Howard SMITH 174
INCAS BULLETIN, Volume 12, Issue 4/ 2020
is to validate the design methodology of solar UAV with unlimited flight duration [13]. This achievement is crucial for the vehicle to perform missions without refueling and to last forever without polluting the environment. However, the efficiency and performance of solar cells available in the market are not sufficient to accomplish this goal [11]. Thus, many types of research on increasing endurance of UAV have been done, such as High Altitude Long Endurance UAV projects [14-18].
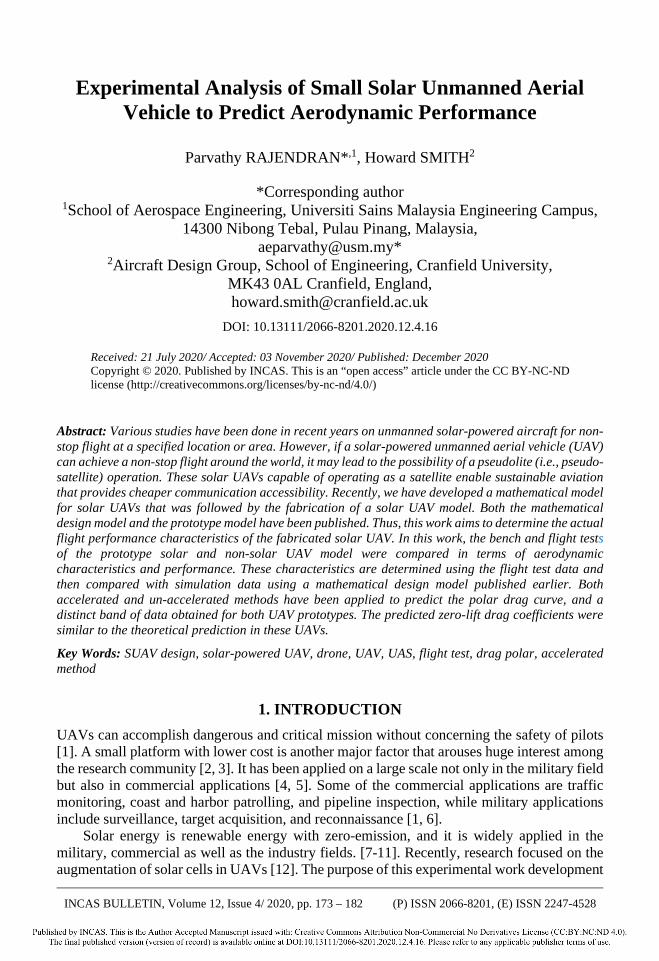
Previous work has been the development of a solar UAV prototype with an endurance of almost 24 hours [19]. This solar UAV layout is as shown in Fig. 1. To accomplish 24 hours flight, an innovative design methodology [13] and systems that combine solar cells, lithium battery, and propeller are used [12, 20]. The advantage of lithium polymer battery is that it is not using a solid plastic electrolyte, so it is more flexible in shape than the cylindrical form [21]. This study aims to analyse data of the flight test [22] and to compare them with the simulation design [13] to establish the UAV aerodynamic characteristics. Also, two methods of aerodynamic characteristics estimation from flight test data are conducted, which are based on accelerated flight routines and un-accelerated flight routines to verify the similarity among them. Furthermore, a non-solar UAV prototype is included in the comparison. For the sake of comparison of equality, the non-solar UAV is the same UAV model without the solar module.
Fig. 1 Prototype UAV 3D View Diagram
2. METHODOLOGY Even if the straight and level flight will have only a short duration compared to the entire flight, in general, it is measured as a standard condition in the design of an aircraft. The experimental data have been collected using two flight routine techniques known as accelerated and un-accelerated linear flight mode to ensure that the aerodynamic

175 Experimental Analysis of Small Solar Unmanned Aerial Vehicle to Predict Aerodynamic Performance
INCAS BULLETIN, Volume 12, Issue 4/ 2020
characteristics and performance of the aircraft are accurately predicted. The straight and level un-accelerated flight path (cruise flight) is horizontal to the surface and the thrust is assumed to always act along this horizontal plane. For the flight to be horizontal or constant altitude, it is easily to see that the lift must be equal to the weight and the flight must be at a constant velocity (un-accelerated); the thrust must be equal to the drag. The velocity of the airplane must be sufficient to produce sufficient lift to sustain level flight.
Minimum flying speed for straight and level flight occurs when the wing is operating at maximum lift coefficient, that is, near the stall angle. The maximum flying speed for the straight and level is limited by the thrust available from the engine. This condition also requires a small value of the lift coefficient and hence a small angle of attack. An accelerated motion and curved flight are considered, specifically for the cases of take-off, landing, and the constant-altitude banked turn. However, there is a limit to their use since they also contribute to increased drag and retard the airplane acceleration. The constant-altitude banked turn was the flight routine technique used in this experimental work.
The following subsections will explain numerically the UAV airfoil lift and drag characteristics. Then, the static tests findings of the UAV prototype model will be presented. Finally, the flight test data are presented and compared to elucidate the disparity between the actual data and numerical simulation.
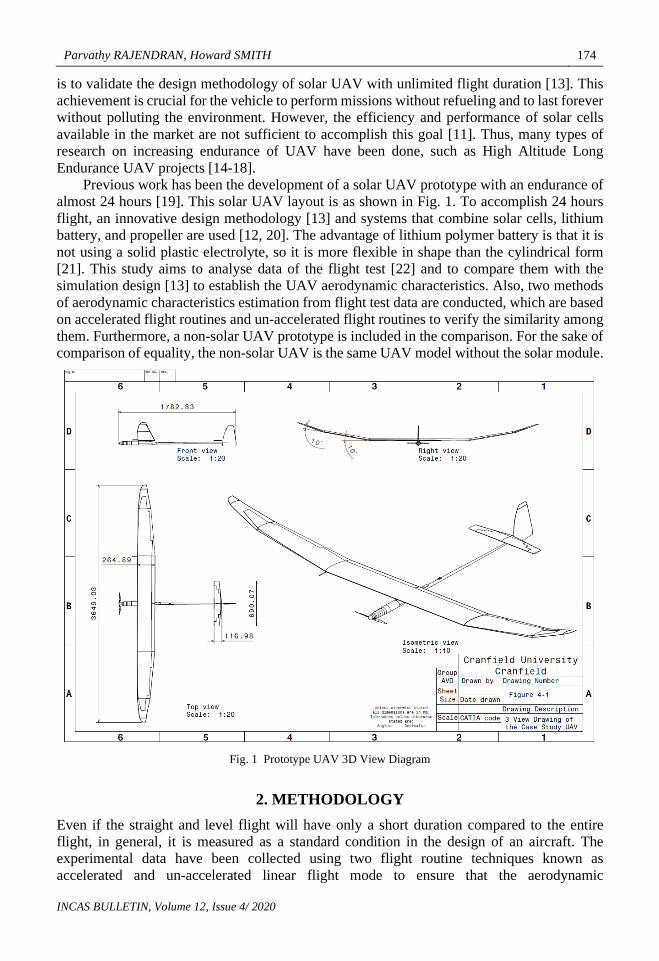
Prototype UAV Airfoil Characteristics The Super-AVA-e model is used for the solar and non-solar UAV prototype, and there are 4 varieties of airfoils in the Super-AVA-e, which include AG 24, AG 25, AG 26, and HT 21. The lift coefficients over the angle of attack of these airfoils are displayed in Fig. 2. The numerical data are obtained by referring to the prototype airfoil specification. The simulation using these data estimated that the prototype UAV model has a wing angle of attack ranging from -13.6° to 11.8° with a maximum lift coefficient of 1.53. The drag polar of the prototype airfoils are plotted in Fig. 3, and the average zero-lift drag coefficient of these airfoils is 0.0047.
Fig. 2 Lift coefficient versus angle of attack of prototype model airfoils
Prototype UAV Wing Characteristics The lift and drag coefficient data of the prototype airfoil is not sufficient since the assumption of the infinite wing is made. Thus, a finite wing’s lift and drag coefficient has been simulated by using the design methodology proposed in previous work [13].
The drag polar of the prototype UAV model is presented in Fig. 4. It is estimated that the zero-lift drag coefficient is approximately 0.0111 for both solar and non-solar UAV. It is
Parvathy RAJENDRAN, Howard SMITH 176
INCAS BULLETIN, Volume 12, Issue 4/ 2020
nearly twice more than basic airfoil data due to induced drag at wingtips. On the other hand, for the drag polar, the difference between solar and non-solar UAV in simulation is negligible.
These differences are mainly because the solar UAV is assumed to have take-off weight 0.4kg more than non-solar UAV while other parameters are the same in the simulation for both of them.
Fig. 3 Drag coefficient versus lift coefficient of prototype model airfoils
Fig. 4 Lift versus Drag Coefficient of Solar & Non-Solar Prototype UAV
3. RESULTS AND DISCUSSIONS In this section, both the static and flight test results of the prototype UAV model is/are presented. The findings are elaborated in detail.
Static Test Before the flight test is conducted, static tests are carried out to ensure both solar and non-solar UAVs are capable of real flight. The static test is on the maximum throttle endurance of the prototype.
This flight test is essential to ensure that the expected endurance performance is attainable and it also assists in establishing the UAV’s readiness for its maiden flight.
The first static test data of battery power and electric propulsion system at full throttle are shown in Fig. 5.

177 Experimental Analysis of Small Solar Unmanned Aerial Vehicle to Predict Aerodynamic Performance
INCAS BULLETIN, Volume 12, Issue 4/ 2020
Fig. 5 Prototype UAV's Power Systems - Bench Test @ 100% Throttle
The battery packs used in this test which gives a nominal voltage of 11.1V and 18.2Ahr cumulative current is the prototype complete battery pack set. This battery pack is connected to the electronic speed controller, brushless electric motor, and 13 x 8 folding (Aero-Naut) propeller. The voltage, current, and temperature data are recorded using the Eagle Tree System data logger. The system is powered up to full throttle and maintained there until the battery packs power is fully depleted.
During this full-throttle period, the electric motor temperature is within 40°C, which gives an assurance that the internal fuselage temperature does not exceed 70°C, temperature at which the LiPo battery pack can explode in the air.
The battery voltage depletes from fully charged to 9V, and it is stopped due to the battery power management system. This has proven that the battery power system is safe to be used, and the shelf life is protected.
The maximum current delivered is nearly 30A, which provides a maximum power of 325W. This amount of power gives around 108W/kg power to weight ratio during the initial flight. This ratio is high enough for the UAV to climb without an assisted launch system. Therefore, both solar and non-solar UAV flight tests were launched manually.
Flight tests Initially, all flight test data are adjusted since the data logger might record with minor offset values from zero. Actual aerodynamic characteristics can be calculated as all the required parameters are obtained from the flight tests. The parameters are voltage, current, x-axis acceleration, y-axis acceleration, altitude, and speed. Since all data points required are for a level flight, rigorous screening is needed every second to determine the points with zero or near - zero x-axis acceleration.
Then, from these data points, the power can be estimated by multiplying the voltage and current and the efficiency of the electric propulsion.
There are 4 types of system efficiencies in this model that need to be considered to estimate the final power output precisely, which are battery, ESC, electric motor, and propeller efficiencies.
Then, the UAV thrust can be calculated by dividing the power over UAV speed. Since the thrust is estimated at zero acceleration, the drag equals to thrust.

Parvathy RAJENDRAN, Howard SMITH 178
INCAS BULLETIN, Volume 12, Issue 4/ 2020
The flight test was conducted using accelerated and un-accelerated flight technique routines to analyze the aerodynamic characteristics for both solar and non-solar UAV models. The maiden flight is done successfully to test the stability & control system, power system, and heat dissipation from the propulsion system.
Besides, the UAV range check was done on both the RC transmitter and ETS receiver. All wireless and stored data recordings are verified before actual flight plan routines were done. This verification is essential to collect high accuracy data from flight test.
Then, the following flight tests were done to ensure both accelerated and un-accelerated flight routines can be performed, where each test flight has an average duration of approximately 25 minutes.
Fig. 6 presents the flight path during one of the flight test of non-solar UAV. The non-solar UAV has clocked 8.76 km in range and manages to reach an altitude of 118 meters from the ground level during this flight test.
During these flight tests, the battery system, electric propulsion system, and aerodynamics characteristics are analysed.
Figs. 7 and 8 illustrate the sample flight data collected for solar UAV. The solar UAV has flown around 31.42 minutes with an average speed of 46 km/hr. Data on altitude, speed, x-axis acceleration, y-axis acceleration, power voltage, current, and rpm output over the flight duration are collected.
According to these figures, the whole flight path can be explained in detail. The launch and landing point of the flight test can be identified by analysing the x-axis and y-axis acceleration in Fig. 7.
The UAV accelerated at launch approximately about 2.34g parallel to the forward flight path and -2.14g perpendicular to the flight path, which is approximately 23m/s2 of acceleration.
This acceleration is achieved by launching the UAV with 7.04kg of thrust, which provides 675W of equivalent power and a total lift of 6.42kg. Yet, the actual force used in the flight test cannot be determined precisely as the data logging system does not have an angle sensor. Moreover, the exact moment when the throttle stick position is operated can influence the required thrust during launch.
Fig. 6 Case Study UAV Flight Path

179 Experimental Analysis of Small Solar Unmanned Aerial Vehicle to Predict Aerodynamic Performance
INCAS BULLETIN, Volume 12, Issue 4/ 2020
Fig. 7 Flight Data: Altitude, Speed & X & Y Acceleration vs. Flight Duration
Fig. 8 shows that the UAV has begun its flight test at an initial voltage of 12.31V and completed it at 12.09V.
The maximum current occurred in the flight test is 34.43A, and the highest electric motor rpm is 9256 for the flight test. Only 6.11% of battery capacity have been used throughout this flight test, which means that the UAV can maintain the flight path for 3.62 hours before the battery runs out of energy.
Besides, there is only 1.27% error between the maximum rpm occurred in the flight test and the electric motor manufacturer specified rpm per volt ratio of 800. The maximum power, altitude, and speed achieved in this flight test are 392.8W, 117m, and 83km/hr. respectively.
Fig. 8 Flight Data: Voltage, Current, Temperature, kRPM vs. Flight Duration
Parvathy RAJENDRAN, Howard SMITH 180
INCAS BULLETIN, Volume 12, Issue 4/ 2020
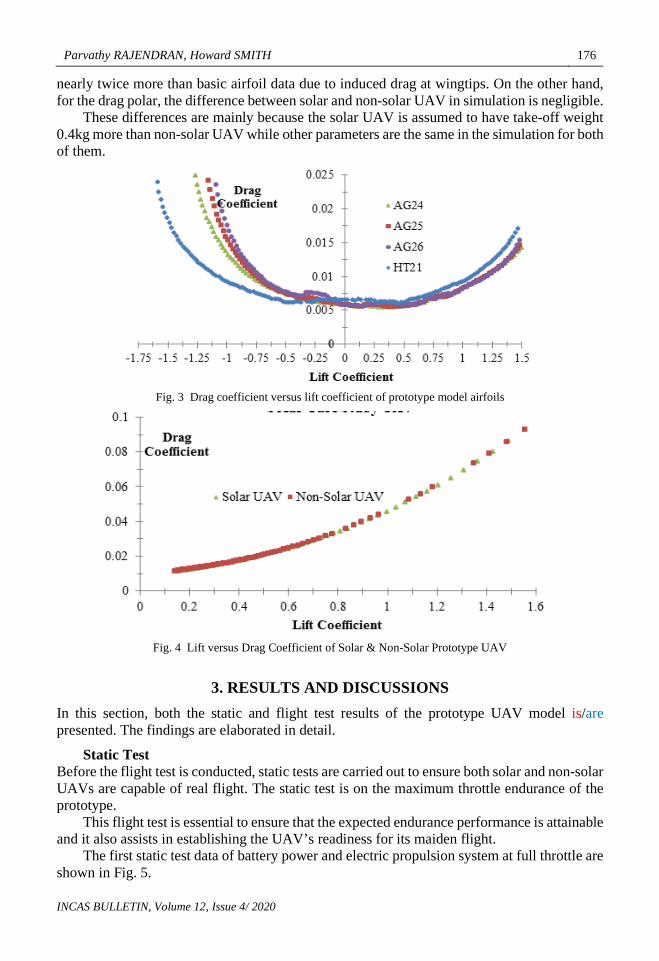
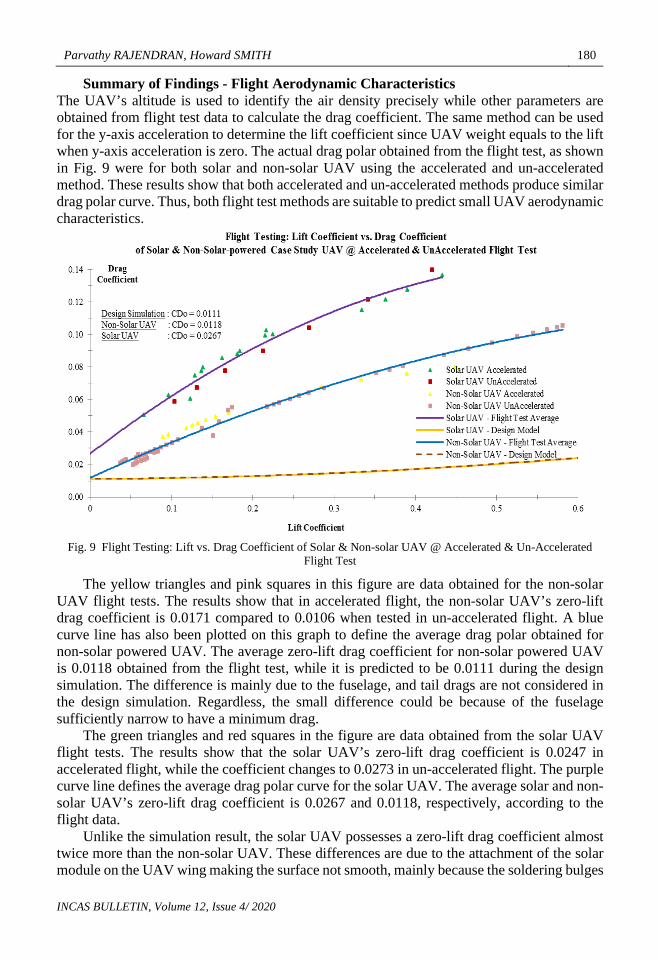
Summary of Findings - Flight Aerodynamic Characteristics The UAV’s altitude is used to identify the air density precisely while other parameters are obtained from flight test data to calculate the drag coefficient. The same method can be used for the y-axis acceleration to determine the lift coefficient since UAV weight equals to the lift when y-axis acceleration is zero. The actual drag polar obtained from the flight test, as shown in Fig. 9 were for both solar and non-solar UAV using the accelerated and un-accelerated method. These results show that both accelerated and un-accelerated methods produce similar drag polar curve. Thus, both flight test methods are suitable to predict small UAV aerodynamic characteristics.
Fig. 9 Flight Testing: Lift vs. Drag Coefficient of Solar & Non-solar UAV @ Accelerated & Un-Accelerated
Flight Test
The yellow triangles and pink squares in this figure are data obtained for the non-solar UAV flight tests. The results show that in accelerated flight, the non-solar UAV’s zero-lift drag coefficient is 0.0171 compared to 0.0106 when tested in un-accelerated flight. A blue curve line has also been plotted on this graph to define the average drag polar obtained for non-solar powered UAV. The average zero-lift drag coefficient for non-solar powered UAV is 0.0118 obtained from the flight test, while it is predicted to be 0.0111 during the design simulation. The difference is mainly due to the fuselage, and tail drags are not considered in the design simulation. Regardless, the small difference could be because of the fuselage sufficiently narrow to have a minimum drag.
The green triangles and red squares in the figure are data obtained from the solar UAV flight tests. The results show that the solar UAV’s zero-lift drag coefficient is 0.0247 in accelerated flight, while the coefficient changes to 0.0273 in un-accelerated flight. The purple curve line defines the average drag polar curve for the solar UAV. The average solar and non-solar UAV’s zero-lift drag coefficient is 0.0267 and 0.0118, respectively, according to the flight data.
Unlike the simulation result, the solar UAV possesses a zero-lift drag coefficient almost twice more than the non-solar UAV. These differences are due to the attachment of the solar module on the UAV wing making the surface not smooth, mainly because the soldering bulges

181 Experimental Analysis of Small Solar Unmanned Aerial Vehicle to Predict Aerodynamic Performance
INCAS BULLETIN, Volume 12, Issue 4/ 2020
on the solar module connection have contributed to the increment of the drag. Yet, this drag can be reduced significantly by using automated soldering machine techniques. Furthermore, the dihedral wing design impedes the solar module to keep the shape of the wing airfoil. Thus, avoiding the wing dihedral joints for solar module installation can decrease the drag. Nevertheless, the actual drag coefficient along the lift coefficient for both solar and non-solar UAV is much higher than the simulation design, which indicates that the assumptions for the induced drag estimation in the simulation design still need to be improved further.
5. CONCLUSIONS Solar and non-solar UAV flight tests have been carried, and the flight test data have been analyzed. The aerodynamic characteristics are estimated based on the recorded flight data using both accelerated and un-accelerated flight routines. Unlike simulation design, whereby the aerodynamic characteristics for both types of UAVs are almost the same, the actual drag polar for solar UAV is higher than non-solar UAV. The zero-lift drag coefficient of solar UAV is almost twice more than non-solar UAV mainly because of the drag induced by solar module attachment on its wing. The drag polar for accelerated or un-accelerated flight routines is about the same for both types of UAVs.
ACKNOWLEDGEMENT We would like to acknowledge the funding from Universiti Sains Malaysia Rui Grant No. 1001 / PAERO / 8014120 and Cranfield University to accomplish this research work. Also, Mr. Fabien Turpaud, Mr. Sebastian D’Amico, Mr. Matteo Trapani, and Mr. Godwin Abbey are thanked for their valuable thoughts, ideas, and support for this project.
CONFLICT OF INTEREST The authors declare that they have no conflict of interest.
REFERENCES [1] E. Cetinsoy, C. Hancer, K. T. Oner, E. Sirimoglu, M. Unel, Aerodynamic design and characterization of a quad
tilt-wing UAV via wind tunnel tests, Journal of Aerospace Engineering, 25, 574-587, 2012. [2] C. H. Tan, P. Rajendran, Flight Path Pattern of Solar-Powered UAV-Mission Around the World, in: 2019 11th
International Conference on Knowledge and Smart Technology (KST), IEEE, pp. 62-66, 2019. [3] P. Rajendran, M. Masral, H. Kutty, Perpetual Solar-Powered Flight across Regions around the World for a
Year-Long Operation, Aerospace, 4, 20, 2017. [4] A. P. Kovanis, V. Skaperdas, J. A. Ekaterinaris, Design and analysis of a light cargo UAV prototype, Journal
of Aerospace Engineering, 25, 228-237, 2011. [5] E. Capello, A. Scola, G. Guglieri, F. Quagliotti, Mini quadrotor UAV: design and experiment, Journal of
Aerospace Engineering, 25, 559-573, 2012. [6] P. Rajendran, H. Smith, Sensitivity Analysis Of Design Parameters Of A Small Solar-Powered Electric
Unmanned Aerial Vehicle, Journal of Engineering Science and Technology, 13, 3922-3931, 2018. [7] J.-K. Shiau, D.-M. Ma, P.-Y. Yang, G.-F. Wang, J. H. Gong, Design of a solar power management system for
an experimental UAV, IEEE transactions on aerospace and electronic systems, 45, 1350-1360, 2009. [8] N. None, Solar Energy Technologies Program: Multi Year Program Plan 2008-2012, in EERE Publication and
Product Library, Washington, DC (United States), 2008. [9] R. Sutula, Solar Energy Technologies Program: Multi Year Program Plan 2007-2011, Energy Efficiency and
Renewable Energy, US Department of Energy, Washington DC USA, (2006).

Parvathy RAJENDRAN, Howard SMITH 182
INCAS BULLETIN, Volume 12, Issue 4/ 2020
[10] S. Jashnani, T. Nada, M. Ishfaq, A. Khamker, P. Shaholia, Sizing and preliminary hardware testing of solar powered UAV, The Egyptian Journal of Remote Sensing and Space Science, 16, 189-198, 2013.
[11] P. Rajendran, H. Smith, Modelling of solar irradiance and daylight duration for solar-powered UAV sizing, Energy Exploration & Exploitation, 34, 235-243, 2016.
[12] P. Rajendran, H. Smith, Experimental study of solar module & maximum power point tracking system under controlled temperature conditions, International Journal on Advanced Science, Engineering and Information Technology, 8, 1147-1153, 2018.
[13] P. Rajendran, H. Smith, Development of Design Methodology for a Small Solar-Powered Unmanned Aerial Vehicle, International Journal of Aerospace Engineering, 2018, 2018.
[14] X.-Z. Gao, Z.-X. Hou, Z. Guo, J.-X. Liu, X.-Q. Chen, Energy management strategy for solar-powered high-altitude long-endurance aircraft, Energy conversion and management, 70, 20-30, 2013.
[15] G. Frulla, G. Romeo, Numerical/experimental structural characterization of composite advanced joints for HALE-UAV platforms, Composites Part B: Engineering, 39, 656-664, 2008.
[16] X.-Z. Gao, Z.-X. Hou, Z. Guo, R.-F. Fan, X.-Q. Chen, The equivalence of gravitational potential and rechargeable battery for high-altitude long-endurance solar-powered aircraft on energy storage, Energy conversion and management, 76, 986-995, 2013.
[17] M. Belardo, N. Paletta, L. Di Palma, M. Pecora, Structural and aeroelastic design of a joined-wing UAV, Journal of Aerospace Engineering, 27, 93-111, 2012.
[18] M. Bronz, G. Hattenberger, J.-M. Moschetta, Development of a long endurance mini-UAV: eternity, International Journal of Micro Air Vehicles, 5, 261-272, 2013.
[19] P. Rajendran, H. Smith, The Development of a Small Solar Powered Electric Unmanned Aerial Vehicle Systems, Applied Mechanics and Materials, 465, 345, 2013.
[20] P. Rajendran, H. Smith, Experimental Assessment of Various Batteries and Propellers for Small Solar-Powered Unmanned Aerial Vehicle, Journal of Engineering and Technological Sciences, 50, 382-391, 2018.
[21] X. Zhu, Z. Guo, Z. Hou, Solar-powered airplanes: A historical perspective and future challenges, Progress in aerospace sciences, 71, 36-53, 2014.
[22] J. N. Ostler, W. J. Bowman, D. O. Snyder, T. W. McLain, Performance flight testing of small, electric powered unmanned aerial vehicles, International Journal of Micro Air Vehicles, 1, 155-171, 2009.