experiment hh-4: the six-lead electrocardiogram sample lab experiment hh-4: the six-lead...
TRANSCRIPT

iWor
x Sam
ple La
b
Experiment HH-4: The Six-Lead Electrocardiogram
Background
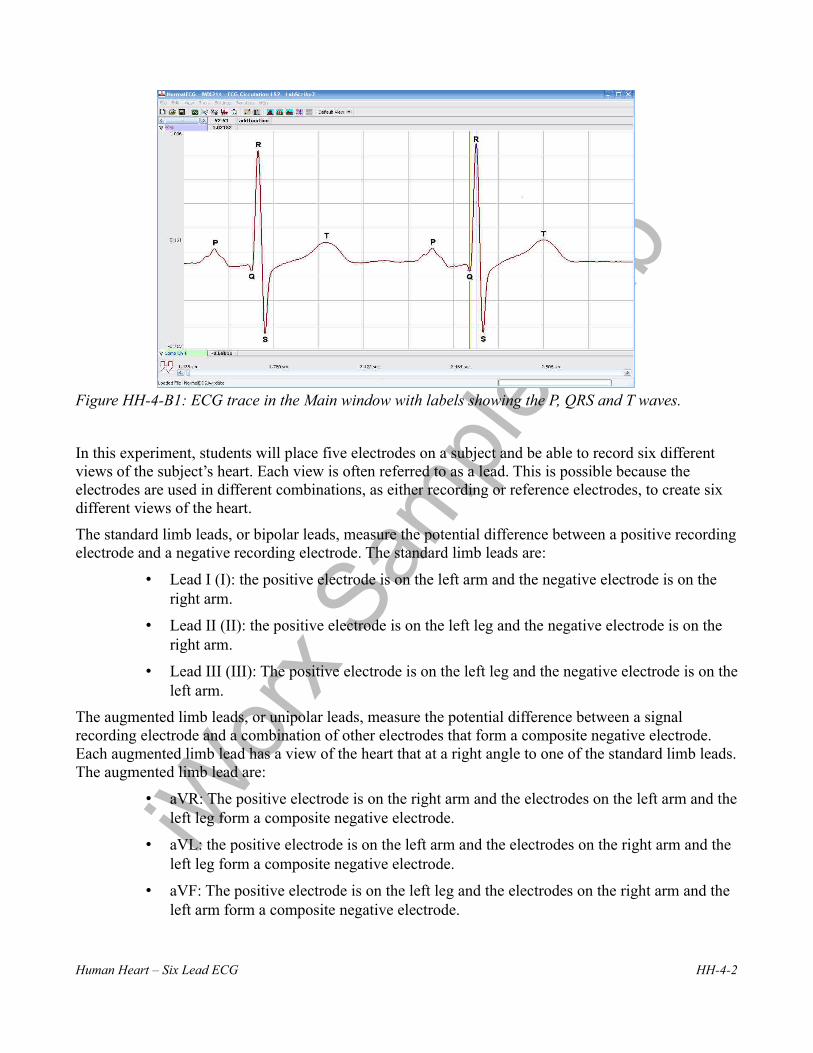
The cardiac cycle involves a sequential contraction of the atria and the ventricles. These contractions are triggered by the coordinated electrical activity of the myocardial cells in the heart. The electrical currents produced by the heart are large and can be recorded through electrodes placed on the skin. The recording is known as an electrocardiogram or ECG (Figure HH-4-B1). When diagnosing the health of the heart, electrocardiograms are recorded from specific positions around the heart and analyzed to determine existence of cardiac disease. These positions or combinations of positions are referred to as leads or views. However, the data collected from this experiment should not be used to determine the health of fitness of any subject’s heart.
ECG Components
Cardiac action potentials contain three phases. In addition to the rapid depolarization and repolarization of the membrane potential in nerve and muscle action potentials, cardiac action potentials contain a plateau depolarization after the period of rapid depolarization. This plateau is pronounced in the potentials from ventricular fibers. A recording from a single lead, like Lead I in Figure HH-4-B1, is adequate for demonstrating the basic components of the ECG. There are specific waveforms associated with the electrical activity of the atrial and ventricular fibers.
These events and waveforms are:
• The atrial depolarization which produces the P wave.
• The atrial repolarization and the ventricular depolarization which produce the QRS complex.
• The ventricular repolarization which produces the T wave.
Multiple Leads
There are twelve common cardiographic leads, six limb and six chest. The six limb, or coronal, leads are in the frontal plane of the body which is the plane parallel to the floor when the subject is reclining. The six chest, or precordial, leads are in the transverse plane of the body which is the plane perpendicular to the floor when the subject is reclining.
Examining the electrical activity of the heart from twelve different angles can be a valuable clinical tool. The way that currents pass through different parts of the heart can indicate abnormalities or problems such as: hypertrophies, bundle branch or fascicular blocks, cushion defects, pulmonary hypertension, and more. By measuring the magnitudes of the electrical activity from different directions, the areas of the heart that are abnormal can be identified. A clinician can gain a better understanding of the health of the heart by having more views of that organ.
Human Heart – Six Lead ECG HH-4-1
iWor
x Sam
ple La
b
Figure HH-4-B1: ECG trace in the Main window with labels showing the P, QRS and T waves.
In this experiment, students will place five electrodes on a subject and be able to record six different views of the subject’s heart. Each view is often referred to as a lead. This is possible because the electrodes are used in different combinations, as either recording or reference electrodes, to create six different views of the heart.
The standard limb leads, or bipolar leads, measure the potential difference between a positive recording electrode and a negative recording electrode. The standard limb leads are:
• Lead I (I): the positive electrode is on the left arm and the negative electrode is on the right arm.
• Lead II (II): the positive electrode is on the left leg and the negative electrode is on the right arm.
• Lead III (III): The positive electrode is on the left leg and the negative electrode is on the left arm.
The augmented limb leads, or unipolar leads, measure the potential difference between a signal recording electrode and a combination of other electrodes that form a composite negative electrode. Each augmented limb lead has a view of the heart that at a right angle to one of the standard limb leads. The augmented limb lead are:
• aVR: The positive electrode is on the right arm and the electrodes on the left arm and the left leg form a composite negative electrode.
• aVL: the positive electrode is on the left arm and the electrodes on the right arm and the left leg form a composite negative electrode.
• aVF: The positive electrode is on the left leg and the electrodes on the right arm and the left arm form a composite negative electrode.
Human Heart – Six Lead ECG HH-4-2

iWor
x Sam
ple La
b
The diagram that describes the axes of the leads and the vectors of the ECG signals directed toward the leads is known as Eithoven’s Triangle (Figure HH-4-B2). For example, the positive electrode in Lead I, which is on the left arm, has a view of the electrical activity of the heart while it is looking toward the right shoulder. As shown in the same figure, the axis of Lead I is parallel to a line that connects the shoulders. By definition, the axis of Lead I is defined as zero degrees.
In a subject with a normal heart in a normal orientation, the ECG recording from Lead II will yield an R wave with the highest amplitude of all the limb leads. In Lead II, the positive electrode on the left leg has a head-on view of the electrical activity of the heart because this electrode is facing the right shoulder. The axis of Lead II is right through the septum that divides the ventricles. the septum is the site of the tissue bundles responsible for carrying the depolarization of the heart to the muscle fibers in the apex of the heart. By definition, the axis of Lead II is +60 degrees.
Figure HH-4-B2: Einthoven’s Triangle identifying the axes of the six limb leads.
In this lab, students will attach one ground and four recording electrodes to the subject and record electrocardiograms from the positions known as Lead I and Lead II. The other four limb leads will be synthesized from the recordings from Leads I and II and a series of equations. These equations are incorporated into the LabScribe software as computed functions in the add function pull-down menu. They only need to be activated to work. If Leads I and II are recorded on Channels 1 and 2, respectively, the limb lead computed functions take the raw data recorded on these channels and derive the electrocardiograms for the other four limb leads. These leads can be displayed on any of the six available channels.
The derivations used to synthesize ECG’s for different leads are appended to the end of this experiment. The equations do not need to be used by students since the LabScribe recording software is programmed to perform those measurements.
Human Heart – Six Lead ECG HH-4-3

iWor
x Sam
ple La
b
Experiment HH-4: The Six-Lead Electrocardiogram
Equipment Required
PC or Mac Computer
IX-BIO4 or IX-BIO8 data recorder
USB cable
Five electrode lead wires
Alcohol swabs
Disposable ECG electrodes
IX-BIO Setup
Use the USB cable to connect the computer to the USB port on the IX-BIO.
Start the Software
1. Click on the LabScribe shortcut on the computer’s desktop to open the program. If a shortcut is not available, click on the Windows Start menu, move the cursor to All Programs and then to the listing for iWorx. Select LabScribe from the iWorx submenu. The LabScribe Main window will appear as the program opens. There will be a message indicating that LabScribe has recognized the IX-BIO.
2. On the Main window, pull down the Settings menu and select Load Group.
3. Locate the folder that contains the settings group, IXBIO.iwxgrp. Select this group and click Open.
4. Pull down the Settings menu again. Select the SixLeadECG settings file in Human Heart.
5. After a short time, LabScribe will appear on the computer screen as configured by the SIXLeadECG settings.
6. For your information, the settings used to configure the LabScribe software and the IX-BIO unit for this experiment are programmed on the Preferences Dialog window which can be viewed by selecting Preferences from the Edit menu on the LabScribe Main window.
7. Once the settings file has been loaded, click the Experiment button on the toolbar to open any of the following documents:
• Appendix• Background• Labs• Setup (opens automatically)
Human Heart – Six Lead ECG HH-4-4

iWor
x Sam
ple La
b
ECG Cable Setup
1. Locate the red, black, green, frown, and white electrode lead wires (Figure HH-4-S1).
Figure HH-4-S1: IX-BIO4 with five lead wires and electrodes connected.
2. Insert the connectors on the five color-coded electrode lead wires into the matching sockets on the IX-BIO.
3. Instruct the subject to remove all jewelry from their wrists and ankles.
4. Use an alcohol swab to clean and scrub a region with little or no hair, on the inside of the subject’s right wrist or under the right clavicle. Let the area dry.
5. Remove a disposable ECG electrode from its plastic shield, and apply the electrode to the scrubbed area on the wrist or under the clavicle.
6. Repeat Steps 5 and 6 for electrodes on the inside of the right ankle, the inside of the left wrist, and the insides of both calves.
7. Snap the lead wires onto the electrodes, so that:
• the red (+1) lead is attached to the left wrist or under the left clavicle,
• the black (-1) lead is connected to the right wrist or under the right clavicle,
• the green (C or ground) lead is connected to the right ankle.
• the white (+2) lead is attached to the left leg – mid calf,
• the brown (-2) lead is connected to the right arm.
8. Instruct the subject to sit quietly with their hands in their lap. If the subject moves, the ECG trace will move off the top or bottom of the screen. If the subject moves any muscles in the arms or upper body, electromyograms (EMGs) from the muscles will appear on the ECG recording as noise.
Human Heart – Six Lead ECG HH-4-5

iWor
x Sam
ple La
b
Experiment HH-4: The Six-Lead Electrocardiogram
Exercise 1: Six Lead ECG from Resting Subject
Aim: To record a Six Lead ECG from a resting subject and determine the QRS axis of the subject’s heart.
Procedure
1. Click on the Record button, located on the upper right side of the LabScribe Main window (Figure HH-4-L1). The signal should begin scrolling across the screen.
Note: If the user clicks the Record button and there is no communication between the iWorx unit and computer, an error window will appear in the center of the Main window. Make sure the iWorx unit is connected to the USB port of the computer. Click OK and select the Find Hardware function from the LabScribe Tools menu.
2. Click on the AutoScale buttons at the upper margin of all the channels. Your recording should look like Figure HH-4-L1.
• If the signal on the Lead I and the Lead II channels is upside down when compared to trace in Figure HH-4-L1, click on the downward arrow to the left of the channel title and select the Invert function. The trace should now look similar to the one in the figure
• If a larger ECG signal is required, the electrodes should be moved from the wrists to the skin immediately below each clavicle.
Figure HH-4-L1: Six lead ECG generated by recording Leads I and II on Channels 1 and 2, respectively. The remaining limb leads are derived by computed functions.
Human Heart – Six Lead ECG HH-4-6

iWor
x Sam
ple La
b
3. When you have a suitable trace, type <Subject’s Name> Resting ECG/Pulse in the Mark box to the right of the Mark button. Press the Enter key on the keyboard to attach the comment to the data. Record for a minute or two.
4. Click Stop to halt recording.
5. Select Save As in the File menu, type a name for the file. Choose a destination on the computer in which to save the file, like your lab group folder. Designate the file type as *.iwxdata. Click on the Save button to save the data file.
Data Analysis
1. Scroll through the recording and find a section of data with four to six exemplary ECG cycles in succession.
2. Use the Display Time icons to adjust the Display Time of the Main window to show at least four complete ECG cycles on the Main window. Four adjacent ECG cycles can also be selected by:
• Placing the cursors on either side of a group of four complete ECG cycles.
• Clicking the Zoom between Cursors button on the LabScribe toolbar to expand the segment with the four selected ECG cycles to the width of the Main window.
Figure HH-4-L2: The LabScribe toolbar.
3. Click on the Analysis window icon in the toolbar (Figure HH-4-L2) or select Analysis from the Windows menu to transfer the data displayed in the Main window to the Analysis window (Figure HH-4-L3).
4. Look at the Function Table that is above the uppermost channel displayed in the Analysis window. The name of the mathematical function used in the analysis, V2-V1, appears in this table. The values for V2-V1 from each channel are seen in the table across the top margin of each channel.
5. Once the cursors are placed in the correct positions for determining the amplitudes of each wave in an ECG cycle, the values of the amplitudes can be recorded in the on-line notebook of LabScribe by typing their names and values directly into the Journal, or on a separate data table.
Human Heart – Six Lead ECG HH-4-7

iWor
x Sam
ple La
b
Figure HH-4-L3: Six lead ECG displayed on the Analysis window with cursors in position to measure the amplitude of the R wave.
6. The functions in the channel pull-down menus of the Analysis window can also be used to enter the names and values of the parameters from the recording to the Journal. To use these functions:
• Place the cursors at the locations used to measure the amplitudes of the waves in the ECG cycle.
• Transfer the name of the mathematical functions used to determine the amplitudes to the Journal using the Add Title to Journal function in the ECG Channel pull-down menu.
• Transfer the values for the amplitudes to the Journal using the Add Ch. Data to Journal function in the ECG Channel pull-down menu.
7. Use the mouse to click on and drag the cursors to specific points on the ECG recording (Figure HH-4-L4) to measure the following:
• The R-wave amplitude. To measure the R wave amplitude, place one cursor on the Q wave that precedes the R wave and the second cursor on the peak of the R wave. The value for V2-V1 on the ECG channel is this amplitude. Measure the amplitudes of two additional R waves.
• The P-wave amplitude. To measure the P wave amplitude, place one cursor on the baseline that precedes the P wave and the second cursor on the peak of the P wave. The value for V2-V1 on the ECG channel is this amplitude. Measure the amplitudes of two additional P waves.
• The T-wave amplitude. To measure the T wave amplitude, place one cursor on the baseline that precedes a P wave and the second cursor on the peak of the T wave that is in the same cycle as the P wave. The value for V2-V1 on the ECG channel is this amplitude. Measure the amplitudes of two additional T waves.
Human Heart – Six Lead ECG HH-4-8

iWor
x Sam
ple La
b
Figure HH-4-L4: ECG recording displayed in the Analysis window. Lines and labels were added to indicate the locations where cursors should be placed to measure the amplitudes of R (Q-R), P (Baseline-P), and T (Baseline-T) waves.
8. Calculate the mean amplitudes of the P wave, the R wave, and the T wave for each ECG lead. Enter your results into the Journal and Table HH-4-L1.
Table HH-4-L1: The Mean Amplitudes (in millivolts) for Each ECG Wave Recorded from Each Lead.
Mean Amplitudes (mV)
P Wave R Wave T Wave
Lead I
Lead II
Lead III
aVR
aVL
aVF
Human Heart – Six Lead ECG HH-4-9

iWor
x Sam
ple La
b
9. Determine the QRS axis of the subject:
• Examine the ECG recordings from the six limb leads. Find the lead that creates an ECG where the magnitude of the R wave is equal to magnitude of the S wave, but the two waves go in opposite directions. This lead is known as the isoelectric lead. The isoelectric lead often has the smallest QRS.
• Examine a diagram of Einthoven’s Triangle in the Background section. Determine which two leads are close to being perpendicular to the isoelectric lead. The QRS axis is the perpendicular lead that best fits the direction of the other ECG leads.
• If none of the leads are isoelectric, look for two of the leads that are close to being
isoelectric These two leads are always 30o apart. Find the perpendiculars for each lead and choose an approximate QRS axis within the 30o range. Occasionally each of the six coronal leads is small and/or isoelectric. The axis cannot be determined and is called indeterminate. This is a normal variant.
Questions
1. From which leads were upright R waves recorded? From which electrode (left arm, right arm, left leg, or right leg) and along which axis (-150, -30, 0, 60, 90, 120 degrees) were these leads “looking” at the depolarization of the ventricle? You may need to refer to the Background information to answer these questions.
2. From which leads were inverted R waves recorded? From which electrode (left arm, right arm, left leg, or right leg) and along which axis (-150, -30, 0, 60, 90, 120 degrees) were these leads looking at the depolarization of the ventricle?
3. Which lead is the isoelectric lead?
4. What is the QRS axis of the subject’s heart? Is the QRS axis of your subject within the normal range of the QRS axis? Refer to your textbook to find the normal range.
5. Which ECG lead provided the largest R wave for the subject?
6. Which lead is closest to the QRS axis of the heart?
Exercise 2: Six Lead ECG from Other Subjects
Aim: Record or obtain Six Lead ECGs from other subjects and determine the QRS axes of their hearts.
Procedure
Repeat Exercise 1 on another subject. Record a six lead ECG from as many subjects as possible.
Data Analysis
Use the same techniques used in Exercise 1 to analyze the data from other subjects.
Human Heart – Six Lead ECG HH-4-10

iWor
x Sam
ple La
b
Questions
1. Do the R waves from the same lead go in the same direction for all subjects? The P waves? The T waves?
2. What would cause an ECG wave from the same lead to go in the opposite directions in different subjects?
3. Do all subjects have the same QRS axis? What is the range of QRS axes from all the subjects in the class? Does the any subject have a QRS axis that is outside the normal range?
4. Does any subject have an inverted P or T wave on any lead when compared to the same lead from a normal ECG?
Appendix: Equations Used by LabScribe to Graph the Augmented Limb Leads
The ECG is a representation of the electrical activity of the heart. It is a vector quantity with magnitude and direction. The various leads (I, II, III, aVL, aVR, aVF) measure the magnitude of the ECG along a particular direction (Figure HH-4-L5).
The derivations of the equations used to calculate the cardiograms for the four other limb leads (III, aVL, aVR, aVF) from the cardiograms recorded from Leads I and II are provided for your information. These equations do not need to be used to perform this experiment. The computed functions that calculate the four remaining limb leads are already programmed in the settings file for this experiment.
Figure HH-4-L5: Lead I is the projection of the cardiac vector (V) along the Lead I axis. Similarly Lead II is the projection of cardiac vector along the Lead II axis, and so on.
Treat ECG as a Vector with magnitude V and an angle θ:
Lead I = Vcos(θ)
Lead II = Vcos(60 - θ)
Lead III = -Vcos(60 + θ)
Human Heart – Six Lead ECG HH-4-11

iWor
x Sam
ple La
b
aVF = Vsin(θ)
aVL = Vcos(30 + θ)
aVR = -Vcos(30 - θ)
1. Calculate Lead III from Leads I and II:
Lead I = I = Vcos(θ) (1)
Lead II = II = Vcos(60 - θ) (2)
Lead III = III = -Vcos(60 + θ) (3)
Using the following trigonometric identities:
cos(A + B) = cosA cosB - sinA sinB (4)
cos (A - B) = cosA cosB + sinA sinB (5)
2. From equations 3 and 4:
III = -V{cos(60)*cos(θ) - sin(60)*sin(θ)} (6)
3. Using equations 2 and 5:
II = V{cos(60)*cos(θ) + sin(60)*sin(θ)} (7)
4. Adding equations 6 and 7:
II - III = 2*V*cos(60)*cos(θ) = 2*V*0.5*cos(θ) = Vcos(θ)
5. Therefore:
II - III = I; III = II - I; and, Lead III = Lead II - Lead I
Calculate aVF from Leads I and II:
aVF = Vsin(θ) (8)
1. From equation 7:
II = V{cos(60)*cos(θ) + sin(60)*sin(θ)}
II = (1/2)*Vcos(θ) + (^/3)/2*V*sin(θ)
2(II) = I+(^/3)*V*sin(θ)
2. Therefore:
V*sin(θ) = (2(II) - I)/ ^/3 (9)
and:
aVF = (2(II) - I)/ ^/3 (10)
Calculating aVL from Leads I and II:
Human Heart – Six Lead ECG HH-4-12

iWor
x Sam
ple La
b
aVL = Vcos(30+θ)
1. Therefore:
aVL = V{cos(30)*cos(θ) - sin(30)*sin(θ)}
aVL = cos(30)*Vcos(θ) - sin(3)*Vsin(θ)
aVL = cos(30)*I - sin(30)*aVF
2. Therefore:
aVL = ((^/3)/2)*I - (1/2)*(2*II - I)/ ^/3
aVL = ((^/3)/2)*I - II /^/3 + (1/2)*I / ^/3
aVL = (2*I - II)/ ^/3 (11)
Calculate aVR from Leads I and II:
aVR = -Vcos(30-θ)
1. Therefore:
aVR = -V{cos(30)*cos(θ) + sin(30)*sin(θ)}
aVR = -cos(30)*I - sin(30)*aVF
2. Therefore:
aVR = -((^/3)/2)*I - (1/2)*(2*II - I)/ ^/3
aVR = -((^/3)/2)*I - II/ ^/3 + (1/2)*I/ ^/3
aVR = -(I+ II)/ ^/3 (12)
Calculate Cardiac Angle from Leads I and II:
1. From equation 9:
V*sin(θ) = (2*II - I)/ ^/3
2. From equation 1:
Vcos(θ) = I
3. Dividing equation 9 by equation 1:
tan(θ) = {(2*II - I)/ ^/3}/I
θ = + Arctan((2*II - I)/^/3 *I) (13)
Human Heart – Six Lead ECG HH-4-13