expedition 317 site u1351b ocean -...
TRANSCRIPT
Run 1
Run 2
Run 3
@@
@ @ @ @
Witnessed B
yR
ecorded By
LocationU
nit Num
berT
ime
Logger On B
ottomT
ime
Circulation S
topped M
aximum
Recorded T
emperatures
RM
F @
MR
TR
M @
MR
TR
MC
Source R
MF
RM
C @
Measured T
emperature
RM
F @
Measured T
emperature
RM
@ M
easured Tem
peratureS
ource Of S
ample
PH
Fluid Loss
Viscosity
Density
MUD Type F
luid In Hole
Bit S
izeC
asing Schlum
bergerC
asing Driller S
ize @ D
epthT
op Log IntervalB
ottom Log Interval
Schlum
berger Depth
Depth D
rillerR
un Num
berLogging D
ate
@
@ @ @ @ 11.00 m
0.00 m
11.00 m
above Perm
. Datum
E 171* 50.408’
Latitude
@
@ @ @ @
A. S
lagle, G. G
uerinC
. Furm
an Houston
62500310:30
25−N
ov−2009
11:0024−
Nov−
200915 degC
15 @
15 @
N/A
N/A
@ @ @N
/A
1.258 g/cm3
Seaw
ater Gel
11.438 in82.5 m
83.3 m@
4.500 in82.5 m468.5 m485.5 m1030.5 m2 25−
Nov−
2009
Witnessed B
yR
ecorded By
LocationU
nit Num
berT
ime
Logger On B
ottomT
ime
Circulation S
topped M
aximum
Recorded T
emperatures
RM
F @
MR
TR
M @
MR
TR
MC
Source R
MF
RM
C @
Measured T
emperature
RM
F @
Measured T
emperature
RM
@ M
easured Tem
peratureS
ource Of S
ample
PH
Fluid Loss
Viscosity
Density
MUD Type F
luid In Hole
Bit S
izeC
asing Schlum
bergerC
asing Driller S
ize @ D
epthT
op Log IntervalB
ottom Log Interval
Schlum
berger Depth
Depth D
rillerR
un Num
berLogging D
ate
11.00 mD
.F.
0.00 mG
.L.
11.00 mK
.B.
Drill F
loorD
rilling Measured F
rom:
above Perm
. Datum
0.00 mD
rill Floor
Log Measured F
rom:
E 171* 50.408’
S 44* 43.044’Longitude
0 degM
ax. Hole D
evi.
Elev.:
0.00 mS
ea Floor
Perm
anent Datum
:
Elev.:
AP
I Serial N
o.
Rig:
Field:
Location:
Well:
Company:
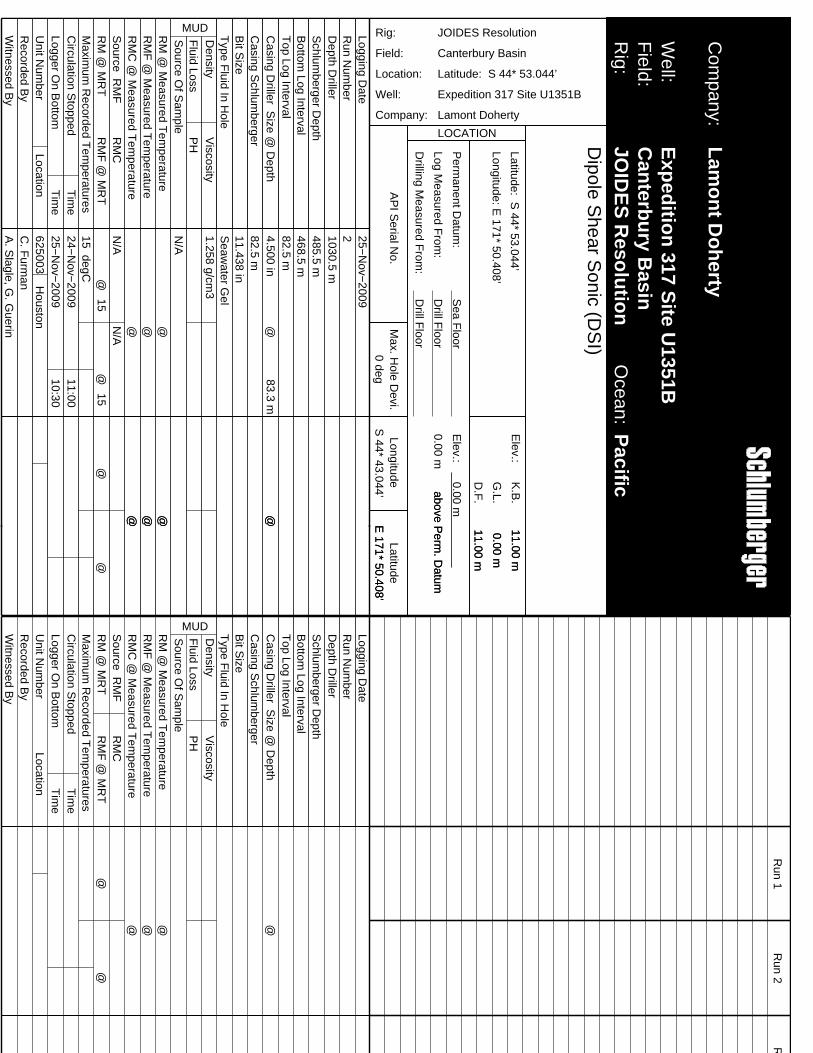
JOIDES Resolution
Canterbury Basin
Latitude: S 44* 53.044’
Expedition 317 Site U1351B
Lamont Doherty
LOCATION
Latitude: S 44* 53.044’
Longitude: E 171* 50.408’
Dipole S
hear Sonic (D
SI)
Pacific
JOID
ES
Resolution
Canterbury B
asinE
xpedition 317 Site U
1351B
Lamont D
oherty
Ocean:
Rig:
Field:
Well:
Com
pany:

RUN 1 RUN 2
Depths shown are measured depth below sea floor, as per client request.Depth "Zero" reference adjusted to Sea Bed picked by client.
Depth correlated to Run #1, DIT−APS−HLDS−HNGS recorded on 24 NOV 09 in this hole.
STOP STOPSTART STARTLOGGED INTERVAL LOGGED INTERVALFLUID LEVEL: FLUID LEVEL:
17C0−154PROGRAM VERSION: PROGRAM VERSION:SERVICE ORDER #: SERVICE ORDER #:
RUN 1 RUN 2EQUIPMENT DESCRIPTION
DOWNHOLE EQUIPMENT
32.59HNGS−BA 194
33.50DTC−H ECH−KC 2304
34.39LEH−QT LEH−QT
31.67Lower_2 31.89Upper_1
32.59ToolStatu TelStatus
33.22CTEM
SURFACE EQUIPMENTGSR−U 616008WITM (DTS)−A
Depth correlated to Run #1, DIT−APS−HLDS−HNGS recorded on 24 NOV 09 in this hole.FMS EMEX mode was "Automatic"; DSI run with Monopole=MF, LD=LF, UD=Std.Logs recorded from maximum depth reached, 619mBRF, to bit depth.Logging tools were unable to descend below 619mBRF due to hole collapse.FMS Caliper closed and EMEX deactivated at 254.9m to facilitate pipe re−entry.Tools run slick in order to fit through drill pipe, as is standard practice on this project.Hole Size input taken from FMS Caliper Axis 1.TD was found to be 1163mBRF with the pipe (bit) at 216mBRF. Sea Bed given as 132.7mBRF.Average heave during the run was only 0.2m; Active Heave Compensator not used.core data collected in surface labs.Logs run in second hole ("B" hole) of drilling site U1351 to aid in depth correlation ofREMARKS: RUN NUMBER 1
HNGSOS4:APS/HLDSOS3:DITOS2:FMSOS1:
OTHER SERVICES1
DISCLAIMERTHE USE OF AND RELIANCE UPON THIS RECORDED−DATA BY THE HEREIN NAMED COMPANY (AND ANY OF ITSAFFILIATES, PARTNERS, REPRESENTATIVES, AGENTS, CONSULTANTS AND EMPLOYEES) IS SUBJECT TO THE TERMSAND CONDITIONS AGREED UPON BETWEEN SCHLUMBERGER AND THE COMPANY, INCLUDING: (a) RESTRICTIONS ONUSE OF THE RECORDED−DATA; (b) DISCLAIMERS AND WAIVERS OF WARRANTIES AND REPRESENTATIONS REGARDINGCOMPANY’S USE OF AND RELIANCE UPON THE RECORDED−DATA; AND (c) CUSTOMER’S FULL AND SOLE RESPONSIBILITYFOR ANY INFERENCE DRAWN OR DECISION MADE IN CONNECTION WITH THE USE OF THIS RECORDED−DATA.
Run 3
Run 4
@@
@ @ @ @

ALL LENGTHS IN METERSMEASUREMENTS RELATIVE TO TOOL ZERO
MAXIMUM STRING DIAMETER 3.75 IN
7.68MEST−B MEAH−BMEAC−AMEPH−AGPIC−AMEPC−ABMEDS−B 770
8.90DTA−A ECH−KE 8451
11.19AH−MCD_LOWER AH−MCD_LOWER 2
TOOL ZERO0.00Tension GPIT
HV DF 0.46MEPC MEDS−B
MEDR MEAC
MDProduction String Well Schematic Casing String
MDOD ID OD ID
(in) (m) (m) (in)
11.19AH−MCD_LOWER
26.73DSST−B SPAC−B 16ECH−SD 16SMDR−BD 8070SSIJ−BA 8127SMDX−AA 8147
29.02AH−MCD_TOP AH−MCD_TOP 1
30.09HNGC−B 300HNGH−A 115
32.59HNGS−BA 194HNGS−BA 194HNSH−BA 205
11.19PWF
29.55HNGC Stat
31.67Lower_2 31.89Upper_1
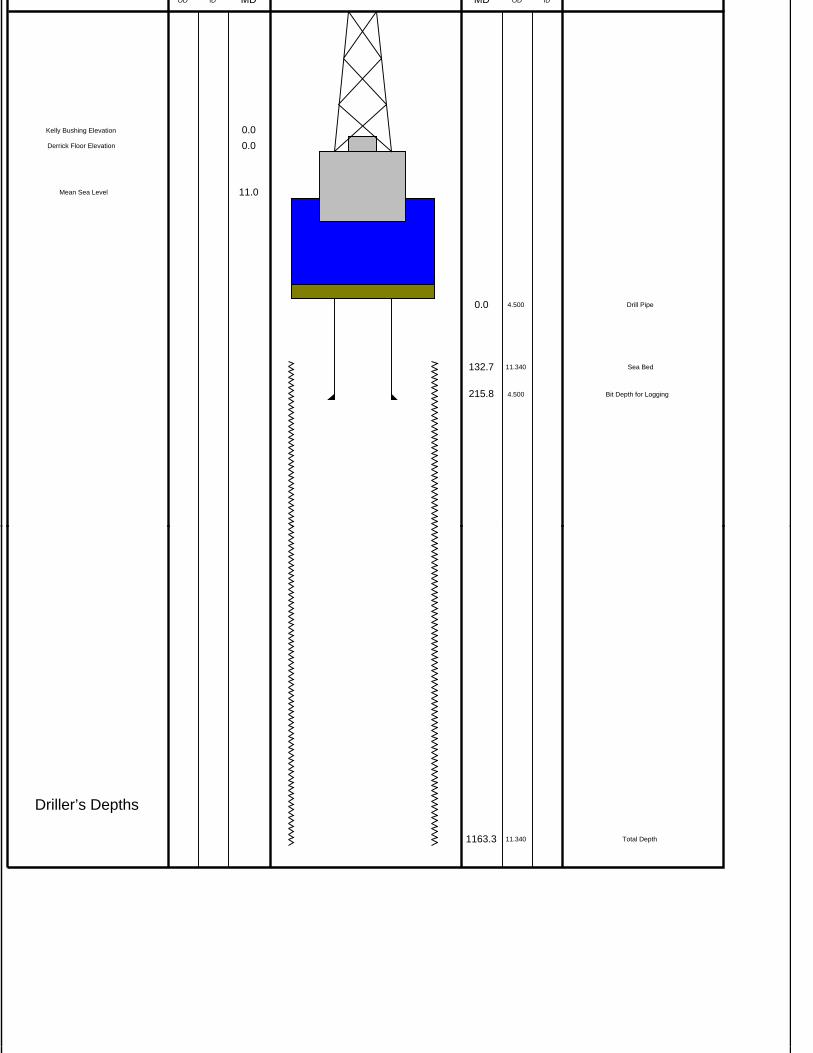
1163.3 11.340 Total Depth
Driller’s Depths
MD MDOD ID OD ID
11.0Mean Sea Level
0.0Derrick Floor Elevation
0.0Kelly Bushing Elevation
0.0 4.500 Drill Pipe
215.8 4.500 Bit Depth for Logging
132.7 11.340 Sea Bed

OP System Version: 17C0−154
MEST−B SRPC−3870_Q3_2009_OP17_V3_b DTA−A 17C0−154DSST−B 17C0−154 HNGC−B 17C0−154HNGS−BA 17C0−154 DTC−H 17C0−154
Input DLIS FilesDEFAULT FMS_DSI_NGS_030PUP FN:40 PRODUCER 26−Nov−2009 13:40 619.5 M 206.3 M
Output DLIS FilesDEFAULT FMS_DSI_NGS_052PUP FN:62 PRODUCER 31−Dec−2009 20:54 486.9 M 73.9 M
Company: Lamont Doherty Well: Expedition 317 Site U1351B
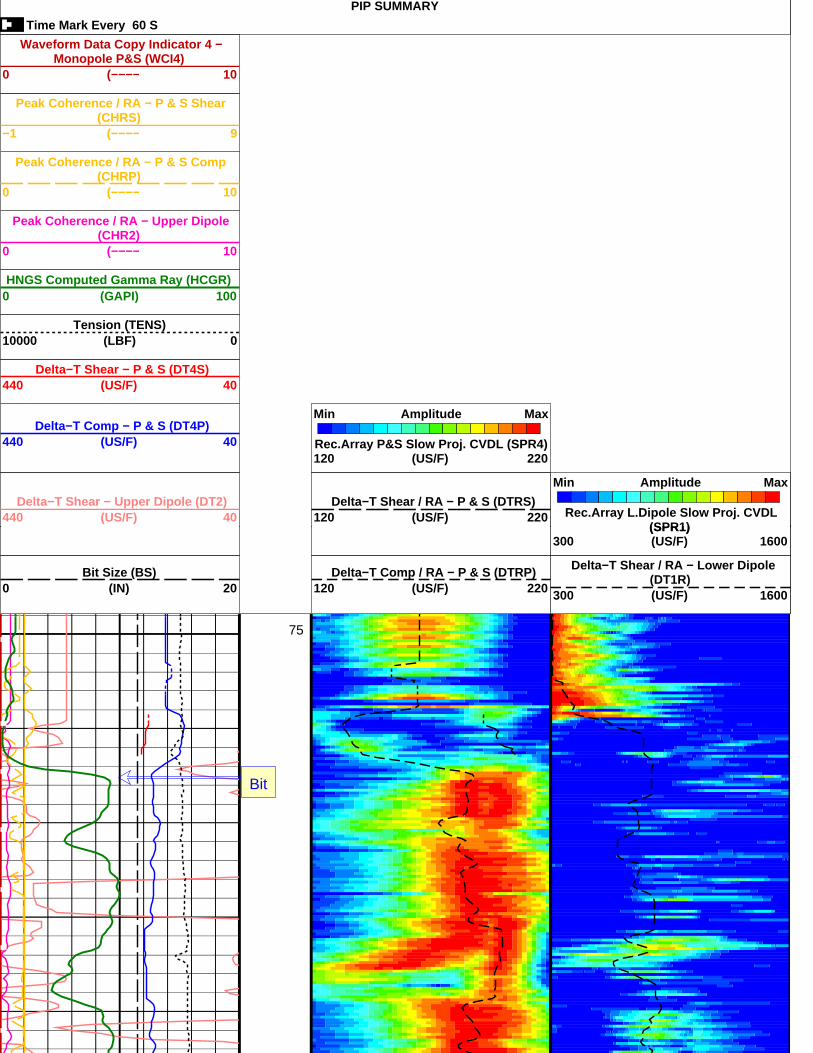
PIP SUMMARY
MAXIS Field Log
Main Pass
(US/F)
Bit Size (BS)(IN)0 20
(US/F)440 40
Delta−T Comp / RA − P & S (DTRP)(US/F)120 220
(US/F)120 220
Delta−T Shear / RA − Lower Dipole(DT1R)(US/F)300 1600
(SPR1)300 1600
75
Bit
(US/F)
Delta−T Shear − Upper Dipole (DT2)(US/F)440 40
Delta−T Shear / RA − P & S (DTRS)(US/F)120 220
Delta−T Comp − P & S (DT4P)(US/F)440 40
Delta−T Shear − P & S (DT4S)(US/F)440 40
Peak Coherence / RA − Upper Dipole(CHR2)
(−−−−)0 10
Peak Coherence / RA − P & S Comp(CHRP)
(−−−−)0 10
Peak Coherence / RA − P & S Shear(CHRS)
(−−−−)−1 9
Waveform Data Copy Indicator 4 −Monopole P&S (WCI4)
(−−−−)0 10
HNGS Computed Gamma Ray (HCGR)(GAPI)0 100
Tension (TENS)(LBF)10000 0
AmplitudeMin Max
Rec.Array P&S Slow Proj. CVDL (SPR4)120 220
AmplitudeMin Max
Rec.Array L.Dipole Slow Proj. CVDL(SPR1)
PIP SUMMARY
Time Mark Every 60 S
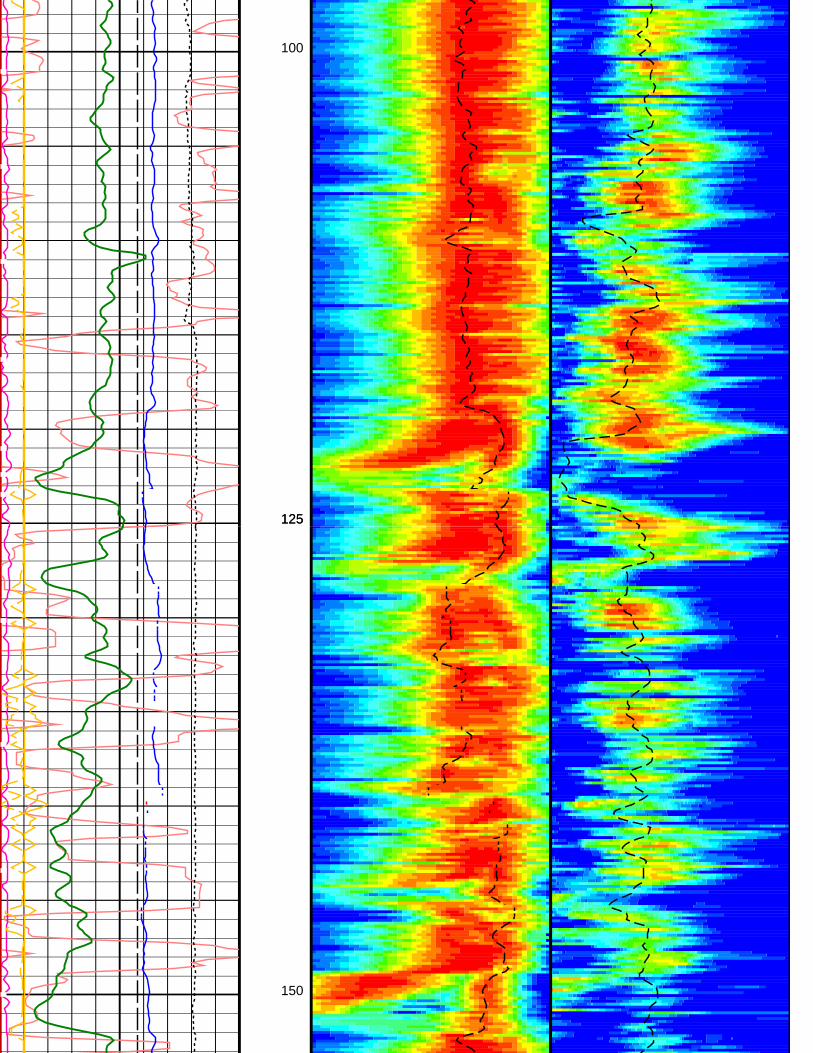
125
150
100
125

200
175
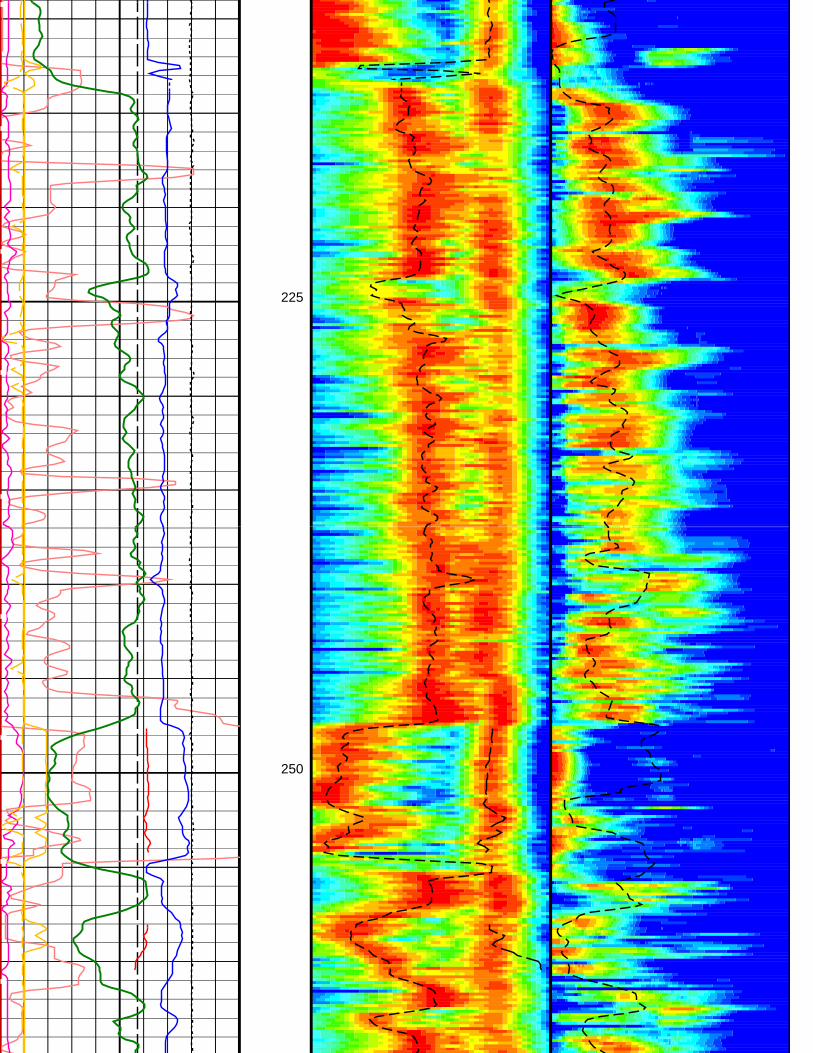
250
225
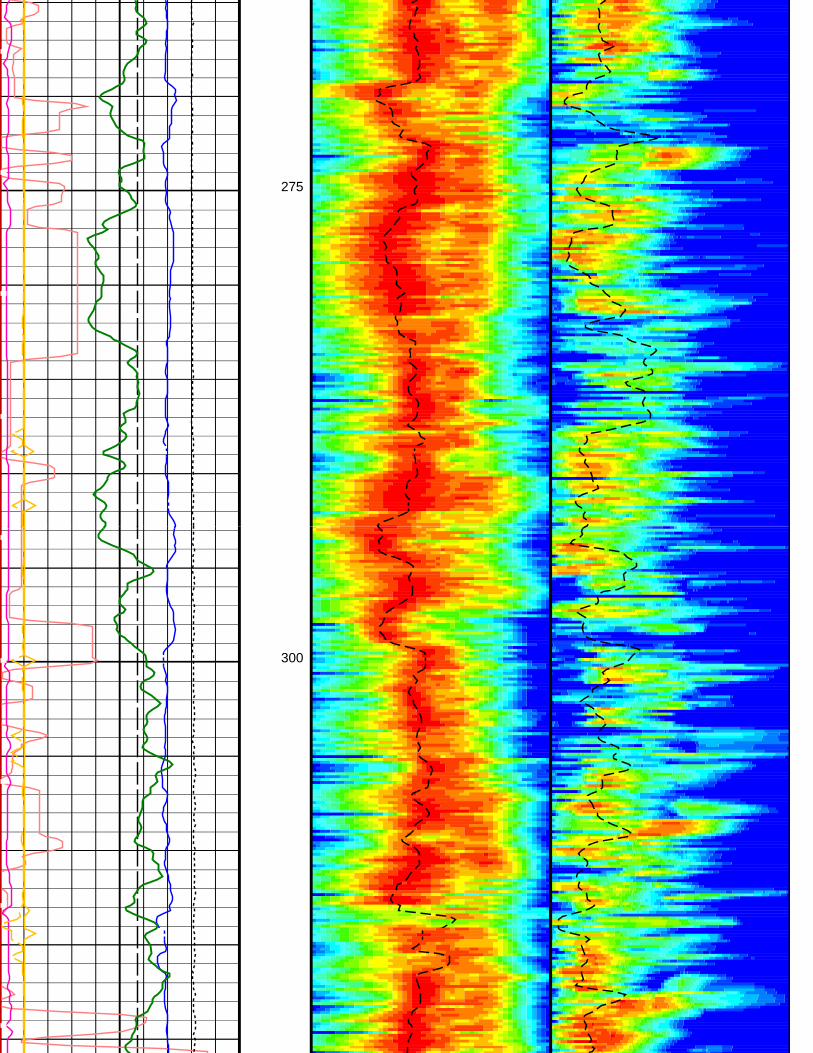
300
275

375
350
325

425
400

Bit Size (BS)(IN)0 20
Delta−T Comp / RA − P & S (DTRP)(US/F)120 220
Delta−T Shear / RA − Lower Dipole(DT1R)
475
FR DSI
450
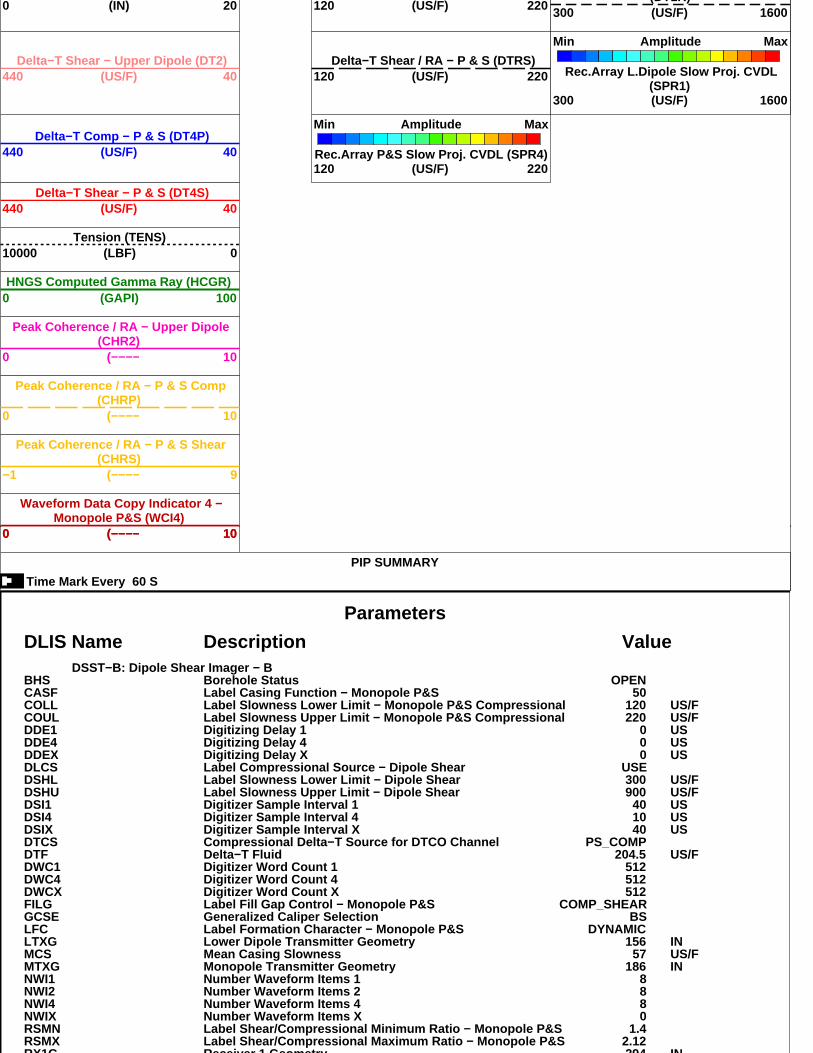
Parameters
DLIS Name Description ValueDSST−B: Dipole Shear Imager − B
BHS Borehole Status OPENCASF Label Casing Function − Monopole P&S 50COLL Label Slowness Lower Limit − Monopole P&S Compressional 120 US/FCOUL Label Slowness Upper Limit − Monopole P&S Compressional 220 US/FDDE1 Digitizing Delay 1 0 USDDE4 Digitizing Delay 4 0 USDDEX Digitizing Delay X 0 USDLCS Label Compressional Source − Dipole Shear USEDSHL Label Slowness Lower Limit − Dipole Shear 300 US/FDSHU Label Slowness Upper Limit − Dipole Shear 900 US/FDSI1 Digitizer Sample Interval 1 40 USDSI4 Digitizer Sample Interval 4 10 USDSIX Digitizer Sample Interval X 40 USDTCS Compressional Delta−T Source for DTCO Channel PS_COMPDTF Delta−T Fluid 204.5 US/FDWC1 Digitizer Word Count 1 512DWC4 Digitizer Word Count 4 512DWCX Digitizer Word Count X 512FILG Label Fill Gap Control − Monopole P&S COMP_SHEARGCSE Generalized Caliper Selection BSLFC Label Formation Character − Monopole P&S DYNAMICLTXG Lower Dipole Transmitter Geometry 156 INMCS Mean Casing Slowness 57 US/FMTXG Monopole Transmitter Geometry 186 INNWI1 Number Waveform Items 1 8NWI2 Number Waveform Items 2 8NWI4 Number Waveform Items 4 8NWIX Number Waveform Items X 0RSMN Label Shear/Compressional Minimum Ratio − Monopole P&S 1.4RSMX Label Shear/Compressional Maximum Ratio − Monopole P&S 2.12RX1G Receiver 1 Geometry 294 IN
Monopole P&S (WCI4)(−−−−)0 10
PIP SUMMARY
Time Mark Every 60 S
(US/F)
(US/F)
(IN)0 20
Delta−T Shear − Upper Dipole (DT2)(US/F)440 40
(US/F)120 220
Delta−T Shear / RA − P & S (DTRS)(US/F)120 220
Delta−T Comp − P & S (DT4P)(US/F)440 40
Delta−T Shear − P & S (DT4S)(US/F)440 40
Peak Coherence / RA − Upper Dipole(CHR2)
(−−−−)0 10
Peak Coherence / RA − P & S Comp(CHRP)
(−−−−)0 10
Peak Coherence / RA − P & S Shear(CHRS)
(−−−−)−1 9
Waveform Data Copy Indicator 4 −Monopole P&S (WCI4)
(−−−−)0 10
(DT1R)(US/F)300 1600
HNGS Computed Gamma Ray (HCGR)(GAPI)0 100
Tension (TENS)(LBF)10000 0
AmplitudeMin Max
Rec.Array P&S Slow Proj. CVDL (SPR4)120 220
AmplitudeMin Max
Rec.Array L.Dipole Slow Proj. CVDL(SPR1)
300 1600

TBF4 STC Time for Baseline Fill − Monopole P&S 300 USTLL1 STC Time Lower Limit − Lower Dipole 2450 USTLL4 STC Time Lower Limit − Monopole P&S 580 USTST1 STC Time Step − Lower Dipole 200 USTST4 STC Time Step − Monopole P&S 50 USTUL1 STC Time Upper Limit − Lower Dipole 20440 USTUL4 STC Time Upper Limit − Monopole P&S 3480 USTWD1 STC Time Width − Lower Dipole 2000 USTWD4 STC Time Width − Monopole P&S 1000 USTWI1 STC Integration Time Window − Lower Dipole 1600 USTWI2 STC Integration Time Window − Upper Dipole 1600 USTWI4 STC Integration Time Window − Monopole P&S 500 USTWSX Transmitter Waveform Select X 0UTXG Upper Dipole Transmitter Geometry 162 INWFM4 Waveform Mode 4 W1
HNGS−BA: Hostile Natural Gamma Ray SondeBAR1 HNGS Detector 1 Barite Constant 1BAR2 HNGS Detector 2 Barite Constant 1BHK HNGS Borehole Potassium Correction Concentration 0BHS Borehole Status OPENCSD1 Inner Casing Outer Diameter 0 INCSD2 Outer Casing Outer Diameter 0 INCSW1 Inner Casing Weight 0 LB/FCSW2 Outer Casing Weight 0 LB/FDBCC HNGS Barite Constant Correction Flag NONEGCSE Generalized Caliper Selection BSH1P HNGS Detector 1 Allow/Disallow In Processing ALLOWH2P HNGS Detector 2 Allow/Disallow In Processing ALLOWHABK HNGS Borehole Potassium Running Average −0.0016678HALF HNGS Alpha Filter Length 60 INHCRB HNGS Apply Borehole Potassium Correction NONEHMWM Mud Weighting Material BARIHNPE HNGS Processing Enable YESS1BI HNGS Detector 1 Calibration Bismuth Count Rate 1.3 CPSS2BI HNGS Detector 2 Calibration Bismuth Count Rate 1.3 CPSSGRC HNGS Standard Gamma−Ray Correction Flag YESTPOS Tool Position ECCEVBA1 HNGS Detector 1 Variable Barite Factor Running Average 1.00399VBA2 HNGS Detector 2 Variable Barite Factor Running Average 1.01062
System and MiscellaneousBS Bit Size 11.438 INDFD Drilling Fluid Density 1.26 G/C3DO Depth Offset for Playback −132.5 MPP Playback Processing NORMAL
RX1G Receiver 1 Geometry 294 INRX2G Receiver 2 Geometry 300 INRX3G Receiver 3 Geometry 306 INRX4G Receiver 4 Geometry 312 INRX5G Receiver 5 Geometry 318 INRX6G Receiver 6 Geometry 324 INRX7G Receiver 7 Geometry 330 INRX8G Receiver 8 Geometry 336 INSAM1 DSST Sonic Acquisition Mode 1 − Lower Dipole Mode LFD_EVENSAM4 DSST Sonic Acquisition Mode 4 − High Frequency Monopole Mode for P&S
MFD_ODDSAMX DSST Sonic Acquisition Mode X − Both Dipoles or Monopole Mode for Expert
OFFSAS1 STC Sonic Array Status − Lower Dipole 255SAS2 STC Sonic Array Status − Upper Dipole 255SAS4 STC Sonic Array Status − Monopole P&S 255SBO1 STC Search Band Offset − Lower Dipole 3000 USSBO4 STC Search Band Offset − Monopole P&S 500 USSBR4 STC Baseline Removal − Monopole P&S ONSBW1 STC Search Bandwidth − Lower Dipole 8000 USSBW4 STC Search Bandwidth − Monopole P&S 2000 USSFC1 STC Formation Character − Lower Dipole SELECTABLESFC4 STC Formation Character − Monopole P&S SELECTABLESFM1 STC Filter − Lower Dipole B.3−1.5KSFM2 STC Filter − Upper Dipole B1−2KSFM4 STC Filter − Monopole P&S B3−12KSHLL Label Slowness Lower Limit − Monopole P&S Shear 120 US/FSHUL Label Slowness Upper Limit − Monopole P&S Shear 220 US/FSLL1 STC Slowness Lower Limit − Lower Dipole 300 US/FSLL4 STC Slowness Lower Limit − Monopole P&S 120 US/FSST1 STC Slowness Step − Lower Dipole 4 US/FSST4 STC Slowness Step − Monopole P&S 2 US/FSSW1 STC Source Waveform − Lower Dipole WF_SAM1SSW2 STC Source Waveform − Upper Dipole WF_SAM2SSW4 STC Source Waveform − Monopole P&S WF_SAM4STLL Label Slowness Lower Limit − Monopole Stoneley 180 US/FSTUL Label Slowness Upper Limit − Monopole Stoneley 780 US/FSUL1 STC Slowness Upper Limit − Lower Dipole 1600 US/FSUL4 STC Slowness Upper Limit − Monopole P&S 220 US/FSWD1 STC Slowness Width − Lower Dipole 40 US/FSWD4 STC Slowness Width − Monopole P&S 10 US/FTBF1 STC Time for Baseline Fill − Lower Dipole 0 USTBF4 STC Time for Baseline Fill − Monopole P&S 300 USTLL1 STC Time Lower Limit − Lower Dipole 2450 US

Hostile Natural Gamma Ray Cartridge − B / Equipment Identification
Primary Equipment:HNGC Cartridge HNGC − B 300
Auxiliary Equipment:HNGC Housing HNGH − A 115
Coincidence Count Rate Ratio 1.000 0.9839 1.005 1.007 0.001954 0.05000 Master: 31−Oct−2009 10:09 Before: 24−Nov−2009 10:30 After: 24−Nov−2009 17:47 Hostile Natural Gamma Ray Sonde Wellsite Calibration − Ratio Of Detector 1 To Detector 2
Na Count Rate 45.00 35.36 33.56 33.18 −0.3781 8.000 CPSTemperature 15.50 36.37 23.56 25.33 1.769 N/A DEGCNa 1785 Peak Res 8.500 8.652 8.393 8.244 −0.1482 2.000 %Na 1785 Peak Loc 142.6 142.2 142.2 142.2 0.02171 7.000 High Voltage 1150 1123 1094 1099 5.689 N/A VNa 511 Peak Res 15.50 15.54 16.26 15.22 −1.044 2.000 %Na 511 Peak Loc 40.00 39.63 39.59 39.66 0.07236 1.000
Master: 31−Oct−2009 10:09 Before: 24−Nov−2009 10:30 After: 24−Nov−2009 17:47 Hostile Natural Gamma Ray Sonde Wellsite Calibration − Detector 2 Check
Na Count Rate 45.00 34.81 33.69 33.43 −0.2596 8.000 CPSTemperature 15.50 36.12 22.82 23.64 0.8194 N/A DEGCNa 1785 Peak Res 8.500 8.076 7.708 8.978 1.271 2.000 %Na 1785 Peak Loc 142.6 142.5 142.1 141.9 −0.1621 7.000 High Voltage 1150 1200 1157 1165 7.953 N/A VNa 511 Peak Res 15.50 16.07 15.05 15.48 0.4290 2.000 %Na 511 Peak Loc 40.00 39.48 39.62 39.47 −0.1509 1.000
Master: 31−Oct−2009 10:09 Before: 24−Nov−2009 10:30 After: 24−Nov−2009 17:47 Hostile Natural Gamma Ray Sonde Wellsite Calibration − Detector 1 Check
Measurement MasterNominal Before After Change Limit Units
Calibration and Check Summary
Input DLIS FilesDEFAULT FMS_DSI_NGS_030PUP FN:40 PRODUCER 26−Nov−2009 13:40 619.5 M 206.3 M
Output DLIS FilesDEFAULT FMS_DSI_NGS_052PUP FN:62 PRODUCER 31−Dec−2009 20:54
OP System Version: 17C0−154
MEST−B SRPC−3870_Q3_2009_OP17_V3_b DTA−A 17C0−154DSST−B 17C0−154 HNGC−B 17C0−154HNGS−BA 17C0−154 DTC−H 17C0−154
Format: DSST_P_S_LOWER_VDL_COLOR Vertical Scale: 1:200 Graphics File Created: 31−Dec−2009 20:54
DO Depth Offset for Playback −132.5 MPP Playback Processing NORMAL
Calibration and Check Summary
MAXIS Field Log
Calibrations

Phase
Before
Master
Coincidence Count Rate Ratio Value
1.005
Phase
After
Before
Master
Na Count Rate CPS
(Minimum) 10.00
(Nominal) 45.00
(Maximum) 100.0
Value
33.18
33.56
35.36
Phase
After
Before
Master
Na 1785 Peak Loc
(Minimum) 135.0
(Nominal) 142.6
(Maximum) 150.3
Value
142.2
142.2
142.2
Phase
After
Before
Master
Na 1785 Peak Res %
(Minimum) 7.000
(Nominal) 8.500
(Maximum) 11.00
Value
8.244
8.393
8.652
Phase
After
Before
Master
Temperature DEGC
(Minimum)−28.89
(Nominal) 15.50
(Maximum) 60.00
Value
25.33
23.56
36.37
Phase
After
Before
Master
Na 511 Peak Loc
(Minimum) 37.50
(Nominal) 40.00
(Maximum) 43.50
Value
39.66
39.59
39.63
Phase
After
Before
Master
Na 511 Peak Res %
(Minimum) 12.00
(Nominal) 15.50
(Maximum) 19.00
Value
15.22
16.26
15.54
Phase
After
Before
Master
High Voltage V
(Minimum) 900.0
(Nominal) 1150
(Maximum) 1600
Value
1099
1094
(Minimum) (Nominal) (Maximum)
Master: 31−Oct−2009 10:09 Before: 24−Nov−2009 10:30 After: 24−Nov−2009 17:47
1123
Detector 2 Check
Hostile Natural Gamma Ray Sonde Wellsite Calibration
Master: 31−Oct−2009 10:09 Before: 24−Nov−2009 10:30 After: 24−Nov−2009 17:47
0.9839
Ratio Of Detector 1 To Detector 2
Hostile Natural Gamma Ray Sonde Wellsite Calibration
Hostile Natural Gamma Ray Sonde / Equipment Identification
Primary Equipment:HNGS Sonde HNGS − BA 194
Auxiliary Equipment:HNGS Sonde Housing HNSH − BA 205Gamma Source Radioactive GSR − U 616008
Phase
After
Before
Master
Na Count Rate CPS
(Minimum) 10.00
(Nominal) 45.00
(Maximum) 100.0
Value
33.43
33.69
34.81
Phase
After
Before
Master
Na 1785 Peak Loc
(Minimum) 135.0
(Nominal) 142.6
(Maximum) 150.3
Value
141.9
142.1
142.5
Phase
After
Before
Master
Na 1785 Peak Res %
(Minimum) 7.000
(Nominal) 8.500
(Maximum) 11.00
Value
8.978
7.708
8.076
Phase
After
Before
Master
Temperature DEGC
(Minimum)−28.89
(Nominal) 15.50
(Maximum) 60.00
Value
23.64
22.82
36.12
Phase
After
Before
Master
Na 511 Peak Loc
(Minimum) 37.50
(Nominal) 40.00
(Maximum) 43.50
Value
39.47
39.62
39.48
Phase
After
Before
Master
Na 511 Peak Res %
(Minimum) 12.00
(Nominal) 15.50
(Maximum) 19.00
Value
15.48
15.05
16.07
Phase
After
Before
Master
High Voltage V
(Minimum) 900.0
(Nominal) 1150
(Maximum) 1600
1200
1157
Value
1165
Detector 1 Check
Hostile Natural Gamma Ray Sonde Wellsite Calibration

Dipole Shear Sonic (DSI)
Rig:Ocean:
JOIDES ResolutionPacific
DTS Telemetry Tool / Equipment Identification
Primary Equipment:DTC−H Auxiliary Cartridge DTCH − ADTC−H Telemetry Cartridge DTCH − A 8753
Auxiliary Equipment:DTCH Telemetry Cartridge Housing ECH − KC 2304
After
Before
(Minimum) 0.9500
(Nominal) 1.000
(Maximum) 1.050
1.007
1.005
After: 24−Nov−2009 17:47
Before: 24−Nov−2009 10:30
Master: 31−Oct−2009 10:09
Company:
Well:Field:Rig:Ocean:
Lamont Doherty
Expedition 317 Site U1351BCanterbury BasinJOIDES ResolutionPacific