expected growth for 2021 to approach 35%
TRANSCRIPT

Public
ASML 2021 Third-Quarter
Veldhoven, the Netherlands
October 20, 2021
ASML reports €5.2 billion net sales and €1.7 billion net income in Q3 2021
Expected growth for 2021 to approach 35%

PublicPage 2October 20, 2021
• Investor key messages
• Business summary
• Outlook
• Financial statements
Agenda

PublicPage 3October 20, 2021
Investor key messages
PublicPage 4October 20, 2021
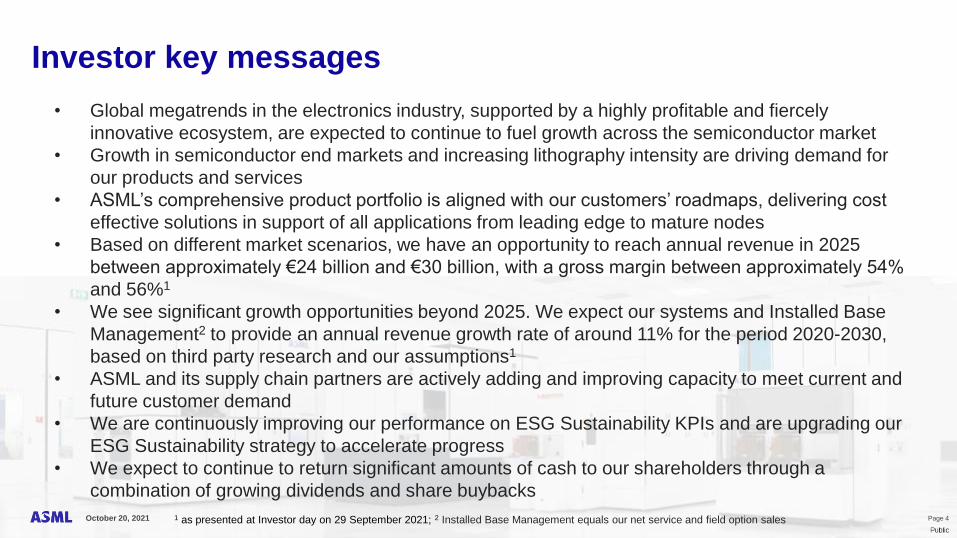
Investor key messages
• Global megatrends in the electronics industry, supported by a highly profitable and fiercely
innovative ecosystem, are expected to continue to fuel growth across the semiconductor market
• Growth in semiconductor end markets and increasing lithography intensity are driving demand for
our products and services
• ASML’s comprehensive product portfolio is aligned with our customers’ roadmaps, delivering cost
effective solutions in support of all applications from leading edge to mature nodes
• Based on different market scenarios, we have an opportunity to reach annual revenue in 2025
between approximately €24 billion and €30 billion, with a gross margin between approximately 54%
and 56%1
• We see significant growth opportunities beyond 2025. We expect our systems and Installed Base
Management2 to provide an annual revenue growth rate of around 11% for the period 2020-2030,
based on third party research and our assumptions1
• ASML and its supply chain partners are actively adding and improving capacity to meet current and
future customer demand
• We are continuously improving our performance on ESG Sustainability KPIs and are upgrading our
ESG Sustainability strategy to accelerate progress
• We expect to continue to return significant amounts of cash to our shareholders through a
combination of growing dividends and share buybacks
1 as presented at Investor day on 29 September 2021; 2 Installed Base Management equals our net service and field option sales

PublicPage 5October 20, 2021
Business summary

PublicPage 6October 20, 2021
Q3 results summary
• Net sales of €5.2 billion, net systems sales of €4.1 billion, Installed Base Management1
sales of €1.1 billion
• Gross margin of 51.7%
• Operating margin of 36.6%
• Net income as a percentage of net sales of 33.2%
• Earnings per share (basic) of €4.27
• Net bookings of €6.2 billion, including €2.9 billion of EUV 0.33 NA systems
1 Installed Base Management equals our net service and field option sales
PublicPage 7October 20, 2021
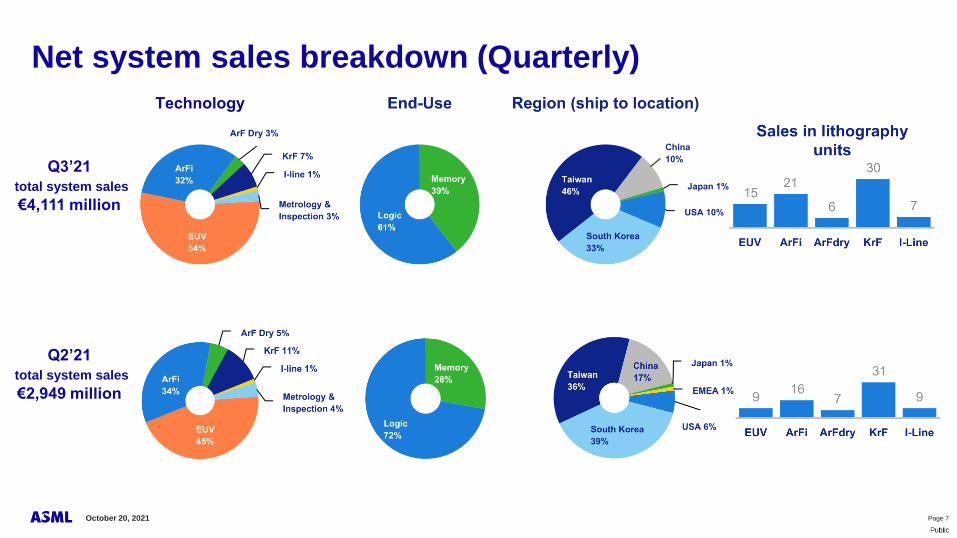
Net system sales breakdown (Quarterly)
Q3’21
total system sales
€4,111 million
Q2’21
total system sales
€2,949 million

PublicPage 8October 20, 2021
Logic
Memory
Installed Base
Management1
As of January 1, 2018, ASML has adopted the new Revenue Recognition Standard (ASC 606) and Lease Standard (ASC 842).
The comparative 2017 numbers presented above have not been adjusted to reflect these changes in accounting policy.1 Installed Base Management equals our net service and field option sales
Total net sales € million by End-use
PublicPage 9October 20, 2021
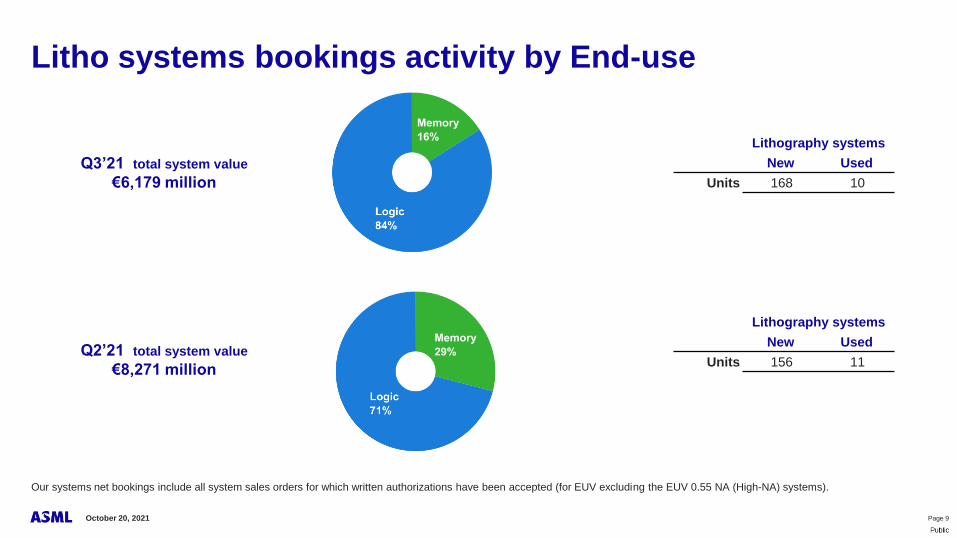
Litho systems bookings activity by End-use
Q3’21 total system value
€6,179 million
Q2’21 total system value
€8,271 million
Lithography systems
New Used
Units 168 10
Lithography systems
New Used
Units 156 11
Our systems net bookings include all system sales orders for which written authorizations have been accepted (for EUV excluding the EUV 0.55 NA (High-NA) systems).
PublicPage 10October 20, 2021
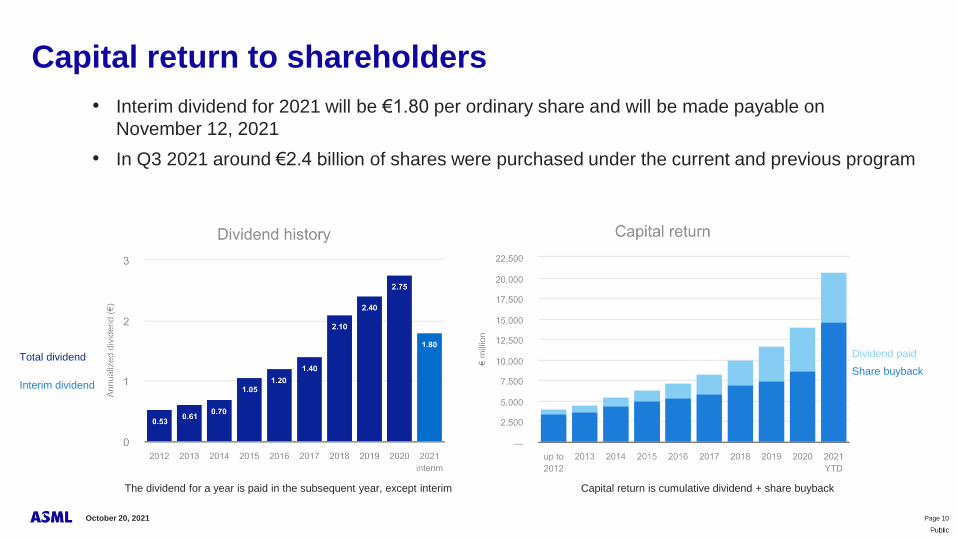
• Interim dividend for 2021 will be €1.80 per ordinary share and will be made payable on
November 12, 2021
• In Q3 2021 around €2.4 billion of shares were purchased under the current and previous program
Capital return to shareholders
Capital return is cumulative dividend + share buyback
Share buyback
Dividend paid
The dividend for a year is paid in the subsequent year, except interim
Total dividend
Interim dividend

PublicPage 11October 20, 2021
Outlook
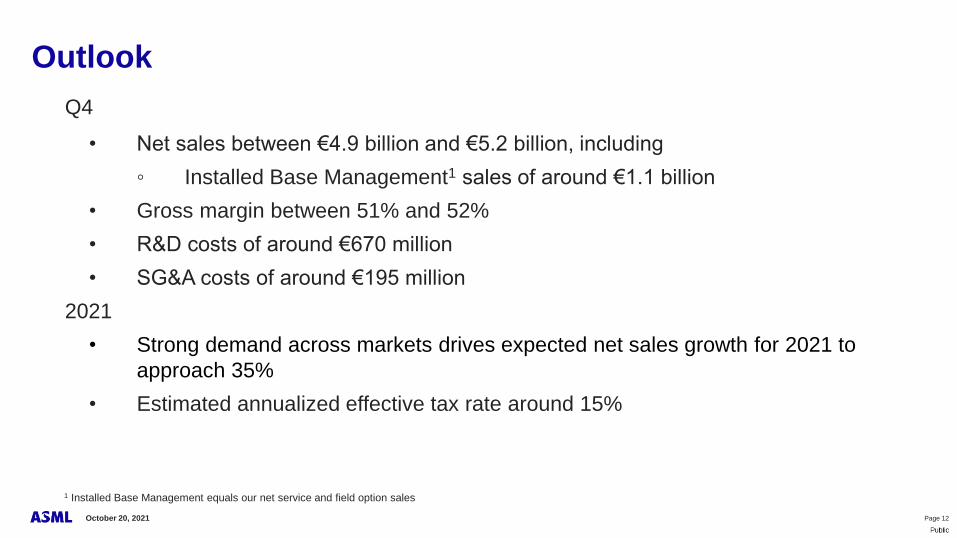
PublicPage 12October 20, 2021
Outlook
Q4
• Net sales between €4.9 billion and €5.2 billion, including
◦ Installed Base Management1 sales of around €1.1 billion
• Gross margin between 51% and 52%
• R&D costs of around €670 million
• SG&A costs of around €195 million
2021
• Strong demand across markets drives expected net sales growth for 2021 to
approach 35%
• Estimated annualized effective tax rate around 15%
1 Installed Base Management equals our net service and field option sales

PublicPage 13October 20, 2021
Financial Statements

PublicPage 14October 20, 2021
Consolidated statements of operations € millionQuarter on Quarter
Q3 2020 Q4 2020 Q1 2021 Q2 2021 Q3 2021
Net sales 3,958 4,254 4,364 4,020 5,241
Gross profit 1,881 2,212 2,352 2,045 2,711
Gross margin % 47.5 52.0 53.9 50.9 51.7
R&D costs (534) (556) (623) (634) (609)
SG&A costs (132) (152) (168) (172) (183)
Income from operations 1,216 1,504 1,561 1,239 1,919
Operating income as a % of net sales 30.7 35.3 35.8 30.8 36.6
Net income 1,062 1,351 1,331 1,038 1,740
Net income as a % of net sales 26.8 31.7 30.5 25.8 33.2
Earnings per share (basic) € 2.54 3.23 3.21 2.52 4.27
Earnings per share (diluted) € 2.53 3.23 3.20 2.52 4.26
Lithography systems sold (units) 1 60 80 76 72 79
Net bookings 2 2,868 4,238 4,740 8,271 6,179
1 Lithography systems do not include metrology and inspection systems.
2 Our systems net bookings include all system sales orders for which written authorizations have been accepted (for EUV excluding the EUV 0.55 NA (High-NA) systems).
These numbers have been prepared in accordance with US GAAP. Numbers have been rounded for readers' convenience.

PublicPage 15October 20, 2021
Consolidated statements of cash flows € millionQuarter on Quarter
Q3 2020 Q4 2020 Q1 2021 Q2 2021 Q3 2021
Cash and cash equivalents, beginning of period 3,499 3,532 6,049 3,244 5,187
Net cash provided by (used in) operating activities 191 4,670 (942) 3,569 1,802
Net cash provided by (used in) investing activities (166) (956) (307) 991 (280)
Net cash provided by (used in) financing activities 9 (1,194) (1,560) (2,613) (2,392)
Effect of changes in exchange rates on cash (2) (2) 3 (4) 2
Net increase (decrease) in cash and cash equivalents 33 2,518 (2,806) 1,943 (868)
Cash and cash equivalents, end of period 3,532 6,049 3,244 5,187 4,319
Short-term investments 876 1,302 1,412 187 137
Cash and cash equivalents and short-term investments 4,408 7,351 4,656 5,374 4,456
Purchases of property, plant and equipment and intangible assets (222) (305) (197) (247) (205)
Free cash flow 1 (31) 4,365 (1,139) 3,322 1,597
1 Free cash flow, which is a non-GAAP measure, is defined as net cash provided by (used in) operating activities minus purchases of Property, plant and equipment and
intangible assets, see US GAAP Consolidated Financial Statements.
These numbers have been prepared in accordance with US GAAP. Numbers have been rounded for readers' convenience.

PublicPage 16October 20, 2021
Consolidated balance sheets € millionQuarter on Quarter
Assets Q3 2020 Q4 2020 Q1 2021 Q2 2021 Q3 2021
Cash & cash equivalents and short-term investments 4,408 7,352 4,656 5,374 4,456
Net accounts receivable and finance receivables 4,664 3,421 4,524 4,426 4,708
Contract assets 177 119 107 179 272
Inventories, net 4,614 4,569 4,748 5,086 4,944
Other assets and Held for sale assets 1,734 1,753 2,396 2,088 2,268
Tax assets 876 739 1,510 1,319 1,276
Equity method investments 918 821 842 865 963
Goodwill 4,541 4,629 4,556 4,556 4,556
Other intangible assets 1,035 1,049 1,014 988 964
Property, plant and equipment 2,198 2,470 2,522 2,609 2,730
Right-of-use assets 298 345 344 326 161
Total assets 25,463 27,267 27,219 27,816 27,298
Liabilities and shareholders' equity
Current liabilities 4,991 6,604 6,876 8,754 9,163
Non-current liabilities 6,730 6,798 6,714 6,969 6,633
Shareholders' equity 13,742 13,865 13,629 12,093 11,502
Total liabilities and shareholders' equity 25,463 27,267 27,219 27,816 27,298
These numbers have been prepared in accordance with US GAAP. Numbers have been rounded for readers' convenience.
For more details see US GAAP Consolidated Financial Statements.

PublicPage 17October 20, 2021
This document contains statements that are forward-looking, including statements with respect to expected trends, including trends in end markets and technology
industry and business environment trends, outlook and expected financial results, including expected net sales, gross margin, R&D costs, SG&A costs and estimated
annualized effective tax rate, expected growth in net sales, expected trends in Logic and Memory demand and sales, annual revenue and gross margin for 2025,
annual revenue growth rate for the period 2020-2030, timing of revenue recognition, including estimates of revenue to be deferred into 2022, expected capacity
growth, long term demand drivers, plans and strategies, including ESG strategy, statements with respect to dividends and share buybacks, including the intention to
continue to return significant amounts of cash to shareholders through a combination of share buybacks and growing annualized dividends including the 2021 interim
dividend and statements with respect to the 2021-2023 share buyback program including the amount of shares intended to be repurchased under the program and
other non-historical statements. You can generally identify these statements by the use of words like "may", "will", "could", "should", "project", "believe", "anticipate",
"expect", "plan", "estimate", "forecast", "potential", "intend", "continue", "target", "future", "progress", "goal" and variations of these words or comparable words. These
statements are not historical facts, but rather are based on current expectations, estimates, assumptions and projections about our business and our future financial
results and readers should not place undue reliance on them. Forward-looking statements do not guarantee future performance and involve a number of substantial
known and unknown risks and uncertainties. These risks and uncertainties include, without limitation, economic conditions, product demand and semiconductor
equipment industry capacity, worldwide demand and manufacturing capacity utilization for semiconductors, the impact of general economic conditions on consumer
confidence and demand for our customers’ products, performance of our systems, the impact of the COVID-19 outbreak and measures taken to contain it on us, our
suppliers, the global economy and financial markets, and other factors that may impact ASML’s financial results, including customer demand and ASML’s ability to
obtain supplies for its products, the success of technology advances and the pace of new product development and customer acceptance of and demand for new
products, production capacity and our ability to increase capacity to meet demand, the number and timing of systems ordered, shipped and recognized in revenue,
and the risk of order cancellation or push out, production capacity for our systems including delays in system production, risks relating to supply chain capacity and
logistics, trends in the semi-conductor industry, our ability to enforce patents and protect intellectual property rights and the outcome of intellectual property disputes
and litigation, availability of raw materials, critical manufacturing equipment and qualified employees, trade environment, import/export and national security
regulations and orders and their impact on us, changes in exchange and tax rates, available liquidity and liquidity requirements, our ability to refinance our
indebtedness, available cash and distributable reserves for, and other factors impacting, dividend payments and share repurchases, results of the share repurchase
programs and other risks indicated in the risk factors included in ASML’s Annual Report on Form 20-F for the year ended December 31, 2020 and other filings with
and submissions to the US Securities and Exchange Commission. These forward-looking statements are made only as of the date of this document. We undertake
no obligation to update any forward-looking statements after the date of this report or to conform such statements to actual results or revised expectations, except as
required by law.
Forward looking statements

Public