expats and the firms they work...
TRANSCRIPT

Employment Relations
Research Centre
Department of Sociology
University of Copenhagen
Øster Farimagsgade 5
DK-1014 Copenhagen K
Tel: +45 35323299
Fax: +45 35323940
www.faos.dk
167
Expats and the firms they work in
Mette Foged, Nana W. Hansen and Natnael S. Nigatu
February 2019
ISBN 978-87-93320-29-1

FAOS Research paper 167
2
Content
Résumé ................................................................................................ 3
1. Introduction ..................................................................................... 5
2. Global skills mobility and the role of the firm ................................ 6 2.1 Models of global skills mobility ................................................................ 6 2.2 The firm as driver of skills mobility and our assumptions ........................ 8
3. Methods and data ...........................................................................11 3.1 Data and definition of variables .............................................................. 11 3.2 The expat population selected for the panel data .................................... 13 3.3 The expat population selected for the survey data .................................. 14 3.4 The expat firm ......................................................................................... 14 3.5 Descriptive analysis and normalization within industry.......................... 15 3.6 Regression analysis and fixed effects on wages ...................................... 16
4. Skill flows and production .............................................................17 4.1 Expat firms’ global reach ........................................................................ 17 4.2 Expat firms’ capital and knowledge intensity ......................................... 18 4.3 Expat firms’ skill flows ........................................................................... 19 4.4 Conclusion and discussion ...................................................................... 21
5. Small and large expat firms ...........................................................22 5.1 Small expat firms’ global reach ............................................................... 23 5.2 Small expat firms’ capital and knowledge intensity ................................ 23 5.3 Recruitment patterns and small expat firms’ skills demands .................. 24 5.4 Conclusion and discussion ...................................................................... 30
References ..........................................................................................33
Appendices .........................................................................................38 A. Origins of expat population ...................................................................... 38 B. Share of expats in each industry by size ................................................... 39 C. Wage regression and fixed effects analysis .............................................. 40

FAOS Research paper 167
3
Résumé
This report investigates the role of firms in generating skills mobility.
Combining Danish firm- and individual-level register data, we explore firms’
use of foreign highly skilled labour in Denmark in two different analyses. We
refer to foreign employees working in a job within one of the first three major
International Standard Classification of Occupations (ISCO) groups (i.e.
managers, professionals, technicians and associate professionals) as expats, and
the firms that employ them as expat firms.
The first analysis explores the relationship between skill flows and
production. We compare production characteristics for firms recruiting skilled
workers from abroad to firms that do not recruit such workers. Moreover, we
examine how firms use highly skilled international workers relative to native
workers within the firms. The main findings are as follows:
The number of expats in Denmark is increasing, and a main driver of this
development is the increasing recruitment of expats by large expat firms –
i.e. firms with 250 employees or more.
The number of expat firms – i.e. firms employing one or more expats – is
also increasing. The global economic crisis of 2008 reduced the number of
firms in Denmark in general, but the number of expat firms was less
affected by the crisis.
Expat firms are more likely to export or import than are non-expat firms
within the same industry. Thus, expat firms have a wider global reach than
does the average firm within the same industry. Expat firms are also more
capital-intensive and R&D-intensive than non-expat firms in the same
industry. Thus, expat firms require investments and knowledge in order to
compete in their markets.
Expat firms are characterized by a generally higher level of cross-country
skills mobility, including both recruitment of expats from abroad and
emigration of their native workers.
Firms recruit expats in order to supplement skills rather than to substitute
highly skilled labour within the firms. Expats perform more analytical tasks
than do the natives who do not emigrate i.e. ‘stayers’ within expat firms.
They are also more likely to perform communicative tasks and non-routine
tasks than are stayers.
The Danish public debate focuses mostly on the question of labour and
skills shortages, but the reasons for companies to recruit expats are more
complicated. We need more research to establish whether this
supplementation is primarily to make up for shortages within the national
workforce, to increase productivity, to internalize complementary
knowledge or to enhance firms’ innovative capacity.
The second analysis in this report is a comparison of small and large firms that
recruit expats. We have very little systematic evidence for why and how small
firms recruit skills from abroad; this report is a first and innovative attempt to

FAOS Research paper 167
4
address this gap in the literature and to explore the role that small firms play in
global skills mobility. We differentiate between large companies with 250
employees or more and small companies with more than 10 but fewer than 250
employees. The main findings are as follows:
An increasing number of small firms in Denmark recruits expats. They play
a role in the growing number of expats moving to Denmark, though large
firms mainly drive the upward trend.
Compared to large firms, small firms are equally if not more likely to
recruit directly from abroad. Small expat firms recruit slightly more
workers from other EU/EEA countries, whereas large firms recruit slightly
more expats from countries outside the EU/EEA. Overall, small expat firms
appear to benefit from having their own recruiting channels and networks
when recruiting.
Small expat firms also have a larger global reach, and are more capital- and
R&D-intensive than are small firms in general within their industry. They
share these characteristics with the large expat firms, though to a lesser
degree.
Small expat firms use their expats’ skills differently than do large expat
firms. They perform analytical and communicative work, but to a lesser
degree than expats in large firms do. This difference probably reflects less
task specialization in small firms.
Both natives and expats in large firms earn a slightly higher hourly wage
than do natives in small firms in Denmark working in jobs requiring similar
skills. This difference is not surprising given the general size-wage
premium for working in large firms found across countries and sectors.
Most expats work in large firms; in our analysis we find a difference of only
about 1 per cent in the hourly wage level between foreign expats and
natives working in large firms in jobs with similar task requirements.
However, the hourly wage of expats in small firms is about 5 per cent lower
than the hourly wage of natives in similar jobs in small firms.
We do not observe a systematic wage differential between expats and non-
expats. The estimated wage differential depends on firm size and industry,
and it is important to note that – even within such high-dimensional fixed
effects models – the unexplained wage differential could still be due to
factors not observed in register data, such as education, total work
experience and differences in tasks even within narrowly defined
occupations.

FAOS Research paper 167
5
1. Introduction
Global skills mobility into and within OECD countries is a phenomenon on the
rise, in part because of a general increase in migration to OECD countries, but
also because of a growing tendency towards international inter-firm mobility
(OECD 2017: 9–10; Nathan 2014; Recchi 2009). The tendency for Danish
companies to recruit skilled workers from abroad has also increased over the
years (Rambøll 2018; DEA 2016c; DEA 2016d). From previous studies, we
know that the migration of highly skilled workers to Denmark contributes
positively to the funding of the Danish welfare state, and is generally a net
economic gain for Denmark (Jacobsen et al. 2011; DEA 2016b). Furthermore,
highly skilled mobile workers (both foreigners and Danes) appear to earn as
much as or slightly more than non-mobile Danish labour (DEA 2016a).
The Danish debate on firms’ recruitment of skills from abroad has focused
on current and future labour shortages. However, firms recruit skilled labour
from abroad for many different reasons, including to supplement skills
shortages within the national workforce, to increase productivity, to internalize
complementary knowledge and enhance innovative capacity or simply to cut
costs (Hunt and Gauthier-Loiselle 2010; Kerr et al. 2015: 153; Nathan 2014).
Firms are undoubtedly important actors in generating skills mobility, but
research on how firms use skills across borders relative to their national
workforce is scarce. Most quantitative models of global skills mobility focus on
individual incentives for mobility and treat policies as gatekeepers of skill flows
(Kerr et al. 2015: 148; Kerr et al. 2016: 84). In this report, we take a different
approach by combining firm- and individual-level data, which enables us to
focus on firms using foreign highly skilled labour in Denmark.
The report is organized into two sections. First, to understand firms’ strategic
use of skilled foreign labour, we look at a number of production characteristics
for firms recruiting skilled workers from abroad compared to firms that do not
recruit such workers. Moreover, we examine how firms use highly skilled
international workers relative to native workers within their firms.
Second, we compare small and large firms recruiting highly skilled workers.
Large multinational companies are most visible in their efforts to restructure
and outsource parts of their companies and to take advantage of intra-firm skills
mobility, and therefore have been the focus of the limited research on firms and
global skills mobility (Tzeng 1995; Peixoto 2001; Kennedy 2005; Millar and
Salt 2008; Tucker 2017). These studies have emphasized large multinational
firms as actors in producing company-internal labour markets and various
portfolios of mobility. Small firms do not appear to play the same role in
initiating skills flows, although for various reasons they are equally dependent
on foreign skills in order to be successful in business. However, we have very
little systematic evidence for why and how small firms recruit skills from
abroad. This report is a first and innovative attempt to address this gap in the
literature and to explore the role that small firms play in global skills mobility.
From survey results on highly skilled labour working in Denmark, we know
that about half of highly skilled workers work in private companies, and that
these companies are often large, with more than 500 employees (Oxford

FAOS Research paper 167
6
Research 2014). However, small companies dominate the Danish business
structure. In 2014, 86 per cent of the total 35,219 companies had fewer than 20
employees (DST 2016a, DST 2016b). The top thousand large companies
employed more than 50 per cent of all employees, but made up only 1 per cent
of all companies in Denmark (DST 2016a). Accordingly, in the second section
of this report, we focus on the small firms that successfully attract highly skilled
mobile foreign labour and compare their firm characteristics to large firms that
similarly recruit expats. We differentiate between large companies with 250
employees or more and small companies with more than 10 but fewer than 250
employees.
The analysis presented in this report provides novel insights into foreign
highly skilled workers and the firms in which they work. Drawing on
longitudinal registers from Denmark, we constructed a panel data set containing
all workers in Denmark and the firms that employed them over the period 2003
to 2014. In addition, we drew on survey data gathered from a random sample of
‘expats’ living and working in Denmark in 2014 (Oxford Research 2014).
Throughout this report, we refer to the foreign highly skilled labour coming
to Denmark as ‘expats’ and the firms that employ them as ‘expat firms’. In its
broadest sense, the term ‘expat’ refers to an individual who temporarily or
permanently resides in a country other than his or her native country for at least
three months. However, the term also implies a group of foreigners who are
well educated, well paid and rather successful in their new host country. The
mobile foreign labour recruited by the firms covered in this report are
professionals applying their highest skills level in their jobs in Denmark. These
international mobile workers are of particular interest in the global competition
for talent and search of innovative potential (Mahroum 2000; Favell 2008;
Shachar 2006; Habti and Sabour 2010; Alaminos and Santacreu 2010; Silvanto
and Ryan 2014; OECD 2017).
In the next section, we offer a brief literature review of research on global
skills mobility. We combine models of skills migration from labour economics
and the broader migration literature. Furthermore, we look at the scarce
literature on the role of firms in generating global skills mobility and formulate
the specific assumptions that we explore in this report. We combine the
literature on global skills mobility with strands of management literature
offering insights into companies’ strategic considerations for recruiting skills
from abroad. In Section 3, we present the data and methods used. We then
report the findings in Sections 4 and 5. We complete each of these two sections
with a conclusion and discussion findings.
2. Global skills mobility and the role of the firm
2.1 Models of global skills mobility
Theoretical models of global mobility have emphasized factors that influence
the individual or household decision to migrate, and only recently have
introduced the firm as a main actor generating global labour mobility (Kerr et
al. 2015: 148; Kerr et al. 2016: 84).

FAOS Research paper 167
7
Since the early 1990s, models of global labour mobility have become
increasingly complex, combining economic and sociocultural variables. The
traditional focus was on different combinations of push and pull factors
emphasizing macroeconomic incentives (such as supply and demand for labour)
or microeconomic factors affecting the individual’s cost–benefit analysis
(Portes and Böröcz 1989; Massey et al. 1993: 443; Mahroum 2000; Verwiebe et
al. 2010; Silvanto and Ryan 2014; Kerr et al. 2015: 148; Kerr et al. 2016: 84).
Today’s research considers social networks to be an almost equally
important factor in the likelihood of mobility, choice of destination and success
of mobility for the individual worker (Massey et al. 1993; Recchi 2009;
Kennedy 2005; Stephens 2015; Verwiebe et al. 2017). Research has also
demonstrated that mobility is often a collective decision, with family relations
and opinions playing an important role in an individual’s likelihood to move
across borders (Mincer 1978; Ackers 2004).
With respect to highly skilled labour mobility, research has added
geographic location and agglomeration effects to the models explaining global
skills mobility: in other words, some locations give better access to financial
and physical capital, technology and so forth, which can enhance highly skilled
workers’ productivity (Kerr et al. 2016: 92; Kerr et al. 2017). Thus, highly
skilled workers are drawn to locations with groups of other highly skilled
workers. This finding is backed by surveys showing that professional and
personal development is a very important factor in highly skilled individuals’
incentives to become move across borders (Pearson and Morrell 2002; Ackers
2005: 103; Khoo 2014: 7).
Furthermore, studies have argued that migration policy – and in a European
context, regional European integration – is fundamental for producing a
transnational labour market and opportunities for skilled labour migration
(Tzeng 1995; Favell 2008; Boyd 2014; Cerna 2010, 2014; Kofman 2013;
Verwiebe 2014: 210, 212; Verwiebe et al. 2017; Kerr et al. 2016). In addition,
the need to distinguish between different professions and professional
developments (Iredale 2001: 15; Ackers 2005: 102), and between different
types of jobs (Mahroum 2001: 29), has proven to be important if we are to
understand the dynamics of how highly skilled mobile workers act within
transnational labour markets.
The latter insights imply a role of the firm and its recruitment needs, but
without including the firm as an actual factor in understanding skills mobility
across borders (Kerr et al. 2016: 153). Nevertheless, studies on skills mobility
have acknowledged that changes in global production and multinational
companies’ efforts to relocate and offshore production are important in
generating skills mobility (Salt 1992; Iredale 2001; Peixoto 2001; Kennedy
2005; Millar and Salt 2008; Salt and Wood 2014; Hansen 2016). These studies
highlight the need to integrate economic and social factors measured at the
individual level with organizational factors measured at the firm level in order
to understand skills mobility across borders, but their empirical evidence mainly
build on qualitative case studies and survey material. However, recently a strand
of literature in labour economics is exploring skills mobility by using firm data
in addition to individual data drawn from registers and surveys (Hunt and

FAOS Research paper 167
8
Gauthier-Loiselle 2010; Kerr et al. 2014; Kerr et al. 2015; Kerr et al. 2016;
Foged and Peri 2016; Kerr et al. 2017). In this descriptive report, we follow this
line of thinking and set firm characteristics and the interrelation between the
firm and the individual highly skilled worker at the centre of our analysis, also
by using high-quality register data combining individual and firm
characteristics.
This approach also implies that the firm is a central actor in generating skills
mobility, and thus calls for a better understanding of why firms recruit skills
from abroad and how they use those skills within their production. Though we
have no ambition to build a theoretical model explaining the role of firms in
generating skills mobility, we strive in the next section to offer insights into
why firms recruit foreign skilled labour and how they apply this labour within
their production. Drawing from insights of previous studies, we formulate a
number of key assumptions in the next section, which we explore further in this
report.
2.2 The firm as driver of skills mobility and our assumptions
Large multinational firms generate internal labour markets and organizational
careers (Peixoto 2001; Iredale 2001; Millar and Salt 2008). Human resource
management literature differentiates between ‘self-initiated expatriation’, where
mobile workers actively choose their mobility, and ‘assigned expatriation’,
where companies post workers abroad for shorter or longer periods of time
(Andresen et al. 2014). However, in this study we focus on skills mobility that
is driven by firms regardless of whether it comes in the form of posting labour
or recruitment of company-external labour. In this regard, empirical research
has shown that the global mobility of the individual skilled worker within
multinational corporations (MNCs) is dependent not only on management
decisions but also on a number of structural factors related to the firms’
production and market conditions (Peixoto 2001; Kennedy 2005; Millar and
Salt 2008; Hansen 2016; Tucker 2017). These factors form the basis of our
main assumptions about the determinants of firms’ recruitment of foreign skills.
When it comes to production conditions, the firms’ global activity – i.e.
whether it is oriented towards export or domestic markets – matters. Research
has indicated that manufacturing firms and firms with a high degree of exports
generate more high-skilled labour mobility than do service firms and firms
oriented towards the domestic market (Peixoto 2001: 1043). Based on this
finding, we use the data to explore the first assumption, which we formulate as
follows:
1. Firms with expats are more likely to have an international or global reach as
measured by their international trading activities.
Furthermore, the capital and knowledge intensiveness of the firm and the
reliance on implementation of new technology generate more foreign skills
mobility than does reliance on older, established technology (Peixoto 2001).
One main stimulus driving employers’ need for global labour is the need for so-
called ‘supplementary resources’, meaning access to specialized talent from

FAOS Research paper 167
9
abroad in order to cover skills shortages at home (Minbaeva and Michailova
2004; Millar and Salt 2008: 28; Salt 1992; Ozgen et al. 2014: 380). The
literature has implied that especially capital- and knowledge-intensive firms –
i.e. firms with, for instance, a high capital–labour ratio and high R&D spending
– such as those in science, engineering and IT, rely on their ability to recruit
globally in order to compensate for skills shortages and enhance their
innovative capacity (Benson-Rea and Rawlinson 2003: 61–62; Ozgen et al.
2014). Accordingly, our second assumption to explore in the data is the
following:
2. Firms with expats are likely to be capital- and R&D-intensive.
A body of research within management studies deals with the recruitment of
knowledge workers as one way to enhance a firm’s technological capability and
foster technological change or innovations. The recruitment of skills could
encourage isomorphism through knowledge transfer and imitation (DiMaggio
and Powell 1983; Tzabbar 2009). Or, formulated slightly differently: MNCs
continue to rely on the expatriation of trusted employees to share knowledge
and build trust across borders even when skills are available abroad (Minbaeva
and Michailova 2004; Kennedy 2005: 180–183). The firm’s market position
also generates variance in intra-firm skills mobility. Early entry into a market
entails limited skills movement; but in the actual establishment phase of a new
company or production site, intra-firm skills mobility is highly intensified until
local skills are established (Peixoto 2001: 1043; Hansen 2016). To extend the
global reach of the company and reproduce corporate culture, MNCs create
mobile elite cadres of management and technically proficient staff in order to
mediate knowledge and build social networks (Millar and Salt 2008: 28).
Another strand of management research has been preoccupied with whether
skills mobility and cultural diversity produce innovative capacity (Ozgen et al.
2014; Tzabbar 2009). The research has viewed skills recruitment as a part of the
firms’ technological portfolio (Tzabbar 2009: 873). The talent sought by firms
applying this strategy are employees working at the technical level, and
recruitment is about acquiring or assimilating knowledge from other firms or
regions but from within the same industry (ibid.: 875). Adding support to this
approach is a study on US data, which found that within firms skilled
immigrants specialize in occupations demanding technical and analytical skills,
whereas native workers specialize in occupations requiring interactive and
communicative skills (Peri and Sparber 2011). However, for skills recruitment
in itself to produce innovation, it is dependent on alignment with other internal
resources of the firm (Tzabbar 2009: 890; Ozgen et al. 2014).
Thus, depending on a firm’s production and position in the market, it recruits
for different skills, which in broad terms can be differentiated as mobility of
management skills, technical skills or sociocultural (i.e. communicative) skills
(Peixoto 2001; Millar and Salt 2008). These insights lead us to the third, fourth
and fifth assumptions about intra-firm skills mobility and the task content that
mobile labour performs:

FAOS Research paper 167
10
3. Expats are a way to import knowledge. Likewise, expat firms may need to
export knowledge – that is, send native employees abroad.
4. Expat firms engage in skills mobility. Their mobile workers perform more
analytical, communicative and non-routine tasks.
5. Mobile workers (expats) perform specialized and high-skilled tasks within
their host firms that non-migrating employees are unable to perform. This
tendency is reflected in their job type and wage level.
All of the above-referenced research focuses either on national aggregate data
on all firms or on qualitative data from large multinational firms. The literature
on recruitment of foreign skills to small firms (or small and medium-sized
firms, the so-called SMEs) is scarce and focused on talent management in
general (Krishnan and Scullion 2016). Small firms differ from large firms with
respect to institutional, resource and economic contexts. They tend to be more
unstable in their structural form and management process, and have a higher
degree of informality in their recruitment practices, attracting skills from
different talent pools (ibid.: 432). Because recruitment of talent is risky and
costly, small firms are likely to develop strategies for reducing cost and risk.
Such efforts could include a focus on short-term recruitment so as not to bind
resources, and/or recruitment through larger, more established companies
within their industry (Somaya et al. 2008; Stokes et al. 2016). This observation
leads us to a sixth assumption to explore:
6. Recruiting expats from abroad is costly and dependent on networks and
knowledge of the candidate expats’ skills. Small and large expat firms
recruit differently.
Nevertheless, as with large firms, small firms can enhance innovation and
growth strategies by attracting talent from larger and more established firms
(Krishnan and Scullion 2016: 434). Furthermore, recruitment from competitors,
clients and collaborators can have benefits for small supplier firms in terms of
enhancing market opportunities (Somaya et al. 2008). Thus, we add one more
assumption to explore:
7. Small and large expat firms might have different recruitment patterns, but
they demand similar skills.
The above-mentioned seven assumptions infer a relationship between firms’ use
of expats’ skills and certain traits of the expat firms. For instance, by stating that
expat firms are likely to have a global reach and be capital- and knowledge-
intensive, we imply that trade relations and capital and knowledge intensity
come before the strategy of recruiting expats. However, we cannot draw
conclusions about causality from our analysis, but simply confirm or reject the
idea that a relationship exists. In the next section, we describe the data and
methods used to explore the above-mentioned seven assumptions.

FAOS Research paper 167
11
3. Methods and data
3.1 Data and definition of variables
The analysis presented in this report relies mainly on a panel data set for the
period 2003 to 2014, which was compiled from individual- and firm-level
register data from Statistics Denmark (DST). Table 1 lists the variables and
registers from which the data were drawn.
Table 1: Overview of variables and registers
Variables Registers
Worker-level variables
Age (alder) BEF
Experience (erhver*) IDAP
Hourly wage BFL
Earnings (lonind) IND
Union (fagfkdb) IND
Immigration status (ie_type) BEF
Education (hfaudd) UDDA
Permit type (kategori) OPHG
Arrival period VNDS
Marital status (cvist) BEF
Gender (koen) BEF
Occupation code* AKM
Firm-level variables
Export (gf_eksp) FIRM
Import (gf_import) FIRM
Employment (gf_anestte) FIRM
Capital FIRE
Sales (gf_oms) FIRE
Industry code (db07) FIRM
R and D spending (U_total) FUI
R and D workers (p_total) FUI
Task content** O*NET
*We had to rely on multiple variables due to data break. ** O*NET is an external
database (outside of DST) that contains information on the skill requirements of
occupations. O*NET is constructed and maintained by the O*NET Resource Center,
sponsored by the U.S. Department of Labor. We merged this to the four-digit
occupation codes and rescaled the task variables.
The construction of panel data over a period of eleven years enables us to
analyse time trends. On account of a change in the way DST has recorded
occupation codes since 2003, we compiled data from 2003 to 2014. For the
years following, the updating of registers was not complete at the time of data
analysis; for this reason, we did not draw on data that are more recent.

FAOS Research paper 167
12
In addition to the panel data, we also draw on survey data from The Expat
Study 2014 (Oxford Research 2014). The original intention was to combine
register and survey data, which would entail a reproduction of the population
selection criteria from the survey conducted in 2014 prior to our research.
However, we decided to use a slightly different set of population criteria in our
research, compiling the panel data from registers in order to secure a better
selection of highly skilled expats. Thus, we have not integrated the two data sets
combined. We report descriptive analysis using the panel data, and simply add
information separately from the survey data combined with a few registers but
using a different sampling approach to the expat population.
From the survey data, we focus on questions shedding light on expats’
experiences prior to arriving in Denmark, as well as their views on living and
working in Denmark since their arrival. Both the information about experiences
prior to arrival in Denmark and about the subjective experiences are for good
reason not registered in Statistics Denmark. Table 2 provides an overview of the
survey questions, which we explore in this report.
Table 2: Overview of survey variables and questions used (based on The Expat Study 2014, Oxford Research 2014)
Variables Original survey question and N
Expats’ experience before arriving and working in Denmark
Experience as expat Have you previously worked or studied abroad?
(N=1749)
Work experience How many years of labour market experience did you
have before arriving in Denmark? (N=1748)
Previous education What is the highest level of education you have
completed? (N=1648)
Factors for choosing
Denmark
What factors were the most important for you when
accepting a job in Denmark? (N=1749)
Recruitment How did you get your job in Denmark? (N=1749)
Expats’ experience after arriving and working in Denmark
Career opportunities There are good career opportunities in Denmark:
agree/disagree? (N=1662)
Appealing work
culture
Danish work culture is appealing (I find Danish work
culture appealing: agree/disagree?) (N=1732)
Satisfactory job I am satisfied with my job (personally and
professionally) (N=1745)
Enjoy living in
Denmark
Enjoy living in Denmark (I enjoy living in Denmark:
agree/disagree?) (N=1749)
Even though the populations are in fact slightly different, we do believe the data
complement each other and together shed light on the labour market position
and experience of expats in Denmark.
In the next two sections, we describe our approach to selecting the expat
population for our panel data, and the approach used in sampling the survey
population.

FAOS Research paper 167
13
3.2 The expat population selected for the panel data
We define an ‘expat’ as an individual who is 21 years of age or older, foreign-
born and working in Denmark in one of the first three major ISCO groups. The
International Standard Classification of Occupations (ISCO) organizes jobs into
clearly defined categories according to the tasks and duties undertaken in the
job. Major Group 1 is managers, Major Group 2 is professionals and Major
Group 3 is technicians and associate professionals. These three occupational
codes represent employees with skills at the highest level. To exemplify, Major
Group 3, which is the group with the lowest skills level represented in our expat
population, includes IT support technicians and pharmaceutical technicians.
Because we do not have good-quality ISCO information on individuals working
in firms with ten or fewer workers, our population of expats includes only
individuals working in firms with more than ten employees. The total expat
population in 2014 comes to 63,838 individuals.1 We work with the total
number of the expat population in Denmark each year from 2003 to 2014,
which represents the total in- and outflow of expats.
For our population, the median experience with employment in Denmark is
seven years. Furthermore, our expat population shares a number of
characteristics with their native counterparts employed in jobs with equal skill
requirements. There is an almost equal gender distribution: 52 per cent of the
expats are female (among their Danish counterparts, 57 per cent are female),
and 58 per cent are married (among their Danish counterparts, 60 per cent are
married). They are on average 40 years old, which is only three years younger
than the average age for their Danish counterparts. The companies where the
expats work are on average 24 years old, whereas the companies of similar
native workers are on average 25 years old. The expat population is comprised
of many different nationalities.2 In 2014, about 58 per cent were from non-
EU/EEA countries. However, the top five nationalities are from Germany,
Norway, Sweden, Great Britain and Poland. These countries represent 74
per cent of all EU/EEA citizens within the population, but only 31 per cent of
the total population. Furthermore, the vast majority of individuals from other
countries are from developing countries. There are practically no refugees or
asylum seekers within our population, and only very few family reunifications,
confirming that we are dealing with an expat population that arrived in
Denmark to work (see Figures 6 and 7).3
From 2003 to 2014, there is a clear increase in the population of expats in
Denmark. Figure 1 shows the trend in the aggregated population. Thus, even
though the number of admissions of expats might vary from year to year, the
expat population has been increasing over time.
1 Education from abroad is not available in Danish registers. By using information on
the skills content of occupations based on the major ISCO categories, we implicitly
define expats as people who migrate for work – i.e. who have a job upon arrival – and
we disregard highly skilled individuals who do not work in jobs matching their
qualifications. 2 For more information on the origins of the expats, see Appendix A. 3 The total number of asylum seekers in our sample is 13 persons. They account for
about 0.13 per cent of the total population.

FAOS Research paper 167
14
The total number of expats in both large and small firms shows a similar
trend, growing at a faster rate as of 2012, following the aftermath of the global
financial crisis of 2008. The majority of expats are employed in large firms;
these firms are the main drivers of the increasing number of expats to Denmark.
However, especially since the global financial crisis, the number of expats in
small firms has increased. We discuss this trend further in Section 5, which
compares large and small expat firms in more detail.
Figure 1: Trend of expats, 2003–2014, by firm size
3.3 The expat population selected for the survey data
The survey data selection of the expat population for The Expat Study 2014 was
different from our approach (Oxford Research 2014). Similar to our sampling
approach, the expat population in the survey is defined as foreign-born
individuals aged 21 years or older. However, additional sampling criteria are
individuals with monthly earnings of DKK 25,000 or more for each of the last
five months, as well as individuals who arrived in Denmark after 1 January
2009. Thus, it is essentially the wage criterion, which defines the survey
population as highly skilled. As described above, the panel data rely on the
skills content of the occupations. Furthermore, the survey population includes
only individuals who arrived recently, from 2009 to 2013, thus reducing the
number of long-staying expats in the population.
The total population generated by this approach came to 15,218 individuals,
from which a randomly drawn sample of 4,000 was to be included in the
questionnaire survey. With a response rate of 46.3 per cent, the total sample of
respondents was 1,853 expats. For more information on the survey selection,
representativeness, contact method and response, see Oxford Research (2014).
3.4 The expat firm
An expat firm according to our definition is a firm with at least one expat
employed in a given year. For the period of our analysis, an expat firm in one
year could be a non-expat firm the next year if it loses all of its expat workers.
A non-expat firm is a firm with no expats employed in a given year.

FAOS Research paper 167
15
In 2003, about 15 per cent of all firms (with ten or more employees)
employed one or more expats. In 2014, this figure had risen to 25 per cent of all
firms. Figures 2 and 3 show the number of expat and non-expat firms for any
given year in the whole economy. Figure 2 shows an increase in the number of
expat firms of about 52 per cent. There is a clear upward trend in the number of
expat firms in the period from 2003 to 2007, followed by a moderate decline
probably ensuing from the global financial crisis of 2008. From then on, the
upward trend in the number of expat firms picks up again, but at a slower pace
up to 2012, when the pace then picks up again, approximating the period prior
to the crisis.
Figure 3 shows a growing number of non-expat firms as well up to 2007.
However, from 2008 to 2013 the number of non-expat firms declined, falling
nearly 17 per cent at the time of the global financial crisis. From 2013 on, the
number of non-expat firms seems to stabilize, but at a lower level.
Figure 2: Trend in expat firms
Figure 3: Trend in non-expat firms
The number of expat firms is less affected by the general fluctuations of the
economy than are the number of non-expat firms. Furthermore, the number of
expat firms is rather steadily increasing.
3.5 Descriptive analysis and normalization within industry
Expats are more dominant in some industries than in others (see Appendix B).
In the top six industries to which expats are recruited, we find public
administration, including the Foreign Service; scientific research and
development; certain parts of the manufacturing industry, including
pharmaceuticals, computer and electronic products; some specific service
industries, including telecommunications and IT services. Expats working in
small firms have a particularly strong showing within the manufacturing of
pharmaceutical, computer and electronic products, as well as the service
industries telecommunications and IT services.
The overrepresentation of expats in some industries suggests that expat firms
are more likely to be present in these industries. Most of the above-mentioned
industries are quite capital- and knowledge-intensive. To compensate for the
variance in expat firms across industries, an important part of our descriptive
analysis has been to normalize the characteristics of the expat firms to other
firms within the same industry. For each of the firm characteristics, we compare
the firm to the average firm within the same industry using an index. If the

FAOS Research paper 167
16
index number is greater than one, the group of firms is more likely to have the
trait compared to the average firm within their industry. The index is defined by
this formula:
𝑥𝑁𝑖𝑗 =
𝑥𝑖𝑗
𝑋𝐽,
where 𝑥𝑁𝑖𝑗 refers to the normalized value of “x” at firm “i” in industry “j” (the
index number), where “𝑥𝑖𝑗” refers to the value of “x” in firm “i” and “𝑋𝐽” refers
to the average value of “x” in industry “j”. 𝑥𝑁𝑖𝑗 = 1 if firm i’s characteristic (x)
is equal to its industry’s (j) average.
3.6 Regression analysis and fixed effects on wages
The Copenhagen-based think tank DEA has studied the wage levels of mobile
highly skilled labour and non-mobile labour in Denmark (DEA 2016a).4 For this
reason, we decided not to carry out further analysis of wage differences between
mobile and non-mobile labour in general.
However, we did carry out a panel regression analysis on the labour income
of expats versus natives in small and large firms that controls for fixed effects
on job type, industry, age and age square, gender, union membership and
marital status. The fixed effects analysis is described in two equations for two
panels:
Equation 1 (Panel A):
𝐿𝑎𝑏𝑜𝑢𝑟 𝑖𝑛𝑐𝑜𝑚𝑒𝑖 = + size𝑗 + occupation𝑖 + X𝑖 + 𝑖𝑛𝑑𝑢𝑠𝑡𝑟𝑦𝑗 + 𝑒𝑖
Equation 2 (Panel B):
𝐿𝑎𝑏𝑜𝑢𝑟 𝑖𝑛𝑐𝑜𝑚𝑒𝑖
= + 1𝐸𝑥𝑝𝑎𝑡 + 2Size𝑗 + 3Expat ∗ Size𝑗 + occupation𝑖
+X𝑖 + 𝑖𝑛𝑑𝑢𝑠𝑡𝑟𝑦𝑗 + 𝑒𝑖
We use the specification provided in Equation (1) to compare the earning gap
between expats working in large and small firms. We prefer the regression to
descriptive statistics because the former allows us to control for basic factors,
which may influence the earnings level of workers. The dependent variable is
the hourly wage.
The first term in the equation stands for the constant term. is our interest
variable; it shows the earning difference between expats working in large and
small firms, keeping other things constant. To precisely estimate the size
premium, we control for worker characteristics (i.e. age, age square, gender,
union membership and marital status). Moreover, we use additional occupation
and industry fixed effects so that we can compare workers within four-digit
4 For further explanation, please see section 4.3, including note 6

FAOS Research paper 167
17
ISCO codes working in a given industry based on the six digits Danish
industrial classification. The last term is an orthogonal error term. The reader
should be aware that this parameter does not show any causal effects. The
specification provided in Equation (2) measures the earning gap between expats
and native workers in small and large firms. 1, which is one of our interest
variables, measures the earnings gap between the two groups in small firms,
whereas 2 measures the size premium for native workers. 3 shows the
interaction effect between the expat and size variables. Combining the
coefficients of the three parameters shows the earning gap between expat and
native workers in small and large firms.
We present the results of the regression analysis in Table 14, Section 5.3.
4. Skill flows and production
In the following subsections, we present the results from our descriptive
analysis of firms’ strategic use of highly skilled foreign labour in general. We
look at a number of production characteristics for all expat firms and compare
them to non-expat firms. In addition, we look at how expat firms use highly
skilled international labour relative to native workers within the same firm.
4.1 Expat firms’ global reach
In this section, we focus on the global reach of expat firms compared to firms
not recruiting expats. Thus, we explore the first assumption mentioned above,
which states that firms with expats are more likely to have an international or
global reach as measured by their international trading activities. Our results
confirm this assumption.
We measure global reach as the firm’s import and export intensity. We
define export intensity as the share of exports out of the firm’s total sales.
Similarly, we define import intensity as the share of imports out of the firm’s
total sales. Export (or import) intensity ranges from 0 to 1, where 0 means that
the firm is not exporting any of its outputs and 0.5 means that half of the firm’s
output is exported. This measurement can be described mathematically as:
𝐸𝑥𝑝𝑜𝑟𝑡 𝑜𝑟 𝐼𝑚𝑝𝑜𝑟𝑡 𝐼𝑛𝑡𝑒𝑛𝑠𝑖𝑡𝑦 =𝐸𝑥𝑝𝑜𝑟𝑡𝑗𝑡 𝑜𝑟 𝐼𝑚𝑝𝑜𝑟𝑡𝑗𝑡
𝑇𝑢𝑟𝑛𝑜𝑣𝑒𝑟𝑗𝑡
where ‘j’ stands for the firm, and ‘t’ stands for the time period.
Table 3 shows that expat firms are significantly more import- and export-
intensive. Expat firms export close to a quarter of their output, whereas non-
expat firms export less than 10 per cent of their output. Furthermore, expat
firms import 14 per cent of their output, whereas non-expat firms import less
than 10 per cent of their output.
When normalized within the industry, we observe the same tendency.
Normalized export or import intensity measures the intensity of a given firm
compared to other firms in the same industry. If the value of the index is greater
than one, the group of firms is more likely to import compared to the average

FAOS Research paper 167
18
firm within their industry. From Table 3, we see that expat firms are more likely
to export or import than are non-expat firms in the same industry. Thus, expat
firms interact much more with markets and firms from abroad and have a wider
global reach than does the average firm in their industry.
Table 3: Export and import intensity
Expat firms Non-expat firms t-test
(1) (2)
Export intensity 0.23 0.07 ***
Normalized exp. intensity 1.90 0.82 ***
Import intensity 0.14 0.06 ***
Normalized imp. intensity 1.60 0.88 ***
Note: Some firms exhibit export and import intensity of above 1. We report this table by capping
such values at 1. * p < 0.05, ** p < 0.01 and *** p < 0.001
4.2 Expat firms’ capital and knowledge intensity
The second assumption we explore is that firms with expats are likely to be
more capital- and R&D-intensive. Our descriptive analysis using panel data also
confirms this assumption.
Capital–labour ratio measures the relative share of capital to labour within a
firm. However, in the Danish register data, capital can be defined in different
ways. In our definition, we used five different types of capital independently.5
The capital–labour ratio is calculated by dividing the value of capital by the
number of employees in the firm, and can be mathematically expressed as:
𝐶𝑎𝑝𝑖𝑡𝑎𝑙 − 𝑙𝑎𝑏𝑜𝑟 − 𝑟𝑎𝑡𝑖𝑜𝑗𝑡 = 𝐶𝑎𝑝𝑖𝑡𝑎𝑙𝑗𝑡
𝐸𝑚𝑝𝑙𝑜𝑦𝑚𝑒𝑛𝑡(𝐿𝑎𝑏𝑜𝑢𝑟)𝑗𝑡
where ‘j’ stands for the firm and ‘t’ stands for the time period.
When normalized within the industry – i.e. measuring the capital intensity of
expat firms compared to other firms in the same industry – we see that expat
firms are significantly more capital-intensive than non-expat firms (see
Table 4).
Furthermore, expat firms are also significantly more knowledge-intensive
than non-expat firms. We measure the knowledge intensity of the firms by
looking at two indicators. First, we measure the share of native PhDs out of the
firm’s total employment.
𝑆ℎ𝑎𝑟𝑒 𝑛𝑎𝑡𝑖𝑣𝑒 𝑃ℎ𝐷𝑠𝑗𝑡 =𝑁𝑎𝑡𝑖𝑣𝑒 𝑃ℎ𝐷𝑠𝑗𝑡
𝑇𝑜𝑡𝑎𝑙 𝐸𝑚𝑝𝑙𝑜𝑦𝑚𝑒𝑛𝑡𝑗𝑡
5 The different definitions of capital included Production plants and machinery,
Tangible fixed assets under construction, Land and buildings, Intangible fixed assets
and Other equipment and fixtures.

FAOS Research paper 167
19
where ‘j’ stands for the firm, and ‘t’ stands for the time period.
Second, we measure the research and development intensity of firms by using
their R&D engagement, which is measured by a dummy variable that takes
value 1 if a firm employs at least one R&D worker, or 0 otherwise. The R&D
dummy can be expressed as:
𝑅 & 𝐷𝑗𝑡 = {1, 𝑖𝑓 𝑛𝑜. 𝑜𝑓 𝑅 𝑎𝑛𝑑 𝐷 𝑤𝑜𝑟𝑘𝑒𝑟𝑠 > 00, 𝑜𝑡ℎ𝑒𝑟𝑤𝑖𝑠𝑒
where ‘j’ stands for the firm and ‘t’ stands for the time period.
Both of these measurements are then normalized within the industry, comparing
the R&D intensity and share of native PhDs of the expat and non-expat firms. In
Table 4, we see that expat firms are not only capital-intensive but also much
more R&D-intensive and likely to have more native PhDs.
Table 4: Capital–labour ratio and R&D engagement
Expat firms Non-expat firms t-test
(1) (2)
K–L intensity 481.90 338.82 ***
Normalized K–L intensity 1.18 0.96 ***
R&D intensity 0.08 0.01 ***
Normalized R&D intensity 3.30 0.48 ***
Share of native PhDs 0.01 0.00 ***
Normalized share of native
PhDs
2.40 0.65 ***
Note: Firms with negative value of capital are dropped. * p < 0.05, ** p < 0.01 and *** p < 0.001.
In sum, expat firms are more capital- and R&D-intensive than non-expat firms
are. This finding is true not only as a general tendency across all firms, but also
when compared to firms within the same industry.
4.3 Expat firms’ skill flows
In this section, we analyse how expat firms use the native and expat skills they
recruit. We compare basic characteristics of expat and non-expat (i.e. native)
workers within expat firms.
In the third of the formulated assumptions, we supposed that recruitment of
expats is a way to import knowledge, and likewise that expat firms might need
to export knowledge – that is, send native employees abroad. We measure this
export of knowledge by looking at the share of native workers who emigrate to
other countries from Danish firms. We consider emigration of the native
workers during the next year, as data is usually collected in November. We

FAOS Research paper 167
20
measure the share of native emigrants out of the firms’ total employment as
follows:
𝑁𝑎𝑡𝑖𝑣𝑒 𝐸𝑚𝑖𝑔𝑟𝑎𝑛𝑡𝑠𝑗𝑡 =𝑁𝑎𝑡𝑖𝑣𝑒 𝐸𝑚𝑖𝑔𝑟𝑎𝑛𝑡𝑠(𝑡+1)
𝑇𝑜𝑡𝑎𝑙 𝐸𝑚𝑝𝑙𝑜𝑦𝑚𝑒𝑛𝑡𝑗𝑡
where ‘j’ stands for the firm, and ‘t’ stands for the time period.
Comparing the share of natives who emigrate from expat firms with the share of
natives who emigrate from non-expat firms within the same industry, we see
that expat firms are more than three times likely to have mobile native workers
than are non-expat firms. Expat firms are characterized by a generally higher
level of cross-country mobility, including both recruitment of expats from
abroad and native workers emigrating.
Table 5: Danish emigrants from expat firms
Expat firms Non-expat firms t-test
(1) (2)
Native emigrants 0.23 0.07 ***
Normalized emigrant share 1.90 0.82 ***
Note: We consider emigrants at time t+1 because the emigration data is collected in November of
each year. * p < 0.05, ** p < 0.01 and *** p < 0.001.
Turning to the tasks performed by employees within expat firms, we formulated
the fourth assumption that because expat firms in general foster skills mobility,
their mobile workers – both expats coming from abroad and native workers
emigrating – perform more analytical, communicative and non-routine tasks
than non-mobile workers. The descriptive analysis of the panel data also
confirms this assumption.
We compared the tasks performed by expats, native emigrants and native
stayers who all work within the same occupational groups as our expat selection
(i.e. ISCO 1–3). Looking at the percentage of these three groups across ISCO
1–3 in Table 6, we see that expats and native emigrants are more likely to work
as professionals (ISCO 2) than are stayers, who are slightly more likely to work
as technicians and assistants (ISCO 3).
Table 6 also presents an index for the task content of the jobs for expats,
native emigrants and stayers. We see that both expats and native emigrants – i.e.
mobile skilled labour – perform more analytical tasks than do stayers within
expat firms. They are also more likely to perform more communicative tasks
and non-routine tasks than are stayers.
These last results also confirm the fifth assumption that expats perform
specialized and high-skilled tasks within their host firms that non-migrating
employees are unable to perform. Comparison of relative wage levels for
mobile highly skilled labour in Denmark shows that mobile highly skilled
labour was paid on average 8 to 11 per cent more than non-mobile Danish

FAOS Research paper 167
21
labour (i.e. stayers) (DEA 2016a).6 Thus, not only does highly skilled mobile
labour perform tasks different from those of non-mobile labour, they also
appear to earn more.
Table 6: Comparison of stayers, emigrants and expats
Stayers Emigrants Expats t-test
(1) (2) (3) (1) vs (2) (1) vs (3)
Worker characteristics
Age 43.14 38.0 40.43 *** ***
Female 0.57 0.46 0.47 *** ***
Percentage of each group
Managers 0.07 0.07 0.05 ***
Professionals 0.52 0.57 0.61 *** ***
Technicians &
associates
0.40 0.34 0.34 *** ***
Task contents
Analytical 7.22 7.46 7.46 *** ***
Manual 1.14 0.92 1.02 *** ***
Communication 7.50 7.70 7.62 *** ***
Non-routine 5.46 5.68 5.58 *** ***
Routine 2.46 2.31 2.40 *** ***
N 8,877,945 42,444 539,750
* p < 0.05, ** p < 0.01 and *** p < 0.001.
4.4 Conclusion and discussion
The number of expats in Denmark is increasing. The main driver of this
development is the increasing recruitment of expats by large expat firms.
Furthermore, we see a clear increase in the number of expat firms – that is,
firms with one or more expats employed. The global economic crisis of 2008
reduced the number of firms in Denmark in general, but the expat firms appear
to have been much less affected by the crisis. Moreover, the increasing number
of expat firms is not simply the result of a general increase in the total economy
and number of firms, because while the number of expat firms has been
increasing, the number of non-expat firms has been declining over time (i.e.
from around 30,000 to 25,000 in our sample).
Expat firms are more likely to export or import than are non-expat firms in
the same industry. Thus, expat firms interact much more with markets and firms
from abroad and have a wider global reach than does the average firm in their
6 The DEA includes expats from ISCO Groups 2 and 3 in their wage analysis (DEA
2016a), as we do for our expat population. One difference from our expat population is
that the DEA excludes ISCO Group 1, which are managers. Furthermore, they include
expats who arrived in Denmark in the period 2004–2013, whereas our population
includes all expats living and working in Denmark in 2003–2014. Despite these
differences, we consider the wage regression and fixed effects analysis carried out by
DEA to be representative for our population as well. In fact, one would expect our
population, which includes high-earning managers and long-term stayers, to give an
even better wage comparison result in favour of the expat group.

FAOS Research paper 167
22
industry. Expat firms are also more capital-intensive and R&D-intensive than
non-expat firms. This is not only true as a general tendency across all firms, but
also when compared to firms within the same industry.
These results show that expat firms require investments and knowledge to
compete in their market, and the recruitment of expats can be one strategy to
improve knowledge of and access to markets, introduce new technology and
knowledge in an effort to enhance competitiveness and perhaps even spark
innovation within the company. The literature demonstrates that these benefits
are important motivations for the recruitment of skills to capital- and
knowledge-intensive firms and firms recruiting technical skills from abroad
(Benson-Rea and Rawlinson 2003; Tzabbar 2009; Ozgen et al. 2014; Peri and
Sparber 2011). In addition, expat firms are characterized by a generally higher
level of cross-country skills mobility, including both recruitment of expats from
abroad and native workers emigrating. Our results show that both expats and
native emigrants – i.e. mobile highly skilled labour – perform more analytical
tasks than do stayers within expat firms. They are also more likely to perform
communicative tasks and non-routine tasks, but are less likely than stayers to
perform manual tasks.
These findings indicate that firms recruit expats to supplement skills rather
than to substitute existing highly skilled labour within their firms. More
research is needed to establish whether this supplementation is primarily to
make up for shortages within the national workforce, to increase productivity, to
internalize complementary knowledge or to enhance firms’ innovative capacity.
The Danish public debate focuses mainly on the question of labour and skills
shortages, but the reasons for companies to recruit expats are much more
complicated. Furthermore, there is no indication that the recruitment of highly
skilled foreign labour is about cutting wage costs.
5. Small and large expat firms
The following subsections present our comparison of small and large expat
firms. We focus on small firms that successfully attract highly skilled mobile
foreign labour and compare their firm characteristics with those of large firms
with similar recruitment of expats. As mentioned above, we differentiate
between large companies having 250 employees or more and small companies
with more than 10 but fewer than 250 employees.
From Figure 1, presented in Section 3.2, we know that large firms recruit
the majority of expats. Thus, large firms are the main drivers in the increasing
number of expats moving to Denmark. From Figures 4 and 5 – which compare
the time trend in the number of small and large expat firms – we see that the
number of large firms recruiting expats decreased around the time of the global
financial crisis, but from 2012 the number of large firms recruiting expats
picked up again, although at a lower level. On the other hand, since 2003 there
has been a continuous upward trend in the number of small expat firms, which
was only moderately affected by the crisis. The increasing number of small
Danish firms recruiting highly skilled labour from abroad has contributed to the
upward trend in the number of expats coming to Denmark. From 2003 to 2014,

FAOS Research paper 167
23
the number of expats working in small firms more than doubled, with 29
per cent of the expat population working in a small firm in 2014.
Figures 4 and 5: Number of small and large expat firms, 2003–2014
5.1 Small expat firms’ global reach
Small expat firms show the same trend in global reach as large expat firms,
though to a lesser degree. Again, we define export (or import) intensity as the
share of export (or import) out of the firm’s total sales. Export (or import)
intensity ranges from 0 to 1, where 0 means that the firm is not exporting any of
its outputs and 0.5 means that half of the firm’s output is exported. Small expat
firms export 22 per cent of their total sales, whereas large firms export close to
a third. When normalized within the industry, we observe the same tendency.
Again, normalized export or import intensity measures the intensity of
export/import of a given firm compared to other firms in same industry. If the
value of the index is greater than 1, the group of firms is more likely to import
compared to the average firm in the same industry. Table 7 shows that small
expat firms export and import more than the average firm in their industry, but
small expat firms do so to a lesser degree than large expat firms. This result is
consistent with the international trade literature, which has demonstrated that
larger firms export more (Bernard et al. 1995).
Table 7: Export and import intensity of large and small expat firms
Small firms Large firms t-test
(1) (2)
Export intensity 0.22 0.30 ***
Normalized exp. intensity 1.71 3.32 ***
Import intensity 0.14 0.16 ***
Normalized imp. intensity 1.48 2.50 ***
Note: Some firms exhibit export and import intensity of above 1. We report this table by capping
such values at 1. * p < 0.05, ** p < 0.01 and *** p < 0.001.
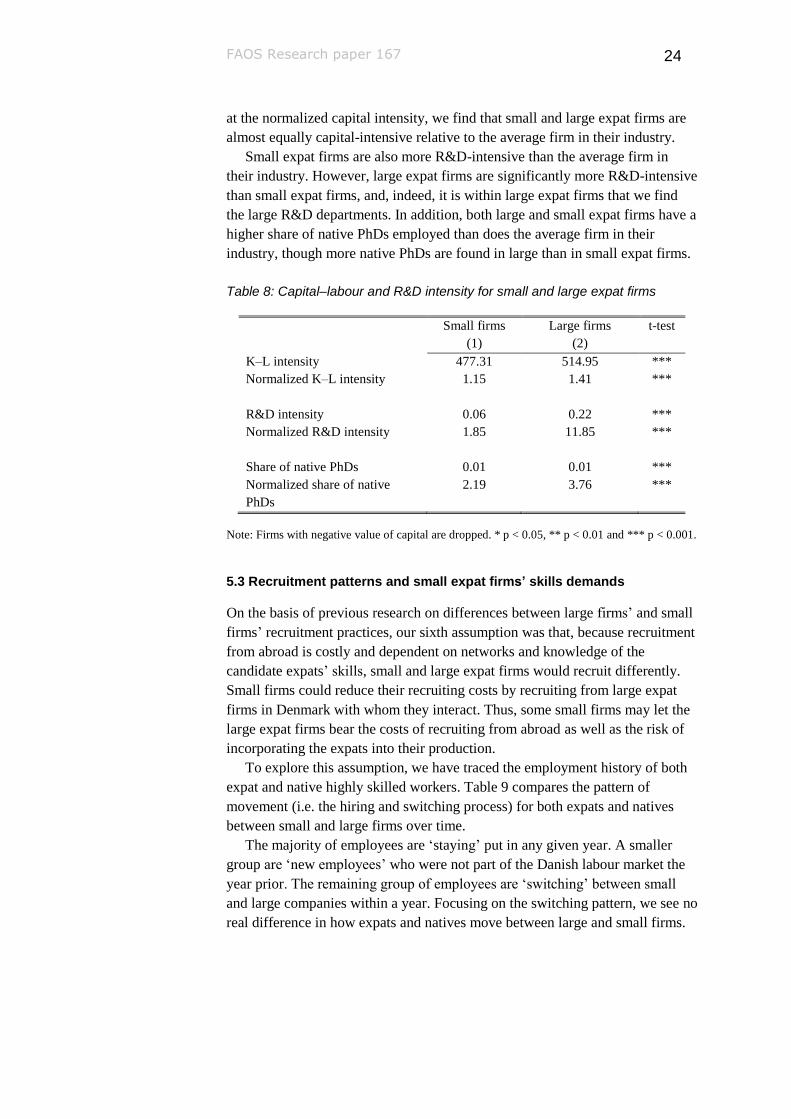
5.2 Small expat firms’ capital and knowledge intensity
With respect to capital and R&D intensity, small expat firms share the same
characteristics with large expat firms, though to a lesser degree. When we look
FAOS Research paper 167
24
at the normalized capital intensity, we find that small and large expat firms are
almost equally capital-intensive relative to the average firm in their industry.
Small expat firms are also more R&D-intensive than the average firm in
their industry. However, large expat firms are significantly more R&D-intensive
than small expat firms, and, indeed, it is within large expat firms that we find
the large R&D departments. In addition, both large and small expat firms have a
higher share of native PhDs employed than does the average firm in their
industry, though more native PhDs are found in large than in small expat firms.
Table 8: Capital–labour and R&D intensity for small and large expat firms
Small firms Large firms t-test
(1) (2)
K–L intensity 477.31 514.95 ***
Normalized K–L intensity 1.15 1.41 ***
R&D intensity 0.06 0.22 ***
Normalized R&D intensity 1.85 11.85 ***
Share of native PhDs 0.01 0.01 ***
Normalized share of native
PhDs
2.19 3.76 ***
Note: Firms with negative value of capital are dropped. * p < 0.05, ** p < 0.01 and *** p < 0.001.
5.3 Recruitment patterns and small expat firms’ skills demands
On the basis of previous research on differences between large firms’ and small
firms’ recruitment practices, our sixth assumption was that, because recruitment
from abroad is costly and dependent on networks and knowledge of the
candidate expats’ skills, small and large expat firms would recruit differently.
Small firms could reduce their recruiting costs by recruiting from large expat
firms in Denmark with whom they interact. Thus, some small firms may let the
large expat firms bear the costs of recruiting from abroad as well as the risk of
incorporating the expats into their production.
To explore this assumption, we have traced the employment history of both
expat and native highly skilled workers. Table 9 compares the pattern of
movement (i.e. the hiring and switching process) for both expats and natives
between small and large firms over time.
The majority of employees are ‘staying’ put in any given year. A smaller
group are ‘new employees’ who were not part of the Danish labour market the
year prior. The remaining group of employees are ‘switching’ between small
and large companies within a year. Focusing on the switching pattern, we see no
real difference in how expats and natives move between large and small firms.

FAOS Research paper 167
25
Table 9: Switching pattern of expat and native workers across small (S) and large (L) firms
Staying New employees Switching
All L S S-S S-L L-S L-L Total
Natives 79.69 4.46 3.36 2.48 1.96 2.02 6.19 100
Expats 71.43 9.91 6.09 2.33 1.91 1.92 6.37 100
Furthermore, we have explored expat firms’ hiring patterns for both native
workers and expat workers. Table 10 shows the hiring pattern from the firm’s
perspective. The overwhelming majority of workers hired are native, as one
would expect. In addition, the share of expats hired – compared to the total of
newly hired employees within a given firm – is slightly higher in small firms.
This finding is consistent with our previous finding that the majority of expat
workers are in large firms: but could indicate that small expat firms are slightly
more internationalized than large expat firms are. Furthermore, among small
expat firms the trend to hire expats directly from abroad is stronger than the
trend to hire them from other firms in Denmark, when compared to large expat
firms. This finding indicates that small firms are capable of recruiting directly
from abroad and are not necessarily reliant on larger firms for their expat
labour. Thus, there is nothing to indicate that small firms need to recruit expats
differently from how they recruit native workers, and we cannot confirm our
assumption. Lastly, we also found that large firms are more likely to hire native
new graduates than are small firms.
Table 10: Hiring patterns of expat firms
Small firms Large firms t-test
New workers in expat firms
Expats 8.38 6.76 ***
Natives 91.62 93.24 ***
Sum 100 100
New expat workers
From abroad 5.05 3.95 ***
From other firms in Denmark 3.33 2.81 ***
New native workers
New graduates 37.18 40.08 ***
From other firms in Denmark 54.44 53.15 ***
Sum 100 100
* p < 0.05, ** p < 0.01 and *** p < 0.001
When comparing the first types of permits that expats hired by small and large
firms obtain (see Figures 6 and 7), we see only very little difference in expats’
route to employment in small and large firms. Large firms on average hire 63
per cent of their expats by means of a work visa, whereas the figure is 54
per cent for small firms. Moreover, large firms hire about 26 per cent of their
expats from EU/EEA countries, whereas the figure for small firms is 30
per cent. Thus, small firms recruit slightly more expats from EU countries,
whereas large firms recruit slightly more expats from countries outside the EU,
but overall the pattern is rather similar.

FAOS Research paper 167
26
The fact that there were practically no asylum seekers and very few family
reunifications confirms that our selected population for the panel data analysis
is in fact highly skilled labour recruited to Denmark, which was the group we
targeted.
Figure 6: First permit type of expats hired in small firms
Figure 7: First permit type of expats hired in large firms
To explore the recruitment of expats further, we examined the expats’ self-
reported experience of recruitment to Denmark in the survey data. In Table 11,
we see that expats working in small firms in Denmark are slightly more likely
to be attracted by their firm. Furthermore, large firms appear to benefit from
their visibility; more of the expats working in large firms sought the firms out
themselves.
There is also a slight difference between expats working in small and large
firms in the factors considered when choosing to come to work in Denmark. Of
the expats working in large companies, 34 per cent were motivated by the
opportunity to work for a world-class company, whereas only 21 per cent of the
expats working in small firms reported this possibility as a main factor. In
addition, whereas 25 per cent of the expats working in small firms reported

FAOS Research paper 167
27
higher income as a motivation, this factor was relevant for 18 per cent of the
expats working in a large firm. These nuances of recruitment indicate that even
though small firms are able to recruit expats directly from abroad, there is less
chance of expats actively seeking them out.
Table 11: Expats’ self-reported experience before arriving and working in Denmark (based on The Expat Study 2014)
Firms
Small Large Sign.
Experience
Experience as expat 0.68 0.70
Work experience
0–5 years 0.58 0.47 ***
More than 5 years 0.42 0.53 ***
Previous education
Bachelor or lower 0.51 0.25 ***
Masters 0.42 0.46
PhD 0.07 0.29 ***
Factors for choosing Denmark
To improve my career 0.44 0.49 *
Interesting job 0.43 0.40
Good work–life balance 0.44 0.38 **
New exposure and personal development 0.37 0.30 **
Working for world-class company 0.21 0.34 ***
Higher income 0.25 0.18 ***
Recruitment
Applied myself 0.54 0.70 ***
Attracted by the firm 0.17 0.11 ***
Other 0.28 0.18 ***
N 700 1153
* p < 0.05, ** p < 0.01 and *** p < 0.001.
Furthermore, Table 12 show that after arriving and working in Denmark, expats
in small or large firms do not appear to have significant differences in
experience with working and living in Denmark.

FAOS Research paper 167
28
Table 12: Expats’ self-reported experience after arriving and working in Denmark (based on The Expat Study 2014)
Firms
Small Large Sign.
Denmark offers
Career opportunities 0.54 0.59 *
Appealing work culture 0.77 0.77
Satisfactory job 0.80 0.84 *
Enjoy living in Denmark 0.86 0.86
N 700 1153
* p < 0.05, ** p < 0.01 and *** p<0.001.
In connection with our assumption that small and large firms would recruit
differently, we stated in our seventh assumption that small and large firms
would demand similar skills. To explore this assumption, we compared both the
task content of expats’ jobs in small and large firms and their wage levels.
Looking at Table 13, we cannot confirm this assumption. The index for task
content, which draws from the US O*NET survey approach, shows that expats
in small firms carry out analytical and communicative tasks less than expats in
large firms. Expats in small firms also perform less manual task. The difference
is minor, but still significant due to a large number of observations. However,
expats in small firms carry out both routine and non-routine tasks a bit more
than expats in large firms, indicating that in small firms, expats probably carry
out a broader range of tasks than do expats in large firms. This difference may
reflect a narrower degree of knowledge specialization of jobs in small firms.
Similarly, the OECD PIACC survey index, which draws on a survey
approach adapted to a European context of proficiency skills, confirms this
picture. Expats in small firms use slightly fewer skills in their jobs than do
expats in large firms. Most of the differences found between expats in small and
large firms are not significant on account of the smaller number of observations,
but the results indicate a clear pattern. Among the significant differences found,
expats working in large firms have a higher level of computer use in their jobs.
Furthermore, expats working in large firms tend to write memos and emails
‘more often’, use computers to find work-related information and use
spreadsheet software. The difference in means measuring these tasks is not
large, but indicates a higher degree of skills use. Again, it is likely that these
differences reflect a higher level of skills specialization among expats in large
firms.

FAOS Research paper 167
29
Table 13: Task content of work for expats working in small and large firms
(1) (2) (3)
Small Large Significance
O*NET survey
Analytical 7.07 7.64 ***
Manual 0.98 1.04 ***
Communicative 7.19 7.78 ***
Non-routine 5.63 5.58 ***
Routine 2.51 2.36 ***
No. of observations O*NET 92919 246942
PIAAC survey
Frequency of analytical tasks (scale 1–5)
Read newspapers or magazines 3.66 3.87
Read journals or publications 3.20 3.23
Read diagrams, maps or schematics 2.87 3.16
Write letters, memos or mails 4.44 4.76 **
Write articles 1.48 1.61
Frequency of manual tasks (scale 1–5)
Working physically for long 2.56 2.16
Using hands or fingers 3.91 3.78
Frequency of communicative tasks
Sharing work-related information 4.51 4.56
Selling 1.66 1.71
Advising people 3.91 3.73
Frequency of computer-related tasks (scale 1–
5)
Finding work-related information 4.15 4.62 ***
Use spreadsheets software 2.96 3.49 **
Use a word processor 3.97 4.16
Level of computer use (scale 1–3) 1.94 2.20 ***
No. of observations PIAAC 1501 555
* p < 0.05, ** p < 0.01 and *** p < 0.001.
Note: O*NET is the ‘Occupational Information Network’ database of worker skills,
competencies, job requirements and other occupational attributes. The network is under the
sponsorship of the U.S. Department of Labor/Employment and Training Administration
(USDOL/ETA). PIAAC is the Survey of Adult Skills conducted by the OECD; it measures
adults’ proficiency in key information-processing skills – literacy, numeracy and problem-solving
in technology-rich environments – and gathers information and data on how adults use their skills
at work.
When scrutinizing the wage levels of expats working in small and large firms
compared to those of natives in the same firms, we found some small
differences. Table 14 presents the results of a panel regression analysis on the
hourly wages of expats versus natives in small and large firms. We also
undertook a similar analysis at sectoral levels, including agriculture (fishery and
mining), manufacturing and services. In the analysis we control for other factors
that could influence wage levels, such as job type, industry, age, gender, union
membership and marital status. We do not control for work experience or
formal education, as we do not have register data on these aspects.

FAOS Research paper 167
30
Table 14: Comparison of earnings between natives and expats in small and large firms
(1) (2) (3) (4) (5) (6) (7)
Small firms Large firms Obs
Sector Natives Expats Dif. Natives Expats Dif.
All - -4.98% -4.98% *** 4.88% 3.89% -0.99% *** 5215105
Primary - -0.42% -0.42% 4.45% 7.33% 2.88% *** 68260
Secondary - -3.56% -3.56% *** 7.65% 7.76% 0.11% 444901
Tertiary - -5.28% -5.28% *** 4.34% 2.94% -1.39% *** 4702687
∗p < 0.1, ∗∗ p < 0.05 and ∗∗∗ p < 0.01.
Note: Each table entry is the parameter estimate or the combination of parameter
estimates measuring the wage differential (in per cent) between the group listed in the
columns and natives in small firms. The estimates are obtained from regressions
controlling for age, age square, gender, marital status and union membership. In addition,
we applied four-digit occupation fixed effects (ISCO codes) and six-digit industry fixed
effects based on the Danish Industrial Classification (DB07). See more in Appendix C.
Table 14 shows that expats and natives working in large firms earn about 4 to 5
per cent more than native workers in small firms. This finding corresponds with
the general trend of a size-wage premium for employees working in large firms
(Brown and Medoff 1989; Troske 1999; Gibson and Stillman 2009).
Comparing expats and natives within similarly sized firms, we see that the
hourly wage difference between native and expat workers in large firms is about
1 per cent, which is a very small difference. The hourly wage of expat workers
in small firms is nearly 5 per cent lower than that of their native counterparts
working in small firms. This difference in hourly wages is also rather small, and
omitted factors could possibly account for this difference. Actual work
experience of expats, formal education and language proficiency are important
determinants of wages and have not been included in our panel regression
analysis. However, we do have information on some of these variables from the
survey data dealing with the group of expats who arrived after 2009. Expats
employed in small firms have less work experience than do expats in large firms
(see Table 11 in Section 5.3). In addition, 75 percent of the expats in large firms
hold a masters or a PhD degree, but only 49 percent of the expats in small firms
have a similar high education.
This could indicate that experience and formal skills might explain some of
the wage difference found between expats and native workers in small firms
and very likely contributes to the higher earnings of expats in large versus small
firms.
5.4 Conclusion and discussion
A growing number of small firms recruits expats. Although these firms play a
role in increasing the number of expats moving to Denmark, large firms mainly

FAOS Research paper 167
31
drive the upward trend. Only 29 per cent of the expat population worked in
small firms in 2014. However, small firms are equally if not more likely than
large firms to recruit directly from abroad. Small expat firms recruit slightly
more workers from other EU/EEA countries, whereas large firms recruit
slightly more expats from countries outside the EU/EEA. Overall, small expat
firms appear to have their own recruiting channels and networks for recruiting.
The capability of small expat firms to recruit directly from abroad may
follow from the fact that small expat firms have a larger global reach, and are
more capital- and R&D-intensive, than small firms in general within their
industry. Small expat firms share these characteristics with large expat firms,
though to a lesser degree. Thus, by recruiting expats from abroad, small firms
engage – like large firms – in strategies to improve knowledge of and access to
markets, as well as to introduce new technology and knowledge in an effort to
enhance competitiveness and innovation within the company.
However, small expat firms use their expats’ skills differently than do
large expat firms. Expats in small expat firms tend to carry out tasks that are
less analytical and communicative, but more manual and routine, than those of
expats in large firms. At the same time, expats in small firms are more likely to
carry out non-routine tasks, thus complicating the image of expats carrying out
less skilled tasks in small firms. Taken together, these findings might reflect
that jobs in small firms are less specialized, and that expats in small firms carry
out multiple functions to a greater extent than do expats in large firms.
The different use of expats’ skills in small firms is also reflected in their
wage levels. Expats and natives working in large firms earn about 4 to 5
per cent more than native workers in jobs requiring similar skills in small firms.
This finding is not surprising given previous evidence of a general size-wage
premium to the advantage of workers in large firms (Brown and Medoff 1989;
Troske 1999; Gibson and Stillman 2009). There are various possible
explanations for this inequality in wage levels found across countries (Troske
1999). Several explanations point to differences in the skill levels of employees
and managers, with employees and managers in large firms being the most
skilled (Brown and Medoff 1989; Troske 1999).
Small expat firms may share the traits of having a global reach, being
capital- and knowledge-intensive and requiring skills and investments to
improve competitiveness with large expat firms, but they carry these traits to a
lesser degree, perhaps attracting less skilled workers. Results from The Expat
Study 2014 (see Table 11 in Section 5.3), which provides expats’ self-reported
work experience, show that expats in large firms have more work experience
and higher formal educational level than do expats employed in small firms.
However, some researchers have challenged the skills explanation, arguing
that it is more likely that large firms pay more because they generate more
productive workers, or they simply benefit from an enhanced market position
relative to more vulnerable small firms (Gibson and Stillman 2009). Small firms
are likely to be more vulnerable to failings of the markets and long-term
investments. Accordingly, they may refrain from committing too many
resources to salaries.

FAOS Research paper 167
32
The Expat Study 2014 survey data seem to support the idea that expats in
large firms might be more productive. Thus, survey data show that expats in
large firms are more ambitious. Expats in large firms were more often
motivated to come to Denmark to improve their career and working in a world-
class company than were expats in small firms. Differently, expats in small
firms more often choose to come to Denmark to improve their work-life
balance, for personal development, higher income or an interesting job than did
expats in large firms.
Furthermore, our analysis show that the difference in hourly wages between
expats and natives in large firms is very small. However, expats in small firms
earn 5 per cent less than natives working in similar jobs in small firms. Various
other factors possibly explaining these outcomes – including the actual work
experience of expats, formal education and language proficiency – have not
been included in our panel regression analysis. Nevertheless, the mentioned
self- reported difference in experience and education between expats in large
and small firms might indicate that formal skills and experience could be an
explanation for the wage difference of expats in small firms relative to their
Danish counterparts. In addition, it is possible that some expats in small firms
benefit from paid accommodation or stock options, but such considerations are
not part of our analysis.

FAOS Research paper 167
33
References
Ackers L (2004) Managing relationships in peripatetic careers: Scientific
mobility in the European Union. Women’s Studies International Forum 27,
189–201.
Ackers L (2005) Moving people and knowledge: Scientific mobility in the
European Union. International Migration 43 (5), 99–131.
Alaminos A and Santacreu O (2010) Hidden migrations: Spanish highly skilled
migration in the European Union. International Journal of Contemporary
Sociology. Special Issue. 47 (1), 81–96.
Andresen M, Bergdolt F, Margenfeld J and Dickmann M (2014) Addressing
international mobility confusion: Developing definitions and differentiations for
self-initiated and assigned expatriates as well as migrants. The International
Journal of Human Resource Management 25 (16) 2295–2318.
Benson-Rea M and Rawlinson S (2003) Highly skilled and business migrants:
Information processes and settlement outcomes. International Migration 41 (2),
59–79.
Bernard AB, Jensen JB and Lawrence RZ (1995) Exporters, jobs, and wages in
US manufacturing 1976–1987. Brookings papers on economic activity.
Microeconomics, 1995, 67–119.
Boyd M (2014) Recruiting high skill labour in North America: Policies,
outcomes and futures. International Migration 52 (3), 40–54.
Brown C and Medoff J (1989) The employer size-wage effect. The Journal of
Political Economy 97 (5), 1027–1059.
Cerna L (2010) Policies and practices of highly skilled migration in times of the
economic crisis. International Migration Papers no. 99. International Labour
Organisation (ILO).
Cerna L (2014) Attracting high-skilled immigrants: Policies in comparative
perspective. International Migration 52 (3), 69–84.
DEA (2016a) Kvaliteten af ind- og udvandring af højtkvalificeret arbejdskraft i
Danmark. DEA, København, https://dea.nu/publikationer/kvaliteten-
udvandring-hoejtkvalificeret-arbejdskraft-danmark.
DEA (2016b) Er højtuddannede indvandrere en god forretning for Danmark?
En registerbaseret cost-benefit analyse af højtuddannede indvandrer. DEA,
København,
https://dea.nu/sites/dea.nu/files/er_hoejtuddannede_indvandrere_en_god_forret
ning_for_danmark_0.pdf.
DEA (2016c) Brain drain eller brain gain? Arbejdskraftvandringer til og fra
Danmark. DEA, København, https://dea.nu/publikationer/brain-drain-brain-
gain-arbejdskraftvandringer-danmark.

FAOS Research paper 167
34
DEA (2016d) Danske virksomheders internationale rekrutteringsbehov. En
opsamling af virksomhedscases. DEA. København,
https://dea.nu/sites/dea.nu/files/danske_virksomheders_internationale_rekrutteri
ngsbehov_1.pdf.
DiMaggio PJ and Powell WW (1983) The Iron Cage revisited: Institutional
isomorphism and collective rationality in organizational fields. American
Sociological Review 48 (2), 147–160.
DST (2016a) De tusind største virksomheder beskæftiger 50 pct. Nyt fra
Danmarks Statistik nr. 399, 21. september
DST (2016b) Hvornår er små virksomheder små? DST Analyse 2016:18, 31.
oktober
Favell A (2008) The new face of East–West migration in Europe. Journal of
Ethnic and Migration Studies 34 (5), 701–716.
Foged M and Peri G (2016) Immigrants and native workers: New analysis using
longitudinal employer–employee data. American Economic Journal: Applied
Economics 8 (2), 1–34.
Gibson J and Stillman S (2009) Why do big firms pay higher wages. Evidence
from an international database. The Review of Economics and Statistics 91 (1),
218–226.
Habti D and Sabour M (2010) Migration of highly skilled persons and
circulation of competences in the Euro-Mediterranean space. International
Journal of Contemporary Sociology. Special Issue. 47 (1), 7–18.
Hansen NW (2016) International company restructuring and the effects on high-
skilled employees in lead companies. Competition & Change, 20 (4), 237–254.
Hunt J and Gauthier-Loiselle M (2010) How much does immigration boost
innovation? American Economic Journal: Macroeconomics 2, 31–56.
Iredale R (2001) The migration of professionals: Theories and typologies.
International Migration 39 (5), 7–26.
Jacobsen R H, Junge M and Skaksen J R (2011) Højtuddannede indvandreres
bidrag til det danske samfund CEBR rapport, November 2011.
Kennedy P (2005) Joining, constructing and benefiting from the global
workplace: Transnational professionals in the building-design industry. The
Sociological Review 53 (1), 172–197.
Kerr SP, Kerr WR and Lincoln WF (2015) Skilled immigration and the
employment structures of US firms. Journal of Labor Economics 33 (3), 147–
186.
Kerr SP, Kerr WR and Lincoln WF (2014) Firms and the economics of skilled
immigration. NBER Working Paper series. Working Paper 20069. Cambridge,
US, National Bureau of Economic Research.

FAOS Research paper 167
35
Kerr SP, Kerr W, Özden C and Parsons C (2016) Global talent flows. Journal of
Economic Perspectives 30 (4), 83–106.
Kerr SP, Kerr W, Özden C and Parsons C (2017) High-skilled migration and
agglomeration. Annual Review of Economics 9, 201–234.
Khoo S (2014) Attracting and retaining globally mobile skilled migrants: Policy
challenges based on Australian research. International Migration 52 (2), 20–30.
Kofman, E (2013) Toward a gendered evaluation of (highly) skilled
immigration policies in Europe. International Migration 52, 116–128.
Krishnan and Scullion (2016) Talent management and dynamic view of talent in
small and medium enterprises. Human Resource Management Review 27, 431–
441.
Mahroum S (2001) Europe and the immigration of highly skilled labour.
International Migration 39 (5), 27–43.
Mahroum S (2000) Highly skilled globetrotters: Mapping the international
migration of human capital. R&D Management 30 (1), 23–31.
Massey DS, Arango J, Hugo G, Kouaouci A, Pellegrino A and Taylor JE (1993)
Theories of international migration: A review and appraisal. Population and
Development Review 19 (3), 431–466.
Millar J and Salt J (2008) Portfolios of mobility: The movement of expertise in
transnational corporations in two sectors – Aerospace and extractive industries.
Global Networks 8 (1), 25–50.
Minbaeva DB and Michailova S (2004) Knowledge transfer and expatriation in
multinational corporations: The role of disseminative capacity. Employee
Relations 25 (6), 663–679.
Mincer J (1978) Family migration decisions. Journal of Political Economy 86
(5), 749–773.
Nathan M (2014) The wider economic impacts of high-skilled migrants: A
survey of the literature for receiving countries. IZA Journal of Migration 3 (4),
1–20.
OECD (2017) Recent developments in international migration movements and
policies. International Migration Outlook.
http://www.oecd.org/migration/international-migration-outlook-1999124x.htm.
Oxford Research (2014) The Expat Study 2014. Copenhagen, Denmark
http://www.google.dk/url?sa=t&rct=j&q=&esrc=s&source=web&cd=1&cad=rj
a&uact=8&ved=0ahUKEwiR8auMz8jYAhVMDewKHSqMCpEQFggnMAA&
url=http%3A%2F%2Fbm.dk%2F~%2Fmedia%2FBEM%2FFiles%2FDokumen
ter%2FPressemeddelelser%2F2014%2FTheExpatStudy2014%2520pdf.ashx&u
sg=AOvVaw0z433gI3PZfldsbxMmV071.

FAOS Research paper 167
36
Ozgen C, Peters C, Niebuhr A, Nijkamp P, Poot J (2014) Does cultural diversity
of migrant employees affect innovation? International Migration Review 48 (1),
377–416.
Pearson R and Morrell J (2002) Knowledge migrants: The motivation and
experience of professionals in the UK on work permits. URN 02/1291,
European Commission, November 2002.
Peixoto J (2001) The international mobility of highly skilled workers in
transnational corporations: The macro and micro factors of the organizational
migration of cadres. International Migration Review 35 (4), 1030–1053.
Peri G and Sparber C (2011) Highly educated immigrants and native
occupational choice. Industrial Relations. A Journal of Economy and Society 50
(3), 385–411.
Portes, A and Böröcz, J (1989) Contemporary immigration: Theoretical
perspectives on its determinants and modes of incorporation. International
Migration Review 23 (3), 606–630.
Rambøll (2018) Virksomhedssurvey om brug af udenlandsk arbejdskraft.
Rapport til Udlændinge og Integrationsministeriet & Beskæftigelsesministeriet.
København: Rambøll.
Recchi, E (2009) Cross-state mobility in the EU: Trends, puzzles,
consequences. European Societies 10 (2), 197–224.
Salt J (1992) The future of international labor migration. The International
Migration Review 26 (4), 1077–1111.
Salt J and Wood P (2014) Staffing UK university campuses overseas: Lessons
from MNE practice. Journal of Studies in International Education. 18 (1), 84–
97.
Shachar A (2006) The race for talent: Highly skilled migrants and competitive
immigration regimes. New York University Law Review 81 (1), 148–233.
Silvanto S and Ryan J (2014) Relocation branding: A strategic framework for
attracting talent from abroad. Journal of Global Mobility 2 (1), 102–120.
Somaya D, Williamson IO and Lorinkova N (2008) Gone but not lost: The
different performance impacts of employee mobility between co-operators
versus competitors. Academy of Management Journal 51 (5), 936–953.
Stephens, S (2015) The global financial crisis and migration: The experience of
Irish graduates. Journal of Global Mobility 3 (1), 83–99.
Stokes P, Liu Y, Smith S, Leidner S, Moore N and Rowland C (2016)
Managing talent across advanced and emerging economies: HR issues and
challenges in a Sino-German strategic collaboration. The International Journal
of Human Resource Management 27 (20), 2310–2338.

FAOS Research paper 167
37
Troske KR (1999) Evidence on the employer size-wage premium from worker
establishment matched data. The Review of Economics and Statistics 81 (1), 15–
26.
Tucker E (2017) Migrant workers and fissured workforces: CS Wind and the
dilemmas of organizing intra-company transfers in Canada. Economic and
Industrial Democracy. 1–25.
Tzabbar, D (2009) When does scientist recruitment affect technological
repositioning? Academy of Management Journal, 52 (5), 873–896.
Tzeng R (1995) International labor migration through multinational enterprise.
International Migration Review Special Issue 29 (1), 139–154.
Verwiebe R (2014) Why do Europeans migrate to Berlin? Social-structural
differences for Italian, British, French and Polish nationals in the period
between 1980 and 2002. International Migration 52 (4), 209–230.
Verwiebe R, Mau S, Seidel N and Kathmann T (2010) Skilled German migrants
and their motives for migration within Europe. International Migration and
Integration 11, 273–293.
Verwiebe R, Reinprecht C, Haindorfer R and Weisboeck L (2017) How to
succeed in a transnational labor market: Job search and wages among
Hungarian, Slovak and Czech Commuters in Austria. International Migration
Review 51 (1), 251–286.

FAOS Research paper 167
38
Appendices
A. Origins of expat population
Origins of expat population by region and level of development
Year EU/EEA
Non-EU/EEA
Developed Developing
All
2003 10836 2172 18111 31119
2004 11647 2317 18950 32914
2005 12110 2322 18972 33404
2006 13316 2409 19576 35301
2007 14937 2628 21142 38707
2008 16624 2789 22471 41884
2009 19068 3163 25463 47694
2010 19915 3256 26251 49422
2011 21194 3358 26988 51540
2012 22154 3439 27699 53292
2013 25055 3955 31603 60613
2014 26600 3972 33281 63853
Top ten origin countries of expat workers in Denmark
All Small firms Large firms
1 Germany 6200 Germany 1912 Germany 3997
2 Norway 3677 Sweden 1048 Norway 2380
3 Sweden 3631 Norway 1033 Sweden 2365
4 Great Britain 3112 Great Britain 995 Poland 2022
5 Poland 3060 Poland 859 Iran 1991
6 Iran 2666 Bosnia Herceg. 655 Great Britain 1834
7 Bosnia Herceg. 2403 India 612 Bosnia Herceg. 1701
8 Turkey 1987 United States 609 Turkey 1423
9 United States 1914 Iran 570 China 1293
10 China 1814 Iceland 507 United States 1168

FAOS Research paper 167
39
B. Share of expats in each industry by size
Industry (two-digit NACE)
Share of expat firms
All Small Large
Public administration and defence, compulsory social security 0.83 0.18 0.64
Manufacturing of coke and refined petroleum products 0.73 0.08 0.65
Scientific research and development 0.72 0.61 0.1
Manufacturing of pharmaceuticals, medicinal, chemical and botanical
products 0.64 0.41 0.23
Telecommunications 0.53 0.43 0.11
Manufacturing of computer, electronic and optical products 0.5 0.44 0.07
IT and other information services 0.5 0.47 0.03
Education 0.46 0.43 0.04
Manufacturing of chemicals 0.43 0.34 0.09
Publishing, audiovisual and broadcasting activities 0.36 0.3 0.06
Financial insurance activities 0.34 0.24 0.1
Consultancy, including legal, accounting, management, architecture,
engineering activities 0.33 0.31 0.03
Other professional, scientific and technical activities 0.33 0.32 0.01
Human health services 0.32 0.32 0.01
Manufacturing of electrical equipment 0.32 0.26 0.06
Manufacturing of machinery and equipment 0.29 0.24 0.05
Residential care and social work activities 0.28 0.27 0.01
Mining and quarrying 0.26 0.21 0.05
Electricity, gas, steam and air-conditioning supply 0.24 0.16 0.07
Manufacturing of transport equipment 0.23 0.18 0.05
Manufacturing of rubber, plastic and non-metallic mineral products 0.22 0.17 0.05
Administrative and support activities 0.21 0.18 0.03
Arts, entertainment and recreation 0.18 0.17 0.01
Manufacturing of textiles, apparel, leather and related products 0.17 0.16 0.01
Activities of households as employers; undifferentiated goods- and
services-producing activities of households for own use 0.16 0.16 –
Other services 0.15 0.14 0.01
Other manufacturing, and repair and installation of machinery and
equipment 0.15 0.13 0.02
Activities of extraterritorial organizations and bodies 0.14 0.13 0.01
Wholesale and retail trade, repair of motor vehicles and motorcycles 0.14 0.13 0.01
Transport and storage 0.13 0.11 0.03
Water supply and sewerage, waste management and remediation 0.13 0.11 0.02
Manufacturing of metal, except machinery and equipment 0.12 0.11 0.02
Manufacturing of wood and paper products and printing 0.12 0.1 0.02
Real estate activities 0.11 0.09 0.02
Manufacturing of food products, beverages and tobacco products 0.1 0.07 0.03
Accommodation and food service activities 0.09 0.09 0.01
Construction 0.04 0.03 0.01
Agriculture, forestry and fishing 0.02 0.02 –

FAOS Research paper 167
40
C. Wage regression and fixed effects analysis
Comparison of earnings of expat workers in small and large firms
log (hourly wage)
(1) (2) (3)
Size 0.1048*** 0.1086*** 0.0380***
(0.0027) (0.0025) (0.0034)
age 0.1158*** 0.1088*** 0.1025***
(0.0008) (0.0007) (0.0007)
Age Sq. -0.0013*** -0.0011*** -0.0011***
(0.0000) (0.0000) (0.0000)
Female -0.2756*** -0.1267*** -0.1169***
(0.0024) (0.0022) (0.0021)
Union -0.0212*** 0.0255*** 0.0416***
(0.0025) (0.0022) (0.0022)
Married 0.0599*** 0.0294*** 0.0228***
(0.0026) (0.0022) (0.0021)
cons 7.8537*** 7.6536*** 7.7761***
(0.0169) (0.0598) (0.1676)
Occupation FE No Yes Yes
Industry FE No No Yes
adj. R2 0.133 0.418 0.481
N 230570 230553 230553
Note: Size a is a dummy variable which takes 1 if the firm is large (i.e. > 250
employees), 0 otherwise. The occupation fixed effects are at the four-digit ISCO
level. The industry fixed effects are based on the Danish industrial classification
DB07. The data covers the period from 2008 to 2014. The hourly wage variable
is calculated by dividing monthly earnings with the monthly working hours of
workers as reported in the BFL register.