expanding the cee insurance business - vig.com · 2: cee is defined as: bulgaria, croatia, czech...
TRANSCRIPT

Vienna Insurance Group –Expanding the CEE Insurance BusinessPrague Roadshow, 30 January 2008
2
VIG – Dual Listing
Reasons for Dual listing in Prague
§ VIG is the purest CEE insurance play
§ To reflect and strengthen market presence in the Czech Republic
§ Czech business segment is the largest business outside Austria
§ Access to new investors (Emerging market funds)
§ VIG is large cap on PSE
§ Increase of liquidity of stock is expected
Procedure for Dual listing
§ Trading name changed to Vienna Insurance Group to reflect internationalisation of the Group (Trading symbol: VIG)
§ January 22: Listing application at PSE
§ February 5: Trading start for shares as “Vienna Insurance Group” on PSE, it is expected to become an index member of PX
§ February 29: PX-Index calculation
§ March 25: New composition of index will be effective

3
Contents
A
B
C
D
E
Investment Proposition
9M 2007 Highlights
Outlook and Summary
P&L and Balance Sheet
Appendix
A

4
Investment Case in BriefWhat is unique about VIG?
§ VIG is the purest CEE insuranceplay among listed insurance companies
§ VIG has broadest diversification in this fast growing region § Operates in countries with stable
legal and regulatory regimes
§ GDP and insurance densityare twin drivers for long-term CEE growth
§ Distinctive multi-brand strategy backed by synergies from shared services
§ Particular focus on businessexpansion by continuouslybuilding on a diversifieddistribution network
§ CEE business is vital for VIG – country-specificresponsibility for each board member
6
1 2
3
45
A

5
VIG Strategy Delivers
VIG's Path of Profitability Comments
0
1.000
2.000
3.000
4.000
5.000
6.000
7.000
8.000
2002 2003 2004 2005 2006 2007F0
50
100
150
200
250
300
350
400
450
GWPPBT
GW
P in
€m
n
PBT
in €
mn
§ From 2002 to 2006 VIG succeeded in nearly doubling Group gross written premiums implying a CAGR of more than 17%
§ From 2004 to 2007F VIG increases profit before tax from € 156mn to € 435mn corresponding to a CAGR of 40.8%
1: Figures for 2002 and 2003 according to Austrian Commercial Code, thereafter IFRS
1 1
Strong increase in profitability A

6
Purest CEE Insurance Play VIG is the leading Austrian insurance group operating in 20 countries
Footprint CEE Premiums as % of Total Group Premiums
1.4%
2.0%
3.0%
10.1%
28.7%
1.6%
2.3%
3.3%
10.2%
31.1%
1.9%
2.6%
3.6%
12.6%
37.5%
Generali
ING
Allianz
UNIQA
VIG
200620052004
VIG‘s unique share of CEEbusiness growing fastest
(12M 20071: already 42.9% of total
Group premiums – CEE sharein P&C already 57.8% of
premiums)
Source: publicly available information
1: preliminary, unconsolidated, unaudited
Core Markets
A

7
VIG – Top Player in its CEE Markets
Allianz
VIG
Genera
liIN
GKBC
Uniqa
Number 2 among international insurance groups (based on premiums)
Market Share in CEE2 overall
~ 12.8%~ 12.5%
~ 10.9%1
~ 3.4%
~ 4.9%~ 5.0%
Source: National insurance associations, based on local currencies
1: pro forma incl. recent acquisition, 9M 2007
2: CEE is defined as: Bulgaria, Croatia, Czech Republic, Hungary, Poland, Romania and Slovakia
Market Share in CEE2 Non-life
VIG
Allianz
Genera
liKBC
UniqaING
~ 17.1%~ 15.8%
~ 13.4%1
~ 5.8%~4.5%
~0.0%
A
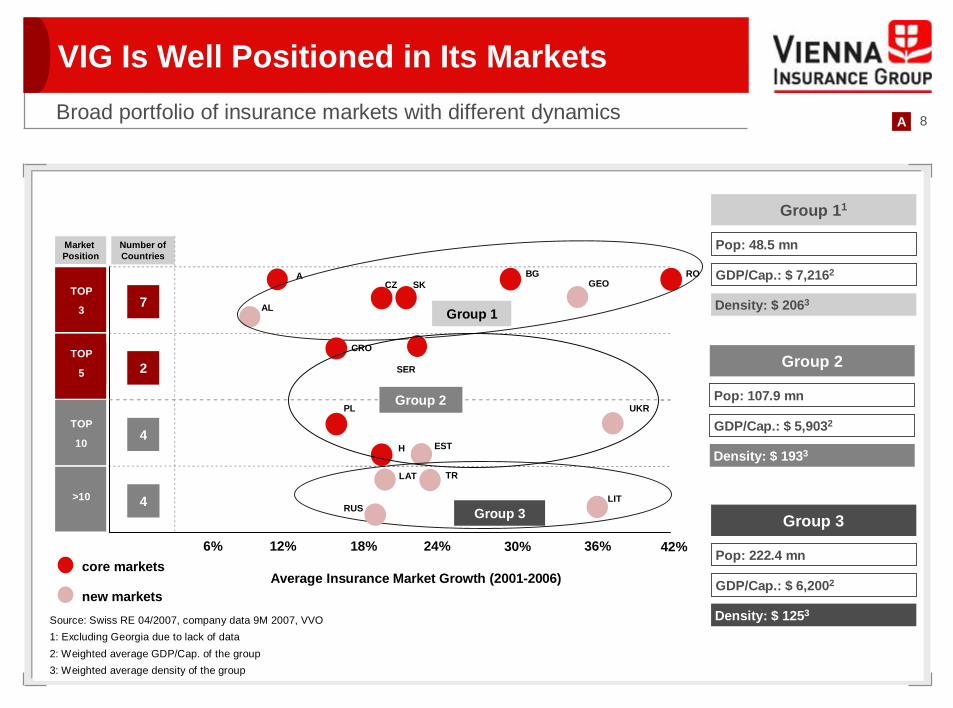
8Broad portfolio of insurance markets with different dynamics
VIG Is Well Positioned in Its Markets
Source: Swiss RE 04/2007, company data 9M 2007, VVO1: Excluding Georgia due to lack of data2: Weighted average GDP/Cap. of the group3: Weighted average density of the group
4
Number ofCountries
6% 12% 24%18% 30% 36%
7
2
4
Market Position
TOP
3
TOP
5
TOP
10
>10
Average Insurance Market Growth (2001-2006)core markets
new markets
42%
AL Group 1
A BGCZ GEO
ROSK
Group 11
Pop: 48.5 mn
GDP/Cap.: $ 7,2162
Density: $ 2063
Group 2UKR
CRO
H
PL
SER Group 2
Pop: 107.9 mn
GDP/Cap.: $ 5,9032
Density: $ 1933EST
RUS
TR
Group 3 Group 3
Pop: 222.4 mn
GDP/Cap.: $ 6,2002
Density: $ 1253
LAT
LIT
A

9
Geographical Diversification EnhancedGWP split by region
Austria54.4%
CzechRepublic
16.7%
Slovakia7.2%
Other CEE18.2%
PL: 7.8%RO: 6.0%
Other3.5%
9M 2007 Total: € 5.0bn
GWP by Geography 9M 07
Austria59.1%
Other3.7%
9M 2006 Total: € 4.3bn
Other CEE12.7%
PL: 5.4%RO: 3.9%
Slovakia6.6%
CzechRepublic
17.9%
GWP by Geography 9M 06
§ Other CEE (incl. Poland and Romania) more than tripling to close to 20% of premium share§ Czech Republic and Slovakia stable§ Substantially better diversification attained in 2 years only
Austria64.8%
Other CEE 5.9%
PL: 1.3%RO: 2.3%
9M 2005 Total: € 3.8bn
Slovakia6.7%
CzechRepublic
17.3%
GWP by Geography 9M 05
Other5.3%
A

10
1 Premiums in % of GDP.2 Weighted average for CEE. CEE is defined as Bulgaria, Croatia, Czech Republic, Hungary, Poland, Romania, Serbia, Slovakia, Slovenia and Ukraine.Source: For GDP Growth IMF(World Economic Outlook as of 2007). For all other data Swiss Re Sigma Nr. 4/2007 (July 2007)
0
2,000
4,000
0 10,000 20,000 30,000 40,000 50,000
CEE Region Offers Twin Growth
Growth driven by GDP and insurance penetration
Insu
ranc
e D
ensi
ty (U
SD)
GDP per Capita (USD)
Immature Markets
Growth Markets
Mature MarketsEU-15
A
SLO
CZ
HSKPL
CRO
RUS
BGRO
UKR
TRSER
9.3%2.5%EU 15
6.2%2.8%Austria
3.3%5.5%CEE2
Insurance Penetration
20061
GDP Growth2006 – 2008F
A

11
Insu
ranc
e Pr
emiu
m p
er C
apita
(USD
)CEE Region Offers Twin Drivers
0
100
200
300
400
500
600
700
800
900
1,000
0 2,000 4,000 6,000 8,000 10,000 12,000 14,000 16,000 18,000 20,000
GDP per Capita (USD)
G 4: RO, BG, UKR
G 3: SER, TR, RUS
G 2: H, SK, PL
G 1: CZ, CROG1 98
G1 06
G1 10eEstimated development of density from 1998 -2010e
G2 98
G2 06
G2 10e
G3 98
G3 06
G3 10e
G4 98
G4 06
G4 10e
Growth driven by GDP and insurance penetration
9.3%2.5%EU 15
6.2%2.8%Austria
3.3%5.5%CEE2
Insurance Penetration
20061
GDP Growth2006 – 2008F
1 Premiums in % of GDP.2 weighted averages for CEE; CEE is
defined as Bulgaria, Croatia, Czech Republic, Hungary, Poland, Romania, Serbia, Slovakia, Slovenia and Ukraine.
Source: For GDP growth IMF (World Economic Outlook as of 2007). For all other data SwissRe Sigma Nr. 4/2007
A

12
CEE – A Long-term Growth PerspectiveMarkets need at least 20 years to catch up with the Austrian level of 2000
Source: Erste Bank Research, VVO, Sigma
Assuming that group 1 catches up within 10 years to group 2 the CAGR for this periods is >13 %
Group 1
Group 2
Assuming that group 2 catches up within 5 years to Czech Rep. the CAGR for this periods is >12 %
YearPremium income
(EUR bn)
Insurance penetration
(%)Density (EUR) GDP/Capita
(EUR)
Insurance penetration
(%)Density (EUR) GDP/Capita
(EUR)
Serbia 1.8% 61 3,2671967 0.59 2.8% 79 2,813 Romania 1.7% 75 4,504
Bulgaria 2.6% 80 3,260
Poland 3.3% 245 7,7801977 2.19 3.7% 289 7,883 Croatia 3.5% 247 7,123
Slovakia 3.4% 268 8,156Hungary 3.4% 299 8,847
1982 3.44 4.1% 454 11,140 Czech Republic 3.8% 414 10,977
2000 11.68 5.7% 1,440 25,486
Austrian Insurance market CEE Insurance markets in 2006
x 1.5 x 3.2
A
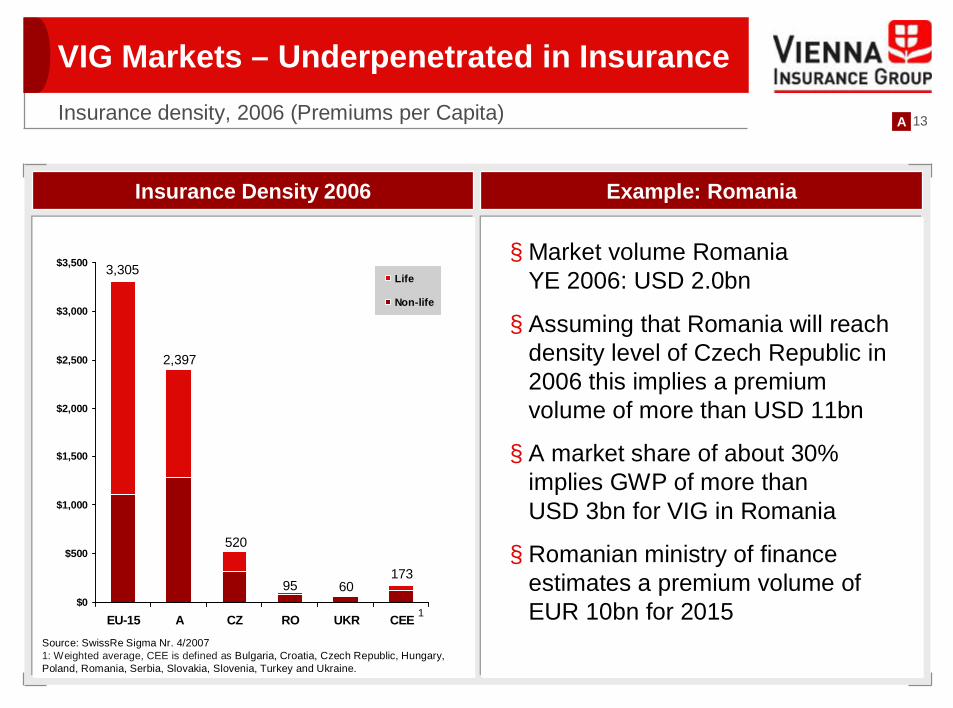
13
VIG Markets – Underpenetrated in Insurance
$0
$500
$1,000
$1,500
$2,000
$2,500
$3,000
$3,500
EU-15 A CZ RO UKR CEE
Life
Non-life
Insurance Density 2006 Example: Romania
§ Market volume Romania YE 2006: USD 2.0bn
§ Assuming that Romania will reach density level of Czech Republic in 2006 this implies a premium volume of more than USD 11bn
§ A market share of about 30% implies GWP of more than USD 3bn for VIG in Romania
§ Romanian ministry of finance estimates a premium volume of EUR 10bn for 2015
Insurance density, 2006 (Premiums per Capita)
Source: SwissRe Sigma Nr. 4/20071: Weighted average, CEE is defined as Bulgaria, Croatia, Czech Republic, Hungary, Poland, Romania, Serbia, Slovakia, Slovenia, Turkey and Ukraine.
3,305
2,397
1736095
520
1
A
14
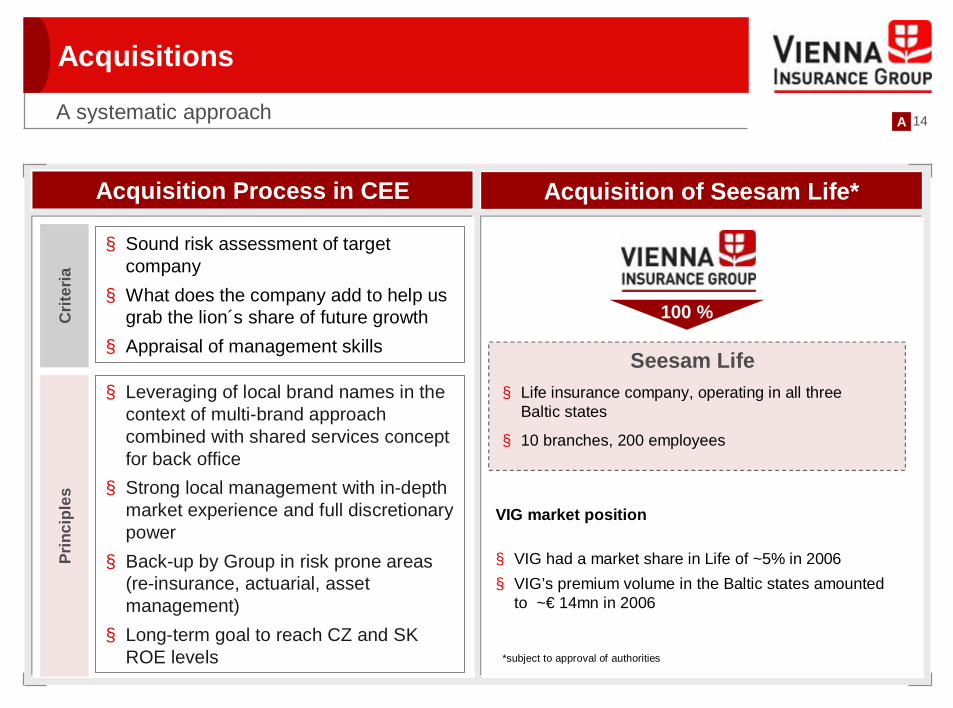
Acquisitions
A systematic approach
Acquisition Process in CEE
Crit
eria
§ Sound risk assessment of target company
§ What does the company add to help us grab the lion´s share of future growth
§ Appraisal of management skills
Prin
cipl
es
§ Leveraging of local brand names in the context of multi-brand approach combined with shared services concept for back office
§ Strong local management with in-depth market experience and full discretionary power
§ Back-up by Group in risk prone areas (re-insurance, actuarial, asset management)
§ Long-term goal to reach CZ and SK ROE levels
Acquisition of Seesam Life*
Seesam Life§ Life insurance company, operating in all three
Baltic states
§ 10 branches, 200 employees
100 %
VIG market position
§ VIG had a market share in Life of ~5% in 2006 § VIG’s premium volume in the Baltic states amounted
to ~€ 14mn in 2006
*subject to approval of authorities
A
15
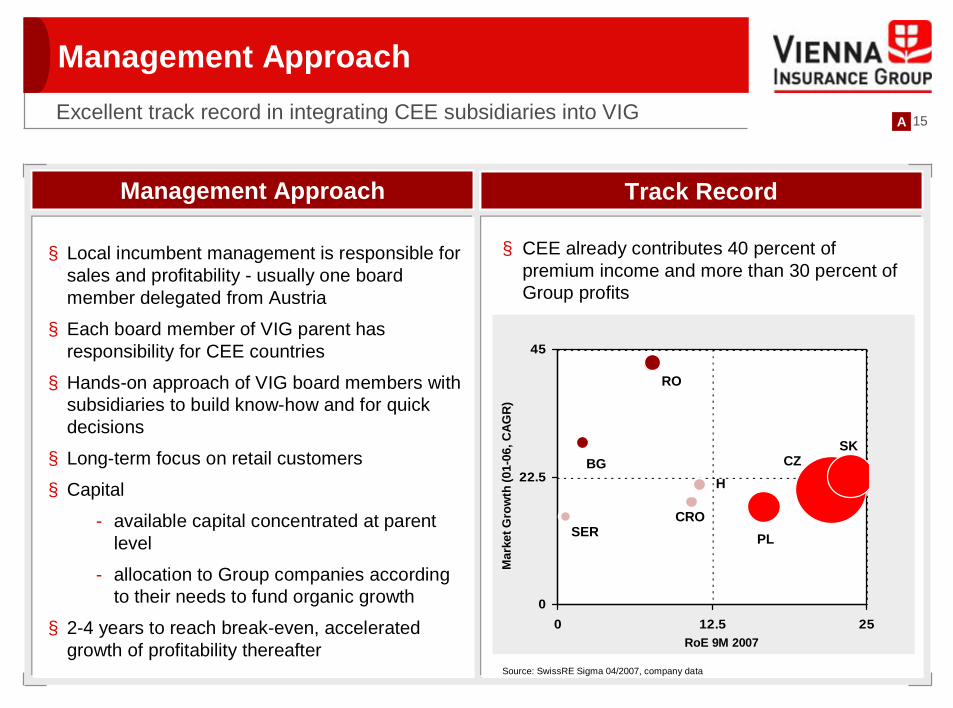
Management Approach
Management Approach
§ Local incumbent management is responsible for sales and profitability - usually one board member delegated from Austria
§ Each board member of VIG parent has responsibility for CEE countries
§ Hands-on approach of VIG board members with subsidiaries to build know-how and for quick decisions
§ Long-term focus on retail customers
§ Capital
- available capital concentrated at parent level
- allocation to Group companies according to their needs to fund organic growth
§ 2-4 years to reach break-even, accelerated growth of profitability thereafter
Excellent track record in integrating CEE subsidiaries into VIG
Track Record
0
22.5
45
0 12.5 25RoE 9M 2007
Mar
ket G
row
th (0
1-06
, CAG
R)
Track Record
§ CEE already contributes 40 percent of premium income and more than 30 percent of Group profits
CZSK
RO
PL
H
SERCRO
BG
Source: SwissRE Sigma 04/2007, company data
A

16
Profit Drivers in CEE
0
20
40
60
80
100
Austria Czech Rep. Romania
Earnings Potential Comments
Creating value from cost ratio, investment income and reinsurance
§ Decrease in cost ratio- economies of scale in less advanced markets- cost reduction programmes in advanced
markets- shared services
§ Investment income from reserves- long-term building up of reserves - long tail products gaining weight (GTPL)- going forward life business will create major
reserves
§ Reinsurance- increasing risk bearing capacity of growing
Group companies- creation of Group wide reinsurance cover
packages (e.g. NatCat)
0
20
40
60
80
100
Austria Czech Rep. Romania
Loss Ratio (%) Cost Ratio (%)
Claims reserves in % of NEP (%)
A

17
VIG – Distribution Is Key (I)Multi-brand policy to retain loyalty
§ VIG is “family name” of Group companies§ Local companies retain individual
brands as “first name”§ Strong brand awareness in local
markets§ Retain loyalty of employees and
management, customers, affinity groups and distribution networks with well established local brands§ Sales are local responsibility§ Multi-brand also strongly supports
multi-channel distribution
Multi-brand Features
Multi-brand & multi-channel differentiate VIG from most of its competitors
A

18Multi-channel strategy to get access to customers
§ Tied agents (employed sales force and/or exclusive agents) are backbone in all markets
§ Extensive use of brokers, bank cooperations, multilevel and direct distribution
§ The Group builds on existing distribution networks of acquired companies in CEE pursuing a clear bottom-up strategy
§ Building powerful distribution channels is one of the key success factors for CEE expansion
§ Distribution differs according to market conditions
Strong Multi-channel distribution Details
VIG – Distribution Is Key (II)
Brokers
Tiedagents
Direct distribution
Financial advisors Bank
distribution
A

19
VIG in Austria
Situation in Austria Details
Attractive franchise plus catch up potential in life insurance
§ Leading market position in all business lines
- #1 in property & casualty with 21% market share
- #1 in life with 23% market share- #2 in health with 21% market share
§ Overall market share gains through organic growth
20.6% 21.0%
13.3%9.4%8.4%
19.1%
23.3%
21.7%
19.0%
21.3% 21.5%
21.7% 21.9%
15.0%14.7% 14.0%
15.1%
9.3% 8.6%9.1%
7%
9%
11%
13%
15%
17%
19%
21%
23%
25%
2002 2003 2004 2005 2006
VIG
UNIQA
Generali
Allianz
Market Shares in AustriaSource: VVO
8.0
14.4
2003 - 2006
MarketVIG
Life Market Growth vs. VIG LifeSource: VVO
§ Strong growth potential in life: Austria lags behind EU-15 in premium per capita
§ Ongoing reforms of social security system to generate strong demand for life savings and pension products
§ Austrian business is very profitable and WST AG has been outperforming market in C/R for years
CAGR
A

20
Contents
A
B
C
D
E
Investment Proposition
Outlook and Summary
9M 2007 Highlights
P&L and Balance Sheet
Appendix
B

21
Recent DevelopmentsPreliminary GWP for 2007 (unconsolidated, unaudited)1
Total Group Premiums (€ bn)(unconsolidated)
3.48 4.09
2.643.08
2006 2007
LNL
17.2%
1.672.19
0.64
0.89
2006 2007
LNL
CEE Group Premiums (€ bn)(unconsolidated)
33.2%
§ Increase of 17.2% in preliminary unconsolidated premiums written to a total of EUR 7.17 billion
§ Austrian premiums amounted to EUR 3.85 billion (+7.6%). Premium volume in P&C increased by 5.2% to EUR 1.53 billion, in Life premiums rose by 10.3% to EUR 2.01 billion.
§ CEE-companies generated a premium income of EUR 3.07 billion (+33.2%). In Non-life premiums rose by 31.1% to EUR 2.19 billion. Life premiums were up by 38.6% at EUR 886.26 million. CEE share of total Group premiums amounts to 42.9%.
CEE share as % of Total Group Premiums(unconsolidated)
24.228.8
52.457.8
2006 2007
LP/C
1) direct, incl. other insurance participations (in particular Wüstenrot Versicherung)
B

22
Financial TargetsAmbitious Group targets for the period of 2007 - 2010
§ 9M results allow to expect YE 2007 PBT of about € 435mn
§ PBT target for 2008 set at ~€ 530mn
§ For the first time VIG sets PBT target for 2010 of ~€ 770mn, implying a CAGR of 21%
§ VIG expects to score ~€ 10bn in GWP by 2010
§ For the business year 2007 management will propose a dividend of € 1.1 per share, i.e. an increase of 34% as compared to the previous year
- It is company philosophy to keep the Combined Ratio well below 100% throughout the business cycles
- VIG dividend policy is defined as a payout ratio of min. 30% of Group net profit
RoE before tax
14.8% >17%
2006 2007T 2008T 2010T
321
~435
Profit before tax targets in € mn
CAGR: ~21%
CommentsVIG’s Financial Targets
~18%
~530
>20%
~770
B

23
Undertaking two years ago Position today
§ Strengthening of leading position in Austria
§ Increased market share in Austria by more than 2% pts –VIG clearly no. 1
VIG Outperforming PromisesProgress in VIG´s strategic and operative position
§ EPS boosted despite SPO§ Increase of profitability
§ Share of Other CEE markets (incl. PL & RO) has overtaken Czech Republic and Slovakia
§ Improve geographical diversification
§ Expansion of CEE business through acquisitions and organic growth
§ CEE premium volume doubled
§ Ongoing expansion
§ Among top 5 insurers in nearly all core markets, top 3 position reached in 5 core markets
- Benefit from twin growth drivers of GDP and insurance (penetration/ density)
B

24
Contents
A
B
C
D
E
Investment Proposition
Outlook and Summary
9M 2007 Highlights
P&L and Balance Sheet
Appendix
C

25
New targets set for period until 2010
9M 2007 Highlights (I)
§ CEE premium share in non-life at 55%
§ Continued organic growth in all major markets – increase of market shares
CEE business expanding at fast pace
§ PBT for 9M 07 already passed FY 06 result
§ Planned dividend increase to EUR 1.1
§ Poland and Romania new business segments due to dynamic growth
§ Total CEE business already at 42% of Group premiums
C

26
9M 2007 Highlights (II)
156
240
321
188231
324
2004 2005 2006 9M 05 9M 06 9M 07
IFRS
Profit before Tax
GWP growing faster than in first half year; C/R below 96%
4,1015,008
5,882
3,7784,321
5,032
2004 2005 2006 9M 05 9M 06 9M 07
IFRS
GWP16.5% 40.5%
97.0
94.3
96.996.2
97.0
95.9
2004 2005 2006 9M 05 9M 06 9M 07
IFRS
Combined Ratio
121
197
261
133
251
182
2004 2005 2006 9M 05 9M 06 9M 07
IFRS
Net Profit after Tax and Minorities37.5%
C

27
9M 2007 Highlights (III)Record EPS; ROE climbing fast towards 18%
1.41
2.27 2.48
1.64
2.32
3.18
2004 2005 2006 9M 05 9M 06 9M 07
IFRS
EPS (annualised)
19.521.9
14.8
23.9
14.817.6
2004 2005 2006 9M 05 9M 06 9M 07
IFRS
ROE before Tax
C

28
Contents
A
B
C
D
E
Investment Proposition
Outlook and Summary
9M 2007 Highlights
P&L and Balance Sheet
Appendix
D

29
9M 2007 Income StatementIFRS (€mn)
1 incl. income from associated and affiliated companies
1. Gross written premiums 5,031.8 4,320.6 16.52. Net earned premiums 4,220.3 3,586.8 17.7
3. Net investment income1 743.1 538.6 38.04. Other income 31.8 38.7 -17.9Total income 4,995.2 4,164.2 20.06. Expenses for claims incurred -3,567.4 -2,999.9 18.97. Operating expenses -988.9 -822.1 20.38. Other expenses -114.7 -111.5 2.9Total expenses -4,671.0 -3,933.5 18.7Profit before tax 324.2 230.7 40.5Taxes -61.5 -41.3 48.8Net profit before minorities (Profit for the period) 262.7 189.4 38.7Minorities -11.9 -7.0 70.3Net profit after minorites 250.8 182.4 37.5
9M 2007 9M 2006 +/-%
D

30
9M 2007 Balance SheetIFRS (€mn)
Intangible assets 503 461 8.9Total investments 19,212 17,260 11.3Unit- and index-linked investments 2,887 2,341 23.3Reinsurers’ share in technical provisions 1,149 963 19.3Receivables 1,161 984 18.0Deferred tax assets 32 24 35.3Other assets 252 224 12.7Cash and cash equivalents 224 226 -1.1Total assets 25,421 22,483 13.1Shareholders‘ equity 2,409 2,283 5.5 thereof minorities 128 71 81.0Subordinated liabilities 433 413 4.9Technical provisions 16,874 14,628 15.4Unit- and index-linked technical provisions 2,805 2,239 25.3Non-technical provisions 764 836 -8.5Liabilities 1,954 1,856 5.2Deferred tax liabilities 111 122 -8.6Other liabilities 70 106 -33.8Total liabilities and equity 25,421 22,483 13.1
9M 2007 2006 +/- %
D

31
§ Group GWP gained 16.5% to € 5,032mn
§ Austria: total GWP up 7.3% to reach € 2,737mn. Life up 12.5% at € 1,292mn with sound growth in subsidised pensions; includes ~€140mn premium effect from full consolidation of Austrian subsidiary Union; P&C up 3.1% at € 1,213mn influenced by weaker pricing in motor market (VIG still growing above market)
§ The Czech Republic saw GWP growing by 8.6% to € 842.3mn with Life gaining 15.7% to reach € 205.2mn and Non-life up 6.5% at € 637.1mn
§ In Slovakia business grew by 26.4% to reach € 362.8mn, with Life up 38.6% at € 136.1mn and P&C up 20.0% at € 226.7mn.
§ Poland reached € 390.7mn in total, up 68.0%, Non-life up 55.9% to € 240.2mn, Life up 91.8% to € 150.6mn
§ In Romania VIG attained a premium volume of € 301.7mn, an increase of 80.4%. Non-life was up 83.2% at € 291.0mn and Life up 27.2% at € 10.7mn
§ Substantial increase in Other CEE markets of 48.9% amounting to € 222.3mn, with high double digit organic growth
§ Other Markets attained GWP of € 175.3mn, stronger by 10.2% due to Life business in Liechtenstein
9M 2007 P&L Major Items –Gross Written Premiums
Note: the following companies were included as of Q2 06 only:Cigna (Poland) and the TBIH insurance companies (Bulstrad, Helios)
9M 06 9M 07
OtherCEEAustria
2,550.2
1,611.4
159.0175.3
2,119.8
2,736.7
9M 06 9M 07
HealthLifeP&C
225.01,681.8
2,413.8 2,793.1
2,007.6
231.1
Again growing above market in Austria and CEE (€ mn) D

32
9M 2007 P&L Major Items –Expenses for Claims IncurredLoss ratio improving vs. last year
§ Group loss ratio (net) with marked improvement by 1.6% pts to 65.4% despite €10mn net effect from Kyrill storm in Q1 2007
§ Austrian loss ratio lower by 0.5% pts at 67.8%
§ Czech Republic which was severely affected by snow pressure and floodings in 2006 saw loss ratio improving by 6.2% pts to 68.4%
§ In Slovakia loss ratio further on a very attractive level of 53.8%
EUR mn
Net Earned Premiums: 1,997.5 1,690.5
Expenses for Claims Incurred: 1,306.7 1,132.9
Ratio 65.4% 67.0%
P&C
9M 2007 9M 2006
§ Poland improving by 1.4% pts to 60.1% due to effective claims and risk management
§ Romania saw increase of claims ratio by 1.4% pts to 62.5% influenced by motor business (in line with market trends)
§ Other CEE recorded loss ratio of 66.3%.
D

33
§ Group cost ratio (net) gaining just 0.5% to reach 30.5% despite tremendous growth in CEE with acquisition cost effect: VIG does not account for DACs which affects cost ratio roughly by ~1.5% pts (premium income is high at start ofthe year and leads to higher deferrals while acquisition costs are not deferred); Group-wide containment of administrative costs
§ Austrian cost ratio down by 0.8% at 26.7% despite cost effects from IT development (Group wide standardisation)
Cost ratio stable despite dynamic business growth
9M 2007 P&L Major Items –Operating Expenses
1 incl. Other technical result (Other underwriting income and expenses)
EUR mn
Net Earned Premiums: 1,997.5 1,690.5
Operating Expenses: 609.7 507.3
Ratio 30.5% 30.0%
P&C
9M 2007 9M 2006
1
§ Costs in the Czech Republic slightly higher at 27.1% due to acquisition costs
§ Cost ratio in Slovakia down by 2.5% as a result of economies of scale
§ Poland showing stable cost ratio at 39.4% influenced by tremendous business growth
§ Romania recording decrease by 1.6% pts to 37.6% owing to economies of scale
§ Cost ratio in Other CEE at 41.2%
D

34
§ Increase in Group Net Investment Income by 38.0% to € 743.1mn
§ Austria grew by 37.2% influenced by trading gains, full consolidation of Austrian life subsidiary Union (+ € 55mn) and by deferred profit participation (- € 115mn) due to strict lower of cost or market accounting of fixed income bonds at parent company
§ Increases of net investment income in the Czech Republic (up 21.3%), Slovakia (up 39.3%), Poland (71.9%), Romania (222.8%) and Other CEE (86.6%) influenced by business expansion
§ Larger CEE subsidiaries also show higher diversification in asset allocation
9M 2007 P&L Major Items –Net Investment IncomeSound growth in line with business expansion (€mn)
YE 2006 9M 07
19,60122,099
Total Investments
9M06 9M 07
OtherCEEAUT
Net Investment Income
631.7
96.115.3
460.6
64.3
13.7
12.7%
9M 2007 9M 2006Investment Income 975.9 751.5thereof: Current Income 636.9 553.6thereof: Investment income from disposal 303.5 170.5
Expenses for investments and interest -236.5 -218.2thereof: realised investment losses -41.8 -43.5thereof: depreciation of investments -90.3 -75.6
Total 739.4 533.31
1: excluding affiliated companies
D

35
Contents
A
B
C
D
E
Investment Proposition
Outlook and Summary
9M 2007 Highlights
P&L and Balance Sheet
Appendix
E

36
9M 2007 P&L – Business Segments Property & Casualty, IFRS (€mn)
1. Gross written premiums 2,793.1 2,413.8 15.7
2. Net earned premiums 1,997.5 1,690.5 18.2
3. Net investment income 132.7 94.6 40.3
4. Other income 19.2 26.2 -26.9
Total income 2,149.4 1,811.3 18.7
6. Expenses for claims incurred -1,306.7 -1,132.9 15.3
7. Operating expenses -552.1 -452.7 22.0
8. Other expenses -81.3 -80.9 0.4
Total expenses -1,940.0 -1,666.6 16.4
Profit before tax 209.3 144.7 44.7
+/-%9M 2007 9M 2006
E

37
9M 2007 P&L – Business SegmentsLife, IFRS (€mn)
1. Gross written premiums 2,007.6 1,681.8 19.4
2. Net earned premiums 1,993.9 1,673.5 19.1
3. Net investment income 598.8 436.2 37.3
4. Other income 12.6 12.5 0.9
Total income 2,605.4 2,122.2 22.8
6. Life benefits -2,064.9 -1,677.2 23.1
7. Operating expenses -406.7 -341.3 19.2
8. Other expenses -31.4 -29.8 5.2
Total expenses -2,502.9 -2,048.3 22.2
Profit before tax 102.4 73.9 38.6
+/-%9M 2007 9M 2006
E

38
9M 2007 P&L – Business SegmentsHealth, IFRS (€mn)
1. Gross written premiums 231.1 225.0 2.7
2. Net earned premiums 228.9 222.8 2.7
3. Net investment income 11.5 7.9 46.7
4. Other income 0.0 0.0 -100.0
Total income 240.5 230.7 4.2
6. Expenses for claims incurred -195.9 -189.8 3.2
7. Operating expenses -30.1 -28.1 7.2
8. Other expenses -2.0 -0.7 181.4
Total expenses -228.0 -218.6 4.3
Profit before tax 12.5 12.1 2.6
9M 2007 9M 2006 +/-%
E

39
9M 2007 P&L - Split by Regions (I)Regional segments, IFRS (€mn)
1. Gross written premiums 2,736.7 2,550.2 7.3 842.3 775.3 8.6
2. Net earned premiums 2,375.0 2,216.2 7.2 665.4 595.0 11.8
3. Net investment income 631.7 460.6 37.2 35.7 29.4 21.3
4. Other income 7.3 5.5 32.6 8.7 12.3 -29.5
Total income 3,014.0 2,682.3 12.4 709.8 636.7 11.5
6. Expenses for claims incurred -2,331.7 -2,066.5 12.8 -462.4 -432.8 6.8
7. Operating expenses -448.6 -442.2 1.5 -159.6 -132.5 20.5
8. Other expenses -26.9 -21.9 23.0 -30.1 -32.9 -8.5
Total expenses -2,807.2 -2,530.6 10.9 -652.1 -598.2 9.0
Profit before tax 206.8 151.8 36.3 57.6 38.5 49.6
Combined Ratio 94.5% 95.8% 95.5% 101.1%
Austria Czech Republic
9M 2007 9M 2006 +/-% 9M 2007 9M 2006 +/-%
E
40
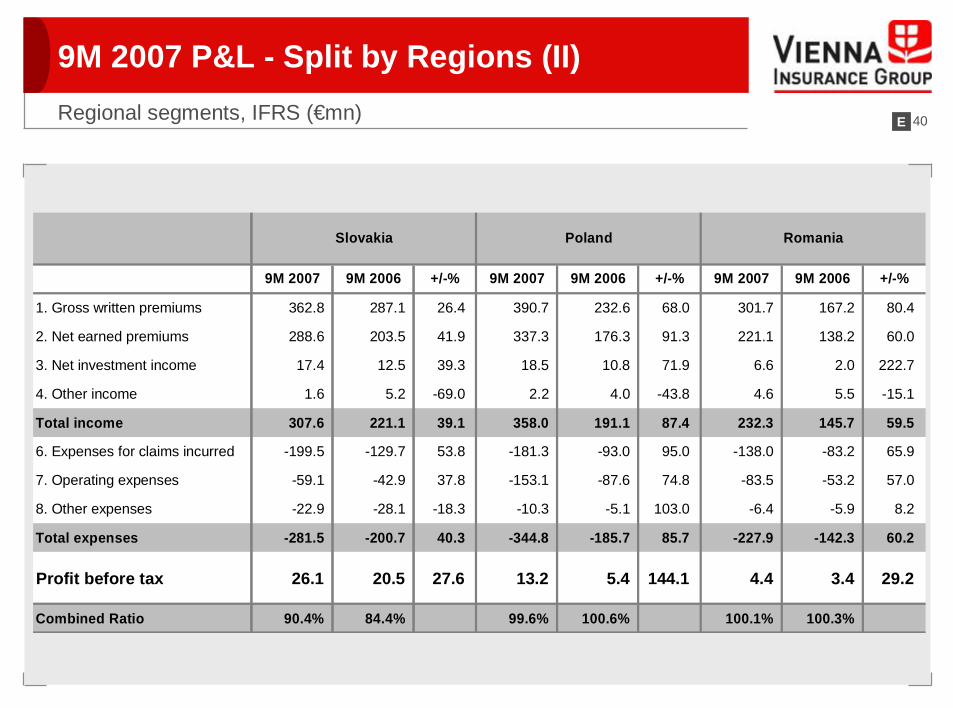
9M 2007 P&L - Split by Regions (II)Regional segments, IFRS (€mn)
1. Gross written premiums 362.8 287.1 26.4 390.7 232.6 68.0 301.7 167.2 80.4
2. Net earned premiums 288.6 203.5 41.9 337.3 176.3 91.3 221.1 138.2 60.0
3. Net investment income 17.4 12.5 39.3 18.5 10.8 71.9 6.6 2.0 222.7
4. Other income 1.6 5.2 -69.0 2.2 4.0 -43.8 4.6 5.5 -15.1
Total income 307.6 221.1 39.1 358.0 191.1 87.4 232.3 145.7 59.5
6. Expenses for claims incurred -199.5 -129.7 53.8 -181.3 -93.0 95.0 -138.0 -83.2 65.9
7. Operating expenses -59.1 -42.9 37.8 -153.1 -87.6 74.8 -83.5 -53.2 57.0
8. Other expenses -22.9 -28.1 -18.3 -10.3 -5.1 103.0 -6.4 -5.9 8.2
Total expenses -281.5 -200.7 40.3 -344.8 -185.7 85.7 -227.9 -142.3 60.2
Profit before tax 26.1 20.5 27.6 13.2 5.4 144.1 4.4 3.4 29.2
Combined Ratio 90.4% 84.4% 99.6% 100.6% 100.1% 100.3%
+/-% 9M 2007 9M 2006 +/-%
RomaniaPoland
9M 2007 9M 2006
Slovakia
9M 2007 9M 2006 +/-%
E

41
9M 2007 P&L - Split by Regions (III)Regional segments, IFRS (€mn)
1. Gross written premiums 222.3 149.3 48.9 175.3 159.0 10.2 5,031.8 4,320.6 16.5
2. Net earned premiums 178.9 118.7 50.7 154.1 139.0 10.9 4,220.3 3,586.8 17.7
3. Net investment income 17.9 9.6 86.6 15.3 13.7 11.5 743.1 538.6 38.0
4. Other income 4.1 2.8 48.0 3.2 3.5 -8.3 31.8 38.7 -17.9
Total income 200.9 131.1 53.2 172.6 156.2 10.5 4,995.2 4,164.2 20.0
6. Expenses for claims incurred -125.9 -78.9 59.6 -128.6 -115.8 11.1 -3,567.4 -2,999.9 18.9
7. Operating expenses -64.9 -44.9 44.6 -20.1 -19.0 6.0 -988.9 -822.1 20.3
8. Other expenses -5.2 -5.4 -2.9 -12.8 -12.3 4.5 -114.7 -111.5 2.9
Total expenses -196.0 -129.1 51.8 -161.5 -147.1 9.9 -4,671.0 -3,933.5 18.7
Profit before tax 5.0 2.0 146.1 11.1 9.1 21.4 324.2 230.7 40.5
Combined Ratio 107.6% 101.2% 86.2% 86.4% 95.9% 97.0%
Other CEE
9M 2007 9M 2006 +/-% 9M 2007 9M 2006
Other
+/-% +/-%
TOTAL
9M 2007 9M 2006
E

42
9M 2007 Results by CountryIFRS (€mn)
9M 2007 9M 2006 9M 2007 9M 2006 9M 2007 9M 2006 9M 2007 9M 2006 9M 2007 9M 2006
Austria 1,444.5 1,401.5 1,292.3 1,148.6 2,736.7 2,550.2 206.8 151.8 94.5% 95.8%
Czech Rep. 637.1 597.9 205.2 177.4 842.3 775.3 57.6 38.5 95.5% 101.1%
Slovakia 226.7 188.9 136.1 98.1 362.8 287.1 26.1 20.5 90.4% 84.4%
Poland 240.2 154.1 150.6 78.5 390.7 232.6 13.2 5.4 99.6% 100.6%
Romania 291.0 158.8 10.7 8.4 301.7 167.2 4.4 3.4 100.1% 100.3%
Other CEE 135.3 90.8 87.0 58.5 222.3 149.3 5.0 2.0 107.6% 101.2%Hungary 31.1 24.4 39.6 24.7 70.7 49.1 2.6 1.1 101.6% 92.9%Croatia 33.3 26.4 28.3 23.1 61.6 49.5 2.1 0.4 112.1% 111.7%Serbia 19.2 12.2 13.7 7.7 32.9 19.9 0.0 0.0 110.8% 86.8%Bulgaria 51.7 27.8 5.4 3.1 57.1 30.8 0.2 0.5 106.8% 101.5%
Other 49.4 46.7 125.9 112.3 175.3 159.0 11.1 9.1 86.2% 86.4%Liechtenstein - - 86.5 74.2 86.5 74.2 2.0 0.9 - -Germany 49.4 46.7 39.3 38.2 88.7 84.9 9.1 8.2 86.2% 86.4%
Total 3,024.2 2,638.8 2,007.6 1,681.8 5,031.8 4,320.6 324.2 230.7 95.9% 97.0%
Combined RatioNon-Life Life Total Profit before Tax
E

43
Change in Group Shareholders‘ Equity / APE
APE Life & Health
Austria, Germany 166.0 176.7 -6.1%
CEE (CZ, SK) 37.9 26.4 43.6%
203.9 203.1 0.4%
+/-%9M 2007 9M 2006
IFRS
Equity as of 1 January 2,283,208 2,059,332
Currency Changes 1,302 2,066
Changes to consolidation 55,719 2,113
Capital Increase - -
Unrealised Gains and Losses on financial instruments available for sale -90,081 -56,687
Profit for the period 262,724 189,389
Dividend payment -104,143 -63,585
Equity as of 30 September 2,408,729 2,132,628
1.1. - 30.09.2007 1.1. - 30.09.2006
E

44
Life Insurance Premium SplitIFRS (€mn)
Premiums written - direct business 9M 2007 9M 2006 +/- %
Regular premiums 1,343.8 1,075.5 24.9%Single premiums 662.3 594.9 11.3%
Total premiums written - direct business 2,006.1 1,670.3 20.1%
thereof:
Policies with profit participation 1,134.7 1,096.5 3.5%Policies without profit participation 269.6 219.8 22.6%unit- and index-linked life insurance 601.8 354.0 70.0%
thereof:
Individual insurance 1,774.2 1,507.0 17.7%Group insurance 231.9 163.3 42.0%
E

45
Q3 2007 Income StatementIFRS (€mn)
1 incl. income from associated and affiliated companies
1. Gross written premiums 1,538.7 1,291.3 19.22. Net earned premiums 1,391.2 1,175.5 18.4
3. Net investment income1 189.9 177.5 6.94. Other income 11.1 9.7 14.8Total income 1,592.2 1,362.7 16.86. Expenses for claims incurred -1,146.8 -954.5 20.17. Operating expenses -311.5 -295.7 5.38. Other expenses -25.1 -25.1 0.0Total expenses -1,483.4 -1,275.4 16.3Profit before tax 108.8 87.4 24.5Taxes -20.3 -16.8 20.9Net profit before minorities (Profit for the year) 88.5 70.6 25.4Minorities 1.7 -2.3Net profit after minorites 90.2 68.3 32.0
Q3 2007 Q3 2006 +/-%
E

46
9M 2007 Exchange Rates
9M 20069M 2007
0.0116890.0121950.0125030.012681CSDSerbia
0.5113000.511300 0.5113000.511300BGNBulgaria Croatia
P & LEUR
0.0037650.0351630.026552
0.2823930.2556490.6384301.460814
0.0036630.0353030.026749
0.2827890.2518070.6296831.475579
Balance SheetEUR
0.003989 0.0363210.029519
0.2990340.2650410.6023730.137414
Balance SheetEUR
0.610855CHFLiechtenstein0.261391PLNPoland0.303284RONRomania
0.029505SKKSlovakia0.035612CZKCzech Republic
HUF
HRK
Curr.
0.003986
0.136226
P & LEUR
Hungary
Country
E
47
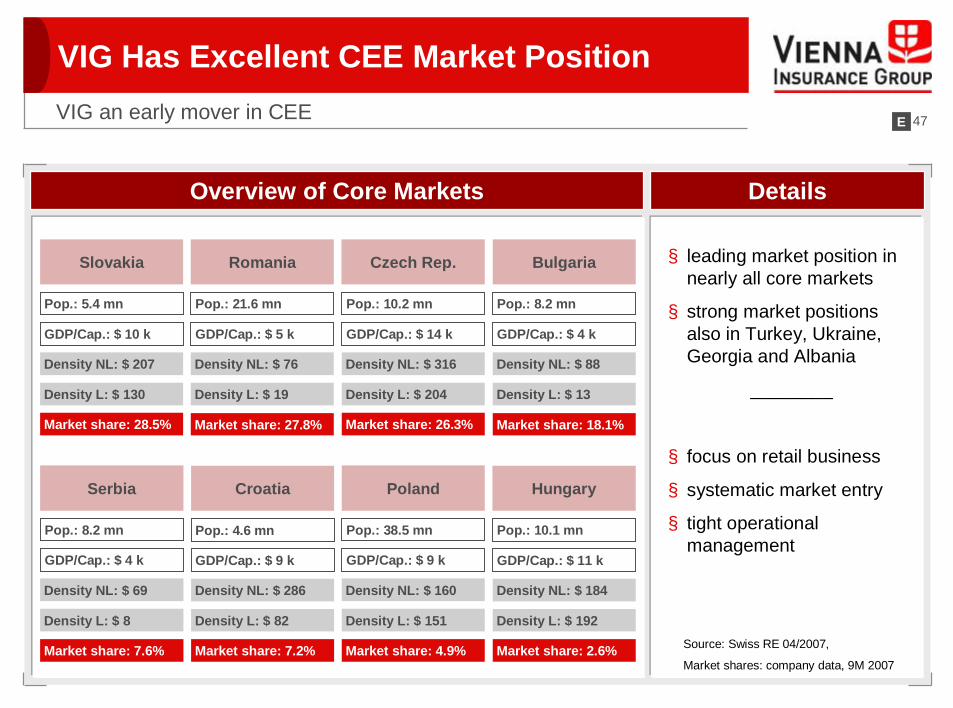
VIG Has Excellent CEE Market PositionVIG an early mover in CEE
Croatia
Pop.: 4.6 mn
GDP/Cap.: $ 9 k
Density NL: $ 286
Density L: $ 82
Market share: 7.2%
Czech Rep.
Pop.: 10.2 mn
GDP/Cap.: $ 14 k
Density NL: $ 316
Density L: $ 204
Market share: 26.3%
Slovakia
Pop.: 5.4 mn
GDP/Cap.: $ 10 k
Density NL: $ 207
Density L: $ 130
Market share: 28.5%
Hungary
Pop.: 10.1 mn
GDP/Cap.: $ 11 k
Density NL: $ 184
Density L: $ 192
Market share: 2.6%
Poland
Pop.: 38.5 mn
GDP/Cap.: $ 9 k
Density NL: $ 160
Density L: $ 151
Market share: 4.9%
Romania
Pop.: 21.6 mn
GDP/Cap.: $ 5 k
Density NL: $ 76
Density L: $ 19
Market share: 27.8%
Serbia
Pop.: 8.2 mn
GDP/Cap.: $ 4 k
Density NL: $ 69
Density L: $ 8
Market share: 7.6%
Bulgaria
Pop.: 8.2 mn
GDP/Cap.: $ 4 k
Density NL: $ 88
Density L: $ 13
Market share: 18.1%
§ leading market position in nearly all core markets
§ strong market positions also in Turkey, Ukraine, Georgia and Albania
________
§ focus on retail business
§ systematic market entry
§ tight operational management
Source: Swiss RE 04/2007,
Market shares: company data, 9M 2007
Overview of Core Markets Details
E

48
Acquisition of Asirom in 3 StepsStrengthening VIG´s no.1 position in dynamic Romanian market
Asirom§ listed Non-life and Life insurance company with
€ 190mn premium volume in 2006
§ 160 branches, 2,200 employees and nation-wide non-bank distribution system
§ well positioned also in Life
§ best insurance brand in Romania
98.5 %
42.8%Market Growth (01-06, CAGR)
5,463 USDGDP/Capita
21.6Population (mn)
94.5 USD
1.7%
§ market growth in Non-life was 40.7% YoY vs. Life growth by 15.4% YoY in 2006
§ Top-five insurance groups have a total market share of nearly 60%
§ VIG has a market share of ~28% incl. Asirom
Density
Penetration
Source: SwissRe 04/2007
Romanian Insurance MarketAcquisition of Asirom
Acquisition steps:1. Acquisition of 30% of Asirom on July 24, 20072. Increase by 20.2% on November 7, 2007 to reach
majority3. Minority buyout of 48.3% in December 2007
total holding of 98.5%
E

49
Shareholder Structure (I)
~70 %Wiener Städtische
Wechselseitige Versicherungsanstalt-Vermögensverwaltung
Total number of shares 105,000,000
~ 30 %Free Float
Shareholder Structure
E

50
32.0 % Austria
25.5% North America
0.3%Others
Free Float Geographical Split
20.9% Continental Europe
21.3%UK & Ireland
Shareholder Structure (II)
E

51
Contact Details
Wiener Städtische Versicherung AGVienna Insurance GroupSchottenring 30, 1010 Vienna, Austriawww.wienerstaedtische.comVienna Stock Exchange: WSTReuters: WISV.VIBloomberg: WST AVDatastream: O:WNST
§ Thomas SchmeeTel. +43 (0)50 350 – 21900 [email protected]
§ Nina HigatzbergerTel. +43 (0)50 350 - 21920 [email protected]
§ Nicolas MucherlTel. +43 (0)50 350 – 21930 [email protected]
§ Sabine Pulz (Assistant)Tel. +43 (0)50 350 - 21919 [email protected]
Fax +43 (0)50 350 99 - 23303 [email protected]
Investor Relations E

52
Disclaimer
IMPORTANT NOTICE
These materials do not constitute or form part, or all, of any offer or invitation to sell or issue, or any solicitation of any offer to purchase or subscribe for, any securities in any jurisdiction in which such solicitation, offer or sale would be unlawful, nor shall part, or all, of these materials form the basis of, or be relied on in connection with, any contract or investment decision in relation to any securities.
These materials contain forward-looking statements based on the currently held beliefs and assumptions of the management of WIENER STÄDTISCHE Versicherung AG Vienna Insurance Group (“VIG”), which are expressed in good faith and, in their opinion, reasonable. These statements may be identified by words such as “expectation” or “target” and similar expressions, or by their context. Forward-looking statements involve known and unknown risks, uncertainties and other factors, which may cause the actual results, financial condition, performance, or achievements of VIG, or results of the insurance industry generally, to differ materially from the results, financial condition, performance or achievements express or implied by such forward-looking statements. Given these risks, uncertainties and other factors, recipients of this document are cautioned not to place undue reliance on these forward-looking statements. VIG disclaims any obligation to update these forward-looking statements to reflect future events or developments.
E