expanding early childhood care and education: how much does it cost?
DESCRIPTION
Lack of transparency regarding the costs of Early Childhood Care and Education contributes to reluctance on the part of developing country governments and donors to invest in developing strong national policies. Building on a paper commissioned by UNESCO, this Working Paper presents a model - applied here to the Arab States - for estimating the costs of making early childhood services available to the most vulnerable and disadvantaged children. The Excel document referenced in the text is available at bernardvanleer.org/files/WP46_ECCE_Costing.xlsTRANSCRIPT
46Expanding early childhood care and education: How much does it cost?
By Jan van Ravens and Carlos Aggio
working papers in
Early Childhood Development

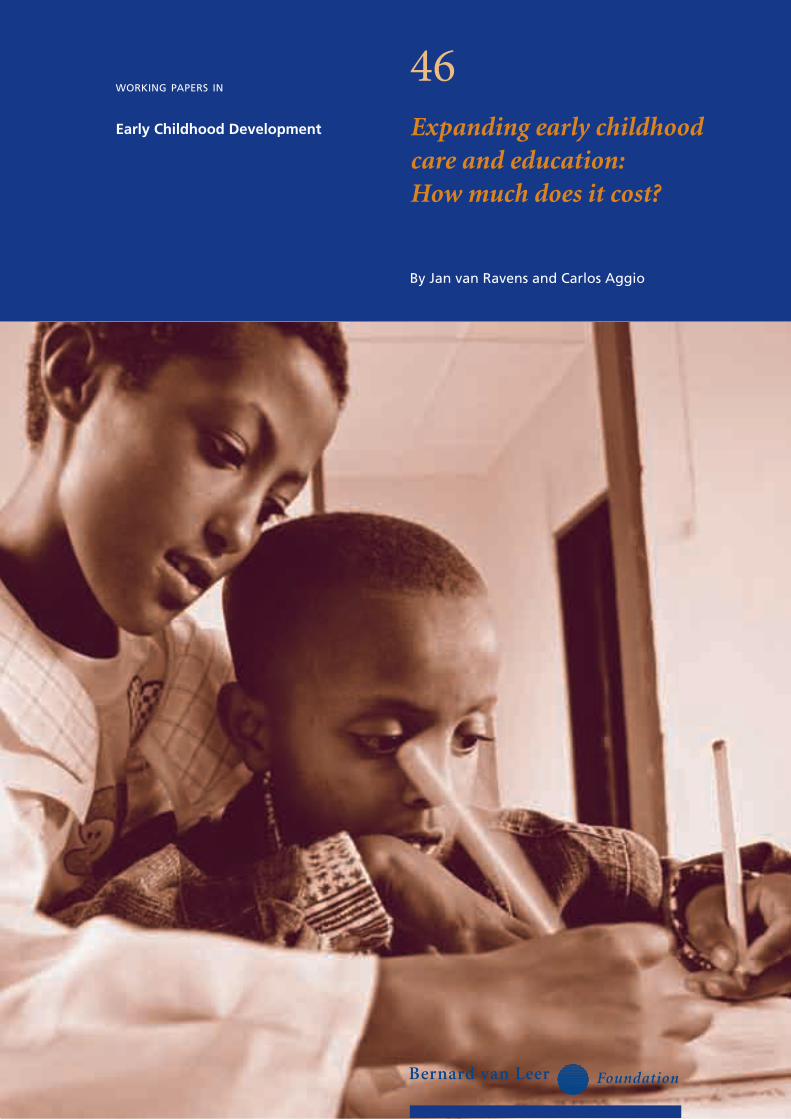
Cover: In a classroom in Egypt, a girl helps a young child to write. Photo: Elena Rue
Design: Valetti, vormgeving en communicatie, The Hague, The Netherlands
Editing and proofreading: Green Ink (www.greenink.co.uk)

46
Expanding early childhood care and education: How much does it cost?
A proposal for a methodology to
estimate the costs of early childhood
care and education at macro-level,
applied to the Arab States
By Jan van Ravens and Carlos Aggio
March 2008
working papers in
Early Childhood Development
Copyright © 2008 by the Bernard van Leer Foundation, The Netherlands. The Bernard van Leer Foundation encourages
fair use of this material. Proper citation is requested. This publication may not be resold for profit.
About the authors
Jan van Ravens is a senior policymaker in the areas of education and training, with a special interest in non-formal
learning, including early childhood development and adult education. He is presently working as a consultant based in
Rotterdam (the Netherlands), while operating internationally. Formerly he was a senior policy analyst in the Education for
All Monitoring Team (2002–2005) and Head of International Affairs in the Netherlands Ministry of Education (1997–2002).
Carlos Aggio is a development economist working as a consultant based in Buenos Aires (Argentina). His main current
research interests in the field of education are the monitoring of international education goals, their associated financial
costs and the international financial aid required. Formerly, he was a member of the UNESCO Education for All Global
Monitoring Team (2002–2004).
Citation
Van Ravens, J. and Aggio, C. (2008) Expanding early childhood care and education: How much does it cost? A proposal for
a methodology to estimate the costs of early childhood care and education at macro-level, applied to the Arab States.
Working Paper No. 46. The Hague, The Netherlands: Bernard van Leer Foundation.
ISSN 1383-7907
ISBN 978-90-6195-101-8
Contents
Preface
Acronyms and abbreviations
Summary and main findings
Chapter 1: Introduction
Chapter 2: Methodological issues and the principle of interactivity
Chapter 3: Making the case for expanding ECCE in the Arab States
Chapter 4: Modalities of ECCE
Chapter 5: Estimating P: The unit costs
Chapter 6: Estimating Q: The numbers of children to be served
Chapter 7: Presentation and discussion of the outcomes
Chapter 8: Funding issues
References
Annex I. Users’ guide for working with the cost estimation model
Annex II. Interpretation of the cost estimates. The case of Yemen
v
vii
ix
1
5
9
13
19
33
53
59
65
69
71

Dakar’s ‘Education for All’ Goal One:
“Expanding and improving comprehensive early childhood care and education, especially for the most
vulnerable and disadvantaged children”
v
While the critical importance of early childhood
care and education (ECCE) is undisputed, few
developing countries are presently pursuing
strong national policies to expand it. Thus,
Goal One of the Education for All (EFA) agenda
–“Expanding and improving comprehensive
early childhood care and education, especially
for the most vulnerable and disadvantaged
children”– is at risk of becoming a neglected
area, even though it has the potential to
contribute strongly to the achievement of other
EFA goals. Many ECCE projects and programs
exist throughout the developing world, and our
knowledge about good practice and effective
approaches is ever increasing, but the next step
– translating this knowledge into action at
national policy level – is a difficult one. A lack
of transparency regarding the costs of national
policies to expand ECCE seems to cause
reluctance among governments and donors to
invest in ECCE more substantially.
It is against this background that this
publication has been written. It builds on a
paper commissioned by the office of the United
Nations Educational, Scientific and Cultural
Organization (UNESCO) in Cairo in early 2006.
Using the Arab States as their domain, the authors
developed a model to estimate the costs of making
early childhood services available to the most
vulnerable and disadvantaged children. Inevitably,
these estimations must rest on assumptions –
translated into quantitative “parameters”– which
are debatable. For this reason, readers of this
publication are able to alter these parameters
in the spreadsheet files on the CD-ROM that is
included on the inside back cover, making this
costing exercise an interactive process.
The original draft of this paper was discussed
and commented on intensively, first by staff of
the Bernard van Leer Foundation, and then by
Wendy Janssens of the University of Amsterdam.
The authors are very grateful for these
comments as they enabled them to improve the
text substantially. The authors also express their
gratitude for the use of data of the UNESCO
Institute of Statistics, which is responsible
for the collection and dissemination of
internationally comparable data in the UNESCO
domains of education, science, culture and
communication. It is hoped that this publication
will spark the debate on national ECCE policy;
that the model described will be developed
further; and that it may eventually contribute to
concrete advancement at country level.
Preface

vii
Acronyms and abbreviations
ADEA Association for the Development of Education in Africa
AGFUND Arab Gulf Programme for United Nations Development Organizations
CSR corporate social responsibility
DAC Development Assistance Committee (of the OECD)
ECCE early childhood care and education
ECD early childhood development
EFA Education for All
GDP Gross Domestic Product
GER Gross Enrolment Ratio
GMR Education for All Global Monitoring Report
GNI Gross National Income
GNP Gross National Product
GPI Gender Parity Index
HDI Human Development Index
ISCED International Standard Classification of Education
MDG Millennium Development Goal
NER Net Enrolment Ratio
NGO nongovernmental organisation
ODA official development assistance
OECD Organisation for Economic Cooperation and Development
OIC Organization of Islamic Conferences
OPEC Organization of the Petroleum Exporting Countries
pc per capita (in relation to GDP or GNP)
RPD regular program delivery
TFR Total Fertility Rate
UIS UNESCO Institute for Statistics
UNDP United Nations Development Programme
UNESCO United Nations Educational, Scientific and Cultural Organization
UNICEF United Nations Children’s Fund
UPE universal primary education


ix
The beneficial impact of early childhood care
and education (ECCE) on efficiency in primary
education and, more broadly, on several of
the Millenium Development Goals (MDGs) is
undisputed. Yet, ECCE enrolment in developing
countries is generally low and predominantly
private. The same applies for the Arab States, the
region that we selected for this costing exercise.
High levels of grade repetition and drop out in
some of the countries studied call for urgent
expansion of ECCE.
While Education for All (EFA) Goal One sets
no numerical target, its text is very clear about
the required focus of governments’ policies:
“Expanding and improving comprehensive early
childhood care and education, especially for the
most vulnerable and disadvantaged children”
[emphasis added by the authors]. This focus on
excluded groups makes it possible to develop
an expansion scenario: assuming that present
enrolment concerns mainly the more privileged
children and will expand autonomously and
driven by the market, children at the other end of
the socio-economic spectrum must be addressed
by targeted government policies. Beginning with
undernourished children, and then reaching
out for the children of illiterate parents as the
second step, one could envisage that one day the
two movements – market and policy driven –
will meet so that universal enrolment becomes
a reality. Concrete enrolment targets have been
developed in this report for 2010 and 2015.
Establishing unit costs – the average cost per
child per year – is a balancing act between
the necessity of ensuring a minimum level of
quality and the need to reach as many children
as possible on a given budget. This report
distinguishes two main modalities of ECCE
provision:
regular programme delivery, for the ‘older’
children in the early childhood age group;
home visiting (understood here as providing
expert support to groups of parents), mainly
during the earliest ages.
For both modalities, normative models
have been developed. These are based on
assumptions and choices that the authors have
made after consultation with experts and a
literature review. However, these normative
models can be altered by the reader if he or she
disagrees with the choices of the authors. Thus,
this report is not meant as a final statement but
as the start of a dialogue.
Focusing on the poorer countries in the
region on the grounds that the case for foreign
assistance is strongest there, we found that the
costs of achieving Goal One in the Arab States
may be in the order of magnitude of US$ 750
million annually until 2015. But this figure must
be treated with utmost caution, since it excludes
a number of countries for lack of data and it
relies on a series of assumptions and choices
made by the authors.
Summary and main findings
.
.
x
While this financial challenge seems immense,
its affordability should be evaluated based on
the following two considerations. The first is
to assess ECCE returns on investments. Lower
drop-out and grade repetition rates in primary
education alone will pay back an important
share (one estimate is 87%) of the costs of ECCE,
while the societal and economic returns beyond
the realm of education may be even larger
than that. The second element is that countries
and donors be prepared to rethink and alter
the distribution of financial resources over the
various sectors and levels of the education
system, in light of the principles of equity
and social justice. The early years are critical
for chances later in life, so the case for public
investment in ECCE seems stronger than it is for
the last stages of education, that many children
never reach but receive a relatively large share of
countries’ and donors’ budgets.

1
Goal One adopted by the Education for All
World Education Forum in Dakar, Senegal, in
April 2000, is as follows:
“Expanding and improving comprehensive early
childhood care and education, especially for the
most vulnerable and disadvantaged children”
Education for All: Meeting our Collective
Commitments (World Education Forum, 2000)
Rationale
The beneficial impact of early childhood
care and education (ECCE) on several of the
Millennium Development Goals (MDGs) is
undisputed. Investments in ECCE pay for
themselves by improving children’s performance
later on in education, and in terms of a number
of more broad social outcomes such as a good
health, a stable family life, higher chances of
employment, lower crime rates, and so on. Yet,
the majority by far of public investment in basic
education is committed to primary education.
The same can be said about the international aid
community which allocates most of its funding
for basic education to primary education.
Only a fraction of the international aid bill is
dedicated to ECCE. More clarity about the cost
implications of meeting Education for All (EFA)
Goal One seems a critical condition for raising
the interest of developing countries and the
international community in ECCE.
It is for this reason that we have developed a
methodology for estimating the costs of EFA
Goal One at macro-level. In need of a region
to apply and test this methodology we selected
the Arab States1, for two main reasons. First,
the Arab States is the region with the largest
disparities between countries in terms of per
capita income. Some of the richest and some
of the poorest countries in the world are found
here. Second, expansion of ECCE is urgently
needed in the Arab States. In 2004, only 15.7%
of the total number of eligible children in this
region had access to pre-primary education,
which is the lowest regional average after that
of sub-Saharan Africa, where the figure stood at
12.4% (UNESCO Institute for Statistics, 2006).
Presently there is a high level of interest in
ECCE in the Arab world. When the Minister
of Education of Egypt hosted the Ministerial
Review Meeting of the E-9 (the nine most
populous developing countries) in 2003, ECCE
was the main theme of this meeting (UNESCO,
2004a). The UN Convention for the Rights
Chapter 1: Introduction
1 This study uses the UNESCO Global Monitoring Report (GMR) classification for the Arab States, which includes the following
countries: Algeria, Bahrain, Djibouti, Egypt, Iraq, Jordan, Kuwait, Lebanon, Libyan Arab Jamahiriya, Mauritania, Morocco,
Occupied Palestinian Territory, Oman, Qatar, Saudi Arabia, Sudan, Syrian Arab Republic, Tunisia, United Arab Emirates and
Yemen. The United Nations Children’s Fund (UNICEF) uses the same grouping of countries but names it Middle East and
North Africa (MENA). This name is also applied by the World Bank, but in their case it includes only 15 of the 20 countries,
since it excludes the high income countries of the region.

of the Child has been embraced by all Arab
States, and by all but one of the members of the
Organization of the Islamic Conference (Arab
Resource Collective, 1994; OIC, UNICEF, ISESCO,
2005). Sterling efforts to expand and improve
ECCE are made by organizations such as
AGFUND (the Arab Gulf Programme for United
Nations Development Organizations) as well
as individual countries. To mention just three:
Egypt (World Bank, 2005) and Jordan (National
Team for Early Childhood Development, 2000)
have developed ambitious plans for their ECCE
sectors, while Sudan aims at a 35% increase of
enrolment by 2007 and a 75% increase by 2015,
both compared to the situation in 2002 (Basheer,
2005).
Methodology
To estimate the costs of achieving a global or
regional objective is extremely challenging, and
it must be addressed with humility, flexibility
and from a point of view of learning as
Vandemoortele and Roy (2004) have formulated
it in a paper on costing the MDGs. Readers
will find in this report that the answer to the
question ‘How much does Goal One cost?’ is
very sensitive to assumptions that are made.
Therefore we aim to be very clear on how
exactly we arrived at those assumptions. If the
reader disagrees with our assumptions, he or
she can actually alter them. Our calculations are
entered in an Excel spreadsheet on the CD-ROM
that is included on the inside back cover of
this Working Paper and can be accessed on the
Bernard van Leer Foundation website (www.
bernardvanleer.org). Our assumptions are given
as ‘parameters’ within the spreadsheet and
these can easily be altered by the reader, which
will immediately change the outcomes of the
calculations, and hence the cost estimations.
Annex I of this publication provides some
instructions on how to use the spreadsheet.
Chapter 2 briefly addresses the methodology
used in this paper, but methodology will also be
a recurrent theme throughout this publication,
precisely because of its strong influence on
outcomes.
Age group
The official age range covered by the term
early childhood is “the period below the age of
8 years” (UN Committee on the Rights of the
Child, 2006). As primary school usually starts
at the age of 6, there is an overlap of two years
between early childhood and formal primary
education; these two years are often seen as
critical for successful attendance of school.
Among many other institutions, the Bernard
van Leer Foundation has adopted the definition
used by the UN Committee on the Rights of the
Child as the basis for their work.
While the arguments for this choice are very
strong, there are pragmatic reasons for this
study to deviate from the UN Convention and
to focus on children up to 6 years of age. As
said, the age of 6 is usually the demarcation
between pre-primary and primary education
that ministries of education apply. Likewise,
national and international statistics are based
on this distinction, following the so-called
2

3
ISCED classification (International Standard
Classification of Education) which is also
adopted at UN-level. Within the 0–5 age range,
this study follows the distinction that is often
made between the 0–2 age range and the 3–5
age range2. This distinction appears for instance
where different types of programs or services
are being discussed.
Countries affected by conflict
As we all know, some of the countries in the
Arab region are affected by conflict. This has
severe implications for the people in these
countries, for young children in particular, and
also for the educational infrastructure. Where
children need ECCE-services more than ever,
they are often deprived from them. We must
make clear at the outset that it is not possible in
this report to do full justice to the very special
needs of the children in the affected areas. This
would require in-depth situation analysis, and
this would have to take place in situ since flows
of data and information are often disrupted.
Contextual diversity
Any analysis of ECCE in the Arab States must
recognise the diversity of context that exists
across the 20 countries in the region. In 2003,
the regional population was about 272 million
people. Almost 80% of these people live in
six countries (Algeria, Egypt, Morocco, Saudi
Arabia, Sudan and Yemen). In contrast, there
are three states where the population is below
1 million (Bahrain, Djibouti and Qatar). In the
region as a whole, 46% of the population lives in
rural areas. But in seven countries, mainly the
high income oil producing countries, the urban
population is larger than 85% (Bahrain, Kuwait,
Lebanon, Libyan Arab Jamahiriya, Qatar, Saudi
Arabia and the United Arab Emirates). At the
other extreme, in Sudan and Yemen more
than 60% of the population lives in rural areas.
Chapter 6 provides more information on the
countries. Clearly, achieving EFA Goal One
is particularly challenging in those countries
where access to ECCE services is presently very
limited to begin with, where per capita gross
domestic product (GDP) is low, and where the
expansion of primary education claims most
of the scarce resources. Inequalities within and
between the countries will receive attention
throughout the report, and especially in Chapter
8 on funding issues.
The structure of this report
Chapter 2 addresses methodological issues.
Chapter 3 then makes the case for expanding
ECCE in the Arab States by first reviewing
briefly the evidence on the benefits of ECCE
and then assessing present enrolment levels
of ECCE in the region. Chapter 4 discusses
the many ‘modalities’ in which ECCE is being
delivered and it makes choices regarding how
Introduction
2 Children in the 0–2 age range are all those who are in the first, the second and the third years of their lives, i.e. those who are
zero, one or two years old. The same logic is applied throughout this report to the 3–5 and 0–5 age ranges.

4
this complexity can be reduced. This paves the
way for determining the unit cost in Chapter 5.
The following chapter (Chapter 6) addresses the
numbers of children to be served, focussing on
how to prioritise vulnerable and disadvantaged
children, as the text of EFA Goal One requires.
Chapter 7 then presents the outcomes of
the cost estimation exercise using the afore-
mentioned spreadsheet, setting the stage for
Chapter 8 which asks how funding can be found
for the estimated costs. The last chapter draws
conclusions and makes recommendations.

5
In essence, the estimation of costs is simple.
It is the multiplication of two basic economic
parameters: the price (P) and the quantity (Q).
In practice, however, this exercise can become
very complex.
The ‘P’ in our case is the cost per child enrolled
or unit cost. This is what it costs to give one
child a set of early childhood development
services. It is immediately clear that very
different opinions can exist as to what this
package of services must include, ideally or
minimally, and for how many hours, days, weeks
and years it must be provided. Quite such a high
degree of ambiguity does not exist for primary
education3, while even for the more diverse
domain of adult literacy some relatively well
accepted parameters exist that can be used as
reference points4.
Similar things can be said about the ‘Q’. The
Dakar Framework of Action is precise about
the number children that must go to primary
school in 2015: all of them. It is equally precise
about the required development of literacy
rates: they must improve by 50%. Such precision
has not been given to EFA Goal One, and this
is probably wise. A numerical target may create
a certain rush to achieve it, which may result
in the strategy of the ‘lowest hanging fruit’,
prioritizing those children who are easiest to
reach above those most in need. Indeed, the text
of EFA Goal One urges us to prioritise the most
vulnerable and disadvantaged children.
Keeping in mind the three principles of
humility, flexibility and learning that
Vandemoortele and Roy (2004) have put forward
in relation to MDG costing, we have decided
to adopt a fourth principle that characterises
our methodology: interactivity. Wherever in
the text we have to make a choice that affects
the P or the Q, we not only attempt to be as
transparent as possible regarding the arguments
for that choice, but we also make it possible
in most cases for the reader to actually alter
the parameters in the spreadsheet, if he or
she disagrees with that choice. The following
example which affects P may clarify this.
The group size in ECCE is an important
parameter underlying the cost estimations.
Based on the literature we have assumed a
group size of 20 children for the 3–5 age group.
3 There is, for instance, a fair amount of agreement that primary education should entail at least six years and roughly 1000
hours per year of quality teaching.
4 In the area of adult literacy the objective is relatively clear: the learner must eventually achieve literacy skills at a predefined
level of mastery. There is some degree of consensus that this requires 400 hours of learning, although it is not difficult to find
experts who may disagree with this figure. In the area of ECCE, however, such reference points hardly exist. No unambiguous
indications come forward from the literature as to the number of hours per week, the number of weeks per year or the number
of years that would suffice for a child to be healthy and prepared for school.
Chapter 2: Methodological issues and the principle of interactivity

6
Clearly it would be better to have groups of,
say, 10 children, so that much more attention
can be given to each individual child. In fact,
for children with special needs, small groups
are crucial. But, generally speaking, on a given
and limited budget, a group size of 10 would
mean that we can reach only half of the children
that we could reach if the group size were 20.
And budgets are very likely to be limited, as
Chapter 8 will show. So our assumed group
size of 20 is a compromise between a normative
approach based on professional standards
and an assessment of what is financially and
politically realistic. This stance is partly inspired
by Myers, who warns about the “possible
danger that the excellent becomes the enemy
of the good” (Myers, 2006; see also Myers 2004).
Interestingly, Jaramillo and Tietjen (2001) found
that the least expensive pre-schools in Guinea
performed better that the more expensive ones,
underscoring the importance of contextual
factors.
However, some readers of this report may
disagree with us on this point. They may argue,
for instance, that a firm statement must be
made about the requirements that a good ECCE
program must meet and what this would cost,
without making political compromises at the
outset. Since we wish to respect this and other
positions, the reader is able to change the group
size of 20 into any other value – either smaller
or larger than 20 – that better reflects, in his or
her view, the situation in a particular district,
country or the region as a whole. As explained,
by a relatively simple action, the reader can
manipulate the parameters and this will
automatically affect the overall outcomes of this
costing study.
Thus, Chapters 4 and 5 of this report generate
a general and provisional model for the unit
costs of ECCE, which is based on a number of
parameters for which initial choices have been
made by the authors. One could envisage that
debate about and alterations of the parameters
would eventually lead to a certain degree of
consensus around an adjusted general model5.
Regarding the number of children that need to
be served – the Q – there is a similar problem. If
the text of the Goal does not contain a clear-cut
numerical target, then how can we determine
the number of children to be served at the
various stages of the expansion process? This is
not a technical issue; it is essentially a political
issue, to be determined by governments after
parliamentary debate and broad consultation.
We have tried to resolve this by holding on to
the text of EFA Goal One, and more particularly
the phrase “especially for the most vulnerable
and disadvantaged children”. This adage has
guided the development of projections and
scenarios of ECCE expansion. As shown in
Chapter 6, we first ‘identified’ the vulnerable
and disadvantaged children in ways that are
statistically manageable, and then developed an
5 This ‘open approach’ was applied previously in Van Ravens and Aggio (2005) where a similar exercise was developed for
estimating the costs of EFA Goal 4 regarding literacy.
7
expansion scenario that countries may wish to
follow, at their own pace, on their way to higher
and eventually universal ECCE enrolment. The
general idea is that ECCE will expand both from
the top down and from the bottom up. The
top-down movement implies that enrolment
among children of the richer parents increases
through a more or less autonomous or market
driven process, while the bottom-up movement
concerns the efforts of the government and
non-profit providers to widen access to ECCE
for vulnerable and disadvantaged children. It
is hoped that for each of the Arab countries
the day will come when the two movements
shall meet somewhere in the middle, in which
case there is universal enrolment in ECCE, even
though differences in duration and quality
could still persist.
We hope that countries themselves will make
use of the tools in this publication to develop
their own expansion scenarios towards wider
and eventually universal access to ECCE. In the
absence of existing scenarios, we will base the
cost estimations in this report on an assumed
scenario that we think is reasonable, simply
because it is technically impossible to carry out
this exercise without making assumptions. But
all assumptions – for P as well as Q – remain
open to debate and alteration.
Methodological issues and the principle of interactivity

9
This chapter addresses the benefits of ECCE in
general, based on evidence from the Arab States
and beyond. It then looks at the extent to which
children in the Arab States presently enjoy these
benefits. It must be stressed that this concerns
the region as a whole. More detailed country
level information on enrolment is provided in
Chapter 6.
The benefits of ECCE
As stated in the introduction: ECCE has an
undisputed beneficial impact, both within the
realm of education and beyond.
Within education, early learning strongly
enhances success in further phases of education.
In Jordan it was found that kindergarten
attendance had a bigger influence on scores
on an early years evaluation test than the place
where children live (urban versus rural), gender
and even family income (Hussein, 2005). In
other words, ECCE has the potential, over time,
to help to bridge gaps that exist between groups
in a society.
Enhanced levels of school readiness should
eventually translate into lower drop out rates
and lower grade repetition rates. Indeed, in a
study covering sub-Saharan Africa, Jaramillo
and Mingat (2006) estimated that investments
in ECCE would be offset by up to 87% as a result
of higher efficiency within primary education
alone. This suggests that the full 100% of
investments, and probably much more, will be
recovered if the benefits that accrue at higher
levels of education and beyond are taken into
account.
Raising internal efficiency in primary education
is certainly also an issue for the Arab States, even
if it is not quite as urgent as in sub-Saharan
Africa. In 2001/2002, 4.8% of the children in
primary school in the Arab States repeated a
grade, while this figure is below 1% in other
regions, except South and West Asia (4.9%),
Latin America and the Caribbean (5.6%) and
sub-Saharan Africa (15.6%). Arab countries with
grade repetition rates higher than 10% (2004
data) are Algeria, Djibouti, Lebanon, Mauritania
and Morocco. The average drop out rate in the
Arab States was 7.2% in 2001/2002. This is better
than the 20.5% found in Latin America and the
Caribbean, 35.1% in South and West Asia, and
the 40.5% in sub-Saharan Africa, but in some
of the individual Arab countries the situation
is dramatic: 50.6% in Iraq (1998/1999), 51.3% in
Mauritania (2001/2002) and 24.5% in Morocco
(2001/2002). In Yemen 45% of the children who
enrol in primary education do not complete
it (Basheer, 2005). Four of the other countries
in the region have drop out rates higher than
10%, and for three countries our source did not
report the data6.
Chapter 3: Making the case for expanding ECCE in the Arab States
6 The data in this paragraph have been derived from (i) the fourth edition of the EFA Global Monitoring Report, Annex Tables 6
and 7 (UNESCO, 2005a), and (ii) the Global Education Digest 2006 of UIS, Table 4 (UNESCO Institute for Statistics, 2006)
As said, the benefits of ECCE also spill over
to areas outside the realm of education.
Evaluations of two large programs in the US
revealed that every invested dollar pays itself
back four or even seven times in terms of broad
individual and social outcomes (ADEA Working
Group on ECD, 2003). Studies in the developing
world revealed similar outcomes, albeit not
quite as spectacular. Still, van der Gaag and Tan
(1998), investigating a number of projects in
developing countries, found that the rates of
return on ECCE programs are higher than those
of interventions at other education levels and
also higher than those of investment projects
outside education.
The evidence of the benefits of ECCE and its
capacity to ‘pay itself back’ was recently reviewed
in the EFA Global Monitoring Report (UNESCO,
2006). This review underscores once again that
ECCE contributes, more or less directly, to all
of the other EFA goals, and to several of the
eight MDGs, and that it is clearly worth the
investment. However, some of ECCE’s benefits
take a long time to materialise, and this limits the
extent to which the gains can be used as political
arguments to enhance investment in ECCE today.
For more information on the benefits of ECCE
we refer the reader to Masse and Barnet (2002),
Young (2002), Njenga and Kabiru (2001), Ramey
et al. (2000), Myers (1998), Wamahiu (1995) and
Schweinhart, Barnes and Weikart (1993).
Present levels of ECCE enrolment in the
Arab States
To what extent do children in the Arab States
region generally enjoy the benefits that ECCE
brings? Table 3.1 provides a summary of the
present situation in comparison with other
regions of the world. A more precise assessment
of the needs of children in the region at country
level is given in Chapter 6.
Table 3.1 concerns pre-primary education which
is defined by the UNESCO Institute for Statistics
as follows: “Programmes at the initial stage of
organised instruction, primarily designed to
introduce very young children, aged at least
3 years, to a school-type environment and to
provide a bridge between home and school.
Variously referred to as infant education,
nursery education, pre-school education,
kindergarten or early childhood education, such
programs are the more formal component of
ECCE” (UNESCO, 2006:351). It must be noted
that this definition of pre-primary education
is only one of several definitions. In Chapter 4
we shall also use the definition of a somewhat
broader concept of ‘early childhood care and
education’. The reason for using two definitions
is entirely pragmatic: statistical data on pre-
primary education are usually available for
more countries than those on early childhood
care and education, hence the use of the former
in this particular case. It should also be noted
that both definitions are restricted to the 3–5
age group; in this report, however, we shall also
address the 0–5 age group.
In 2004, the Arab States as a region had 2.7
million children enrolled in pre-primary
education. This figure represents an 11%
increase compared with the enrolment level
of 1999 (UNESCO Institute for Statistics, 2006:
table 1) The latest comparable data at regional
10

11
level for enrolment ratios is presented in Table
3.1 from which it can be seen that only GERs7
are available. The Arab States´ overall GER
in pre-primary education in 2004 was 15.7%.
This rate is the lowest except for sub-Saharan
Africa where this figure stands at 12.4%. These
figures show that currently the ECCE system in
the region is only capable of capturing a small
proportion of all the eligible children.
GER (%)
Region 1999 2004
MF F GPI MF F GPI
Arab States 14.7 12.7 0.76 15.7 14.6 0.87
Central and Eastern
Europe48.8 48.0 0.97 57.5 55.9 0.95
Central Asia 22.5 21.5 0.92 26.9 26.2 0.95
East Asia and the Pacific 39.8 39.3 0.98 40.0 39.3 0.96
Latin America and the
Caribbean55.8 56.1 1.01 61.5 61.9 1.01
North America and
Western Europe75.7 75.1 0.98 78.5 77.7 0.98
South and West Asia 22.3 21.3 0.91 32.4 32.0 0.98
Sub-Saharan Africa 9.6 9.5 0.98 12.4 12.3 0.98
We do not see a clear correlation between wealth
and enrolment in ECCE. For instance, with
an average per capita Gross National Product
(pcGNP) of US$ 2240 in 2002, the Arab States are,
as a whole, a richer region than East Asia and
the Pacific (US$ 960) where ECCE-enrolment is
much higher8. Furthermore, Latin America and
the Caribbean have an average pcGNP of US$
3280 (which is not much higher
7 GER stands for Gross Enrolment Ratio, which is the number of children of any age that are enrolled, as a percentage of the
relevant age group. A better measure is the NER or Net Enrolment Ratio, with only the enrolled children of the proper age
in the numerator. We use NER whenever possible, but where this is unavailable we have had to use the GER.8 The data on pcGNP are derived from Table 1 of the fourth edition of the EFA Global Monitoring Report (UNESCO, 2005a).
Making the case for expanding ECCE in the Arab States
Table 3.1: Total GERs in pre-primary education in the Arab States and other main EFA regions
Source: UNESCO Institute for Statistics (2006), online statistical database.
Abbreviations: GER, Gross Enrolment Ratio; MF, Male + Female; F, Female; GPI, Gender Parity Index.

12
than that of the Arab region) compared to an
average GER of 61%, which is more than three
times that of the Arab region. Remarkably,
North America and Western Europe, often seen
as the benchmark, have a GER of 78%, which
may be the highest value of all regions but is by
no means close to universal enrolment.
The gender balance – indicated by the Gender
Parity Index (GPI), i.e. girls’ enrolment as a ratio
to boys’ enrolment – shows that there is a gender
gap in favour of boys, with GPI standing at 0.87.
Looking at the other regions, it can be said that
a relatively good gender balance (compared to
primary education) is a typical ECCE feature all
over the world, which can partly be explained
by the fact that children at ECCE age are initially
too young to work, and partly by the fact that
children from poorer backgrounds – who run
a higher risk of being put to work – tend to be
excluded from ECCE.
According to the UNESCO Institute for Statistics
(2006), two thirds of the pre-primary pupils of
the region are enrolled in private institutions.
Unfortunately, there is no information for the
other regions and therefore it is not possible
to make comparisons. It must be noted that
‘private’ provision includes not only the ‘for-
profit’ providers, but also non-governmental
organisations (NGOs) and religious organisations.
The latter fulfil an especially important function
in the Arab States.
The low enrolment ratios combined with high
private provision reflect the underdevelopment
of public provision. Its expansion is urgently
needed if considerable progress towards EFA
Goal One is to be achieved, particularly to reach
out to the most vulnerable and disadvantaged
children. However, the rate of progress in the last
five years has been modest. A simple projection
of the recent trend (1.3% average annual growth
rate) reflects that the region as a whole would
need 50 years to reach a GER of 50%.
In conclusion it can be said that children in the
Arab States, in general, are not benefiting from
ECCE to a degree that would be acceptable in
light of the important advantages of it. The
region as a whole may be generating enough
wealth to be able to accelerate progress to EFA
Goal One, but, as shown in Chapter 8, various
individual countries may not. Presently ECCE is
nearly non-existent in some countries, while in
one case there is even an alarming decrease of
enrolment, as shown in Chapter 6. High drop-
out rates in primary education in some of the
countries indicate that investment in ECCE is very
urgently needed and will largely pay itself back.

13
Before we can even begin to estimate unit
costs of ECCE, we need to ask what it actually
is, and how the many modalities of ECCE can
be ‘modelled’ to a more limited and more
manageable number of variants. This is the goal
of this chapter.
What is ECCE?
As stated in the previous chapter, several
different definitions of ECCE exist. While in the
previous chapter we needed to stick to the more
restrictive definition of pre-primary education
for statistical reasons, we now prefer the broader
concept of ECCE. The glossary of the 2006
edition of the EFA Global Monitoring Report
(UNESCO, 2005a) defines ECCE as follows:
“Programmes that, in addition to providing
children with care, offer a structured and
purposeful set of learning activities either in a
formal institution (pre-primary or ISCED 09)
or as part of a non-formal child development
programme. ECCE programmes are normally
designed for children from age 3 and include
organized learning activities that constitute,
on average, the equivalent of at least 2 hours
per day and 100 days per year.”
In this definition ECCE encompasses pre-primary
education but also includes “non-formal child
development programmes” as well. Once again
we note that while the above definition is
restricted to the 3–5 age group, this report also
addresses the 0–2 age group.
Under this general heading sits a rich
programmatic diversity. Going from more
formalised to less formalised, and far from
claiming to be exhaustive or mutually exclusive,
we can distinguish four main modalities:
Formal pre-school. This modality is usually
designed to specifically prepare children
for their entry into primary education. It
has many of the characteristics of regular
education, and can actually be situated
within primary schools.
Centres. These can be referred to as
kindergarten, day care centre, crèches,
nurseries, and so on, partly depending on
age. Centres can stand on their own or can be
linked with community centres, schools, or
with the organisations where parents work.
Home-based facilities. Different kinds of
arrangements that groups of families and/or
community leaders have organised, with or
without external support.
Home visiting. This modality does not
directly reach out for the children themselves
but assists parents and community leaders
in their educational efforts. Strictly speaking,
terms such as parent-support, coaching
or perhaps counselling may also capture
these activities, but we adhere to the more
9 ISCED-0 is a statistical term. It stands for International System for the Classification of Education, and level zero concerns
(formal) pre-primary education. We shall not use this rather technical term further in this report.
Chapter 4: Modalities of ECCE
.
.
.
.

commonly used “home visiting”. It may
include the provision of materials or even
a toolkit. Home visits by an ECCE expert
are the usual vehicle, but media can play a
role too. Home visiting can be successfully
combined with the previous modality, with
experts supporting groups or networks of
parents and community leaders.
UPE ECCE
TargetAll primary school age population into school
Expansion, with a focus on vulnerable and disadvantaged children. Different interpretations of ‘expansion’: more children enrolled, more time spent on programmes per year, more years, etc.
Delivery Predominantly formal A range of modalities from sparsely supported home-based to formal pre-school
Staff required Professionals
Professionals, paraprofessionals, parents, siblings, nannies, babysitters. However, untrained carers may gradually reach higher levels of professionalism
Focus of the intervention
ChildrenChildren and/or parents (e.g. mothers attending literacy programmes that address child upbringing)
Entry age
Officially at age 6 in most countries. In practice, children may enter one or more years later, and occasionally earlier
At the earliest, ECCE starts soon after birth. At the latest it starts one year before entry in primary school
Frequency and duration
Usually at least 5 days a week, during a regular number months per year, and usually lasting for six years
Very diverse: from once a week to 5 days a week, from just a few hours to a full day, etc. The duration also varies widely.
Number of children served
Fairly well agreed definitionDifferent definitions. The use of full-time equivalent would be desirable.
Unit costsRough estimates available from a broad body of research
Estimates are scarce. The literature on ECCE is strong when it comes to impact (the so-called tracer studies), but less strong on financial issues
Within each of these four modalities a
large variety of approaches exist, based on
educational and pedagogical paradigms, on
visions on childhood, on ideas about the
relationship between the programme, its
stakeholders and its environment, and so on.
Table 4.1 illustrates the genuinely complex
nature of the ECCE goal, compared to the Goal
of Universal Primary Education (UPE).
14
Table 4.1. Comparing UPE and ECCE for costing purposes

15
Reducing the complexity
It is clear that a cost estimation at regional
and national level cannot possibly do full
justice to all of these variants. It would lead to
a miscellany of cost variants and would not
enhance the clarity of the outcomes. So how can
we reduce the complexity? We faced a similar
problem when estimating the global costs of EFA
Goal Four regarding adult literacy (Van Ravens
and Aggio, 2005), an area in which a similar
diversity of paradigms exists. We then arrived
at the following solution, which, in essence, we
propose to adapt to the specific case of ECCE:
Despite the enormous diversity in ECCE,
there are a number of basic characteristics
that most – not all – programmes have in
common:
There is usually a group of learners (in this
case children) of a certain size.
There is usually a person involved called
a teacher, carer, educator, facilitator or
similar. This person has ideally received
a certain amount of pre-service and/or
in-service training.
There is usually an environment where the
interaction between learner and teacher
takes place and that ideally meets certain
standards. The same goes for inventory
and learning materials.
There is usually a certain time frame
within which the interaction takes place: a
certain number of hours per day, a number
of days per of week, a number of weeks per
year, and a number of years.
There is usually a management and
support structure of some sort, leading to
overhead costs.
For all these parameters it is possible to
make assumptions, partly based on empirical
observations, partly based on normative
notions derived from the judgment of
experts.
Thus, we can arrive at a framework – we will
do this in the next chapter – that can be seen
as representative for the large majority of
programs, even if they differ in pedagogical
and other respects. In other words, we can
reduce the complexity of the domain that we
are addressing.
Exceptional ECCE-programs and approaches
that require, for instance, very small groups
or very special preparation for the teacher
will thus remain out of the scope of this
study10. The argument is that such programs,
beneficial as they may be, are too expensive
to make a substantial contribution to a
significant expansion of ECCE for children.
This implies by no means that they should
cease to exist. Such programs may play an
important role both as ‘laboratories’, where
innovations can mature, to be scaled up
later, and, of course, for children with special
needs requiring a higher degree of attention.
Modalities of ECCE
10 As indicated earlier, however, the reader can manipulate the parameters in the spreadsheet. The cost implications of
having smaller groups or higher training costs can thus be observed.
.
.
..
.
.
.
.
.
16
Thus, we shall henceforth speak of regular
program delivery (RPD), abstracting from the
concrete forms and labels it may have such as
formal pre-school, centre, etc. This does not
mean that these forms and labels do not matter.
In fact, one of the present debates in ECCE is
about the possibly higher cost-effectiveness of
centres compared to formal pre-school (Mingat,
2006) 11. But in our approach, we ‘enforce’ a
certain degree of cost-effectiveness by setting
the parameters, not by discriminating at the
outset between forms and labels. In practice it
may (or may not) appear that centres meet these
parameters more easily than formal pre-schools,
but this remains to be seen, and it would not
influence the outcomes of the costing study.
Following the distinction between the 0–2
and 3–5 age groups (Chapter 1), and referring
to the definitions of pre-primary education
(Chapter 3) and of ECCE (at the beginning of
this chapter), we will further assume that RPD
concerns the 3–5 age group rather than the
0–2 age group. However, the precise age group
that is being served by programmes differs
by country. Within the Arab States, the whole
3–5 group is eligible for (formal) pre-primary
education in Bahrain, Lebanon, Mauritania,
Qatar, Saudi Arabia, Syrian Arab Republic,
Tunisia and Yemen, but only 4 and 5 year
olds are eligible in the remaining countries:
Algeria, Djibouti, Egypt, Iraq, Jordan, Kuwait,
Libyan Arab Jamahiriya, Morocco, Occupied
Palestinian Territory, Oman, Sudan and United
Arab Emirates.
There are two ECCE modalities that are not
covered by RPD and that are important enough
to discuss them in more detail: home visiting
and nurseries.
Home visiting
While a clear definition of home visiting seems
to be lacking, we treat it in this paper as a
modality of ECCE whereby a professional (the
visitor) visits parents or groups of parents with
young children, and supports them in various
ways in the process of raising these children. It
usually concerns the 0–2 age group, and only in
exceptional cases the 3–5 age group.
The logistics of home visiting are different
from those of RPD. The number of parents or
community leaders that a visitor can address in
one session is smaller than the ideal number of
children in one group. But at the same time the
frequency of the sessions is much lower (e.g.
twice a month over six months) so that one
visitor can address large numbers of parents
in total. And since parents usually have several
children, the ‘span of control’ (the total number
of children that are indirectly reached) of a
visitor is much larger than that of one single
teacher or carer. This makes this ECCE modality
potentially very cost-effective. The extent to
which this potential cost-effectiveness comes
11 Mingat demonstrates that centres are less expensive than pre-schools from a government perspective, because parents
tend to cover a part of the costs by paying fees. This, however, does not mean that centres are genuinely cheaper; it may
simply mean that parents pay more. And many parents may be unable to pay the fees, as Jaramillo and Tietjen
(2001) signal.
17
to fruition depends on a variety of factors. On
the positive side, there is for instance the fact
that the beneficial impact of the interventions
usually goes beyond the children12. On the
negative side, there are indications that this
impact is slow-working and tends to materialise
only in the medium term. All things considered,
however, there seem to be sufficient arguments
to give home visiting its own place in this
costing exercise, distinct from and in addition
to RPD.
Nurseries
Nurseries (and crèches) are usually meant for
infants and toddlers, i.e. the 0–2 age bracket, but
in terms of the logistics they would resemble
RPD more than home visiting: there is a site
where children are brought, there are materials,
there is a carer, etc. (for obvious reasons
nurseries require a different child/carer ratio
compared to RPD for the 3–5 age group).
There are two reasons that make it questionable
whether nurseries should receive separate
treatment in a study about the expansion of
ECCE services towards a large scale and on
limited budgets.
First, nurseries have relatively high unit costs.
In Jordan, for instance, there is one carer for
every five children (National Team for Early
Childhood Development, 2000), which makes
this service rather expensive. Indeed, only 1.57%
of the relevant age group in Jordan is cared
for in a nursery, and services are concentrated
in and around Amman (49% within the
capital, and 59% in the central region around
the capital). Though we have not found such
precise figures for other Arab countries13, we
get a strong sense from the literature that the
situation is not very different elsewhere in
the region or in the developing world more
broadly. Even rich countries such as EU-member
states do not have the ambition to universalise
nurseries. Their targets for 2010 are 90%
enrolment for 3–5 year olds and a mere 33%
coverage for the 0–2 age group.
Second, there are concerns about the desirability
of certain services for the 0–2 age group, and
more precisely about cognitive and social
development during later childhood of children
who are (too) frequently cared for in nurseries
(EFA Monitoring Team, 2005). Indeed, the main
argument for parents taking their children to
nurseries seems not to be pedagogical but rather
practical, in that it frees them up to work and
generate income.
In summary, the costs of substantially expanding
access to nurseries may prove to be unimaginable,
and the desirability of it questionable. One
12 The second edition of the EFA Global Monitoring Report, which had gender as its theme, has described a number of such
synergetic arrangements (UNESCO, 2003:183). The fifth edition has ECCE as its theme and also addresses schemes to
support parents (www.efareport.unesco.org).13 The UNESCO Institute for Statistics only collects and reports data for ECCE services with an entrance age of 3 or higher
(UNESCO Institute for Statistics, 2006, Table 1)
Modalities of ECCE

18
could take the stance that generally when
parents generate a demand for nursery services
it is usually driven by economic motives so
that they could be expected to finance these
services themselves, possibly together with other
stakeholders. Ms Choi, UNESCO’s ECCE expert,
recommends a partnership approach mobilising
the other ministries that are usually involved
(UNESCO, 2004a:20)14, but also educational
activities such as female literacy classes and
community learning programmes, to which we
would add employers who may be encouraged
to open up more facilities for their personnel15.
Since this study focuses on the substantial
expansion of ECCE for vulnerable and
disadvantaged children – clearly a public
responsibility – nurseries do not seem to fit into
the picture. We therefore propose (i) to address
the 0–2 age group under the heading of home
visiting only, and (ii) to address the 3–5 age
group under the heading of RPD.
14 In Sudan, for instance, five ministries are involved (Basheer, 2005), while Abd-El-Jaheel (2005) identified 21 organisations
in Yemen that are involved, including six ministries.15 This is also an element of Jordan´s strategy (National Team for Early Childhood Development, 2000:14)

19
In this chapter we first estimate the unit cost
(i.e. average costs per child) of RPD and then
those of home visiting. Both will be expressed
in terms of pcGNP, but in the last section of this
chapter they will be translated into concrete US$
for each of the countries.
Methodological problems regarding
the estimation of unit costs of RPD
For the estimation of the unit costs of RPD we
again build on our experience with an earlier
and comparable exercise that we did for EFA
Goal Four on adult literacy (van Ravens and
Aggio, 2005). There are similarities between EFA
Goals One and Four, although there are also
important differences that we shall take into
account.
The two goals have in common that the
observed unit costs of existing programs vary
considerably. There is just too much variation
to simply pick one example and use it as a
standard. In the case of literacy, therefore,
we pursued a two-tiered approach. First we
estimated the unit costs theoretically rather than
empirically, using a normative model. One of
the characteristics of this model was that it was
contextualised, in that unit costs in a certain
country depended, for reasons explained later,
on that country’s pcGNP, and on teacher salaries
that are typical for the region. We then tested the
normative model by comparing its outcomes,
for as many countries as possible, with observed
or empirical unit costs. It appeared that the
model worked. Most of the observed unit costs
were of the same order of magnitude as the
model’s predictions (there was no clear tendency
towards overestimation or underestimation),
while those literacy programmes that were
significantly more expensive or significantly less
expensive clearly belonged to different program
categories, e.g. very cheap programmes usually
rely on volunteering, while the expensive ones
typically included life skills components or
seemed to have undesirably large overheads.
We have tailored the normative model in
order to make it fit the specific characteristics
of ECCE. However, when we tried to make
the second step – comparison with observed
programmes – we encountered a problem as
the variation in unit costs is even larger than
it is in the case of literacy. For instance, the
UNESCO report on ECCE in E-9 countries
presents unit costs for four of the E-9 countries
and two other countries (UNESCO, 2004a).
While the six countries do not differ very greatly
in terms of development status, the unit costs
ranged from US$ 46 to US$ 1222, a difference
which is by no means explained by variation in
pcGNP. For these six countries, the report also
allows a comparison with unit costs in primary
education, where variation is less marked and
better explained by variation in income pcGDP.
The comparison revealed that unit costs in
primary education are higher than in ECCE in
all but one of the six countries, but in some
Chapter 5: Estimating P: The unit costs

20
cases the differences between the two is much
more pronounced than in other cases. The EFA
Monitoring Team (2005) found a similar degree
of variation. A broader search for observed unit
costs, with a focus on low income countries,
revealed somewhat more consistency (Mingat
et al., 2006; Issa, 2006; Hyde, 2006; UNESCO,
2005b; Myers, 1998; The Consultative Group
Secretariat, 1993). Unit cost in poor countries
in Africa and Asia tend to have an order of
magnitude of US$ 25 to US$ 50, although lower
unit costs are also found, the lowest being US$
10 in the case of a large programme in India.
Within the Arab States, unit costs in Sudan are
in the order of US$ 2616. Abd-El-Jaleel (2005)
reports that full fees in Yemen are roughly
between US$ 50 and US$ 100, but clearly few
parents can actually afford these fees given the
low level of enrolment in this country.
Three main causes of the variation in unit
costs are: (i) strong variation in duration, (ii)
volunteering, and (iii) the incidence of very
expensive, usually small scale programs.
The number of hours that children spend
per year in ECCE varies strongly. As noted
earlier, the UNESCO Institute of Statistics
only reports on programmes of 2 hours or
more per day and of 100 or more days per
year. Thus, the bottom line for statistical
reporting is 200 hours, but programs of
even less hours do also exist. At the other
end of the spectrum we find formal pre-
school, where the annual number of hours
may approach that of primary education.
In other words, even programs of roughly
equal quality (i.e. with equally trained and
paid teachers, with equal group sizes, with
equal equipment) may still differ by a factor
4 when it comes to unit costs.
Since teacher salaries are usually the main
cost component in education, cutting these
costs strongly reduces the unit costs. This
is the case when parents and community
leaders act as teachers on a voluntary basis,
or against a small financial or in kind
compensation. Similar economies may
occur when religious organisations act as
providers. Later in this chapter, under the
heading of visitors, we shall discuss the
option of having parents and community
leaders acting as well-prepared but low-paid
or unpaid teachers.
In some countries, the coverage of ECCE
is very limited, and often restricted to elite
children in the capital. On such a small
scale it is not difficult to generate enough
resources to pay teachers well and keep the
groups small, which explains the incidence
of high unit costs. Such situations are
regularly criticised in the literature, and they
must be ended when countries wish to scale
up ECCE provision substantially.
A normative model for estimating
the costs of RPD
Given the variation and indeed the bias within
observed unit costs, we need to rely on the
normative model that we developed and tested
16 See Basheer (2005, table 6.2). We divided the total costs by the total number of enrolled children to obtain a rough estimate.
.
.
.

21
for EFA Goal Four and to adapt it to Goal One17.
We do this through the following steps (a–k).
Teacher salaries are usually the core element
of cost structures in education. They depend
on pcGDP: a teacher in a richer country will
need a higher salary to afford a certain basket
of consumer goods than a teacher in a poorer
country, while the national income of that
richer country would indeed allow for higher
teacher salaries. Controlling for pcGDP is
particularly important in the case of the Arab
States given the strong variation between the
countries in terms of national income.
Rules of thumb have been calculated
regarding the salaries of primary school
teachers in various regions. Here we refer
to table 4.10 in the third edition of the EFA
Global Monitoring Report (UNESCO, 2004b).
For example, in Asia teachers earn 2.9 times
the pcGDP, as distinct from Africa where the
factor is 4.4. In the Arab States, this factor
stood at 2.8 in 1985 and at 3.3 more recently,
so we propose to use a factor of 3 as a rough
but defensible assumption. If the reader
prefers a higher or lower value, she or he can
enter that value in the spreadsheet, and this
goes for all of the following assumptions
underlying this normative model.
We then need to decide whether or not we
assume the same salaries for ECCE teachers
as we do for primary school teachers. Mingat
(2006) found that pre-school teachers in
four developing countries earned on average
81% of what primary school teachers earn.
As a more general statement one can say:
the higher the education level, the better
the teachers are paid, with the university
professor standing at the top of the income
hierarchy. This is usually explained or
justified by the fact that content matter gets
more complex at higher education levels,
so that it requires more study and talents
to master the content. Indeed, in terms of
educational content, ECCE does not seem
to require extensive preparation. But when
it comes to the pedagogical process, ECCE
may demand more from the teacher than
higher forms of education, given the delicacy
of early childhood development. Dedicated
and talented ECCE teachers are crucial since
the child is in a phase of potentially rapid
development, for better or for worse. We
have thus assumed the same salary levels
for ECCE teachers as for primary teachers.
The argument for doing this is further
supported by the fact that salaries, even in
primary education, in developing countries
are generally considered to be insufficient
and are often seen as the main cause of
absenteeism (UNESCO, 2004b).
Estimating P: The unit costs
a
b
c
17 Other models exist as well. An example is the approach chosen by the World Bank for its large ECCE project in Egypt
(World Bank, 2005). This approach is not based on unit costs but rather on main project components such as constructing
or repairing buildings, training teachers, etc. This approach is necessary for the roll-out of an operational plan or
programme, but less suitable for a macro-level cost estimation. The ECD Calculator (www.worldbank.org) represents
another model. In this case the main function is to calculate the economic benefits.
The total number of hours that a full time
teacher works per year is assumed to be
180018, of which 1600 is effective teaching
time or contact hours, the rest being
preparation time (van Ravens and Aggio,
2005). Of course, not every teacher actually
works full time and local circumstances may
strongly determine the rhythm of daily life
and hence the chronology of programme
delivery, e.g. agricultural communities will
have a different ’calendar’ than urban people,
nomadic groups, or fisherfolk. So in practice
we may find in one place teachers who run
parallel classes during a part of the year, and
work elsewhere during the rest of the time,
and in another place teachers with a pattern
that resembles that of regular education. But
our approach is such that it abstracts from
such differences.
Given 1600 hours of contact time, a teacher
can theoretically run two ECCE classes of 800
hours each in one year. Once again, this does
not imply that all ECCE courses have exactly
800 hours per year. Many may only have half
this amount, some perhaps just one fourth
or less (200 hours per year is the threshold
for statistical reporting). Within the Arab
States, the number of yearly hours varies
from 195 in Iraq (which is clearly an outlier)
to 1152 in the Syrian Arab Republic, but
more generally speaking, there is a tendency
towards 800 yearly hours (Abd-El-Jaleel,
2005). Thus, we have used 800 hours as a
standard in our calculations.
Given the fact that the theoretical annual
salary of a teacher in the Arab States is 3 ×
pcGDP (see point b), and assuming that a
teacher theoretically delivers two programs
of 800 hours each per year (see point e), the
salary component of an 800 hour programme
would cost (3 × pcGNP)/ 2. To find out how
much this is per child, we need to know
the normative group size. As discussed as
an example in Chapter 1, and based on the
general impression that we get from the
literature, we have set this parameter at 20
(see for example ADEA Working Group
on Early Childhood Development, 2003).
Although Bennet (2004) suggests a group
size of 15 and although the present pupil/
teacher ratios19 in the Arab region are
generally around that size or even lower
(UNESCO Institute for Statistics, 2006),
we think that it will be difficult enough to
maintain a group size of 20 in a scenario
of (hopefully) rapid expansion of ECCE.
The lesson from fast growth in primary
education in some African countries is
that it can easily inflate class size. The
situation in Yemen may illustrate this risk.
Abd-El-Jaleel (2005) reports the numbers
of children that are enrolled in ECCE, as
well as the manpower, for each of Yemen’s
Governorates. If we divide the former by the
22
d
e
f
18 The assumption of a working year of 1800 hours is again a rough estimated average. It is the product of 40 hours (per
week) multiplied by 45 weeks (per year). In practice, only the professionals in the richer countries may have the luxury
of several weeks of vacation per year. In poorer countries, it is absenteeism rather than vacation that limits the effective
number of hours that people work on a yearly basis.19 It must be noted that pupil/teacher ratios are not quite the same as the group size.

23Estimating P: The unit costs
latter to obtain a rough indication of group
size, we find ratios varying from 1:4 to 1:24,
with an average of 1:11 (Abd-El-Jaleel, 2005).
But at the same time the overall level of
enrolment is extremely low in Yemen. Thus it
is very questionable whether these relatively
favourable ratios can be maintained against
improved enrolment levels.
If we combine an assumed group size of 20
with the formula found in point f above,
then we can say that the costs of the salary
component of an 800 hour programme per
child are equal to [(3 × pcGDP) / 2] / 20.
The last step is to determine the non-salary
component.
First, we assume that this component also
depends on pcGDP. It consists partly of
overhead costs, taking the form of salaries
of managers and others who should be
hired locally20. Partly, it takes the form of
buildings that need to be built or repaired
by local construction workers using locally
produced materials and so on. Integrating
a cost component that does not depend on
pcGNP is only justified when lots of goods
must be imported, such as machinery or
vehicles. We assume that learning materials
are not imported even if this is presently the
case because it would be too expensive when
scaling up an ECCE system.
In the case of literacy training, we assumed
that teachers’ salaries make up 70% of all
costs (van Ravens and Aggio, 2005). This was
partly inspired by the situation in primary
education. Although the teacher component
in that sector is usually around 85% to 90%
of total costs in developing countries this is
generally considered to be too high and to
leave too little room for materials, ongoing
or in-service training, maintenance of the
building, etc. (UNESCO, 2004b). The regional
average for North America and Western
Europe stands at 66.8%. In the case of ECCE
there are arguments to choose an even lower
value. First because nutrition, medication,
materials and toys require resources21.
Second because in-service training is also
part of the overhead and this may be of
special importance, especially for those
countries that have a small ECCE sector and
wish to scale it up relatively quickly. This
aspect deserves special attention.
Normally teacher training consists of three
or four years of full time pre-service study,
i.e. ‘off-the-job training’. Countries that
have had a relatively large ECCE sector for
many years and wish to expand it slowly may
choose to rely on the existing infrastructure
for teacher training. The intake for these
courses may need to increase somewhat in
g
h
20 It may sometimes be the case that foreign staff are involved for technical assistance, management and perhaps even
teaching or counselling. In such cases we take a normative position by saying that at the end of the day this is undesirable
and would lead to high costs. Experimentation and small scale initiatives may sometimes thrive on foreign inputs, but
when scaling up, sustaining what has been achieved is only possible by relying largely on local resources.21 Medication can enhance school success at relatively low costs, apart from having an obvious value of its own (see for
example Public Health at a Glance – a section of the World Bank website – on the Integrated Management of Childhood
Illness, IMCI). School meals are increasingly seen as a ‘quick win’ instrument that not only enhances childrens’ health, but
also stimulates school and ECCE attendance (Sachs, 2005).
i
j

24
periods of gradual expansion, but it will not
necessarily lead to a strong disruption in the
funding of teacher training. In other words,
the extra investment in the preparation of
ECCE teachers may almost remain unnoticed
in these countries. By contrast, countries
with a smaller ECCE sector and a stronger
ambition to make it grow cannot entirely
rely on the existing infrastructure. Full time
off-the-job training is very costly and there is
the practical problem that even if the intake
of regular teacher training increases quickly,
it will take about three to five years before
the first of this new generation of teachers
graduate. With only nine years to go until
2015, countries may not wish to wait for
that. Therefore, there is a growing consensus,
regarding both primary education and ECCE,
that teachers are best trained on-the-job,
with just a minimum amount of preparation
ex ante (UNESCO, 2004b; Jaramillo
and Tietjen, 2001; Myers, 1998). Strong
commitment seems to be more important
than lengthy pre-service training for teachers
at this level and so, clearly, parents and
community leaders are excellent candidates
for this role. Thus, under the assumption
that the preparation of large numbers of
new ECCE teachers (in a context of rapid
expansion) will predominantly take place
on-the-job, we need to build in a training
cost component into the unit cost, since the
new teachers will take time before becoming
fully productive, while the more experienced
teachers need to dedicate some of their time
to coaching the newcomers.
We thus assume that the non-salary
component will be 40% of the unit cost in
times of rapid expansion, leaving 60% for
the salary-component. We can now complete
the unit cost formula: [(3 × pcGNP) / 2] /
20 × (100/60). This equals 0.125 × pcGNP, or
12.5% of pcGNP. To put this into perspective,
one could say that this 12.5% of pcGNP
equals about 4% of a primary school
teacher’s salary in the same country. For poor
families it can easily rise to a much more
substantial share of their annual income.
For an overview of all the core parameters see
Table 5.1. The abbreviations in brackets appear
in the formula below.
The combination of these parameters results in
the unit cost (expressed as percentage of pcGNP)
according to the following formula:
As said earlier, the opportunities for testing this
formula by comparing them with empirical unit
costs are limited because we have only a few
observations of unit costs at our disposal and
these vary enormously. However, there is one
important and robust observation by Mingat
(2006), who found that the average unit costs in
sub-Saharan Africa are 17% of countries’ pcGNP.
Knowing that teacher salaries in sub-Saharan
Africa are around 5 × pcGNP (against 3 × pcGNP
in the Arab States) we can recalculate our
k

25Estimating P: The unit costs
formula for sub-Saharan Africa. We then find an
average unit cost of 20.8% of pcGNP for the sub-
Saharan countries. The difference between our
20.8% and Mingat’s 17% can almost entirely be
attributed to the fact that we assumed that ECCE
salaries are equal to those in primary education,
instead of following Mingat’s empirical finding
of ECCE salaries being 81% of those in primary
education.
We conclude that the unit cost of 800 hours of
regular programme delivery in the Arab States
is 0.125 × pcGNP. Table 5.3 at the end of this
chapter gives the actual US$ values for each of
the countries but first we will address the second
ECCE modality chosen for this study: home
visiting.
Home visiting
Home visiting is an important ECCE policy
option for developing countries22. We
define home visiting as supporting parents,
community leaders and others in their roles
as carers and educators of young children by
giving expert advice and providing materials.
Regarding home visiting there is even less
standardisation than in the case of RPD.
Moreover, the distinction between home visiting
on the one hand and well-supported home-
based programs of informal ECCE centres on the
other hand, is not always clear. In practice, the
former can be the first step that a community
makes towards the latter.
Table 5.1. Core cost parameters for RPD in ECCE
Primary school teachers` annual salary (PSTAS) 3 × pcGNP for the region
ECCE teachers salary as % of primary school salary 100%
Total working hours per year 1800
Total effective teaching time 1600
Number of programmes (800 hours) per teacher per year (NP) 2
% of salary on total cost (SC/TC) 60%
Group size (GS) 20
RPD cost per child expressed as percentage of per capita GNP 12.5%
22 Olmsted (2002) argues that “non-centre-based early childhood services” are the dominant ECCE modality for developing
countries.

26
Indeed, when it comes to designing strategies
for the expansion of ECCE, one can distinguish
between a tightly planned and centrally governed
roll-out of ECCE facilities, and a more organic
way of expanding ECCE: starting in homes, then
making it more and more professional, e.g. by
introducing ongoing training, subsidies and
forms of accreditation of carers and educators,
and gradually moving towards more formalised
settings. Home visiting can act as a catalyst
in such an organic process. It is against this
background that we wish to include home
visiting in our estimation exercise, even if it
requires the making of some strong assumptions.
One of the main things we wish to demonstrate
is that home visiting can be an order of
magnitude less costly than RPD. The reason
for this is that the act of caring and educating
as such is performed by parents (or groups of
parents) themselves; they can be seen as unpaid
volunteers, while it is only the visitor that needs
to be paid. The only costs directly incurred
by the act of caring and educating are the
opportunity costs. These are the earnings that
a parent would have received if he or she would
have been working during the time he or she is
now taking care of the children; in many cases
these opportunity costs are likely to be limited23.
Whilst the use of volunteer teachers is usually
criticised in the case of adult literacy programmes
on the grounds that their motivation is often
unsatisfactory, this is unlikely to be the case for
early childhood services delivered by parents.
For obvious reasons, their motivation to do
the best they can for their own children is
unquestioned.
Before developing a unit cost model for home
visiting, we wish to explain the use of the term
“parents” in relation to educating and caring,
since it is obvious that in many cases this burden
rests on the shoulders of just the mothers,
who usually also perform other household
tasks, and on top of that often need to generate
income. The eternal dilemma in such cases is
that on the one hand one wants to connect the
analysis to people’s existing realities, while on
the other hand one does not always wish to
take those realities for granted. In this case we
prefer the latter option, and will speak in neutral
terms of the roles of “parents”, not excluding
the possibility that fathers too may reallocate
their available time over income generation,
household tasks and child raising.
Adapting the normative model to
home visiting
First of all it must be emphasised that a concrete
arrangement for home visiting depends on the
stage in which such projects find themselves.
Several projects that are described in the
23 It is difficult to estimate the opportunity costs, since they are partly hypothetical. It is not always certain that a parent
would have been able to find paid work during all of the time he or she spends caring, while in many cases parents – or
at least one of them – may not even have the desire to work. In the latter case, the opportunity costs are very low or
absent; the parent would have stayed home caring anyway. Nevertheless, it would be more correct to incorporate
opportunity costs in the calculations. Since we do not, the costs of the home visiting modality may be underestimated to
some extent in this study.

27Estimating P: The unit costs
literature are in a pioneering or implementation
phase and have not yet scaled-up entirely. This
may imply, for instance, that, given the usually
large number of children per disadvantaged
family, visitors need to address children in
the whole ECCE age bracket when they make
contact with a family for the first time. They
will have children of zero to 6 years old in their
case-load, which may seriously complicate their
work. But after a number of years of working
in a village or district, the project may reach a
certain ‘steady state’. Visitors may eventually be in
the position to focus entirely on just the young
families and to contact them at appropriate
times, i.e. when the first child in born.
It is on this assumption – a steady state situation
– that we have constructed an arrangement that
may serve as an example. It must be stressed
that this arrangement is our own creation and
that it is by no means universal, even though
it is inspired by talks with experts and by what
we found in the literature. Again we enable
and encourage the reader to manipulate the
parameters in the spreadsheet, design his or her
own arrangement and observe the impact on
the outcomes.
Let us assume that visitors form small groups
of for instance five families, all having just
had their first child. We prefer a group-wise
approach to that of visiting individual families
because it is more cost-effective and because
it may generate extra synergies, such as taking
care of one another’s children, for instance on a
rotational basis, and thus forming an informal
ECCE ’class’ together (Arnold, 1990)24.
For each group of five families they would then
start a series of weekly group sessions. The
choice of a weekly frequency is based on Myers
(1987) who found that a lower frequency fails
to deliver the expected benefits. These sessions
would focus on child care during the first year
of a child’s life. It would be ineffective at this
stage to share knowledge about raising children
of 5 or 6 years of age, since this is not yet on the
minds of these particular families. The relatively
high frequency of one session per week would
allow visitors to actually attend sessions with
the children, to demonstrate certain techniques
and approaches to the parents and to coach the
parents as they practice these techniques and
approaches.
We assume that the sessions would not continue
throughout the entire year, partly because of
the life patterns of the families (which may
be influenced by harvest or other seasonal
activities), and partly because the visitor needs
time for professional development, consultation
with colleagues and superiors, and vacation.
However, our calculation model is such that
these interruptions of the weekly pattern do not
influence the outcomes.
When the first born children reach the age of
one, the same pattern of weekly sessions would
24 Such arrangements can be found in countries as poor as Nepal and countries as rich as Denmark. In the latter, one
parent may be accredited for caring for the children of others, who, on their turn, receive a subsidy.

28
be adopted. This could, in principle, be repeated
in each of the six years of the early childhood
period. Myers (1987) found counselling
programmes focusing on the 0–3 age bracket as
well as the 3–6 range. Some address most of the
entire period.
This arrangement, and its costs, is irrespective of
the number and age of any younger children that
may have been born in these families. If a second
child is born, the parents have already learned
how to care for it when the first was born. And
if a second child enters the next age bracket,
the same is the case (Myers, 1987). Herein lies
the enormous synergy of home visiting as an
ECCE modality: you educate the parents once,
and they can apply what they learned for any
child that follows. This is not the case for regular
programme delivery, where each and every child
that attends generates its own costs.
The costs per child of this arrangement can be
derived through the following steps (a–h). The
results are presented in Table 5.2.
We assume that each session takes half a
day, including preparation time and other
business that the visitor needs to take care
of25. So theoretically, a visitor can run 2
sessions a day, or 10 per 5-day working week.
And since each family is visited on a weekly
basis, the caseload will therefore be 10 groups
of five families, i.e. 50 families.
The number of children per family varies
strongly per country, so we cannot simply
assume one average number of children per
family for the whole region. Instead we have
selected the Total Fertility Rate (TFR)26 as a
proxy for the average number of children per
family, and we keep this as a variable in the
equation, just like we do for pcGNP. Thus,
the total number of children served by one
visitor per year is 50 × TFR.
We assume an annual salary for visitors
that is higher than that of a teacher. In
practice, this is not always the case, and
sometimes visitors´ salaries are actually lower
than those of teachers. The reason that we
nevertheless opt for better pay for visitors
than for teachers, is that our approach does
not blindly follow empirical findings; it is
normative27. We think that visitors should
be experts with a broader knowledge base
that they can apply in a broader range
of settings: they must not only have the
package of knowledge and skills required
for educating children of a certain age,
but they also must have the competencies
needed to transfer that package to adults.
This is genuinely more complex than merely
caring and educating, and it should be an
argument for a higher esteem and a higher
25 For individual sessions, one hour is the standard, but group sessions are more intensive, and there is the extra dimension
of teambuilding with a view to encouraging the group to cooperate.26 The Total Fertility Rate equals the average number of children per woman. We have used the 2000-2005 values for this
indicator that we found in the EFA Global Monitoring Report 2006, Annex Table 1, page 272.27 See Chapter 2 on methodology. Another example of a normative choice that ‘overrules’ empirical findings, is the
assumption that ECCE teachers receive the same salaries as teachers in primary education. This too is not always the
case, but yet desirable given the importance of development in the early years.
a
b
c
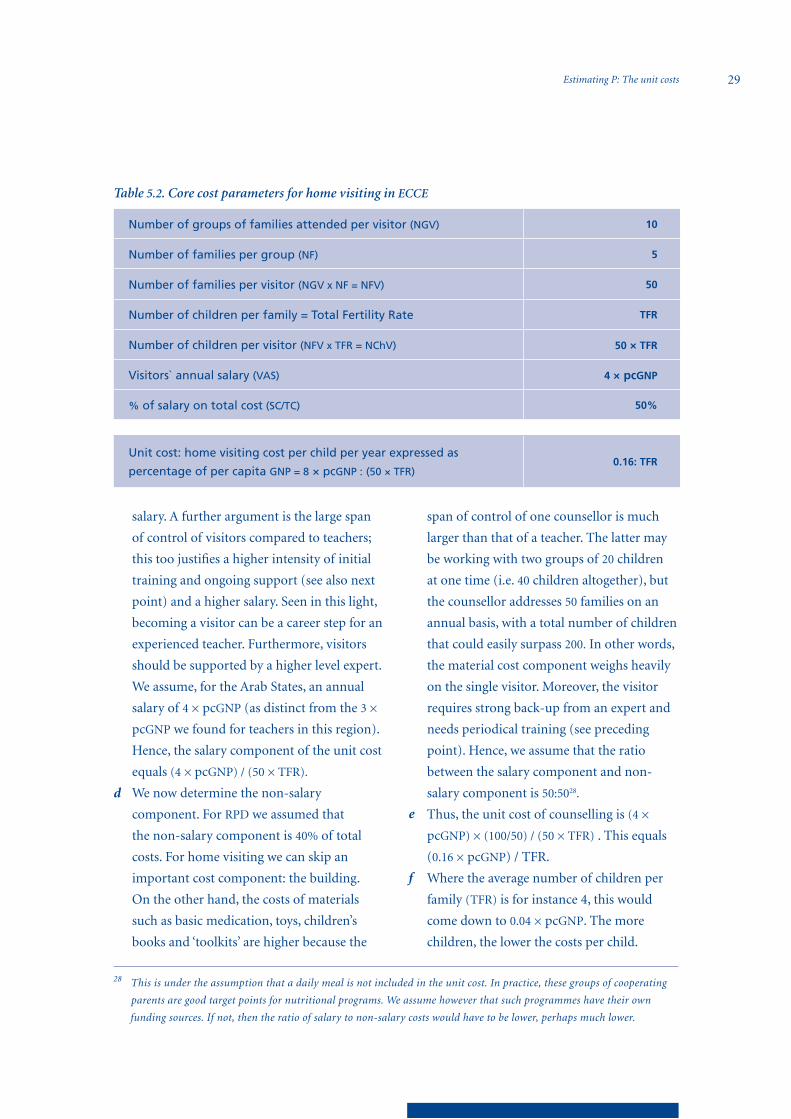
29Estimating P: The unit costs
salary. A further argument is the large span
of control of visitors compared to teachers;
this too justifies a higher intensity of initial
training and ongoing support (see also next
point) and a higher salary. Seen in this light,
becoming a visitor can be a career step for an
experienced teacher. Furthermore, visitors
should be supported by a higher level expert.
We assume, for the Arab States, an annual
salary of 4 × pcGNP (as distinct from the 3 ×
pcGNP we found for teachers in this region).
Hence, the salary component of the unit cost
equals (4 × pcGNP) / (50 × TFR).
We now determine the non-salary
component. For RPD we assumed that
the non-salary component is 40% of total
costs. For home visiting we can skip an
important cost component: the building.
On the other hand, the costs of materials
such as basic medication, toys, children’s
books and ‘toolkits’ are higher because the
span of control of one counsellor is much
larger than that of a teacher. The latter may
be working with two groups of 20 children
at one time (i.e. 40 children altogether), but
the counsellor addresses 50 families on an
annual basis, with a total number of children
that could easily surpass 200. In other words,
the material cost component weighs heavily
on the single visitor. Moreover, the visitor
requires strong back-up from an expert and
needs periodical training (see preceding
point). Hence, we assume that the ratio
between the salary component and non-
salary component is 50:5028.
Thus, the unit cost of counselling is (4 ×
pcGNP) × (100/50) / (50 × TFR) . This equals
(0.16 × pcGNP) / TFR.
Where the average number of children per
family (TFR) is for instance 4, this would
come down to 0.04 × pcGNP. The more
children, the lower the costs per child.
d
Table 5.2. Core cost parameters for home visiting in ECCE
Number of groups of families attended per visitor (NGV) 10
Number of families per group (NF) 5
Number of families per visitor (NGV x NF = NFV) 50
Number of children per family = Total Fertility Rate TFR
Number of children per visitor (NFV x TFR = NChV) 50 × TFR
Visitors` annual salary (VAS) 4 × pcGNP
% of salary on total cost (SC/TC) 50%
Unit cost: home visiting cost per child per year expressed as
percentage of per capita GNP = 8 × pcGNP : (50 × TFR) 0.16: TFR
e
f
28 This is under the assumption that a daily meal is not included in the unit cost. In practice, these groups of cooperating
parents are good target points for nutritional programs. We assume however that such programmes have their own
funding sources. If not, then the ratio of salary to non-salary costs would have to be lower, perhaps much lower.

30
The combination of these parameters results in
the unit cost (expressed as percentage of pcGNP)
according to the following formula:
Unit cost outcomes for RPD and home visiting
In the previous sections, we presented the
formulae for the calculation of the unit costs of
Unit cost (in US$ 2003)
RPD Home visiting
Algeria 267 122
Bahrain 1718 814
Djibouti 102 23
Egypt 145 56
Iraq … …
Jordan 239 85
Kuwait 2,178 1,032
Lebanon 710 413
Libyan Arab Jamahiriya 521 222
Mauritania 58 13
Morocco 190 90
Occupied Palestinian Territory 128 29
Oman 1075 275
Qatar 3,482 1,393
Saudi Arabia 1,150 327
Sudan 64 19
Syrian Arab Republic 147 57
Tunisia 318 203
United Arab Emirates 2,739 1,252
Yemen 70 13
Table 5.3. Annual unit cost per modality and country
Source: Authors own calculations based on GDP per capita information taken from the World Development Indicators
(World Bank, 2006)
RPD and home visiting, in both cases depending
on pcGNP, and in the case of home visiting also
depending on the average number of children per
family, proxied by the TFR. We can now substitute
observed values for the two variables – pcGNP
and TFR – for the countries where the relevant
data are available, so we can express the unit costs
in concrete US$ , as can be seen in Table 5.3.
As Table 5.3 clearly shows, unit costs expressed
in US$ are high in the richer countries, but can

31Estimating P: The unit costs
be very low in poor countries. This is especially
the case for home visiting. The difference
between home visiting and RPD appears to
be moderate in countries such as Tunisia and
Lebanon where the TFR is as low as 2.0 and
2.2, respectively. But this difference is large in
countries where the TFR is above 5: Djibouti,
Mauritania, Oman, Occupied Palestinian
Territory and Yemen. Not surprisingly, the
combination of a low pcGNP and a high
TFR produces very low unit costs for home
visiting in Yemen and Mauritania (US$13), in
Sudan (US$19), in Djibouti (US$23) and in the
Occupied Palestinian Territory (US$29).
It can also be concluded that the unit cost of
home visiting for the Arab region is on average
about 4.45% of pcGDP (the TFR for the region
stood at 3.6 over the period 2000–2005, so the
unit cost is 16% / 3.6 = 4.45%). Compared with
the unit cost of 12.5% of RPD, home visiting
seems three times less expensive. This is
generally consistent with the findings of Myers
(1987).
Thus, much can be done with relatively little
money to improve the education of young
children in those countries where poverty goes
hand in hand with low enrolments. However,
this is just an initial impression; we will return
to funding issues after having discussed the
numbers of children to be served (Q) in the
following chapter, and the outcomes of the
costing exercise in the chapter thereafter.


33
This chapter aims to establish the number of
children to be served. As was noted in Chapter
2 this is essentially a political issue, to be
determined by the governments of the countries
themselves. But we resolve this by holding on to
the text of Goal One, which calls for prioritising
the most vulnerable and disadvantaged children.
So the question is: how can we identify these
children?
Two groups of children come to mind. First,
children affected by conflict and disaster.
Second, children who grow up in extreme
poverty. We will focus on the latter, since the
former are difficult to address, for reasons
explained in the introduction of this report.
The most direct way of establishing the
numbers of children living in poverty is by
using international statistics regarding the
number of people living on under US$ 2 per
day. This, however, has proven impossible
since too many of the countries lack these data.
Using countries’ own data in this regard is not
a good option since countries use different
standards. Therefore, we shall use proxies of
poverty instead. We do this by focusing on
(i) children who are undernourished and (ii)
children of illiterate parents. The arguments
for the choice of these two proxies will be given
later in this chapter; school-readiness will be the
leading concept. First we will examine present
enrolment levels in ECCE in the individual
countries, preceded by a brief assessment of
their contextual diversity.
Contextual diversity
In economic terms, the Arab region shows
considerable contrasts. Some of the oil
producing countries in the region are among
the biggest oil exporters in the world and are
members of the influential Organization of
Petroleum Exporting Countries (OPEC). These
countries are Algeria, Iraq, Kuwait, Libyan
Arab Jamahiriya, Qatar, Saudi Arabia and
the United Arab Emirates. As a consequence,
a big proportion of the region’s total GDP is
concentrated in these countries, which also
show high levels of per capita GDP. Conversely,
the region also embraces some very poor
countries such as Mauritania, Sudan and Yemen.
Table 6.1 presents the differences across the
Arab States in terms of levels of income and
development. The World Bank classifies five
states as high income countries, ten as middle
income and three as low income. In general,
there is a high correspondence between
income levels and a country’s place on the
Human Development Index (HDI) 200529. All
the countries with upper middle income or
Chapter 6: Estimating Q: The numbers of children to be served
29 The Human Development Index (HDI) incorporates indices on life expectancy at birth, adult literacy, enrolment in
formal education, and GDP per capita. See table 3 in UNDP (2005).
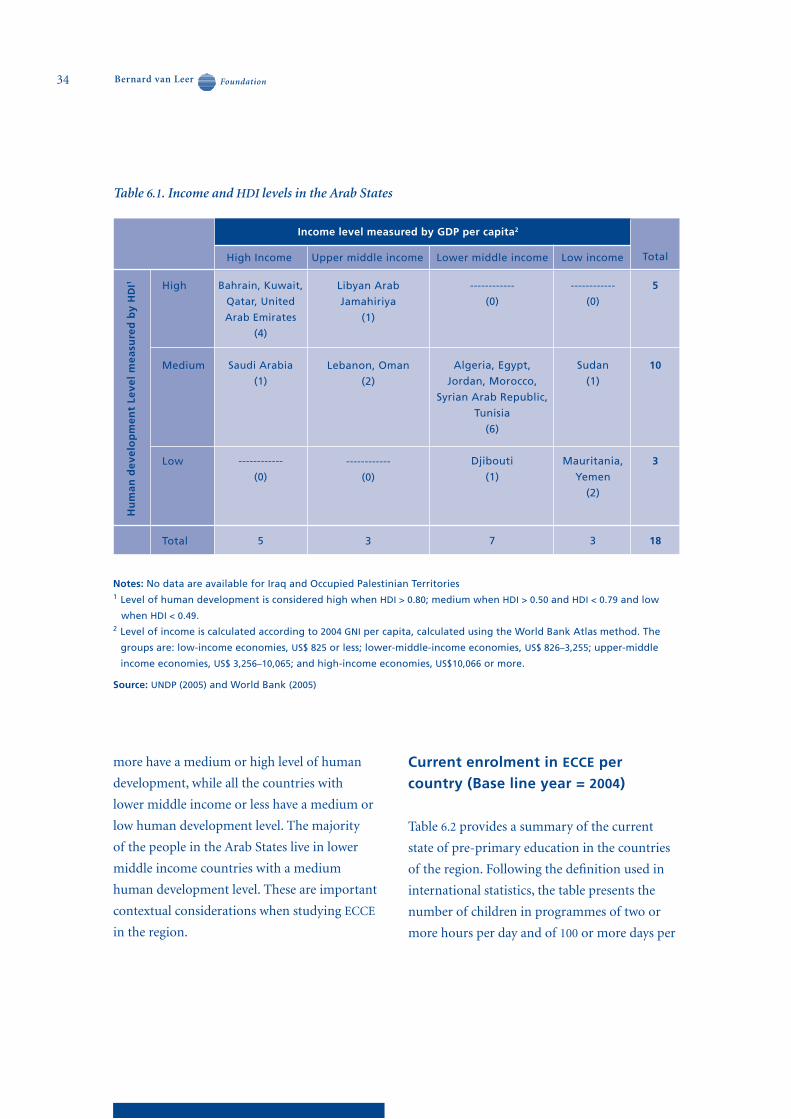
34
more have a medium or high level of human
development, while all the countries with
lower middle income or less have a medium or
low human development level. The majority
of the people in the Arab States live in lower
middle income countries with a medium
human development level. These are important
contextual considerations when studying ECCE
in the region.
Current enrolment in ECCE per
country (Base line year = 2004)
Table 6.2 provides a summary of the current
state of pre-primary education in the countries
of the region. Following the definition used in
international statistics, the table presents the
number of children in programmes of two or
more hours per day and of 100 or more days per
Table 6.1. Income and HDI levels in the Arab States
Notes: No data are available for Iraq and Occupied Palestinian Territories1 Level of human development is considered high when HDI > 0.80; medium when HDI > 0.50 and HDI < 0.79 and low
when HDI < 0.49.2 Level of income is calculated according to 2004 GNI per capita, calculated using the World Bank Atlas method. The
groups are: low-income economies, US$ 825 or less; lower-middle-income economies, US$ 826–3,255; upper-middle
income economies, US$ 3,256–10,065; and high-income economies, US$10,066 or more.
Source: UNDP (2005) and World Bank (2005)
Income level measured by GDP per capita2
High Income Upper middle income Lower middle income Low income Total
Hu
ma
n d
ev
elo
pm
en
t Le
ve
l m
ea
sure
d b
y H
DI1 High
Medium
Low
Total
Bahrain, Kuwait,
Qatar, United
Arab Emirates
(4)
Saudi Arabia
(1)
------------
(0)
5
Libyan Arab
Jamahiriya
(1)
Lebanon, Oman
(2)
------------
(0)
3
------------
(0)
Algeria, Egypt,
Jordan, Morocco,
Syrian Arab Republic,
Tunisia
(6)
Djibouti
(1)
7
------------
(0)
Sudan
(1)
Mauritania,
Yemen
(2)
3
5
10
3
18
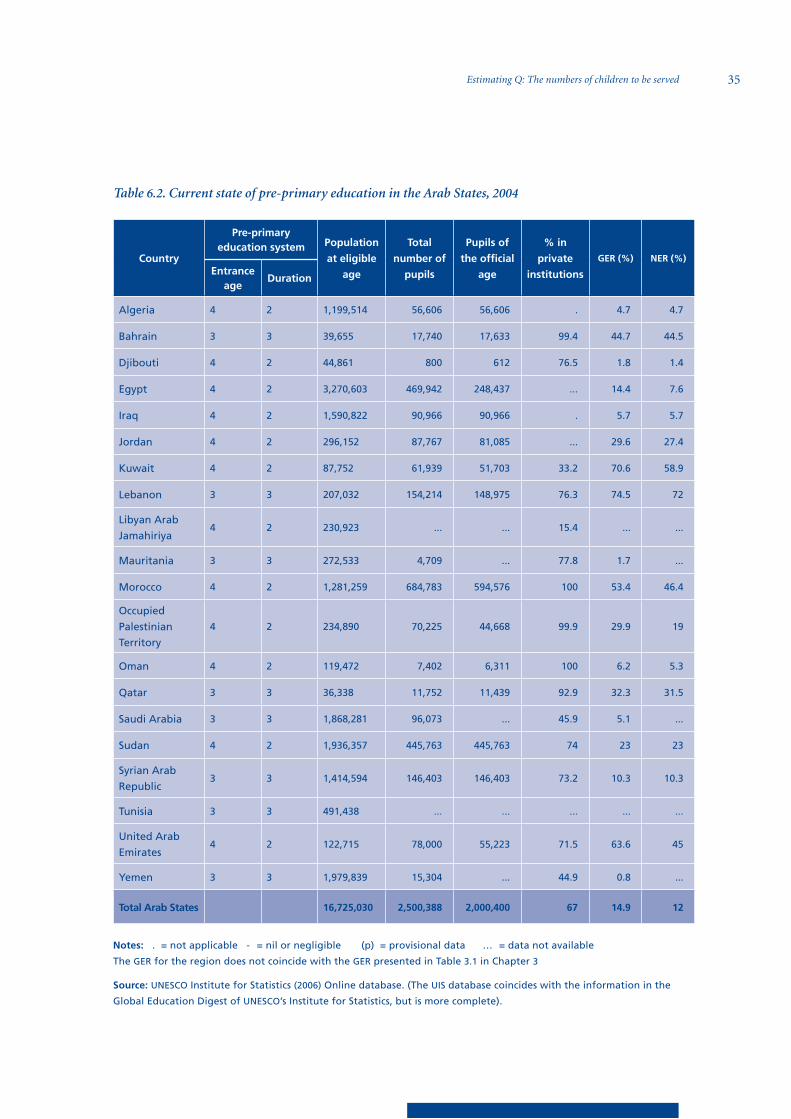
35Estimating Q: The numbers of children to be served
Country
Pre-primary education system Population
at eligible
age
Total
number of
pupils
Pupils of
the official
age
% in
private
institutions
GER (%) NER (%)Entrance
ageDuration
Algeria 4 2 1,199,514 56,606 56,606 . 4.7 4.7
Bahrain 3 3 39,655 17,740 17,633 99.4 44.7 44.5
Djibouti 4 2 44,861 800 612 76.5 1.8 1.4
Egypt 4 2 3,270,603 469,942 248,437 ... 14.4 7.6
Iraq 4 2 1,590,822 90,966 90,966 . 5.7 5.7
Jordan 4 2 296,152 87,767 81,085 ... 29.6 27.4
Kuwait 4 2 87,752 61,939 51,703 33.2 70.6 58.9
Lebanon 3 3 207,032 154,214 148,975 76.3 74.5 72
Libyan Arab
Jamahiriya4 2 230,923 ... ... 15.4 ... ...
Mauritania 3 3 272,533 4,709 ... 77.8 1.7 ...
Morocco 4 2 1,281,259 684,783 594,576 100 53.4 46.4
Occupied
Palestinian
Territory
4 2 234,890 70,225 44,668 99.9 29.9 19
Oman 4 2 119,472 7,402 6,311 100 6.2 5.3
Qatar 3 3 36,338 11,752 11,439 92.9 32.3 31.5
Saudi Arabia 3 3 1,868,281 96,073 ... 45.9 5.1 ...
Sudan 4 2 1,936,357 445,763 445,763 74 23 23
Syrian Arab
Republic 3 3 1,414,594 146,403 146,403 73.2 10.3 10.3
Tunisia 3 3 491,438 ... ... ... ... ...
United Arab
Emirates 4 2 122,715 78,000 55,223 71.5 63.6 45
Yemen 3 3 1,979,839 15,304 ... 44.9 0.8 ...
Total Arab States 16,725,030 2,500,388 2,000,400 67 14.9 12
Table 6.2. Current state of pre-primary education in the Arab States, 2004
Notes: . = not applicable - = nil or negligible (p) = provisional data … = data not available
The GER for the region does not coincide with the GER presented in Table 3.1 in Chapter 3
Source: UNESCO Institute for Statistics (2006) Online database. (The UIS database coincides with the information in the
Global Education Digest of UNESCO’s Institute for Statistics, but is more complete).

36
30 It should also be said that it is not known to what extent children formally enrolled are actually attending the programme.
Some household surveys do report this type of information, but such data have not been found for the Arab States. 31 Egypt, Kuwait, Morocco, Occupied Palestinian Territory, United Arab Emirates.
year, and includes only children of 3 years and
older. From this it is evident that these statistics
do not indicate precisely how substantial the
services are that the children actually receive.
This is important to bear in mind when
comparing figures between countries.
Two systems are observed which divide the
countries into two groups. On the one hand,
there are 12 countries where the entry age is 4
years old with a two year-duration. On the other
hand, eight countries established the entry age
at 3 years old, in all cases with a duration of
three years. As a result, in all the Arab States the
entrance age to primary education is 6 years old,
but the children that enter first grade arrive with
a different number of years spent in ECCE, and
in many cases with no ECCE experience at all
since it is not part of the compulsory education
in any of these countries.
The population at the eligible age for ECCE
(depending on countries’ own legislation) in
the whole region is almost 17 million children.
The reported data concern the NER, which
excludes children who enter earlier or later
than the typical age. These data show that only
12% of the eligible children in the Arab States
are actually enrolled in pre-primary education.
Equally important, the GER value indicates that
the education system enrols only 15% of eligible
children leaving out the remaining 85%30.
Data at country level reveals considerable
variation in enrolment ratios. In eight countries,
Algeria, Djibouti, Iraq, Mauritania, Oman,
Saudi Arabia, Syrian Arab Republic and Yemen,
the GER is under 11%. In contrast, there are
four countries where the GER is higher than
50% – Kuwait, Lebanon, Morocco, United Arab
Emirates – but none of them reach the level
of developed countries, which is around 80%
(UNESCO, 2005a). The remaining six countries
with data available have an average GER of
25%. Within countries, too, there are important
regional disparities. Although it is not possible
to address these in this paper, the situation in
Sudan can serve as an example. In one state,
enrolment is as low as 8% with another three
states scoring not far above 10%, while on the
other side of the spectrum there are four other
states with enrolment levels in the order of 30%,
one state with 44%, and one with 58%. Few states
are near the national average which is, according
to this source, 22% (Basheer, 2005).
As opposed to the GER, the NER excludes
children who enter earlier or later than the
eligible age. Timely enrolment is perhaps even
more important for ECCE than it is for primary
education, since ECCE curricula and activities
are (or should be) sharply tailored to the stage
of development in which the child finds itself.
Generally speaking, in the majority of the
countries, the NER level is very close to the GER
level denoting that the under-aged and over-
aged children make up but a small proportion.
Only in five countries does the GER exceed the
NER by more than 5%31.

37Estimating Q: The numbers of children to be served
As mentioned in Chapter 3, the majority of
the children are enrolled in institutions that
are privately managed. Two thirds of all the
pupils attend institutions that are not run by
the government. It is important to know that
this category includes not just the for-profit
organisations that offer ECCE, but also religious
organisations and NGOs; it only excludes public
provision. Information of this kind is available
for 15 countries. In five countries, Bahrain,
Morocco, Oman, Occupied Palestinian Territory
and Qatar, virtually all of the ECCE system is
private, and in other countries the private share
is higher than 70%. Libyan Arab Jamahiriya
is the only country where the private sector
represents a minor proportion, at 15% of total
enrolment. Figure 6.1 shows the GER and % of
students in private institutions. The bottom left
of the figure indicates a positive relationship
between the private sector and enrolment. In
countries where the private share is low, the GER
tends to be low as well; Kuwait seems to be the
only country in the region that combines a large
public ECCE sector with substantial enrolment.
Analysis of the current situation shows that the vast
majority of children in the Arab States are being
left out of pre-primary education. Additionally,
the relatively small number of children who do
have access to some kind of ECCE programme
tend to be enrolled in private institutions where
parents are likely to have to pay a fee.
Figure 6.1 Gross enrolment ratios in pre-primary education and % of students in private institutions.
Source: UNESCO Institute for Statistics (2006) online database.
80
70
60
50
40
30
20
10
0
0 20 40 60 80 100 120
GER
in p
re-p
rim
ary
edu
cati
on
(%
)
% in private institutions
KuwaitLebanon
United Arab Emirates
Morocco
Bahrain
Occupied Palestinian Territories
Oman
Qatar
Sudan
Syrian Arab Republic
MauritaniaDjibouti
Yemen
Saudi Arabia
38
Table 6.3 gives details on the children of
eligible age that were out of the ECCE system
in 2004. Enrolment data for 18 out of the 20
countries show that about 14 million children
were out of the system. Almost 90% of them
are concentrated in eight countries, all with
more than one million children out of the
system (Algeria, Egypt, Iraq, Saudi Arabia,
Sudan, Syrian Arab Republic, Yemen). With
the exception of Sudan, all these countries have
a NER of 10% or lower. In contrast, there are
six countries where the number of children is
lower than 100,000 (Bahrain, Djibouti, Kuwait,
Lebanon, Qatar, United Arab Emirates). With
the exception of Djibouti, all these countries
show relatively higher enrolment ratios than the
average but also are less populated.
These figures show the scale of the overall
challenge. However, it is important to
distinguish those who are currently most in
need, and hence who should be prioritised in
an expansion strategy. This is the aim of the
following two sections.
School-readiness: Nutrition as the
cornerstone
The generally low level of enrolment in ECCE
in the Arab States is more worrisome in light
of a study by Jaramillo and Mingat (2006)
which indicates that a crucial function of early
interventions is to prepare children for entry
into primary school. Children who enter school
not yet ready to learn, whether because of lack
of academic skills or social and emotional
deficits, will continue to have difficulties later in
their learning trajectories (Rouse et al., 2005).
If we understand ECCE as a key factor in getting
children ready for school it is crucial to identify
those categories of children who are presently
least ready, and therefore most in need. In order
to do that, we will use the ‘school readiness’
concept to help us distinguish and quantify
those children who should be addressed first,
once again mindful of the text of EFA Goal
One which draws our attention to the most
vulnerable and disadvantaged children.
Although most research focuses on academic
skills, such as vocabulary size, complexity of
spoken language, etc., readiness for school also
requires social and emotional skills. Children
must be able to follow directions, work with
a group, engage in classroom tasks and exert
impulsive control (Rouse et al., 2005). In
other words, as Rouse et al. claim, “school
readiness is more than what children know:
it is multidimensional. Children’s ability to
learn goes beyond cognitive development and
includes physical, social, and emotional health
as well as general approaches to learning”.
According to KIDS COUNT (2005) there are
at least five important dimensions related to
school readiness which interact and affect a
child’s ability to learn and to succeed in school:
Physical well-being and motor development: general health and growth;
gross and fine motor skills; and the absence
of unattended physical conditions or
exposure to toxic substances.
Social and emotional development: ability
to interact socially, take turns and cooperate;
1.
2.

39Estimating Q: The numbers of children to be served
Table 6.3 Number of children out of the ECCE system in 2004
Notes:1 In these countries since there is no data on pupils at the official ECCE age, the ratios shown are GER instead of NER.
Also total pupils are considered for the estimation of the number of children out of the ECCE system.
Source: UNESCO Institute for Statistics (2006) online database
Country
Age
group
2002/03
Population
at eligible
age (A)
Total number
of pupils
enrolled in
ECCE
Number of
children of
official age
(B)
NER
Number of
children at eligible
age, out of the
ECCE system
(A) – (B)
Algeria 4–5 1,199,514 56,606 56,606 4.7 1,142,908
Bahrain 3–5 39,655 17,740 17,633 44.5 22,022
Djibouti 4–5 44,861 800 612 1.4 44,249
Egypt 4–5 3,270,603 469,942 248,437 7.6 3,022,166
Iraq 4–5 1,590,822 90,966 90,966 5.7 1,499,856
Jordan 4–5 296,152 87,767 81,085 27.4 215,067
Kuwait 4–5 87,752 61,939 51,703 58.9 36,049
Lebanon 3–5 207,032 154,214 148,975 72.0 58,057
Libyan Arab Jamahiriya 4–5 230,923 ... ... ... ...
Mauritania1 3–5 272,533 4,709 ... 1.7 267,824
Morocco 4–5 1,281,259 684,783 594,576 46.4 686,683
Occupied Palestinian
Territory4–5 234,890 70,225 44,668 19.0 190,222
Oman 4–5 119,472 7,402 6,311 5.3 113,161
Qatar 3–5 36,338 11,752 11,439 31.5 24,899
Saudi Arabia1 3–5 1,868,281 96,073 ... 5.1 1,772,208
Sudan 4–5 1,936,357 445,763 445,763 23.0 1,490,594
Syrian Arab Republic 3–5 1,414,594 146,403 146,403 10.3 1,268,191
Tunisia 3–5 491,438 ... ... ... ...
United Arab Emirates 4–5 122,715 78,000 55,223 45.0 67,492
Yemen1 3–5 1,979,839 15,304 ... 0.8 1,964,535
Total for Arab States 16,725,030 2,500,388 2,000,400 12.0 13,886,183

40
positive sense of self worth and ability; and
the ability to interpret and express feelings.
Language development: verbal language,
including listening, speaking and vocabulary;
emerging literacy, including print awareness
(assigning sounds to letter combinations),
story sense (recognising story elements) and
writing process (representing ideas through
drawing, letter-like shapes, or letters).
Approaches to learning: enthusiasm,
curiosity and persistence in completing tasks.
Cognition and general knowledge: understanding of shapes and spatial
relationships; knowledge of social conventions
such as holidays; and knowledge derived from
looking across objects, events or people for
similarities, differences and associations.
School readiness involves more than just children.
In the broadest sense it is about children, families,
early environments, schools and communities.
Children are not innately ready or not ready
for school. Their skills and development are
strongly influenced by their families and
through their interaction with other people
and environments before coming to school
(Maxwell and Clifford, 2004). Thus, factors that
influence children’s readiness for success in
school are socio-economic status (which often
interacts with race or ethnicity); child’s health;
family background characteristics, particularly
the mother’s education level and mental health;
and the home environment. Participation in
some type of pre-school programme is not only
an additional factor that influences positively
children’s readiness, but it can also be argued
that it could be crucial to make a difference for
the most disadvantaged children who belong to
poorer families and grow up in less stimulating
environments.
There have been attempts to operationalise
the school readiness concept. In the US, a
partnership between 17 States undertook an
interesting project to create a set of measurable
indicators related to and defining school
readiness that can be tracked regularly over
time at the state and local levels (KIDS COUNT,
2005). The School Readiness Indicators Initiative
created the ‘Ready Child Equation’ to describe
the range of components that influence a child’s
ability to be ready for school. This includes:
i) ready families which describes children’s
family context and home environment; ii)
ready communities, which focuses on the
community resources and support available to
families with young children, iii) ready services
which describes the availability, quality and
affordability of proven programs that influence
child development and school readiness;
and finally iv) ready schools which describes
critical elements of schools that influence child
development and school success.
For the Arab States, however, we unfortunately
lack the data for these components of school-
readiness. Therefore, we have no choice but to
use a proxy, i.e. an indicator that best captures the
relevant aspect and can be used in the absence of
a more direct indicator of that aspect. Because of
3.
4.
5.

41Estimating Q: The numbers of children to be served
the nature of the present study we have selected
children’s nutrition as a first proxy to quantify the
number of children that are most in need.
The key argument is that undernourishment
is usually associated with poverty, low parental
education status and home environments that
do not stimulate learning. The plight is largely
invisible: three quarters of the children who die
from causes related to malnutrition were only
mildly or moderately undernourished, showing
no outward sign of their vulnerability. Good
nutrition is the corner-stone for survival, health
and development for current and succeeding
generations. Well-nourished children perform
better in school, grow up to become healthy
adults and in turn give their children a better
start in life. Undernourished children have
lowered resistance to infection; they are more
likely to die from common childhood ailments
like diarrhoeal diseases and respiratory
infections, and for those who survive, frequent
illness saps their nutritional status, locking
them into a vicious cycle of recurring sickness
and faltering growth (www.childinfo.org/
areas/malnutrition). It should be emphasised,
however, that nutrition is a necessary but not
sufficient condition for healthy development.
Some children grow up in poverty but are
nevertheless well-nourished; the poverty factor
will then dominate the nourishment factor, so
that the child is still at risk of lagging behind.
Table 6.4 presents estimates for the Arab
States of the number of children that are
most in need of an ECCE program, judged by
their nutritional condition. The estimation
is based on three malnutrition indicators
– underweight, stunting and wasting – to
estimate the percentage of children of pre-
primary school age which are at physical
disadvantage and therefore should receive
priority in policies to expand ECCE.
It can be seen from column E of Table 6.4
that a fairly high proportion of children are
undernourished in the Syrian Arab Republic
(33%), Morocco (27%), Djibouti (19%), Jordan,
Lebanon, Sudan and Yemen (all 15%), and in
Algeria, Oman and the Occupied Palestinian
Territory (all 12%). Assuming that the same
percentage of the total eligible population
(column A) has the same nutritional condition
as the under 5s it is possible to estimate the
number of children of eligible age who are
undernourished (column F). Thus, it can be
said that in the whole region there are more
than more than 2 million children of ECCE
eligible age who are undernourished. The
highest numbers are found in Egypt, Morocco,
Sudan, Syrian Arab Republic and Yemen.
These five countries all have more than 300,000
undernourished children and they contain
almost 80% of the undernourished children of
eligible age living in the region.
We have compared these absolute numbers
of undernourished children with two other
relevant figures (Table 6.5). First, we assume
that all undernourished children are out of the

42
Table 6.4. Estimates of the number of pre-primary age children that are most in need, 2004
Country
Population
of eligible
age (A)
% of under-5s (1996-2005) suffering from (moderate & severe): Estimated number
of children of pre-
primary eligible
age which are
undernourished (F)Underweight (B) Stunting (C) Wasting (D)
Unweighted
average (E)
Algeria 1,199,514 10 19 8 12 147,940
Bahrain 39,655 9 10 5 8 3,172
Djibouti 44,861 18 26 13 19 8,524
Egypt 3,270,603 9 16 4 10 316,158
Iraq 1,590,822 … … … … …
Jordan 296,152 16 22 6 15 43,436
Kuwait 87,752 4 9 2 5 4,388
Lebanon 207,032 10 24 11 15 31,055
Libyan Arab
Jamahiriya230,923 3 12 3 6 13,855
Mauritania 272,533 5 15 3 8 20,894
Morocco 1,281,259 32 35 13 27 341,669
Occupied
Palestinian
Territory
234,890 10 18 9 12 28,970
Oman 119,472 18 10 7 12 13,938
Qatar 36,338 4 9 3 5 1,938
Saudi Arabia 1,868,281 6 8 2 5 99,642
Sudan 1,936,357 14 20 11 15 290,454
Syrian Arab
Republic1,414,594 41 43 16 33 471,531
Tunisia 491,438 7 18 4 10 47,506
United Arab
Emirates122,715 4 12 2 6 7,363
Yemen 1,979,839 14 17 15 15 303,575
Total for
Arab States16,725,030 2,196,008

43Estimating Q: The numbers of children to be served
pre-primary system32, and we divide them by
the total number of children of eligible age that
are currently out of the pre-primary system
(5th column). This indicator represents the
undernourished children as a proportion of the
whole ECCE challenge. In other words it reflects
the proportion of all the children who are
not enrolled that each country would need to
address in order to provide an ECCE programme
to all the undernourished children. From the
table it can be seen that in 11 countries, getting
all the undernourished children in an ECCE
program represents less than 15% of the whole
ECCE challenge33. In contrast, in Lebanon,
Morocco and the Syrian Arab Republic the
undernourished represent around half of the
ECCE challenge in the country.
Second, the number of undernourished
children of pre-primary eligible age is divided
by the total number of pupils in pre-primary
education. This indicator, presented in the last
column of Table 6.5, relates undernourishment
with the current size of the pre-primary
education system. There are seven countries
where the value is higher than one: Algeria,
Djibouti, Mauritania, Oman, Saudi Arabia,
Syrian Arab Republic and Yemen. In these
countries the number of undernourished
children of pre-primary education eligible age
exceeded the current number of pupils in the
system. For instance, in Yemen, there were more
than 300,000 children with nutrional problems
compared with the 15,000 pupils in pre-primary
education which means that the system would
Notes:
(A) Population of eligible age for pre-primary school
(B) Proportion of under-5s falling below minus 2 standard deviations (moderate) and minus 3 standard deviations (severe)
from the median weight-for-age of the reference population
(C) Proportion of under-5s falling below minus 2 and minus 3 standard deviations from the median height-for-age of the
reference population
(D) Proportion of under-5s falling below minus 2 and minus 3 standard deviations from the median weight-for-height of
the reference population
(E) (B+C+D)/3
(F) (E) * (A)
Source: UNESCO Institute for Statistics (2006); UNICEF (2006)
32 This assumption is defensible, but it must be said that it is not entirely sure that it holds true in each and every country.
If we look at Algeria in Table 6.5 we see a very small number of enrolled children and a very large number of not enrolled
children and based on the above assumption a number of undernourished children that is about 13% of the not enrolled.
In this case it is very unlikely that a significant number of undernourished children is among the happy few that is
enrolled. A lesser degree of likelihood exists for Lebanon and Morocco, where a relatively large number of children is
enrolled, and where the number of undernourished children comes closer to the number of not enrolled than in the case
of Algeria. Generally, however, the Algerian pattern seems dominant in the region.33 Algeria, Bahrain, Egypt, Kuwait, Mauritania, Occupied Palestinian Territory, Oman, Qatar, Saudi Arabia, United Arab
Emirates and Yemen.
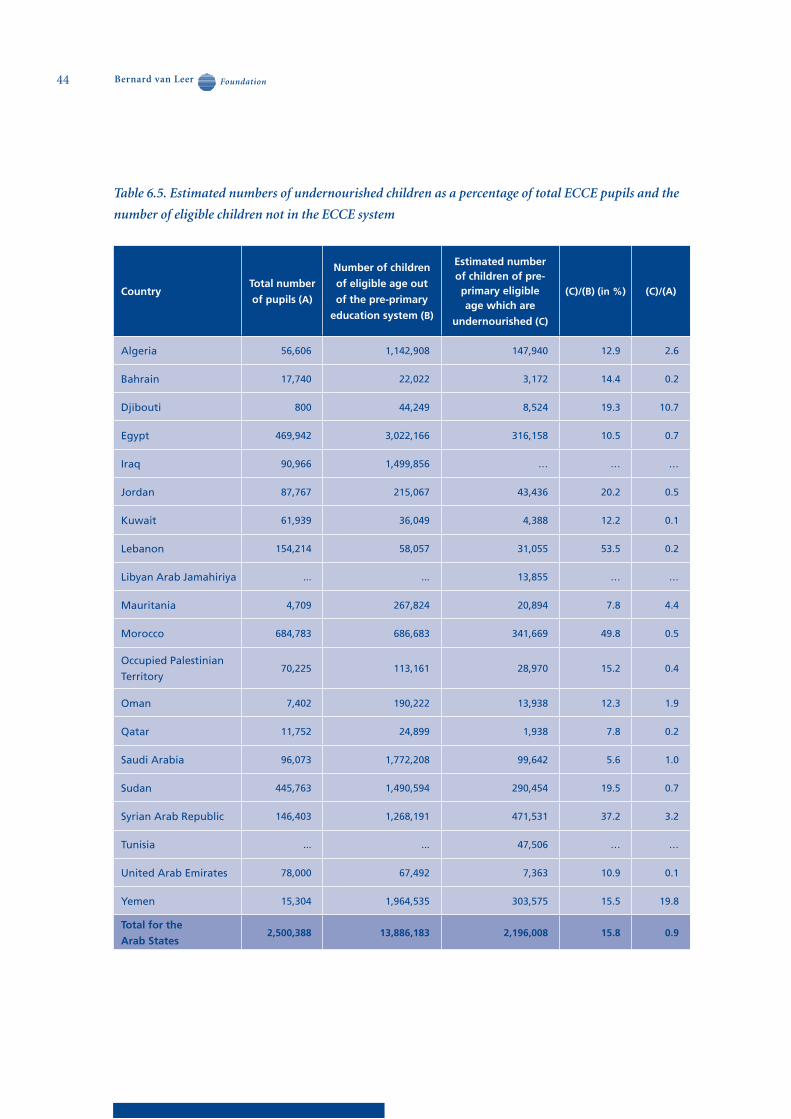
44
Table 6.5. Estimated numbers of undernourished children as a percentage of total ECCE pupils and the
number of eligible children not in the ECCE system
CountryTotal number
of pupils (A)
Number of children
of eligible age out
of the pre-primary
education system (B)
Estimated number of children of pre-primary eligible age which are
undernourished (C)
(C)/(B) (in %) (C)/(A)
Algeria 56,606 1,142,908 147,940 12.9 2.6
Bahrain 17,740 22,022 3,172 14.4 0.2
Djibouti 800 44,249 8,524 19.3 10.7
Egypt 469,942 3,022,166 316,158 10.5 0.7
Iraq 90,966 1,499,856 … … …
Jordan 87,767 215,067 43,436 20.2 0.5
Kuwait 61,939 36,049 4,388 12.2 0.1
Lebanon 154,214 58,057 31,055 53.5 0.2
Libyan Arab Jamahiriya ... ... 13,855 … …
Mauritania 4,709 267,824 20,894 7.8 4.4
Morocco 684,783 686,683 341,669 49.8 0.5
Occupied Palestinian
Territory 70,225 113,161 28,970 15.2 0.4
Oman 7,402 190,222 13,938 12.3 1.9
Qatar 11,752 24,899 1,938 7.8 0.2
Saudi Arabia 96,073 1,772,208 99,642 5.6 1.0
Sudan 445,763 1,490,594 290,454 19.5 0.7
Syrian Arab Republic 146,403 1,268,191 471,531 37.2 3.2
Tunisia ... ... 47,506 … …
United Arab Emirates 78,000 67,492 7,363 10.9 0.1
Yemen 15,304 1,964,535 303,575 15.5 19.8
Total for the
Arab States2,500,388 13,886,183 2,196,008 15.8 0.9

45Estimating Q: The numbers of children to be served
need to be 20 times larger to accomodate
all these children. In contrast, there are ten
countries where the situation is the opposite.
In Bahrain, Egypt, Jordan, Kuwait, Lebanon,
Morocco, Occupied Palestinian Territory,
Qatar, Sudan and the United Arab Emirates the
inclusion of the undernourished would require
an expansion which is significantly lower either
because the percentage of undernourished
children is low or the pre-primary education
system is relatively large.
In fact, there is a strong tendency that countries
with the largest numbers of undernourished
children have the smallest ECCE capacity, as
shown in Figure 6.2. The evidence presented
here shows that where ECCE is most needed, the
level of enrolment is low and policies to reach
out to those children are imperative.
The second step: Reaching children
with illiterate parents
As mentioned earlier, we need to think in
terms of a phased approach: first reaching out
for the most disadvantaged children, and then
moving towards a second group of slightly less
disadvantaged children. And since at the other
end of the spectrum the provision for the more
advantaged children expands autonomously
Figure 6.2: Percentage of undernourished children by pre-primary NER, per country, 2004
Note: Lebanon and Morocco are not included in the figure since they are outliers.
Sources: UNESCO Institute of Statistics (2006) online database; UNICEF (2006)
70
60
50
40
30
20
10
0
-10
0 5 10 15 20 25 30 35
NER
in p
re-p
rim
ary
edcu
atio
n (
in %
)
% of undernourished children of pre-primary education eligible age
Kuwait
y=-23,996Ln(x) + 80,705
R2 = 0,503
United Arab Emirates
Jordan
Bahrain
Oman
Qatar
Sudan
Syrian Arab RepublicEgypt
Djibouti
Algeria
Occupied Palestinian Territories

46
– driven by their parents demands and their
purchasing power – there will be universal
provision when the two movements meet. So
how can we determine the next step?
As was argued at the beginning of this chapter,
direct and internationally comparable measures
of poverty are not available, so we have to rely
on proxy measures that are available. The first
proxy that we chose was undernourishment.
The second is illiteracy, the argument being
that illiteracy, too, is strongly associated with
a number of forms of disadvantage, including
poor parenting skills and unfavourable
environments for children to grow up. The GMR
on literacy thoroughly reviewed the evidence
in this regard (UNESCO, 2005a). In order to use
illiteracy as the basis for the second phase, the
number of children with illiterate parents would
obviously have to be higher than the number
of undernourished children. The assumption
is then that all undernourished children have
illiterate parents, while in addition there are
children with illiterate parents who are not
undernourished. By means of Table 6.6 we
investigate whether this approach is defensible.
Table 6.6. Percentage of undernourished children and adult illiteracy rate.
Note: Countries in bold are those with an illiteracy rate lower than the malnutrition rate.
Source: UNESCO (2005) and UNICEF (2006)
Country % of undernourished children Adult illiteracy rate (%)
Algeria 12.3 30.2
Bahrain 8.0 6.8
Djibouti 19.0 ...
Egypt 9.7 44.4
Iraq … …
Jordan 14.7 10.1
Kuwait 5.0 17.1
Lebanon 15.0 …
Libyan Arab Jamahiriya 6.0 18.3
Mauritania 7.7 48.8
Morocco 26.7 49.3
Occupied Palestinian Territory 12.3 8.1
Oman 11.7 25.6
Qatar 5.3 10.8
Saudi Arabia 5.3 20.6
Sudan 15.0 41
Syrian Arab Republic 33.3 17.1
Tunisia 9.7 25.7
United Arab Emirates 6.0 22.7
Yemen 15.3 51

47Estimating Q: The numbers of children to be served
In Table 6.6 we compare, for individual
countries in the Arab region, the percentage of
undernourished children with the percentage
of children with illiterate parents34. It appears
that for all but four of the countries, the latter
is higher – sometimes much higher – than the
former. The four countries that represent an
exception to this rule are in bold, and they are
home to less than 10% of the population of the
Arab States. All this suggests that illiteracy is not
a perfect second-stage proxy for vulnerability,
but nevertheless a defensible one.
In summary, we adopt reaching undernourished
children as Step 1 towards universal ECCE and
reaching the children of illiterate parents who
aren’t already captured in the first step as Step
2. We accept that in a few countries there will
be no need for Step 2 as Step 1 will cover all the
illiterate children as it is assumed that all are
already within the undernourished group.
The expansion scenario
We now have the ingredients to elaborate our
expansion scenario. Table 6.7 summarises
the following information for the individual
countries in the region:
the present GER in pre-primary education,
most probably the more advantaged children
the percentage of undernourished children,
assumed to be the most disadvantaged ones
the percentage of children of illiterate parents
the ‘target’ GER for the first step: this is the
total of the present GER plus the percentage
of undernourished children
the ‘target’ GER for the second step: this is
the total of the present GER plus the children
of illiterate parents, except in those countries
where their number is lower than that of the
undernourished children. In these countries,
the GER in Step 2 is capped to the level after
Step 1.
In those cases where the percentage of
undernourished children is available but where
the illiteracy rate is not available (Djibouti and
Lebanon) we also cut off the Step 2 target at the
level of Step 1. Once the literacy rate is available,
it can be inserted for these countries.
In Iraq, Libyan Arab Jamahiriya and Tunisia the
exercise cannot be carried out for lack of data.
We keep these countries in the exercise, and also
in the spreadsheet, hoping that more data will
be available later.
It must be noted, that in our exercise we simulate
that Step 1 is reached in 2010, and that Step 2 is
completed in 2015. The choice to complete Step 1
in 2010 and Step 2 in 2015 is of course an arbitrary
one. It is necessary to make a choice in order to do
this exercise, but in practice countries themselves
determine how fast to expand ECCE. For this
reason, the targets have also been made variable in
the spreadsheet and can be altered by the reader.
34 We work on the assumption that the percentage of children with illiterate parents is equal to the illiteracy rate. This
assumption possibly underestimates the number of children with illiterate parents, since non literate adults tend to have
more children on average than literate parents. We lack the data to control for this bias. Thus, it should be noted that
there is a tendency towards underestimation of the need for ECCE.
.
.
.
.
.

48
Algeria is a good example to illustrate the
expansion scenario. It presently has a low
level of enrolment of 4.72%, predominantly
among upper class children. At the other end
of the social spectrum we find that 12.3% of
children are undernourished. Reaching them
would bring the GER to a level of 17.1% in
2010, including a small ‘autonomous’ increase
Table 6.7. Current GER in pre-primary education and target GERs for 2010 and 2015
Source: UNESCO (2005) and UNICEF (2006).
Country
GER in
pre-primary
education
% of
undernourished
children
% of children with
illiterate parents
Target GER for
Step 1 (2010)
Target GER for
Step 2 (2015)
Algeria 4.72 12.3 30.2 17.1 34.9
Bahrain 44.74 8.0 6.8 52.7 52.7
Djibouti 1.78 19.0 … 20.8 …
Egypt 14.37 9.7 44.4 24.0 58.8
Iraq 5.72 … … … …
Jordan 29.64 14.7 10.1 44.3 44.3
Kuwait 70.58 5.0 17.1 75.6 87.7
Lebanon 74.49 15.0 … 89.5 …
Libyan Arab Jamahiriya … 6.0 18.3 … …
Mauritania 1.73 7.7 48.8 9.4 50.5
Morocco 53.45 26.7 49.3 80.1 80.1
Occupied Palestinian
Territory29.90 12.3 8.1 42.2 42.2
Oman 6.20 11.7 25.6 17.9 31.8
Qatar 32.34 5.3 10.8 37.7 43.1
Saudi Arabia 5.14 5.3 20.6 10.5 25.7
Sudan 23.02 15.0 41.0 38.0 64.0
Syrian Arab Republic 10.35 33.3 17.1 43.7 43.7
Tunisia … 9.7 25.7 … …
United Arab Emirates 63.56 6.0 22.7 69.6 86.3
Yemen 0.77 15.3 51.0 16.1 51.8
49Estimating Q: The numbers of children to be served
of regular ECCE enrolment. The number
of children with illiterate parents is 30.2%,
which is clearly larger than the number of
undernourished children. The undernourished
are assumed to be a subgroup of the ones with
illiterate parents, while the latter are assumed
to be out of ECCE35. Including the children of
illiterate parents (who were not yet included
as undernourished) would bring the GER to a
level of 34.9%. Two thirds of the total population
of eligible age children would therefore still be
excluded.
Egypt has both a higher initial level of
enrolment and a higher illiteracy rate than
Algeria. Reaching all children of illiterate parents
in Egypt would bring 58.8% of all children to
ECCE. Kuwait and the United Arab Emirates
combine even higher levels of enrolment with
small numbers of undernourished children,
but they have substantial numbers of illiterates.
These two countries would make significant
progress towards universal enrolment by
reaching the children of illiterate parents. Most
remarkable is perhaps Morocco, which manages
to enroll a high number of children despite
its moderate pcGNP. Reaching all children of
illiterate parents would actually make the level
of enrolment exceed 100%, which means that
some of the children of illiterate parents must
already be enrolled.
Finally, it can be seen that the number of
undernourished children exceeds the number
of children with illiterate parents in Bahrain,
Jordan, Occupied Palestinian Territory and the
Syrian Arab Republic. In these countries, the
level reached in Step 2 does not exceed that in
Step 1.
Projections of enrolment in ECCE
In the previous sections of this chapter we
presented the current state of pre-primary
education in the countries of the region. We
showed the numbers of children enrolled in
pre-primary education and those who are left
out. More importantly, we identified a group of
children in a disadvantaged situation who should
receive priority in an ECCE expansion strategy.
This is reflected in the 2 steps scenario. In this
section, we present projections to 2010 and 2015
of the estimated number of additional children
to be served with an ECCE programme to achieve
the target GERs established in Table 6.8.
The estimates are based on the following
assumptions:
Populations of eligible age projections
are calculated using as a proxy the annual
growth of the 0 to 4 years old population in
each country extracted from the Population
Division of the Department of Economic
and Social Affairs of the United Nations
Secretariat, World Population Prospects.
The target GERs as mentioned are taken
from Table 6.7
The number of children enrolled in private
35 Once again we should emphasise that these are assumptions and not certainties, and this has its implications. For
example, if a more than negligible share of the children of illiterate parents are already enrolled – which seems to be the
case in Morocco – then we would be overestimating the need for ECCE.
.
.
.

50
Table 6.8.Number of additional children to be incorporated by 2010 and 2015 following the suggested
expansion scenario.
Country
Popula-
tion of
eligible
age
GER
Total
number
of pupils
% in
private
institut-
ions
Popula-
tion of
eligible
age
Tar-
get
GER
Total
number
of pupils
Pupils
in
private
institut-
ions
Additional
pupils to
be served
compared
with 2004
Populat-
ion of
eligible
age
Tar-
get
GER
Total
numb-
er of
pupils
Pupils
in
private
institut-
ions
Additional
pupils to
be served
compared
with 2004
2004 base line year Projections by 2010 Projections by 2015
Algeria 1,199,514 4.7 56,606 67 1,329,088 17,1 226,642 42,023 165,939 1,396,276 34.9 487,567 45,773 423,114
Bahrain 39,655 44,7 17,740 99 39,655 52,7 20,912 17,634 3,172 39,655 52.7 20,912 17,634 3,172
Djibouti 44,861 1,8 800 77 45,310 20,8 9,417 618 8,611 45,310 20.8 9,417 623 8,606
Egypt 3,270,603 14.4 469,942 67 3,468,850 24,0 833,750 333,946 344,722 3,514,328 58.8 2,065,323 350,732 1,559,511
Iraq 1,590,822 5.7 90,966 67 1,670,208 … … … … 1,747,392 … … … …
Jordan 296,152 29.6 87,767 67 300,040 44,3 132,925 59,576 44,386 300,040 44.3 132,925 60,227 43,735
Kuwait 87,752 70.6 61,939 33 99.678 75,6 75.341 23.358 10.607 99.678 87.7 87,402 25,975 20,051
Lebanon 207,032 74.5 154,214 76 208.576 89,5 186.651 118.543 31.559 209.220 89.5 187,227 119,279 31,399
Libyan
Arab
Jamahiriya
230,923 ... ... 15 254.204 ,,, … … … 258.631 ... … … …
Mauritania 272,533 1.7 4,709 78 307.712 9,4 28.908 4.136 23.726 325.159 50.5 164,296 4,577 158,674
Morocco 1,281,259 53.4 684,783 100 1.330.571 80,1 1.065.958 711.139 354.819 1.333.243 80.1 1,068,098 733,875 334,223
Occupied
Palestinian
Territory
234,890 29.9 70,225 100 257.758 42,2 108.852 76.985 31.797 273.637 42.2 115,558 83,182 32,306
Oman 119,472 6.2 7,402 100 130.992 17,9 23.398 8.116 15.282 139.054 31.8 44,213 8,763 35,450
Qatar 36,338 32.3 11,752 93 40.277 37,7 15.174 12.101 2.239 40.277 43.1 17,376 13,185 3,357
Saudi
Arabia1,868,281 5.1 96,073 46 1.971.031 10,5 206.478 46.523 107.980 2.048.199 25.7 527,254 48,645 426,633
Sudan 1,936,357 23.0 445,763 74 2.003.818 38,0 761.866 341.357 304.610 2.021.739 64.0 1,294,332 351,239 827,194
Syrian
Arab
Republic
1,414,594 10.3 146,403 73 1.518.705 43,7 663.413 115.054 509.123 1.538.539 43.7 672,077 122,069 510,772
Tunisia 491,438 ... ... 67 504.637 ,,, … … … 504.637 ... … … …
United
Arab
Emirates
122,715 63.6 78,000 72 136.828 69,6 95.180 62.184 10.766 144.244 86.3 124,427 68,088 34,109
Yemen 1,979,839 0.8 15,304 45 2.313.275 16,1 372.584 8.029 356.122 2.578.061 51.8 1,334,739 9,141 1,317,166
Total Arab
States16,725,030 14.9 2,500,388 17.931.214 4.827.447 1.981.321 2.325.462 18.557.319 8,353,143 2,063,006 5,769,472

51Estimating Q: The numbers of children to be served
institutions grows at the rate of the 0 to
4-year-old population growth.
Where the % in private institutions is not
available we assume that two thirds of the
pupils are in private institutions (regional
average).
The columns highlighted white are estimates
of the additional number of children to be
served by ECCE in each year. This is calculated
by the number of children who should be
served according to the target GER not counting
the children who would be going to a private
institution. It is important not to include those
pupils in the expansion strategy who would be
attending private institutions anyway. Although,
it could be argued that the proportion of pupils
going to private institutions would eventually go
down if the size and the quality of public supply
increases.
Taking the region as a whole, the number of
additional children requred by 2010 and 2015
are concentrated in a small group of countries.
This is a combination of the size of the eligible
population on the one hand, and the gap to
be covered between the 2004 GER and the
target GER on the other hand. It is important
to mention that each country has a different
GER target according to the criteria already
developed. Thus, Algeria, Egypt, Morocco,
Saudi Arabia, Sudan, Syrian Arab Republic and
Yemen contain around 90% of all the additional
children to be incorporated in the region.
Table 6.9 shows the scale of expansion required
in each system. By far, Yemen is the country that
most urgently needs a higher increase. Currently
there are 15,000 pupils enrolled but the country
needs to reach more than one million by 2015.
Djibouti, a relatively small country in terms
of absolute numbers to be addressed, needs to
expand its system by a factor of 10. As expected,
in the relatively rich countries like Bahrain,
Kuwait, Lebanon, Qatar and the United Arab
Emirates the degree of expansion that is needed
is modest.
.
Table 6.9 Scale of expansion in the ECCE system by country
Country
Total number of
pupils in pre-primary
education in 2004 (A)
Additional pupils
by 2010 (B)
Additional pupils
by 2015 (C)(B)/(A) (C)/(A)
Algeria 56,606 165,939 423,114 2.9 7.5
Bahrain 17,740 3,172 3,172 0.2 0.2
Djibouti 800 8,611 8,606 10.8 10.8
Egypt 469,942 344,722 1,559,511 0.7 3.3
Jordan 87,767 44,386 43,735 0.5 0.5
– continued overleaf
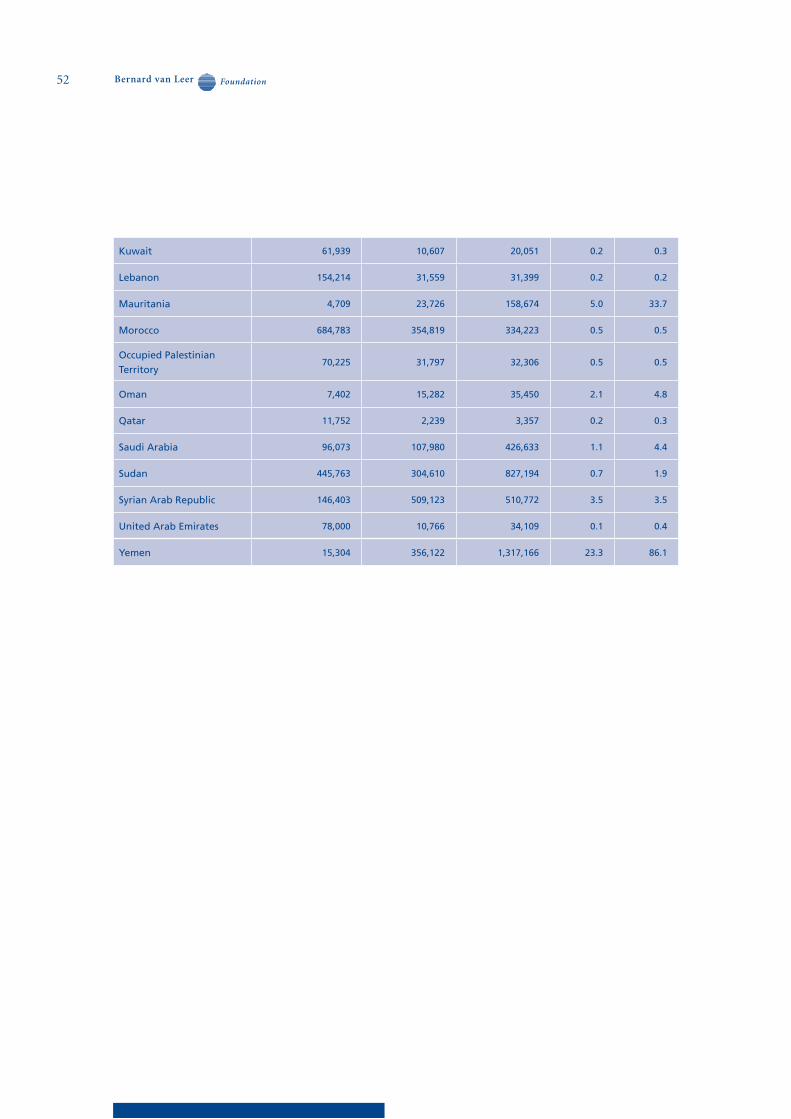
52
Kuwait 61,939 10,607 20,051 0.2 0.3
Lebanon 154,214 31,559 31,399 0.2 0.2
Mauritania 4,709 23,726 158,674 5.0 33.7
Morocco 684,783 354,819 334,223 0.5 0.5
Occupied Palestinian
Territory70,225 31,797 32,306 0.5 0.5
Oman 7,402 15,282 35,450 2.1 4.8
Qatar 11,752 2,239 3,357 0.2 0.3
Saudi Arabia 96,073 107,980 426,633 1.1 4.4
Sudan 445,763 304,610 827,194 0.7 1.9
Syrian Arab Republic 146,403 509,123 510,772 3.5 3.5
United Arab Emirates 78,000 10,766 34,109 0.1 0.4
Yemen 15,304 356,122 1,317,166 23.3 86.1

53
Based on the unit costs developed in Chapters
4 and 5, and on the estimations in Chapter 6
of the numbers of children to be served, we
can now present the final outcomes as they
have been calculated in the spreadsheet. We
present these outcomes in two sections: first
for the individual countries, and then assessing
the additional resource requirements of the
region as a whole. The second section is more
speculative and it attempts to provide an
indicative answer to the question: what will it
cost to achieve Goal One in the Arab States?
Additional costs per country
Tables 7.1 and 7.2 present the core findings of
this publication. Table 7.1 multiplies (from left
to right) the numbers of children to be reached
in 2010 and 2015 with the unit costs, thus
arriving at the outcomes for 2010 and 2015.
Chapter 7: Presentation and discussion of the outcomes
Table 7.1. Additional pupils based on countries’ own eligibility criteria and additional costs in US$
millions by modality and year.
Country
Additional
pupils by
2010
Additional
pupils by
2015
Unit costs in US$ 2003 Additional annual cost in US$ million 2003
Home
visiting
RPD
800 hours
by 2010 by 2015
Home
visiting
RPD
800 hoursHome
visiting
RPD
800 hours
Algeria 165,939 423,114 122 267 20.2 44.28 51.6 112.9
Bahrain 3,172 3,172 814 1,718 2.6 5.4 2.6 5.4
Djibouti 8,611 8,606 23 102 0.2 0.9 0.2 0.9
Egypt 344,722 1,559,511 56 145 19.4 50.1 88.0 226.8
Iraq … … … … … … … …
Jordan 44,386 43,735 85 239 3.8 10.6 3.7 10.5
Kuwait 10,607 20,051 1,032 2,178 11.0 23.1 20.7 43.7
Lebanon 31,559 31,399 413 710 13.0 22.4 13.0 22.3
Libyan Arab
Jamahiriya… … 222 521 … … … …
Mauritania 23,726 158,674 13 58 0.3 1.4 2.0 9.2
Morocco 354,819 334,223 90 190 32.0 67.4 30.1 63.5
Occupied Palestinian
Territory31,797 32,306 29 128 0.9 4.1 0.9 4.1
– continued overleaf

54
Table 7.1 presents the additional expenditure
that will be needed in 2010 and 2015 to
accomplish the GER target rates. Additional
expenditure means the extra money that is
needed on top of the private and public resources
already invested in ECCE, including the money
that goes into autonomous growth that is
projected to take place. In other words, Table
7.1 only concerns the policies of governments
targeted at disadvantaged children. It must be
noted that the figures in the table are still based
on countries’ own policy choices regarding the
typical age of enrolment; i.e. the figures concern
4–5 years olds and 3–5 year olds, depending
on the country. Additionally, it should be
emphasised that the level of expenditure in 2015
is reached gradually through annual increases.
Each year, more children are incorporated
compared with the base year 2004 and there are
expenditures associated to that. The average
annual expenditure over the whole period until
2015 is thus lower than the top-level which is
reached in 2015.
As it shows annual costs only, Table 7.1 does not
show how much the accumulated costs are for
each country, nor does it show the average costs
per year during the period of expansion. Table
7.2 therefore provides these figures. Annex II
further explains the relationship between the
approach of Table 7.1 and that of Table 7.2, using
Yemen as an example.
Oman 15,282 35,450 275 1,075 4.2 16.4 9.8 38.1
Qatar 2,239 3,357 1,393 3,482 3.1 7.8 4.7 11.7
Saudi Arabia 107,980 426,633 327 1,150 35.3 124.2 139.5 490.6
Sudan 304,610 827,194 19 64 5.7 19.4 15.4 52.8
Syrian Arab Republic 509,123 510,772 57 147 29.0 74.8 29.1 75.0
Tunisia … … 203 318 … … … …
United Arab
Emirates10,766 34,109 1,252 2,739 13.5 29.5 42.7 93.4
Yemen 356,122 1,317,166 13 70 4.5 24.9 16.8 91.9
Arab States 2,325,462 5,769,472 – – 198.8 526.7 470.8 1,352.8
Low income
countries684,459 2,303,034 – – 10.5 45.7 34.2 153.9
Low and lower
middle income
countries
2,112,059 5,182,995 – – 115.1 293.8 236.9 643.5
Source: Author’s own calculations

55Presentation and discussion of the outcomes
Accumulated additional cost for the period Annual average additional cost
2005–2010 2005–2015 2005–2010 2005–2015
Home visiting
RPDHome
visitingRPD
Home visiting
RPDHome
visitingRPD
Algeria 57 125 243 532 10 21 22 48
Bahrain 9 19 22 46 1 3 2 4
Djibouti 0 2 1 7 0 0 0 1
Egypt 62 161 340 878 10 27 31 80
Iraq … … … … … … … …
Jordan 12 35 31 88 2 6 3 8
Kuwait 37 78 121 254 6 13 11 23
Lebanon 44 76 109 188 7 13 10 17
Libyan Arab
Jamahiriya… … … … … … … …
Mauritania 1 4 6 29 0 1 1 3
Morocco 105 221 259 546 17 37 24 50
Occupied
Palestinian
Territory
3 13 8 34 1 2 1 3
Oman 12 48 49 190 2 8 4 3
Qatar 10 26 31 76 2 4 3 7
Saudi Arabia 110 388 561 1,972 18 65 51 179
Sudan 18 63 74 253 3 10 7 23
Syrian Arab
Republic81 208 226 583 13 35 21 53
Tunisia … … … … … … … …
United Arab
Emirates46 100 197 431 8 17 18 39
Yemen 10 54 63 346 2 9 6 31
Total Arab States 618.8 1,620.5 2,340.4 6,450.2 103.1 270.1 212.8 586.4
Low income
countries28.9 1202 143.2 627.6 4.8 20.0 13.0 57.1
Low and lower
middle income
countries
346.8 872.3 1,244.1 3,259.7 57.8 145.4 113.1 296.3
Table 7.2. Additional accumulated and average costs in US$ millions by modality and year.

56
Generally speaking, the differences between the
outcomes per country are even more marked
than they are in Table 5.3 which reported just
the unit cost, because the outcomes not only
depend on pcGNP and TFR, but also on the size
of countries’ populations and the proportions of
disadvantaged children. For example, the lowest
additional costs are found in Djibouti, where
the unit costs are not the lowest, but where the
total number of inhabitants is small. Yemen, in
contrast, combines the second lowest unit costs
with a sizeable population, resulting in a more
substantial financial gap to be bridged. The
highest total costs are found in Saudi Arabia,
which is mainly the result of a large population
and a high pcGNP.
Table 7.2 clearly illustrates how the Step 1–Step 2
approach results in a relatively moderate
financial challenge for 2010 and a more
ambitious one in 2015. This is in accordance
with the experience with major policy changes: it
usually takes a few years to generate the financial
resources and to actually have them available,
while building capacity (training teachers,
preparing buildings, organizing support
structures) also takes time. Thus there would be
a slow start followed by acceleration after 2010.
The three bottom rows of Table 7.2 present (i)
the total challenge for the whole region, (ii)
the challenge for just the low income countries
of the region, and (iii) the challenge for the
low income countries plus the lower middle
income countries. This breakdown is given
to show the significant but not unexpected
difference between the figures for all of the
Arab States, and those for just the low income
countries. Even the difference between all Arab
States and the low plus lower middle income
countries is a factor two in 2015. Obviously these
differences are caused by the high unit costs in
the richer countries of the region. Their present
enrolment levels may be high and the number
of disadvantaged children may be low, but since
their pcGNPs are high, they still account for a
large share of the total costs for the region. This
phenomenon has been the rationale for the
second and last section of this chapter.
A tentative assessment of the
funding gaps in the poorer countries
One could argue that Tables 7.1 and 7.2 still
do not give a compact single answer to the
question: how much will it cost to achieve Goal
One in the Arab States? As we have just seen,
the table includes rich countries that on the one
hand strongly inflate the overall outcomes, but
on the other hand are unlikely to require foreign
assistance. In fact, some may even act as donors
(Abd-El-Jaleel, 2005). Thus, it seems defensible
to focus on the low income countries among
the Arab States. As we shall see in Chapter 8,
there are arguments to defend that the amount
of domestic resources that are available for
ECCE will be very limited in countries with
both a low GNP and a low level of enrolment in
primary education; much of the resources that
these countries themselves can reserve for basic
education are likely to be invested in primary
education.
57Presentation and discussion of the outcomes
Furthermore, we need to take into account
that Tables 7.1 and 7.2 are not entirely realistic,
in that they focus on countries’ official age
group (3–5 or 4–5), both for home visiting and
RPD, while in practice home visiting is usually
applied for the younger of the 0–5 age range
and RPD for the older ones. This justifies the
following simulation, using Yemen and Sudan as
examples.
In Yemen, 3–5 is the official age group for ECCE.
We assume that RPD is provided in these three
years, and that this is preceded by three years
of home visiting during the age 0–2. In other
words: a 3 + 3 model. In countries such as Sudan
where 4–5 is the official age group for ECCE, we
assume four years of home visiting followed by
two years of RPD, or a 4 + 2 model.
For Yemen, the additional costs of providing
RPD to all disadvantaged children of 3–5 years
old in 2015 are US$ 92 million, as can be seen
from Table 7.1. Now, if we could assume that
the total number of children of 0–2 equals that
of 3–5, then we could conclude from Table 7.1
that the cost of providing home visiting to
all disadvantaged children of 0–2 is US$ 16.8
million. The total additional annual cost of
running the 3 + 3 model for Yemen in 2015
would thus be 92 + 16.8 = US$ 109 million.
However, the assumption we just made would
imply that every subsequent age cohort is equal
in size to the preceding one. This is actually
not true for Yemen or for the other low income
countries in the region. All these countries are
still characterised by high fertility rates36. Thus,
we must be aware of a certain ‘demographic
bias’ in this tentative exercise, leading to a
certain underestimation of the costs.
Keeping this in mind, we now look at Sudan
where the 4 + 2 model applies. In this country,
two years of RPD cost US$ 52.8 million annually.
Two years of home visiting would cost US$ 15.4
million, so four years of home visiting requires
US$ 30.8 million. In total, the annual costs
of running the 4 + 2 model in Sudan would
amount to 52.8 + 30.8 = US$ 83.6 million.
The two remaining low income countries
for which data are available are Djibouti and
Mauritania. Both follow the 3 + 3 model. For
these countries – both are much smaller than
Yemen and Sudan – the outcomes are US$ 1.1
and 11.2 million, respectively. So, the total for
the four low income countries together would
be US$ 204.9 million.
The same approach can be followed in the five
lower-middle income countries for which the
necessary data are available: Algeria, Egypt,
Jordan, Morocco and the Syrian Arab Republic.
For the first four we must apply the 4 + 2 model,
and for the last one the 3 + 3 model. For these
countries, the demographic bias is much less
36 This is can be observed at the US census website (www.census.gov) where a menu of ‘population pyramids’ is provided for
all countries.

58
strong, sometimes absent or reversed. The
overall outcome for these lower-middle income
countries is US$ 864.8 million37. Together with
the low income countries this would add up to
US$ 1069.7 million.
We have also estimated what the cost
requirements would be if the entire 0–5 age
range were to be covered by home visiting, even
though it is uncommon to reach the “older”
children by this modality. Not surprisingly, this
would reduce the cost requirements in the four
low income countries most strongly: from
US$ 204.9 million down to US$ 84.2 million.
In the five lower-middle income countries the
decrease is less marked, both in absolute and in
relative terms: from US$ 864.8 million down to
US$ 578.4 million. The total cost of providing
home visiting to the whole age range in the low-
and lower-middle income countries would be
US$ 662.6 million (against US$ 1069.7 million for
home visiting followed by RPD).
So what is the final answer to the question: what
will it cost to achieve Goal One in the poorer
Arab States? It is clear that this is a matter of
judgment – or even political instinct – rather
than an objective outcome of a calculation.
We remind the reader once again of the many
assumptions that needed to be made in this
exercise, of the countries missing from the
exercise due to a lack of data, of the arbitrary
nature of the decision to include low and lower-
middle income countries in this section and to
exclude others, of the demographic bias, etc.
As a strictly personal conviction, however, the
authors estimate the answer to be US$ 1069.7
million. Three or four years of professional
support to the parents, followed by two or three
years in a quality ECCE programme of 800 hours
per year, seems to be what these particular
children need and deserve.
37 The separate amounts for the five countries are, respectively, US$ 216.1 million, US$ 402.8 million, US$ 17.9 million;
US$ 123.7 million and US$ 104.1 million.
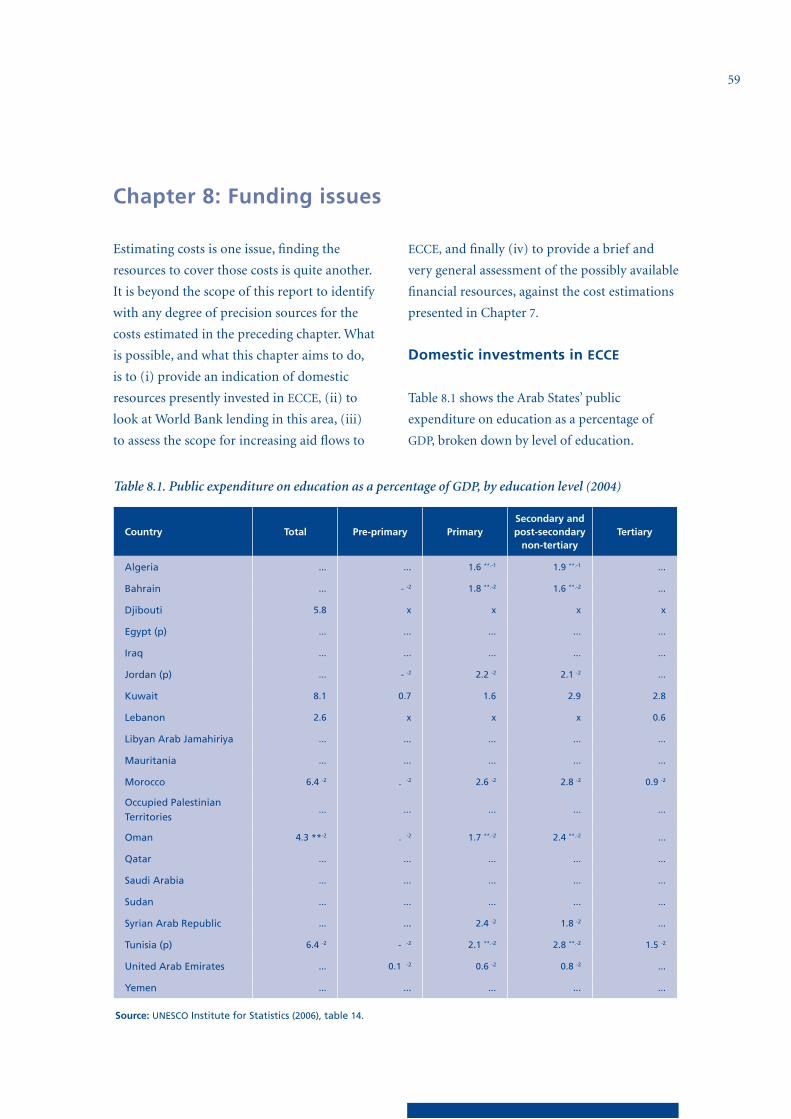
59
Estimating costs is one issue, finding the
resources to cover those costs is quite another.
It is beyond the scope of this report to identify
with any degree of precision sources for the
costs estimated in the preceding chapter. What
is possible, and what this chapter aims to do,
is to (i) provide an indication of domestic
resources presently invested in ECCE, (ii) to
look at World Bank lending in this area, (iii)
to assess the scope for increasing aid flows to
ECCE, and finally (iv) to provide a brief and
very general assessment of the possibly available
financial resources, against the cost estimations
presented in Chapter 7.
Domestic investments in ECCE
Table 8.1 shows the Arab States’ public
expenditure on education as a percentage of
GDP, broken down by level of education.
Chapter 8: Funding issues
Table 8.1. Public expenditure on education as a percentage of GDP, by education level (2004)
Source: UNESCO Institute for Statistics (2006), table 14.
Country Total Pre-primary PrimarySecondary and post-secondary
non-tertiaryTertiary
Algeria ... ... 1.6 **.-1 1.9 **.-1 ...
Bahrain ... - -2 1.8 **.-2 1.6 **.-2 ...
Djibouti 5.8 x x x x
Egypt (p) ... ... ... ... ...
Iraq ... ... ... ... ...
Jordan (p) ... - -2 2.2 -2 2.1 -2 ...
Kuwait 8.1 0.7 1.6 2.9 2.8
Lebanon 2.6 x x x 0.6
Libyan Arab Jamahiriya ... ... ... ... ...
Mauritania ... ... ... ... ...
Morocco 6.4 -2 . -2 2.6 -2 2.8 -2 0.9 -2
Occupied Palestinian
Territories... ... ... ... ...
Oman 4.3 **-2 . -2 1.7 **.-2 2.4 **.-2 ...
Qatar ... ... ... ... ...
Saudi Arabia ... ... ... ... ...
Sudan ... ... ... ... ...
Syrian Arab Republic ... ... 2.4 -2 1.8 -2 ...
Tunisia (p) 6.4 -2 - -2 2.1 **.-2 2.8 **.-2 1.5 -2
United Arab Emirates ... 0.1 -2 0.6 -2 0.8 -2 ...
Yemen ... ... ... ... ...
60
Clearly, Table 8.1 provides but a patchy picture
of ECCE funding in the Arab States. As Table
6.2 showed, ECCE funding is predominantly
private – in some countries by 100% – while
data on private funding for ECCE is entirely
lacking for the Arab States. Yet, Table 8.1 does
provide an indication of the scope for initiating
and expanding public ECCE funding in the
region, since it reports total education spending
as a percentage of GDP for at least some of the
Arab countries. It appears that this indicator
has an order of magnitude of roughly 5% to
6% on average, with high and low outliers for
Kuwait and Lebanon respectively. This allows
us to make a comparison with countries in
other regions that have similar levels of overall
public spending on education. If we go through
table 14 of UNESCO (2006) (from which Table
8.1 above is a selected section) we find that
countries elsewhere that spend around 5–6% of
GNP on education, and usually invest 0.4–0.6%
of their GNP in ECCE (excluding private
investment, as we did for the Arab States),
with scarce extremes of 0.2% and 1.0%. In
other words: a bit less than 10% of the public
education budget appears to go to ECCE. This
rule of thumb – ECCE receiving 10% of the
budget – is also fairly consistent with what we
find in UNESCO (2006, table 14) for countries in
regions where ECCE is more developed (Latin
America, Central and East Europe, and North
America and Western Europe). This even holds
true in those countries where overall spending
on education is below or above the bracket of
5–6% of GNP.
However, Mingat et al. (2006) assumes a lower
percentage, namely 5% of the education budget,
as the desirable level of public investment in
ECCE for the Gambia. This is a country where
enrolment in ECCE is still far from universal;
the GER fell from 19.7 in 1998/1999 to 18.3
in 2002/2003. We tend to think that raising
investment in ECCE to a level of 5% of the
education budget is a good intermediary step
for low-enrolment countries, with 10% being a
good benchmark for a more mature situation.
If we apply the 5%-rule to Djibouti and Morocco
(the only two countries that appear both in the
second part of Chapter 7 and Table 8.1), then
we find that Djibouti should be able to reserve
some US$ 2 million for ECCE annually, and
Morocco some US$ 320 million. In both cases
this concerns an order of magnitude that seems
broadly sufficient to cover the annual costs of
running the 3 + 3 model in Djibouti or the 4 + 2
model in Morocco. It should be added, however,
that Djibouti faces a low primary enrolment level,
leaving perhaps little financial scope for ECCE.
More generally, the above suggests that well-balanced
education systems should invest a fair amount of
money in young children, leaving perhaps higher
education a bit more open for private contributions
(while safeguarding access for poorer students),
rather than the other way around. From an
equity perspective, substantial public investment
in the formative early years is more sensible
than it is in the very last stage of the educational
career, which many children never reach.

61Funding issues
International aid dedicated to ECCE
Data on international aid regarding ECCE are
very scarce. Support for ECCE is often included
in support to basic education more in general,
while breakdowns in which the share of ECCE
is visible are usually lacking. However, in
order to provide some indication of foreign
assistance for ECCE, we refer to Figure 8.1 which
is copied from the EFA Global Monitoring
Report (UNESCO, 2005a). This figure which
shows a breakdown of World Bank lending by
education sub-sector (UNESCO, 2005a). This
is a significant indication since World Bank
lending accounts for approximately 40% of
total multilateral support to education. The
figure indicates that ECCE (more specifically
pre-primary education) has received only a very
small share of all education related lending since
1990. The emphasis is on primary education
which received about 40% of education-related
lending, and on various forms of post-primary
education that received another 40%. Most
of what remains was in the form of general
support to the education sector, which is
unlikely to include a large share for ECCE. Since
total World Bank lending for education has been
in the order of US$ 1.5 billion in recent years,
Figure 8.1. Composition of total World Bank education lending for 1990–2004
Source: World Bank Education Statistics Database http://www1.worldbank.org/education/edstats/
1990 1991 1992 1993 1994 1995 1996 1997 1998 1999 2000 2001 2002 2003 20040%
20%
40%
60%
80%
100%
Adult lit./non-formal ed .
Secondary education
General education sector
Tertiary education
Pre-primary education
Vocational training
Primary education
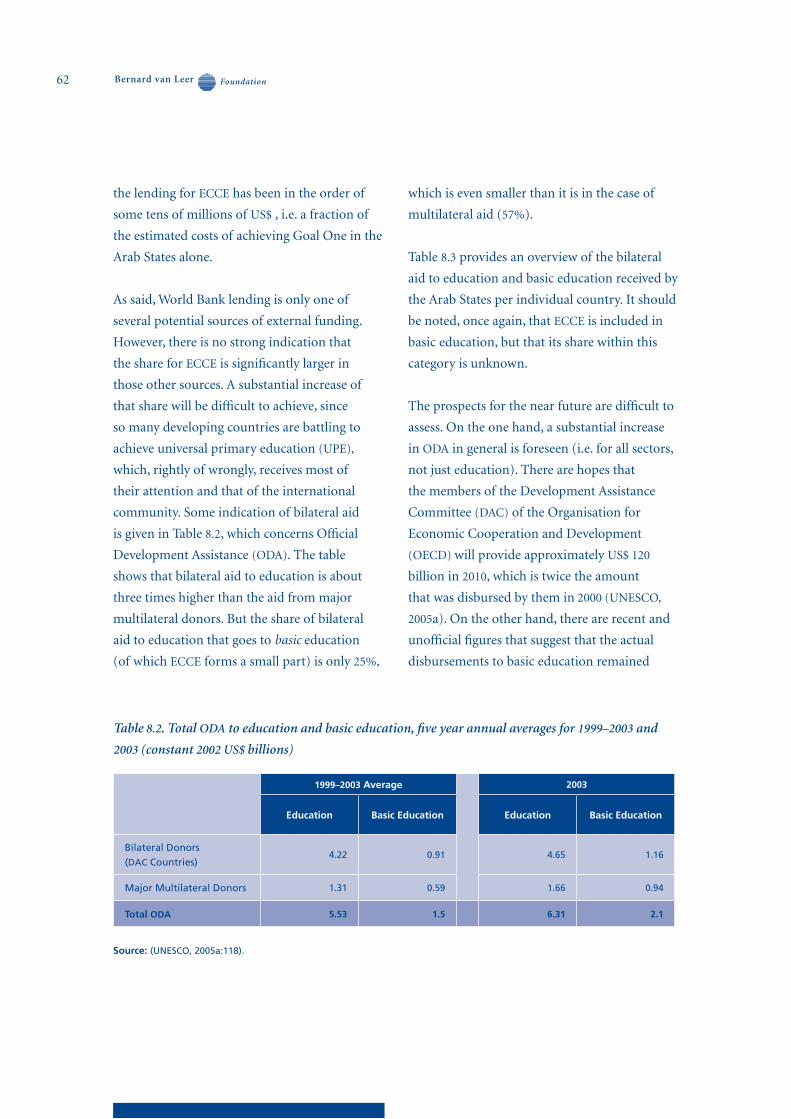
62
the lending for ECCE has been in the order of
some tens of millions of US$ , i.e. a fraction of
the estimated costs of achieving Goal One in the
Arab States alone.
As said, World Bank lending is only one of
several potential sources of external funding.
However, there is no strong indication that
the share for ECCE is significantly larger in
those other sources. A substantial increase of
that share will be difficult to achieve, since
so many developing countries are battling to
achieve universal primary education (UPE),
which, rightly of wrongly, receives most of
their attention and that of the international
community. Some indication of bilateral aid
is given in Table 8.2, which concerns Official
Development Assistance (ODA). The table
shows that bilateral aid to education is about
three times higher than the aid from major
multilateral donors. But the share of bilateral
aid to education that goes to basic education
(of which ECCE forms a small part) is only 25%,
which is even smaller than it is in the case of
multilateral aid (57%).
Table 8.3 provides an overview of the bilateral
aid to education and basic education received by
the Arab States per individual country. It should
be noted, once again, that ECCE is included in
basic education, but that its share within this
category is unknown.
The prospects for the near future are difficult to
assess. On the one hand, a substantial increase
in ODA in general is foreseen (i.e. for all sectors,
not just education). There are hopes that
the members of the Development Assistance
Committee (DAC) of the Organisation for
Economic Cooperation and Development
(OECD) will provide approximately US$ 120
billion in 2010, which is twice the amount
that was disbursed by them in 2000 (UNESCO,
2005a). On the other hand, there are recent and
unofficial figures that suggest that the actual
disbursements to basic education remained
1999–2003 Average 2003
Education Basic Education Education Basic Education
Bilateral Donors
(DAC Countries)4.22 0.91 4.65 1.16
Major Multilateral Donors 1.31 0.59 1.66 0.94
Total ODA 5.53 1.5 6.31 2.1
Table 8.2. Total ODA to education and basic education, five year annual averages for 1999–2003 and
2003 (constant 2002 US$ billions)
Source: (UNESCO, 2005a:118).
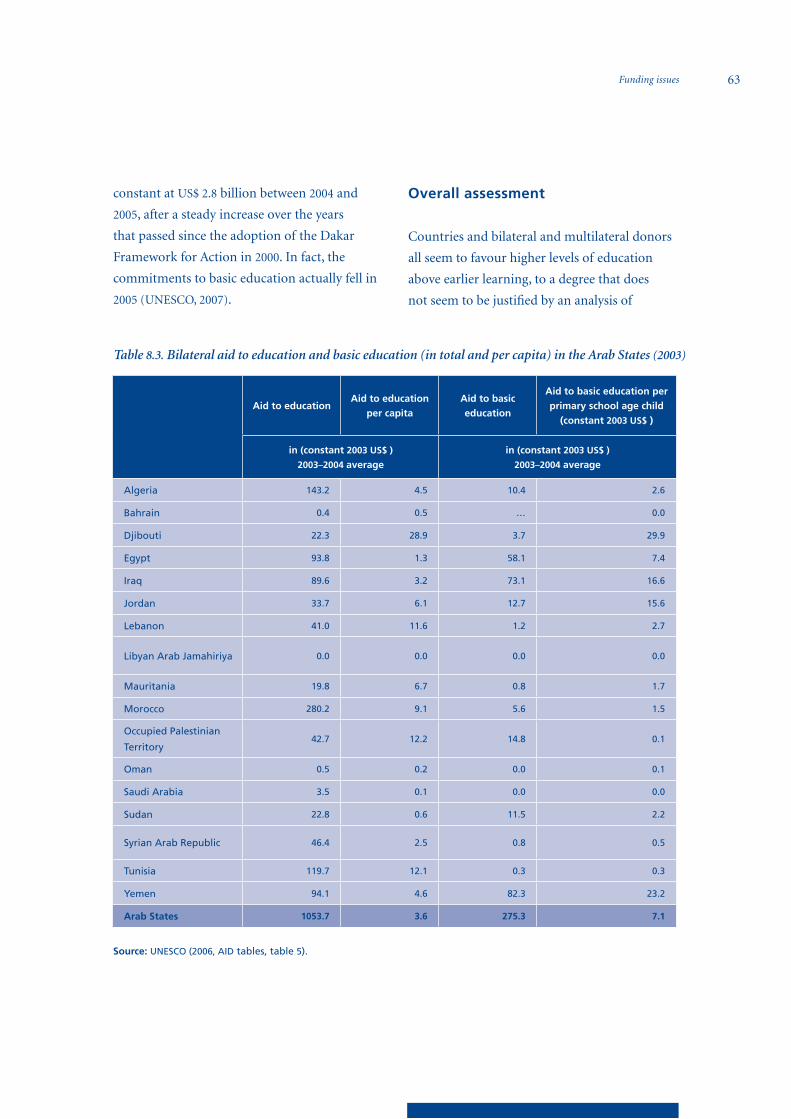
63Funding issues
constant at US$ 2.8 billion between 2004 and
2005, after a steady increase over the years
that passed since the adoption of the Dakar
Framework for Action in 2000. In fact, the
commitments to basic education actually fell in
2005 (UNESCO, 2007).
Overall assessment
Countries and bilateral and multilateral donors
all seem to favour higher levels of education
above earlier learning, to a degree that does
not seem to be justified by an analysis of
Aid to education Aid to education
per capita
Aid to basic
education
Aid to basic education per
primary school age child
(constant 2003 US$ )
in (constant 2003 US$ )
2003–2004 average
in (constant 2003 US$ )
2003–2004 average
Algeria 143.2 4.5 10.4 2.6
Bahrain 0.4 0.5 … 0.0
Djibouti 22.3 28.9 3.7 29.9
Egypt 93.8 1.3 58.1 7.4
Iraq 89.6 3.2 73.1 16.6
Jordan 33.7 6.1 12.7 15.6
Lebanon 41.0 11.6 1.2 2.7
Libyan Arab Jamahiriya 0.0 0.0 0.0 0.0
Mauritania 19.8 6.7 0.8 1.7
Morocco 280.2 9.1 5.6 1.5
Occupied Palestinian
Territory42.7 12.2 14.8 0.1
Oman 0.5 0.2 0.0 0.1
Saudi Arabia 3.5 0.1 0.0 0.0
Sudan 22.8 0.6 11.5 2.2
Syrian Arab Republic 46.4 2.5 0.8 0.5
Tunisia 119.7 12.1 0.3 0.3
Yemen 94.1 4.6 82.3 23.2
Arab States 1053.7 3.6 275.3 7.1
Table 8.3. Bilateral aid to education and basic education (in total and per capita) in the Arab States (2003)
Source: UNESCO (2006, AID tables, table 5).
64
costs and benefits. The costs that have been
estimated in Chapter 7 seem high, but they are
not insurmountable once countries succeed
in allocating 5% of the education budget to
ECCE, and once donors too reconsider the
distribution of their resources over the various
levels of education. But even in that case it
will be difficult to reserve more money for
ECCE as long as UPE has not been achieved,
since primary education strongly dominates
the EFA agenda’s of countries and donors. Two
strategies come to mind when trying to achieve
a breakthrough. The first is to continue to
emphasise vis-à-vis governments that ECCE pays
itself back in higher efficiency further up in the
education system and in an impressive number
of social and economic benefits.
The second strategy is to increase funding from
private actors. Parents can be asked to pay fees,
and if they are unable to do so they may make
in-kind contributions, e.g. by assisting in the
day-to-day activities for the children. But one
can also think of the increasing number of
national or multinational corporations that are
actively pursuing corporate social responsibility
(CSR) activities. Consumers in developed
countries are increasingly interested in products
that are not only useful but are supplied by
socially responsible businesses. In response, a
growing number of firms are engaged in social
activities directly or funding projects in different
social areas. This offers a clear opportunity to
raise additional funds for ECCE. Philanthropic
foundations also have a large role in this kind of
funding. Although the figures should be treated
with caution (some foundations prefer a low
profile, often from a sense that publicising such
work is undignified or improper) an OECD
study has found that their contributions to
education form the second largest proportion
after health and family planning (OECD, 2003).
The dilemma is, of course, that funding inspired
by commercial of philanthropic interests is
never guaranteed in the long term. At the end
of the day they are no good alternatives to
countries securing essential public services
based on stable tax revenues. Yet, an argument
for an open mind towards a temporary and
partial reliance on private contributions lies
in the fact that the benefits of ECCE take a
certain amount of time to materialise. If private
funding can help to bring ECCE provision to a
significantly higher level and keep it there for
some time, the benefits will occur in the form of
higher efficiency in education and lower public
expenditure, so that governments can gradually
take over funding entirely.
65
Abd-El-Jaleel, E. (2005) A Study on Early Childhood Care and Development in the Republic of Yemen. Cairo,
Egypt: UNESCO Cairo Office.
ADEA Working Group on Early Childhood Development (2003) Early Childhood Development as an
Important Strategy to Improve Learning Outcomes. Paris, France: ADEA.
Arab Resource Collective (1994) Rights of the Child in the Arab World: Needs and Challenges. A Report on a
Regional Workshop, Cyprus, 9th–11th May 1994. Nicosia: Arab Resource Collective.
Arnold, C. (1990) Site Visit: Nepal Case Study. Washington, DC: The Consultative Group on ECCD,
World Bank.
Basheer, N. (2005) The UNESCO Early Childhood Policy Review Project: The Background Report of Sudan. Cairo,
Egypt: UNESCO Cairo Office.
Bennett, J. (2004) Early Education Financing: What is Useful to Know? Policy Brief on Early Childhood. No 23,
May 2004. Paris, France: UNESCO.
The Consultative Group Secretariat (1993) Site Visit: India – Integrated Child Services. ICDS. Available online
at www.ecdgroup.com.
EFA Monitoring Team (2005) The ´Outline for Consultation´ for the forthcoming fifth edition of the EFA
Global Monitoring Report. Available online at www.efareport.unesco.org
Gaag, J. van der, and Tan, J. (1998) The Benefits of Early Childhood Development Programs: An Economic
Analysis. Washington, DC: World Bank
Hussein, L. (2005) Readiness of Jordanian Children for School. Powerpoint presentation, delivered at the
conference “Urban Children and Youth in the MENA Region” held in Dubai, 16/18 May 2005. Lara
Hussein is Assistant Secretary General, Director Childhood Unit of the National Council for Family
Affairs in Jordan.
Hyde, K. (2006) Investing in Early Childhood Development: The Potential Benefits and Cost Savings. Paris,
France: ADEA.
Issa, S. (2006) A Costing Model of the Madrasa Early Childhood Development Program in East Africa. Paris,
France: ADEA.
Jaramillo, A and Mingat, A. (2006) Early Childhood Development in Sub-Saharan Africa: What Would it Take to
Meet the Millennium Development Goals? Paper presented at the ADEA Biennale held in Gabon,
March 2006. Paris, France: ADEA.
Jaramillo, A. and Tietjen, K. (2001) Early Childhood Development in Africa: Can We Do More for Less?
Washington, DC: World Bank.
KIDS COUNT (2005) Findings from the National School Readiness Indicators Initiative A 17 State Partnership.
Available online at www.gettingready.org/matriarch/d.asp?PageID=303&PageName2=pdfhold&p=&P
ageName=Getting+Ready+%2D+Full+Report%2Epdf
References
66
Masse, N. and Barnett, S. (2002) A Benefit Cost Analysis of the Abecedarian Early Childhood Intervention.
Available online at www.nieer.org.
Maxwell, K. and R.M. Clifford. (2004) Research in review: school readiness assessment. Young Children
59 (1): 42–46.
Mingat, A. (2006) Early Childhood Care and Education in Africa: Towards Expansion of Coverage and Targeting
of Efficient Services. Paper presented at the ADEA Biennale in Gabon held in March 2006. Paris,
France: ADEA.
Mingat, A., IREDU, CNRS and the University of Dijon (2006) Evaluating the Costs of Scaling Up ECD Interventions:
The World Bank Costing Model with Burkina Faso and The Gambia. Paris, France: ADEA.
Myers, B. (1987) Home-based Programmes for Early Childhood Care and Development. Coordinators’
Notebook No. 4, April 1987. The Hague, The Netherlands: Bernard van Leer Foundation.
Myers, B. (2004) In Search of Quality in Programmes of Early Childhood Care and Education. Background
paper for EFA global Monitoring Report. Available online at www.efareport.unesco.org.
Myers, B. (2006) Quality issues related to early childhood learning. IIEP Newsletter, January–March 2006. Paris,
France: IIEP.
Myers, C. (1998) The case of pre-primary education: the cost effectiveness of Shishu kaksha centers, Nepal. In:
Evans, J., Myers, R.G. and Ilfeld, E. (Eds) Early Childhood Counts: A Programming Guide on Early
Childhood Care for Development; Washington, DC: The World Bank.
Njenga, A. and Kabiru, M. (2001) In the Web of Cultural Transition: A Tracer Study of Children in Embu
District, Kenya. The Hague, The Netherlands: Bernard van Leer Foundation.
National Team for Early Childhood Development (2000) Early Childhood Development Strategy in Jordan.
New York, NY: UNICEF.
OECD (2003) Philanthropic foundations and development co-operation, DAC Journal 4(3).
Organization of the Islamic Conference (OIC), the United Nations Children’s Fund (UNICEF) and the Islamic
Educational, Scientific and Cultural Organization (ISESCO) (2005) Investing in the Children of the
Islamic World. A joint report by these three organisations. New York, NY: UNICEF.
Olmsted, P. (2002) Data Collection and System Monitoring in Early Childhood Programs. Early Childhood
and Family Policy Series Nº 5. Paris, France: UNESCO. Available online at http://unesdoc.unesco.org/
images/0012/001286/128636e.pdf
Ramey, C., Campbell, F., Burchinal, M., Skinner, M., Gardner, D and Ramey, S. (2000) Persistent effects of early
childhood intervention on high risk children and their mothers. Applied Development Science 4:2–14.
Ravens, J. van, and Aggio, C. (2005) The Costs of Dakar Goal 4 for Developing and ‘LIFE’ Countries.
Background paper for EFA Global Monitoring Report. Available online at www.efareport.unesco.org.
Rouse, C., Brooks-Gunn, J. and McLanahan. S. (2005) Introducing the issue in school readiness: Closing racial
and ethnic gaps. The Future of the Children Journal 15(1), 5–14.
Sachs, J. (2005) UN Millennium Project Report: Investing in Development. New York, NY: UNICEF.
67References
Schweinhart, L.J., Barnes, H.V. and Weikart, D.P. (1993) Significant Benefits: The High/Scope Perry Preschool
Through Age 27. Monographs of the High Scope Educational Research Foundation, Number 10.
Ypsilanti: The High/Scope Press.
UNDP (2005) Human Development Report 2005. New York, NY: UNDP.
UNESCO (2002) EFA Global Monitoring Report: Is the World on Track? Paris, France: UNESCO.
UNESCO (2003) EFA Global Monitoring Report: the Leap to Equality. Paris, France: UNESCO.
UNESCO (2004a) Early Childhood Care and Education in E-9 Countries: Status and Outlook. Paris, France: UNESCO.
UNESCO (2004b) EFA Global Monitoring Report: The Quality Imperative. Paris, France: UNESCO.
UNESCO (2005a) EFA Global Monitoring Report: Literacy for Life. Paris, France: UNESCO.
UNESCO (2005b) Policy Review Project: Early Childhood Care and Education in Kenya. Paris, France: UNESCO.
UNESCO (2006) EFA Global Monitoring Report: Strong Foundations. Paris, France: UNESCO.
UNESCO (2007) EFA Global Monitoring Report: Education for All by 2015. Will We Make It? Paris, France: UNESCO.
UNESCO Institute for Statistics (2006). Global Education Digest 2006. Montreal, Canada: UIS.
UNICEF (2006). The State of the World’s Children 2006. New York, NY: UNICEF.
United Nations Committee on the Rights of the Child, UNICEF, Bernard van Leer Foundation (2006). A Guide to
General Comment 7: Implementing Child Rights in Early Childhood. The Hague, The Netherlands:
Bernard van Leer Foundation.
Vandemoortele, J. and Roy, R. (2004) Making Sense of MDG Costing. New York, NY: UNDP.
Wamahiu, S. (1995) The Impact of the Integrated Madrassah-Nursery Intervention Programme on the Later
School Success of Muslim Children in Mombassa. Nairobi, Kenya: Aga Kahn Foundation.
World Bank (2005a) Early Childhood Education Enhancement Project. Project Appraisal Document.
Washington, DC: World Bank.
World Bank (2005b). World Development Report 2006, Equity and Development, Washington, DC: World Bank.
World Bank (2006). World Development Indicators. Washington, DC: World Bank.
World Education Forum (2000). The Dakar Framework for Action. Education For All: Meeting our Collective
Commitments. Text adopted by the World Education Forum. Dakar, Senegal, 26–28 April 2000.
Young, M. (2002) From Early Childhood Development to Human Development. Washington, DC: World Bank.

69
This report consists of two elements:
this report, and
an Excel-file, which should have been sent
together with the report but is also available
online on the Bernard van Leer Foundation
website or from the UNESCO Cairo Office or
the authors
This Annex provides an explanation about that
Excel file.
The Excel file contains the estimation model
that has been developed for this report, as well
as all the calculations on which this report is
based. The file is made available to the reader
because the cost estimations unavoidably
require a number of assumptions made by the
authors with which the reader may disagree. In
case of disagreement, the reader can make his
or her own assumptions and alter the relevant
parameter in the Excel file accordingly, and
observe the consequences this has for the final
outcomes. In various parts of the text of the
report we make reference to this spreadsheet. In
this way we wish to underscore the interactive
spirit that we think this estimation exercise
should have.
The estimation model is very simple to use,
even for people who have not worked with this
software before.
In order to change the parameters, please follow
these instructions:
To see the parameters click on the link ‘Go
to change the main model parameters’
below. You can always come back to this
page by clicking on back to presentation.
You will then have the choice of revising all
the parameters that are in red by clicking
the following headings:
RPD core cost parameters
Counselling core cost parameters
Salaries ratios to pcGDP by countryy
Total fertility rates by country
GER Targets by country
All figures in red can be altered by typing
the desired value (it is not necessary to first
delete the old value)
These changes will have an immediate
impact on the results
Note that not all black figures will
necessarily be influenced, e.g. changes
made in the red figures on the left side of
the screen (these concern parameters for
the unit costs) do not affect numbers of
children to be served.
To see how the results change in terms of
number of children click on Go to see the
scenarios
To see how the results change in terms of
cost estimates click on Go to see the cost
estimates
The last sub-file ´population growth´
is informative and is used to project
population over time.
Annex I: Users’ guide for working with the cost estimations model
..1.
2.
2.1.2.2.2.3.2.4.2.5.3.
4.
5.
6.
7.
8.


Additional annual cost in a certain year. This gives the additional financial resources needed by
a certain year. Table 7.1 presented the additional costs by 2010 and 2015. Those levels are achieved
gradually as the figures below show.
Accumulated additional cost for the whole period per modality
Annual average additional cost per modality
71
Annex II: Interpretation of the cost estimates. The case of Yemen

100,0
80,0
60,0
40,0
20,0
0,0
2005 2006 2007 2008 2009 2010 2011 2012 2013 2014
2015
US$
Mill
ion
s
0,10,7
0,42,0
0,84,2
1,4
7,9
2,6
14,1
4,5
24,9
5,9
32,4
7,7
42,1
10,0
54,7
13,0
71,0
16,8
91,9Accumulated additional cost for the period:
2005-2010:
HM: 10,
RPD: 54
2005-2015:
HM: 63,
RPD: 346
Annual average additional cost per period :
2005-2010:
HM: 2,
RPD: 9
2005-2015:
HM: 6,
RPD: 31
Home Visiting RPD
72


Bernard van Leer Foundation
P.O. Box 82334
2508 EH The Hague
The Netherlands
Tel: +31 (0)70 331 2200
Fax: +31 (0)70 350 2373
Email: [email protected]
www.bernardvanleer.org
About the Bernard van Leer Foundation
The Bernard van Leer Foundation funds and shares
knowledge about work in early childhood
development. The foundation was established in
1949 and is based in the Netherlands. Our income
is derived from the bequest of Bernard van Leer, a
Dutch industrialist and philanthropist, who lived from
1883 to 1958.
Our mission is to improve opportunities for children
up to age 8 who are growing up in socially and
economically difficult circumstances. We see this both
as a valuable end in itself and as a long-term means
to promoting more cohesive, considerate and creative
societies with equality of opportunity and rights for all.
We work primarily by supporting programmes
implemented by partners in the field. These include
public, private and community-based organisations.
Our strategy of working through partnerships is
intended to build local capacity, promote innovation
and flexibility, and help to ensure that the work we
fund is culturally and contextually appropriate.
We currently support about 140 major projects.
We focus our grantmaking on 21 countries in
which we have built up experience over the years.
These include both developing and industrialised
countries and represent a geographical range that
encompasses Africa, Asia, Europe and the Americas.
We work in three issue areas:
Through “Strengthening the Care Environment”
we aim to build the capacity of vulnerable
parents, families and communities to care for
their children.
Through “Successful Transitions: The Continuum
from Home to School” we aim to help young
children make the transition from their home
environment to daycare, preschool and school.
Through “Social Inclusion and Respect for
Diversity” we aim to promote equal opportunities
and skills that will help children to live in diverse
societies.
Also central to our work is the ongoing effort to
document and analyse the projects we support,
with the twin aims of learning lessons for our future
grantmaking activities and generating knowledge we
can share. Through our evidence-based advocacy and
publications, we aim to inform and influence policy
and practice both in the countries where we operate
and beyond.
Information on the series
Working Papers in Early Childhood Development is a
‘work in progress’ series that presents relevant findings
and reflection on issues relating to early childhood
care and development. The series acts primarily as a
forum for the exchange of ideas, often arising out
of field work, evaluations and training experiences.
As ‘think pieces’ we hope these papers will evoke
responses and lead to further information sharing
from among the readership.
The findings, interpretations, conclusions and
opinions expressed in this series are those of the
authors and do not necessarily reflect the views or
policies of the Bernard van Leer Foundation.
.
.
.