exp 6 acid and base titration
Post on 12-Apr-2015
1.995 views
DESCRIPTION
my lab report for this particular experiment.. not necessarily the best.. as i made mistakes a lot during this experiment.. this experiment was in my junior year..TRANSCRIPT
CHM 420
GENERAL CHEMISTRY
NAME : SITI NORMALIA BINTI SULAIMAN
: 2012237674
GROUP : ASB1Ac
EXPERIMENT 6 : ACIDS AND BASES
LECTURE NAME : ANISAH RAFIDAH BT AHMAD
EXPERIMENT DATE : 5 NOVEMBER 2012

1
EXPERIMENT 6
Acids and Bases
OBJECTIVE
The main purpose of this experiment is to study the properties of acidic or basic substances
using indicators and a pH meter.
INTRODUCTION
Acid and bases undergo complete or incomplete when dissolved in water and are called strong acids, strong bases, weak acids or weak bases. The experimental determination of the pH of a solution commonly performed either by the use of indicators or pH meter. The acid or base dissociation (ionization equilibrium) constant, Ka or Kb can be determined experimentally. A sample of weak acid (HA) is dissolved in water and then divided into two equal-volume portions. When one portion is titrated with a sodium hydroxide solution, all HA molecules present converted into A- ions.
OH- + HA → H2O + A-
Ka = [H+][A]/[HA] = [H+] 10-pH
The number of A ion produced is equal to the number of moles of HA in the original half-portion, and is also equal to the number of moles of HA in the unused portion of weak acid. The value of Ka can be determined by measuring the pH of a half-neutralised sample of the acid. When the acid-base titration is carried out, the end point of the titration can be determined when the indicator changes colour. The change of pH can be measured using a pH meter.
CHEMICAL AND APPARATUS
Sample solution A Test tubes pH meter Sample solution B Conical flask Unknown acid solution Beaker Indicators (thymol blue. bromophenol blue) methyl orange and phenolphthalein)
Pipette (25mL) Burette

2
PROCEDURE
For each of the following reactions, the observation was recorded.
A. pH using indicator
1. 1 to 2 mL of sample solution A was placed in small test tube 1, 2 and 3.
2. 1 to 2 drops of thymol blue was added to test tube 1.
3. The colour of the solution was then recorded.
4. Step 2 was repeated by replacing the indicator. Bromophenol blue into test tube 2
and methyl orange into test tube 3.
5. The colour of the solution was then recorded.
B. Determination of Ka for a weak acid.
1. 0.2 M of NaOH solution was filled in the burette.
2. 25mL of an unknown weak acid solution was pipette into a conical flask. 3 to 4 drops
of phenolphthalein indicator was added into the flask.
3. The acid solution was titrated until a faint persistent pink colour appeared.
4. 25mL of unknown acid solution was added into the neutralised solution. The solution
was stirred well. The pH of the solution was recorded.
C. Strong acid-base titration
1. The burette was filled with 0.2 M HCl.
2. 25mL of 0.2 M NaOH was transferred into the 100mL beaker using a pipette. 3 to 5
drops of phenolphthalein was added into the solution.
3. A pH meter was calibrated at pH 7 and pH 4.
4. The pH of NaOH was measured and recorded.
5. 10mL of HCl was carefully added into the NaOH solution. The solution was mixed
gently and the pH was measured.
6. The acid was continued to be added and the pH was measured a indicated.
PRECAUTIOUS
1. Safety goggles must be worn during the entire experiment.
2. In part C of the procedure ensures to submerge the tip of the pH meter into the solution for
entire experiment.
3. Avoid splattering or splashing any solution.
4. Avoid wasting any chemical solution intentionally.
3
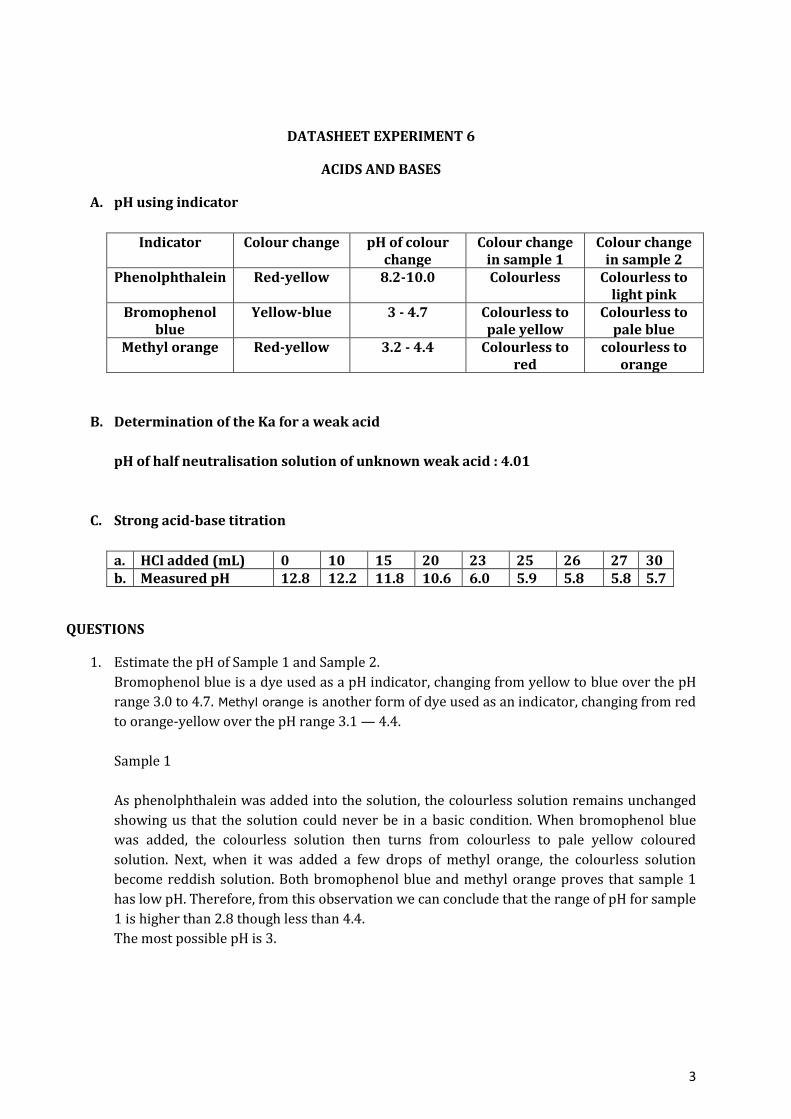
DATASHEET EXPERIMENT 6
ACIDS AND BASES
A. pH using indicator
Indicator Colour change pH of colour change
Colour change in sample 1
Colour change in sample 2
Phenolphthalein Red-yellow 8.2-10.0 Colourless Colourless to light pink
Bromophenol blue
Yellow-blue 3 - 4.7 Colourless to pale yellow
Colourless to pale blue
Methyl orange Red-yellow 3.2 - 4.4 Colourless to red
colourless to orange
B. Determination of the Ka for a weak acid
pH of half neutralisation solution of unknown weak acid : 4.01
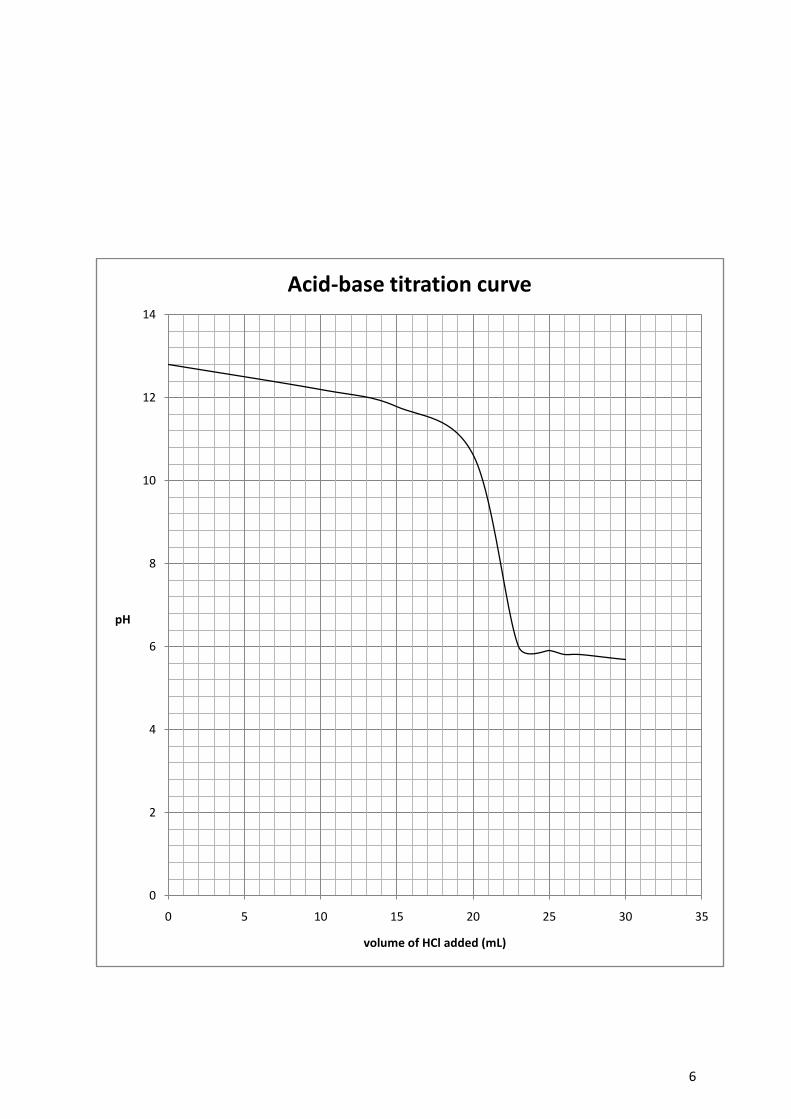
C. Strong acid-base titration
a. HCl added (mL) 0 10 15 20 23 25 26 27 30 b. Measured pH 12.8 12.2 11.8 10.6 6.0 5.9 5.8 5.8 5.7
QUESTIONS
1. Estimate the pH of Sample 1 and Sample 2.
Bromophenol blue is a dye used as a pH indicator, changing from yellow to blue over the pH
range 3.0 to 4.7. Methyl orange is another form of dye used as an indicator, changing from red
to orange-yellow over the pH range 3.1 — 4.4.
Sample 1
As phenolphthalein was added into the solution, the colourless solution remains unchanged
showing us that the solution could never be in a basic condition. When bromophenol blue
was added, the colourless solution then turns from colourless to pale yellow coloured
solution. Next, when it was added a few drops of methyl orange, the colourless solution
become reddish solution. Both bromophenol blue and methyl orange proves that sample 1
has low pH. Therefore, from this observation we can conclude that the range of pH for sample
1 is higher than 2.8 though less than 4.4.
The most possible pH is 3.
4
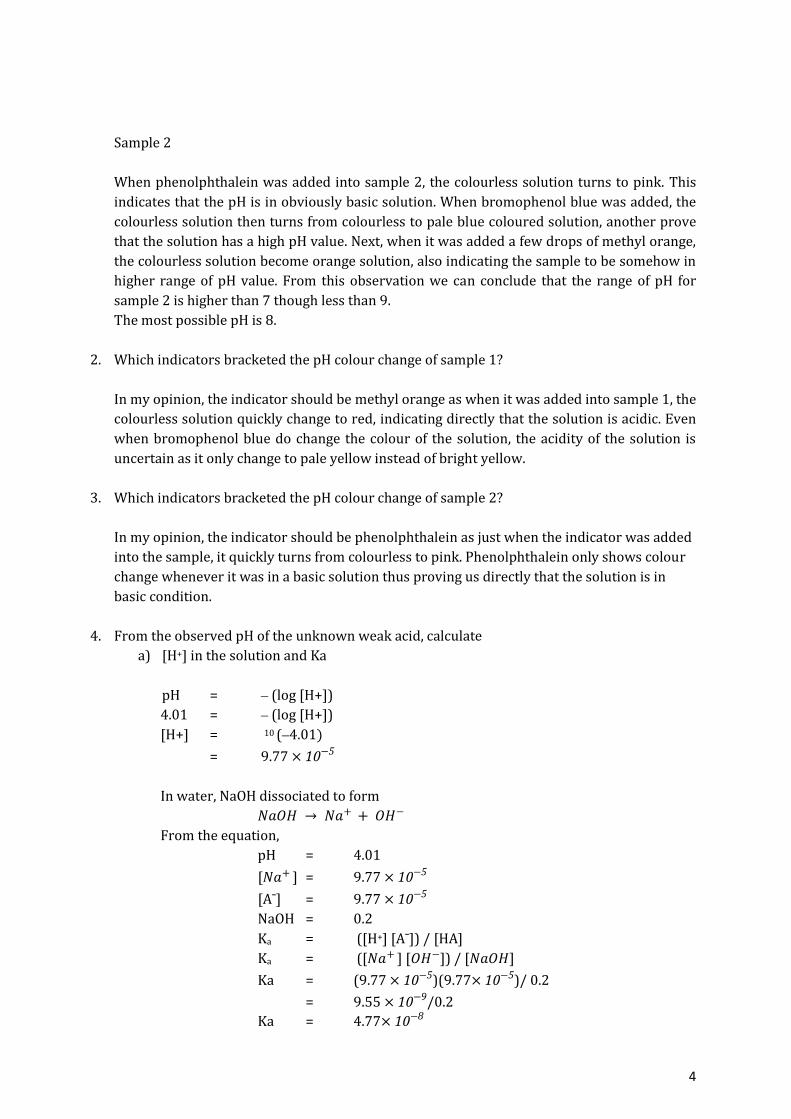
Sample 2
When phenolphthalein was added into sample 2, the colourless solution turns to pink. This
indicates that the pH is in obviously basic solution. When bromophenol blue was added, the
colourless solution then turns from colourless to pale blue coloured solution, another prove
that the solution has a high pH value. Next, when it was added a few drops of methyl orange,
the colourless solution become orange solution, also indicating the sample to be somehow in
higher range of pH value. From this observation we can conclude that the range of pH for
sample 2 is higher than 7 though less than 9.
The most possible pH is 8.
2. Which indicators bracketed the pH colour change of sample 1?
In my opinion, the indicator should be methyl orange as when it was added into sample 1, the
colourless solution quickly change to red, indicating directly that the solution is acidic. Even
when bromophenol blue do change the colour of the solution, the acidity of the solution is
uncertain as it only change to pale yellow instead of bright yellow.
3. Which indicators bracketed the pH colour change of sample 2?
In my opinion, the indicator should be phenolphthalein as just when the indicator was added
into the sample, it quickly turns from colourless to pink. Phenolphthalein only shows colour
change whenever it was in a basic solution thus proving us directly that the solution is in
basic condition.
4. From the observed pH of the unknown weak acid, calculate
a) [H+] in the solution and Ka
pH = ⎼ (log [H+])
4.01 = ⎼ (log [H+])
[H+] = 10 (⎼4.01)
= 9.77 × 10⁻⁵
In water, NaOH dissociated to form
𝑁𝑎𝑂𝐻 → 𝑁𝑎+ + 𝑂𝐻−
From the equation,
pH = 4.01
[𝑁𝑎+ ] = 9.77 × 10⁻⁵
[A¯] = 9.77 × 10⁻⁵
NaOH = 0.2
Ka = ([H+] [A¯]) / [HA]
Ka = ([𝑁𝑎+ ] [𝑂𝐻−]) / [𝑁𝑎𝑂𝐻]
Ka = (9.77 × 10⁻⁵)(9.77× 10⁻⁵)/ 0.2
= 9.55 × 10⁻⁹/0.2
Ka = 4.77× 10⁻⁸
5
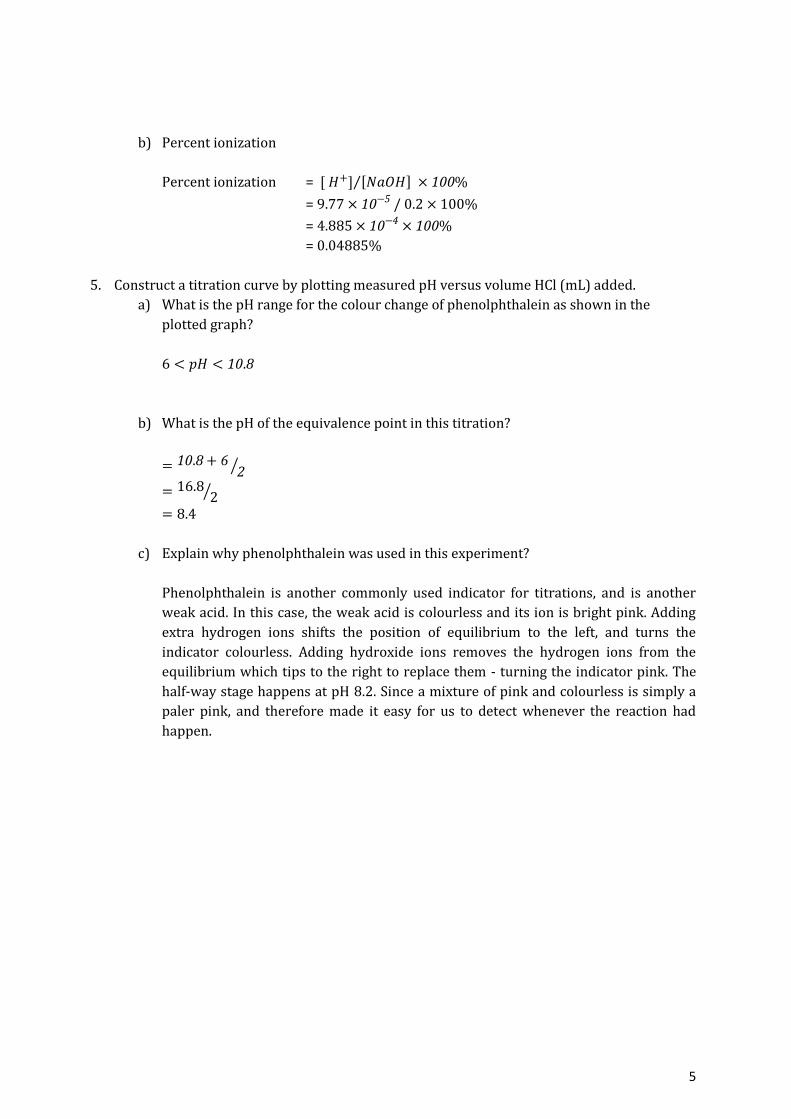
b) Percent ionization
Percent ionization = [ 𝐻+] 𝑁𝑎𝑂𝐻 × 100%
= 9.77 × 10⁻⁵ / 0.2 × 100%
= 4.885 × 10−4 × 100%
= 0.04885%
5. Construct a titration curve by plotting measured pH versus volume HCl (mL) added.
a) What is the pH range for the colour change of phenolphthalein as shown in the
plotted graph?
6 < 𝑝𝐻 < 10.8
b) What is the pH of the equivalence point in this titration?
= 10.8 + 6 2
= 16.82
= 8.4
c) Explain why phenolphthalein was used in this experiment?
Phenolphthalein is another commonly used indicator for titrations, and is another
weak acid. In this case, the weak acid is colourless and its ion is bright pink. Adding
extra hydrogen ions shifts the position of equilibrium to the left, and turns the
indicator colourless. Adding hydroxide ions removes the hydrogen ions from the
equilibrium which tips to the right to replace them - turning the indicator pink. The
half-way stage happens at pH 8.2. Since a mixture of pink and colourless is simply a
paler pink, and therefore made it easy for us to detect whenever the reaction had
happen.
6
0
2
4
6
8
10
12
14
0 5 10 15 20 25 30 35
pH
volume of HCl added (mL)
Acid-base titration curve
7
DISCUSSION
The main purpose of this experiment is to study the properties of acidic or basic substances
using indicators and a pH meter.
Part A of the experiment is when we use various indicators to determine the pH value of two
unknown sample, sample 1 and sample 2. Thymol blue, bromophenol blue and methyl
orange was used here. These 3 different indicators help us to determine the pH of the
solution.
Thymol blue (thymolsulphonephthalein) is a brownish-green or reddish-brown crystalline
powder that is used as a pH indicator. It is insoluble in water but soluble in alcohol and
dilutes alkali solutions. It transitions from red to yellow at pH 1.2 to 2.8 and from yellow to
blue at pH 8.0 to 9.6. Bromophenol blue is a dye used as a pH indicator, changing from yellow
to blue over the pH range 3.0 to 4.7. Methyl orange is another form of dye used as an
indicator, changing from red to orange-yellow over the pH range 3.1 — 4.4.
Basically, the acid-base indicator serves as an easy-to-spot signal during the experiment.
Once the pH strays into the specified range, the solution starts to change color. Whenever
thymol blue indicator was added into sample 1, the colourless solution remains unchanged.
This indicates that the pH could not be any less than 2.8. When bromophenol blue was added,
the colourless solution then turns from colourless to pale yellow coloured solution. Next,
when it was added a few drops of methyl orange, the colourless solution become reddish
solution. Both bromophenol blue and methyl orange proves that sample 1 has low pH.
Therefore, from this observation we can conclude that the range of pH for sample 1 is higher
than 2.8 though less than 4.4. The most possible pH is for sample 1 is 3. As for sample 2,
whenever thymol blue indicator was added, the colourless solution turns to light pink
solution. This indicates that the pH is in much basic solution. When bromophenol blue was
added, the colourless solution then turns from colourless to pale blue coloured solution,
another prove that the solution has a high pH value. Next, when it was added a few drops of
methyl orange, the colourless solution become orange solution, also indicating the sample to
be somehow in higher range of pH value. From this observation we can conclude that the
range of pH for sample 2 is higher than 7 though less than 9. The most possible pH is 8.
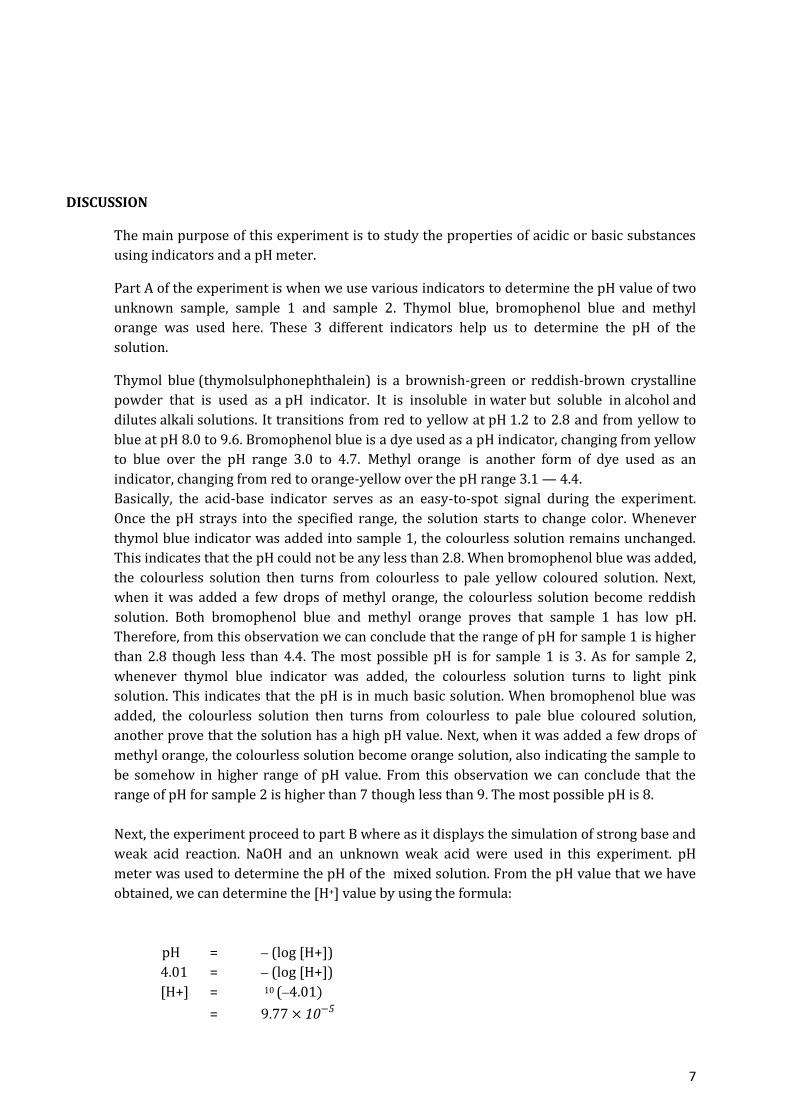
Next, the experiment proceed to part B where as it displays the simulation of strong base and
weak acid reaction. NaOH and an unknown weak acid were used in this experiment. pH
meter was used to determine the pH of the mixed solution. From the pH value that we have
obtained, we can determine the [H+] value by using the formula:
pH = ⎼ (log [H+])
4.01 = ⎼ (log [H+])
[H+] = 10 (⎼4.01)
= 9.77 × 10⁻⁵

8
And once the concentration is obtained, the Ka value is also obtainable.
In water, NaOH dissociated to form
𝑁𝑎𝑂𝐻 → 𝑁𝑎+ + 𝑂𝐻−
From the equation,
pH = 4.01
[𝑁𝑎+ ] = 9.77 × 10⁻⁵
[A¯] = 9.77 × 10⁻⁵
NaOH = 0.2
Ka = ([H+] [A¯]) / [HA]
Ka = ([𝑁𝑎+ ] [𝑂𝐻−]) / [𝑁𝑎𝑂𝐻]
Ka = (9.77 × 10⁻⁵)(9.77× 10⁻⁵)/ 0.2
= 9.55 × 10⁻⁹/0.2
Ka = 4.77× 10⁻⁸
Percent ionization = [ 𝐻+] 𝑁𝑎𝑂𝐻 × 100%
= 9.77 × 10⁻⁵ / 0.2 × 100%
= 4.885 × 10−4 × 100%
= 0.04885%
Proceeding to the part C of the experiment, is the simulation of the reaction happen when
strong acid and strong base were in contact with each other. When an acid is titrated with
a base, there is typically a sudden change in the pH of the solution at the equivalence point. If
a few drops of indicator solution have been added, this sharp decrease in pH causes an
abrupt change in color, which is called the endpoint of the indicator. The actual magnitude of
the jump in pH, and the pH range which it covers depend on the strength of both the acid and
the base involved, and so the choice of indicator can vary from one titration to another. In
our case, we use sodium hydroxide and hydrochloric acid. The pH changes quite slowly at
the start of the titration, and almost all the decrease in pH takes place in the immediate
vicinity of the endpoint. For the first part of the graph, we have an excess of sodium
hydroxide. The curve will be exactly the same as when we add hydrochloric acid to sodium
hydroxide. Once the acid is in excess, there will be a difference.

9
CONCLUSION
The experiment is a success. For part A, the pH value for sample 1 is 3, pH value for sample 2 is 8.
Part B resulting [H+] is 9.77× 10⁻⁵, Ka is 4.77× 10⁻⁸ and percent ionisation is 0.4885%. And as for
part C, the endpoint of the titration is at pH 8.4.
REFERENCE
http://www.answers.com/topic/ph-indicator
http://www.thebigger.com/chemistry/ionic-equilibria/calculate-the-percent-ionization-of-
0-20-m-solution-of-hydrocyanic-acid-hcn-ka-for-hcn-4-9-x-10-10/
http://www.chemguide.co.uk/physical/acidbaseeqia/phcurves.html
http://malaysia.answers.yahoo.com/question/index?qid=20100115103012AAkuaWB
Shakhashiri, B. Z., Chemical Demonstrations: A Handbook for Teachers of Chemistry, Vol. 1;
The University of Wisconsin
Press: Madison 1983; pp 280–285.
Basic Chemistry, 9th Edition International Student Version Leo J. Malone (Saint Louis
Univ.), Theodore Dolter (Southwestern Illinois College)
March 2012, ©2013
http://www.chemteam.info/AcidBase/Calc-Percent-Dissoc-given-conc-and-Ka.html
0
2
4
6
8
10
12
14
0 10 20 30 40
pH
volume of HCl added (mL)
Acid-base titration curve