exercise: self controlled case series analysis · exercise: self controlled case series analysis...
TRANSCRIPT

EXERCISE: SELF CONTROLLED CASE SERIES
ANALYSIS
• Caitlin Dodd Cincinnati Children’s Hospital
• Hector S Izurieta U.S. FDA

self-controlled case series method
• Methodology for epidemiological studies
• Based on cases only
• Provides consistent estimates of relative incidence
• Controls for fixed confounders
• Allows age and temporal variation in baseline
• Highly efficient

Simple Example Subject vaccinated at day 10 of observation 1 risk period: - Days 0 to 2 following vaccination - Seizure at day 11 of observation, day 1 following vaccination
Days: 1 10 11 12 15 22 60
Febrile Seizure
Risk Period
Vaccination
ID START DAY OF VACCINATION DAY OF ADVERSE EVENT END
0 1 10 11 60
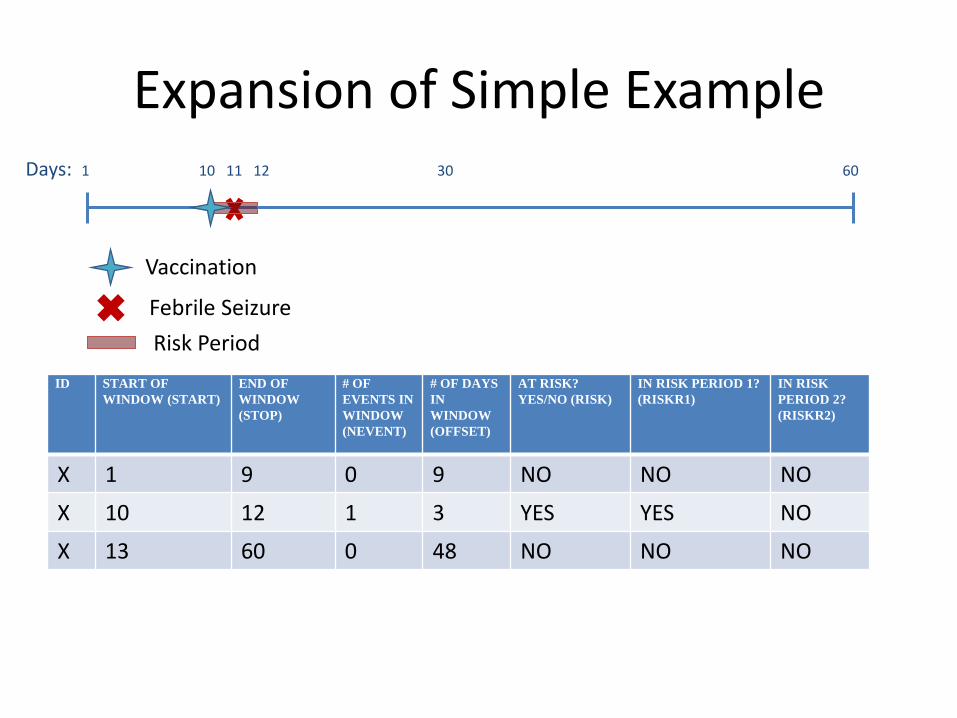
Expansion of Simple Example Days: 1 10 11 12 30 60
Febrile Seizure
Risk Period
Vaccination
ID START OF
WINDOW (START)
END OF
WINDOW
(STOP)
# OF
EVENTS IN
WINDOW
(NEVENT)
# OF DAYS
IN
WINDOW
(OFFSET)
AT RISK?
YES/NO (RISK)
IN RISK PERIOD 1?
(RISKR1)
IN RISK
PERIOD 2?
(RISKR2)
X 1 9 0 9 NO NO NO
X 10 12 1 3 YES YES NO
X 13 60 0 48 NO NO NO
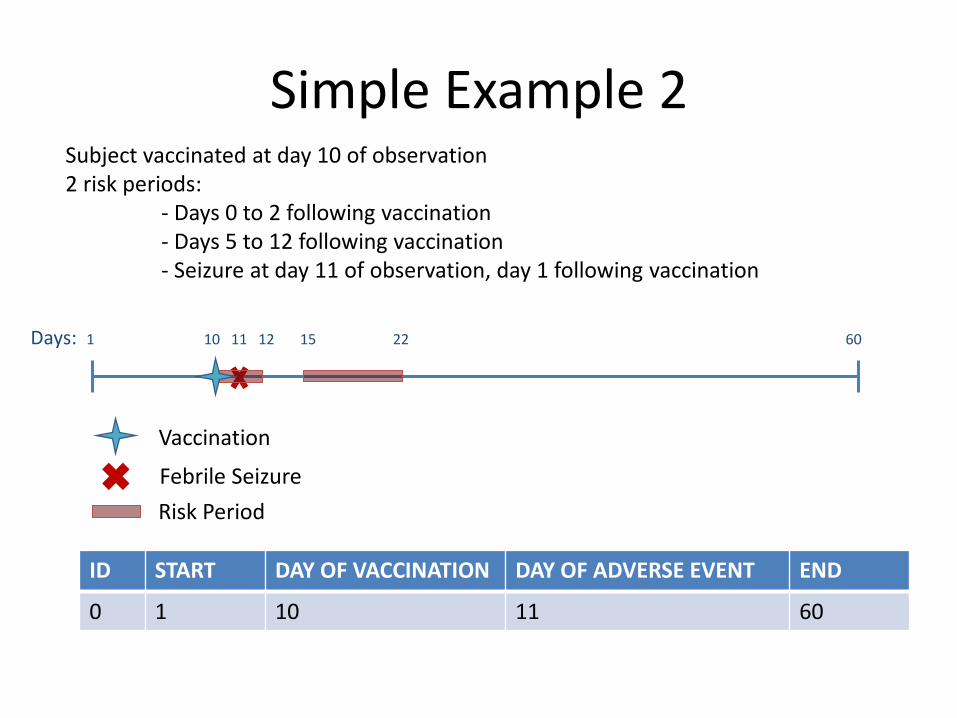
Simple Example 2 Subject vaccinated at day 10 of observation 2 risk periods: - Days 0 to 2 following vaccination - Days 5 to 12 following vaccination - Seizure at day 11 of observation, day 1 following vaccination
Days: 1 10 11 12 15 22 60
Febrile Seizure
Risk Period
Vaccination
ID START DAY OF VACCINATION DAY OF ADVERSE EVENT END
0 1 10 11 60

Expansion of Simple Example Days: 1 10 11 12 15 22 60
Febrile Seizure
Risk Period
Vaccination
ID START OF
WINDOW (START)
END OF
WINDOW
(STOP)
# OF
EVENTS IN
WINDOW
(NEVENT)
# OF DAYS
IN
WINDOW
(OFFSET)
AT RISK?
YES/NO (RISK)
IN RISK PERIOD 1?
(RISKR1)
IN RISK
PERIOD 2?
(RISKR2)
X 1 9 0 9 NO NO NO
X 10 12 1 3 YES YES NO
X 13 14 0 2 NO NO NO
X 15 22 0 8 YES NO YES
X 23 60 0 38 NO NO NO

Exercise For the exercise:
The observation period is from day 1 to day 60 inclusive. Risk periods are days 0 to 2 and 5 to 12 following vaccination.
The observation period covers approximately 2 months and all data is on the observation period scale, meaning subject 2 received the first dose six
days after the start of the observation period. Expand data for subjects two and three.
ID START END DAY OF OBSERVATION AT EVENT
DOSE 1 DOSE 2 DOSE 3
2 0 60 44 6 40 .
3 0 60 23 47 . .
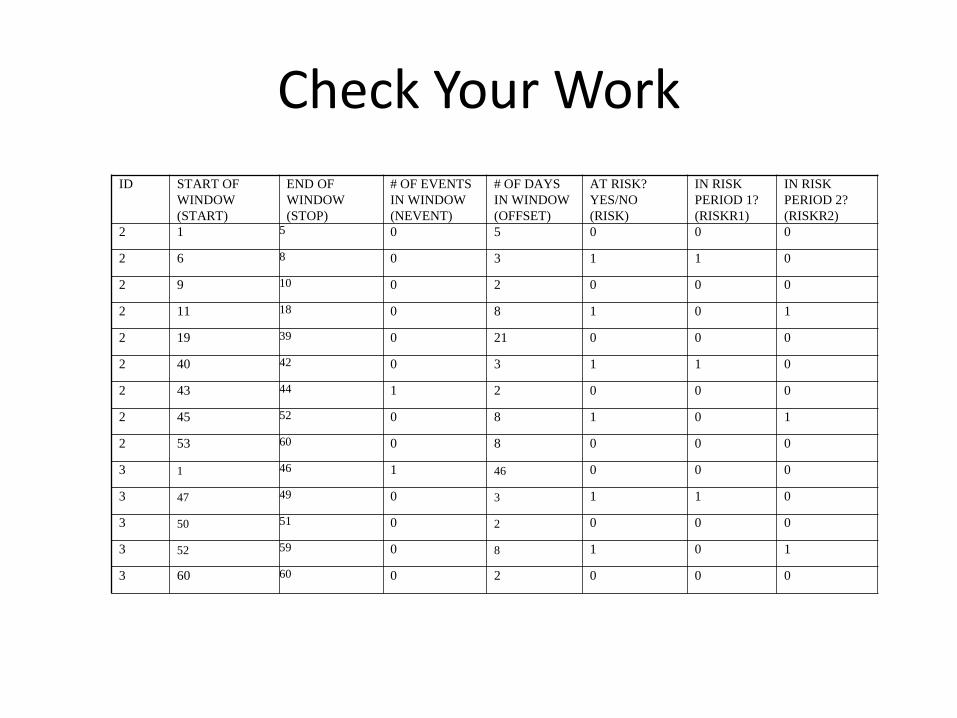
Check Your Work
ID START OF
WINDOW
(START)
END OF
WINDOW
(STOP)
# OF EVENTS
IN WINDOW
(NEVENT)
# OF DAYS
IN WINDOW
(OFFSET)
AT RISK?
YES/NO
(RISK)
IN RISK
PERIOD 1?
(RISKR1)
IN RISK
PERIOD 2?
(RISKR2)
2 1 5 0 5 0 0 0
2 6 8 0 3 1 1 0
2 9 10 0 2 0 0 0
2 11 18 0 8 1 0 1
2 19 39 0 21 0 0 0
2 40 42 0 3 1 1 0
2 43 44 1 2 0 0 0
2 45 52 0 8 1 0 1
2 53 60 0 8 0 0 0
3 1 46 1 46 0 0 0
3 47 49 0 3 1 1 0
3 50 51 0 2 0 0 0
3 52 59 0 8 1 0 1
3 60 60 0 2 0 0 0

Exercise - SAS For the exercise:
The observation period is from day 1 to day 60 inclusive. Risk periods are days 0 to 2 and 5 to 12 following vaccination. Subjects may
experience more than one event.
The observation period covers approximately 2 months and all data is on the observation period scale, meaning subject 1 received the first dose 50
days before the start of the observation period.
ID START END DAY OF OBSERVATION AT EVENT1
DAY OF OBSERVATION AT EVENT 2
DOSE 1 DOSE 2 DOSE 3
1 0 60 17 . -50 -7 32
2 0 60 44 . 6 40 .
3 0 60 23 . 47 .
4 0 60 7 31 6 30 .
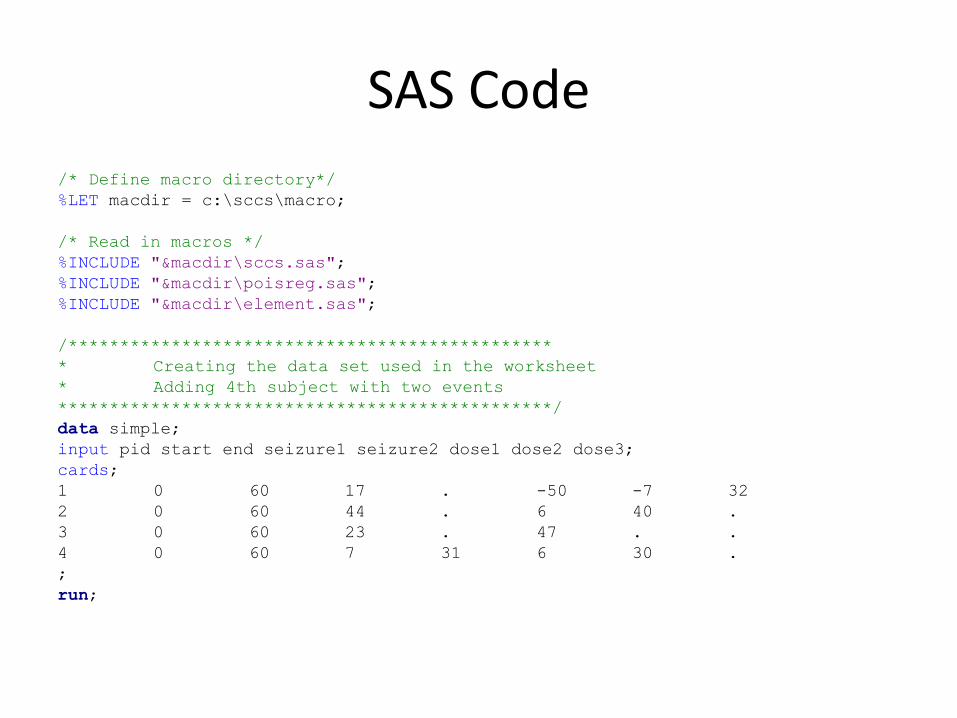
SAS Code
/* Define macro directory*/
%LET macdir = c:\sccs\macro;
/* Read in macros */
%INCLUDE "&macdir\sccs.sas";
%INCLUDE "&macdir\poisreg.sas";
%INCLUDE "&macdir\element.sas";
/***********************************************
* Creating the data set used in the worksheet
* Adding 4th subject with two events
************************************************/
data simple;
input pid start end seizure1 seizure2 dose1 dose2 dose3;
cards;
1 0 60 17 . -50 -7 32
2 0 60 44 . 6 40 .
3 0 60 23 . 47 . .
4 0 60 7 31 6 30 .
;
run;
SAS Code
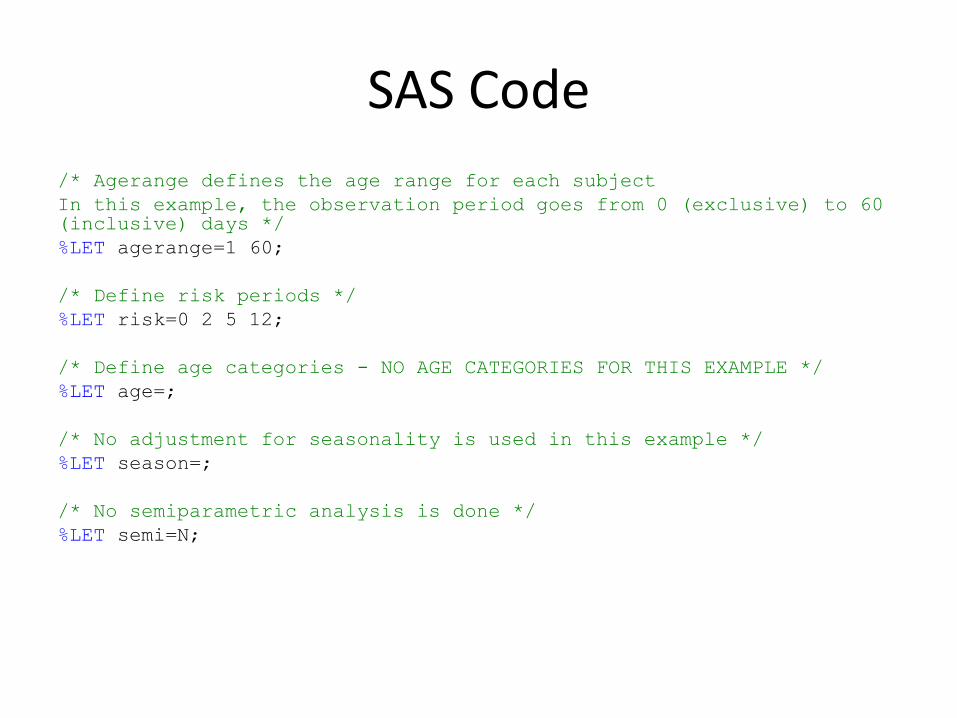
/* Agerange defines the age range for each subject
In this example, the observation period goes from 0 (exclusive) to 60 (inclusive) days */
%LET agerange=1 60;
/* Define risk periods */
%LET risk=0 2 5 12;
/* Define age categories - NO AGE CATEGORIES FOR THIS EXAMPLE */
%LET age=;
/* No adjustment for seasonality is used in this example */
%LET season=;
/* No semiparametric analysis is done */
%LET semi=N;

SAS Code to format the data set
/* ********** */
/* ALL DOSES */
/* ********** */
/*Create dataset for use with case series analysis*/
%sccs(data=simple, pid=pid, events=seizure1 seizure2, vacc=dose1 dose2 dose3,
startst=start, endst=end);

SAS data set pid _dob start stop nevt offset age season risk riskR1 riskR2 riskV1 riskV2 riskV3 risk1 risk2 risk3 risk4 risk5 risk6 l_off int
1 0 0 5 0 5 1 0 1 0 1 0 1 0 0 0 0 1 0 0 1.60944 1
1 0 5 31 1 26 1 0 0 0 0 0 0 0 0 0 0 0 0 0 3.2581 1
1 0 31 34 0 3 1 0 1 1 0 0 0 1 0 0 0 0 1 0 1.09861 1
1 0 34 36 0 2 1 0 0 0 0 0 0 0 0 0 0 0 0 0 0.69315 1
1 0 36 44 0 8 1 0 1 0 1 0 0 1 0 0 0 0 0 1 2.07944 1
1 0 44 60 0 16 1 0 0 0 0 0 0 0 0 0 0 0 0 0 2.77259 1
2 0 0 5 0 5 1 0 0 0 0 0 0 0 0 0 0 0 0 0 1.60944 1
2 0 5 8 0 3 1 0 1 1 0 1 0 0 1 0 0 0 0 0 1.09861 1
2 0 8 10 0 2 1 0 0 0 0 0 0 0 0 0 0 0 0 0 0.69315 1
2 0 10 18 0 8 1 0 1 0 1 1 0 0 0 1 0 0 0 0 2.07944 1
2 0 18 39 0 21 1 0 0 0 0 0 0 0 0 0 0 0 0 0 3.04452 1
2 0 39 42 0 3 1 0 1 1 0 0 1 0 0 0 1 0 0 0 1.09861 1
2 0 42 44 1 2 1 0 0 0 0 0 0 0 0 0 0 0 0 0 0.69315 1
2 0 44 52 0 8 1 0 1 0 1 0 1 0 0 0 0 1 0 0 2.07944 1
2 0 52 60 0 8 1 0 0 0 0 0 0 0 0 0 0 0 0 0 2.07944 1
3 0 0 46 1 46 1 0 0 0 0 0 0 0 0 0 0 0 0 0 3.82864 1
3 0 46 49 0 3 1 0 1 1 0 1 0 0 1 0 0 0 0 0 1.09861 1
3 0 49 51 0 2 1 0 0 0 0 0 0 0 0 0 0 0 0 0 0.69315 1
3 0 51 59 0 8 1 0 1 0 1 1 0 0 0 1 0 0 0 0 2.07944 1
3 0 59 60 0 1 1 0 0 0 0 0 0 0 0 0 0 0 0 0 0 1
4 0 0 5 0 5 1 0 0 0 0 0 0 0 0 0 0 0 0 0 1.60944 1
4 0 5 8 1 3 1 0 1 1 0 1 0 0 1 0 0 0 0 0 1.09861 1
4 0 8 10 0 2 1 0 0 0 0 0 0 0 0 0 0 0 0 0 0.69315 1
4 0 10 18 0 8 1 0 1 0 1 1 0 0 0 1 0 0 0 0 2.07944 1
4 0 18 29 0 11 1 0 0 0 0 0 0 0 0 0 0 0 0 0 2.3979 1
4 0 29 32 1 3 1 0 1 1 0 0 1 0 0 0 1 0 0 0 1.09861 1
4 0 32 34 0 2 1 0 0 0 0 0 0 0 0 0 0 0 0 0 0.69315 1
4 0 34 42 0 8 1 0 1 0 1 0 1 0 0 0 0 1 0 0 2.07944 1
4 0 42 60 0 18 1 0 0 0 0 0 0 0 0 0 0 0 0 0 2.89037 1

Sas Code to Run the Analysis
/* Perform the case series analysis */
%poisreg(data=wk_sccs,y=nevt,covar=int riskr1
riskr2, offset=offset
,elim=pid,prntyn=Y,title="Seizure and DTP -
All events");

SAS Output
Seizure and MMR - All events
Wald 95% Confidence Limits
Exp 95% Confidence Limits
Parameter Estimate Standard Error Lower Upper Chi-square Pr>ChiSq
Exp Estimate Lower Upper
INT -3.6 0.8 -5.2 -2.0 18.5 <.0001 0.0 0.0 0.1
RISKR1 1.8 0.9 -0.1 3.6 3.6 0.1 5.9 0.9 36.8
RISKR2 -19.0 8182.6 -16056.7 16018.7 0.0 1.0 0.0 0.0 .