executive summary - stanford university · executive summary amoco announced recently that it will...
TRANSCRIPT

EXECUTIVE SUMMARY
Amoco announced recently that it will expand its production capacity of Polypropylene
(PP). It is planning to start the construction during the remaining months of 1997, in
order to operate the additional capacity in late 1999. After the analysis of the industry
structure and trends, Amoco’s position and relevant financial issues, we recommend the
following:
• Increase its capacity of production of PP by four lines, i.e. 551 thousand metric tons
per year. This is the best alternative under any future scenario.
• Start the construction of the new lines of production in 1997, as it takes two years to
finish the construction and the PP industry will have lower operating rate and margins
during 1998-1999.
• Start operating of the additional capacity in 2000, when the PP industry will initiate a
five year upward cycle.

Introduction 1
Polypropylene Industry
Polypropylene resins (PP) represent the fastest-growing category of commodity
thermoplastic resins in the world and are now surpassed only by the polyethylene and
polyvinyl chloride (PVC) in total volume of production. Over 100 companies produce PP
in 40 countries. The largest single end-use markets for PP are transportation, films, fibers,
filaments and various consumer products (as we will see in a more detailed analysis).
Over the past 20 years, the demand for petrochemicals has seen sharp ups and downs.
Broadly, PP demand mirrors economic activity and follows the basic business cycles in
addition to its own characteristic cycle. The relative maturity of the PP market implies
stable long-term growth rates; and capacity expansions occur only in large increments.
Thus the adjustment of capacity to demand creates supply cycles. This has lead to a
cooperative behavior in the whole industry. Since all players know the possible future
consequences of their different strategies, they prefer cooperating in order to have a
stable market and specially, stable prices . Therefore, the industry is characterized by
avoiding war prices.
Company Background
Amoco Corporation is a worldwide integrated petroleum and chemical company based in
Chicago, Illinois. Amoco’s PP business is an integral part of a value chain extending
from the wellhead through the feedstocks group to polymers, and on to fibers and fabrics.
1 This project, provided by SRI Consulting, is the analysis, study and evaluation of a Polypropylene Plant Expansion Proposal for theAmoco Corporation

It is the world’s second-largest PP producer with world-scale plants in the United- States
and Europe ( refer to Appendix I for Amoco’s position in the global PP industry)
Amoco Chemicals, a subsidiary of Amoco, has recently announced plans to increase its
global PP manufacturing capacity by 330,000 tons per year, 76% of which is projected to
be in the United States. The new expansion (expected to be in the Chocolate Bayou plant,
Texas) will be projected to extend Amoco’s capacity to 1.1 million tons per year.
Problem Statement
We will analyze the strategic decision of Amoco Chemicals to expand its production of
PP. Our objective is to estimate through scenario analysis the appropriate size of the plant
in the different and uncertain future environments. Therefore our study will focus on the
evaluation of alternatives regarding the number of lines of production that can be
considered for the expansion in the U.S. market.
In order to conduct the analysis, we developed six models. We followed the steps
described in the graph appearing in the next page.

Problem Framing
Decision Hierarchy
In order to fully understand the key uncertainties and quantities relevant to our analysis,
we have framed the problem by creating a decision hierarchy.
Taken as given:
• Decision to expand
• Manufacturing technology and supplier conditions (current)
• Stay within the PP industry
• Maintain profitability and long-term objectives
• Choice of end-use markets to be targeted
• Policy: expansion by construction (no joint ventures nor alliances)
Strategic issues to be addressed:
• International and/or domestic market
• Pricing strategy
• Capacity expansion
Tactical and operational issues:
• Financial considerations for this project
• Relationship with the customers and suppliers
Policy
Strategy
Tactics
The focus of this analysis was the strategic evaluation of capacity expansion. Given the
time restriction, we limited our study to this main issue. Any further analysis might
consider the other strategic elements presented above.
Decision Analysis
The decision analysis captures the essential uncertainties relevant to the strategic decision
under consideration. From the specialized literature and historical data we have found a
clear and strong relevance between the industry operating rate, margins and prices of PP

resins. In addition to the industry “capacity utilization”2, Amoco’s volume of sales, costs
and market share influence the Net Present Value of the future cash flow stream. The
following decision diagram illustrates our decision model.
Size ofExpansion
Amoco’sMarket Share
Industr yAnnounced&Exi
Capacity
OperatingRate of theIndustr y
Value
Industr yPP Demand
Mar gin
Amoco’sVolume of Sales
Amoco’sOperating Rate
Amoco’sProduction Cost
Price of theRaw Materials
Decision Diagram
Decision Node
Size of expansion
In this project, our concern is to recommend the size of expansion. Three alternatives are
possible: one, two, or four production lines.
Uncertainty Nodes
2 Capacity Utilization and Operating rate are used alternatively in the document

Industry PP demand
Demand Forecast is a major issue in this project since it influences the operating rate,
which in turn affects the margins, and the Amoco’s revenues.
Operating Rate of the Industry
The operating rate will be obtained from the estimated PP demand and the overall
capacity in the North American market. This study considers the current and already
announced increase in the capacity.
Margin
To assess PP margin, we use the expected operating rate and the “hockey-stick profile”
described in detail later in this report.
Market Share
Amoco’s market share is influenced by its capacity.
Amoco’s Volume of Sales
Affected by Amoco’s market share and the size of the expansion.
Amoco’s Operating Rate
Influenced by Amoco’s volume of sales and capacity.
Price of Raw Materials
The fluctuations of the price of raw materials (oil for example) have an important affect
on the production cost of PP resins.
Amoco’s Production Cost
Results from the price of raw materials and Amoco’s operating rate and capacity.
Deterministic Nodes
Industry Capacity

The overall capacity is determined by the announced and expected plant expansions of
the competitors under the different scenarios.
Conceptual Tools
A better understanding of the PP industry structure enables us to clearly determine
Amoco’s position within the petrochemical industry, its weaknesses and strengths. To
conduct the analysis, we have used Porter’s Five Forces Analysis as described below.
Porter’s Five Forces Analysis ( Appendix II )
Entry Barriers
• The petrochemical industry in general and the production of PP in particular are
capital intensive. The level of investment required to construct a new plant or add
capacity is so large that its size constitutes a barrier to any new firm considering the
future production of PP.
• The knowledge and ownership of technology is required in order to operate
efficiently. Licensing is an important issue for firms that do not own the technology.
• The development of client confidence and approval is a very long and painful process
in the PP industry, especially in the case of big customers.
• Economies of scale are important since the cost efficiency is the main determinant of
success or failure.
Rivalry determinants
• Any technological breakthrough can change the structure of the industry; only the
technological leaders can survive.

• R&D is an important marketing tool; through the proposal of usage of PP as a
substitute in existing products or in the creation of new products will create more
market.
• Recycling laws and social pressures imposed on the industry lead the major players to
devise new ways to improve the recycling of PP.
Suppliers
• Bargaining power of oil suppliers: companies which are vertically integrated are less
subjected to the uncertainties related to oil supply and price.
• Alliances and associations between oil suppliers may provoke upsurges in oil prices.
Substitutes
• PVC and PET are potential substitutes of PP for some end uses. PET in particular
enjoys a better infrastructure for its post-used recuperation and recycling. For
example, this was the leading reason for Heinz Corporation to replace PP with PET in
the bottles of Ketchup.
• Costs of substitution are low because the switch cost among different processes of
plastic production is not very high.
• Improvement in the quality of other plastic resins such as strength or transparency can
provoke future replacement of PP.
Determinants of buyer power
• The buying power of big users is significant. The volume purchased by a certain user
may influence the selling price of the market. This industry weakness is explained by

the fact that some end use segments are highly concentrated and result in a thin
market.
• PP being a commodity, a potential buyer is able to shop around and find a better price
anywhere in the world.
• Relationships between producer and buyer of PP, once developed, are very strong and
long lasting. This constitutes a strength from the supplier point of view.
Scenario Analysis
In order to analyze the decision under consideration we have used the scenario analysis
planning methodology. We have generated scenarios in order to create strategic
alternatives which have then been evaluated. The important key factors we have
considered to build feasible scenarios for the future are:
• Worldwide Political situation: Since the product(s) is(are) commodity, the events in
the international scene affect sales, even in the domestic market. They can also
affect the cost of production, being highly correlated to oil prices, and therefore the
margin.
• Worldwide Economic Situation:
� The performance of the world economy affects the demand for PP resins,
which in turn provoke a drop in the rate of capacity utilization. As our
analysis will show later, this can have drastic effects on the profitability of the
industry.
� As indication of economic performance, we have considered Gross Domestic
Product (GDP) as the lead indicator. For purposes of this analysis we have

considered the GDP growth in the world, in the OECD and in developing
countries.
• Competitors’ action:
� Globalization of the PP industry can extend the movement of its products
across borders and therefore increase its growth and efficiency.
� Capacity: The countries or firms that will increase the capacity of production
of PP might change the structure of the whole industry. Who has the
advantages?
• Cooperation / Alliances: Barriers to free cooperation and alliances (such as joint
ventures, licensing) limit efficiency and the future growth of the industry.
• Technology and skills: Improvements and compatibility of technology, as well as
availability of efficient skills are very important for the growth of the PP industry.
• Market Size for PP: Since PP is a raw material for several industries, the end-use
segments are key elements that influence the market growth.
• Supply / Demand Balance: This has an important impact on the industry operating
rate and therefore on the margins.
• Volatility of PP prices: Volatility of unit selling prices means uncertainty about the
future cash flow generated by the industry and thus add difficulties to planning.
We have used all of the factors cited above to generate three general strategic scenarios:
pessimistic, base and optimistic. Appendix III illustrates a full description of these.
“Amoco Chemicals” Alternatives
For each scenario, we have generated three feasible alternatives related to the size of the
expansion:
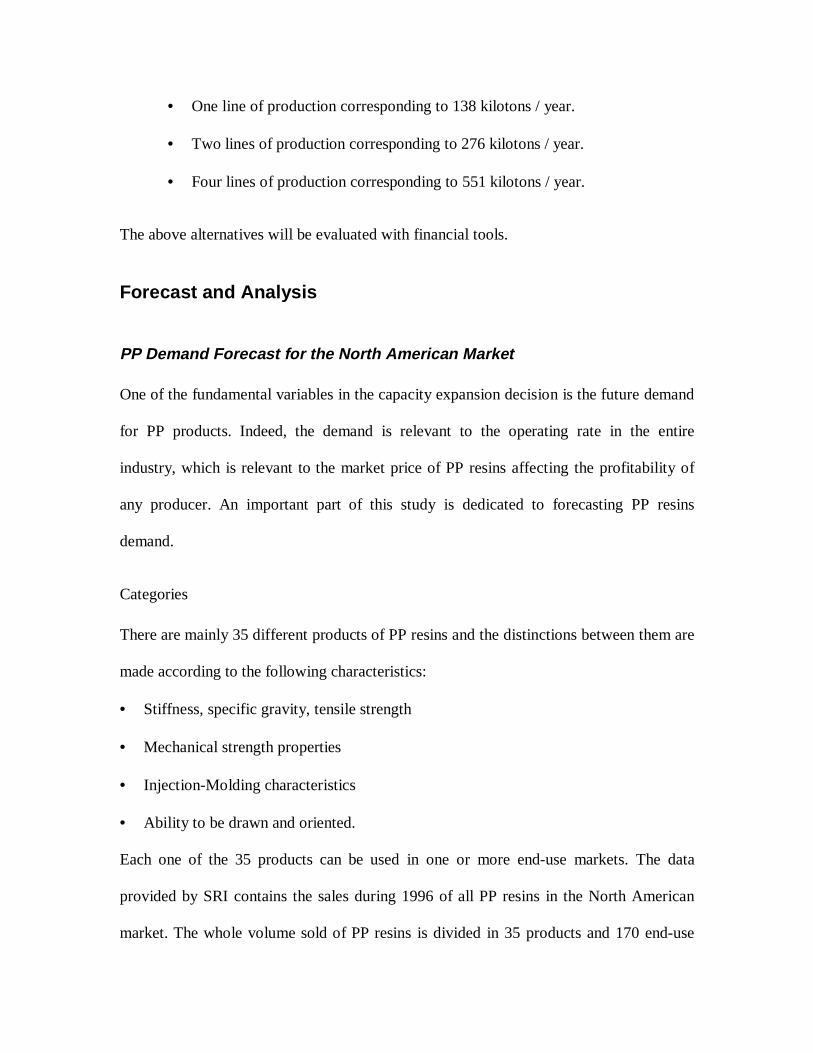
• One line of production corresponding to 138 kilotons / year.
• Two lines of production corresponding to 276 kilotons / year.
• Four lines of production corresponding to 551 kilotons / year.
The above alternatives will be evaluated with financial tools.
Forecast and Analysis
PP Demand Forecast for the North American Market
One of the fundamental variables in the capacity expansion decision is the future demand
for PP products. Indeed, the demand is relevant to the operating rate in the entire
industry, which is relevant to the market price of PP resins affecting the profitability of
any producer. An important part of this study is dedicated to forecasting PP resins
demand.
Categories
There are mainly 35 different products of PP resins and the distinctions between them are
made according to the following characteristics:
• Stiffness, specific gravity, tensile strength
• Mechanical strength properties
• Injection-Molding characteristics
• Ability to be drawn and oriented.
Each one of the 35 products can be used in one or more end-use markets. The data
provided by SRI contains the sales during 1996 of all PP resins in the North American
market. The whole volume sold of PP resins is divided in 35 products and 170 end-use

markets. The first task in the process of estimating the future demand is to summarize the
volume of PP in 7 categories, each category takes into account both the PP resin type and
its applications (Appendix IV). The determination of each category and its share in the
global volume appears below.
Table 1: Partitioning the PP industry
Category Share in the PP Industry
(%)
I Homopolymer: Injection Molding 19
II Homopolymer: Fiber & Film 39
III Homopolymer: Others 6
IV Impact Copolymer 14
V Random Copolymer 8
VI Compounds 2
VII Exports 12
Composition of each category
Historical data from Appendix IV is used to estimate the contribution of the most
important end-use markets to each one of the seven categories described in the table
above. As an example , the graph below shows the composition of Category I.

Category I
37%
6%34%
14%
7% 2%RIGID PACKAGING
APPLIANCES
CONSUMER PRODUCTS
OTHER
MEDICAL PRODUCTS
TRANSPORTATION
As we want to capture a relevant percentage of the overall sales for that category, we
have neglected end uses that have a small impact on the overall.
Forecast
For each one of the end uses of the categories considered, we have applied the product
diffusion model methodology, and added the results for each category to obtain the
overall demand of PP over the years 1997-2010. We have also computed the
corresponding annual growth rates.
This has lead to estimates for the optimistic scenario: we have used our personal
judgment in the estimation of some of the parameters of the analytical model (see next
paragraph). The estimate of PP demand for each year allows us to calculate the implied
growth rate for the optimistic scenario. To these annual growth rates we subtracted 2 and
3.5 percentage points, respectively, to obtain the corresponding growth rates for the base
and the pessimistic scenarios. The adjusted growth rates are estimated from our
understanding of the structure of the PP industry, combining both the information from
the Chemical Economics Handbook and opinions of experts at SRI. The results we have
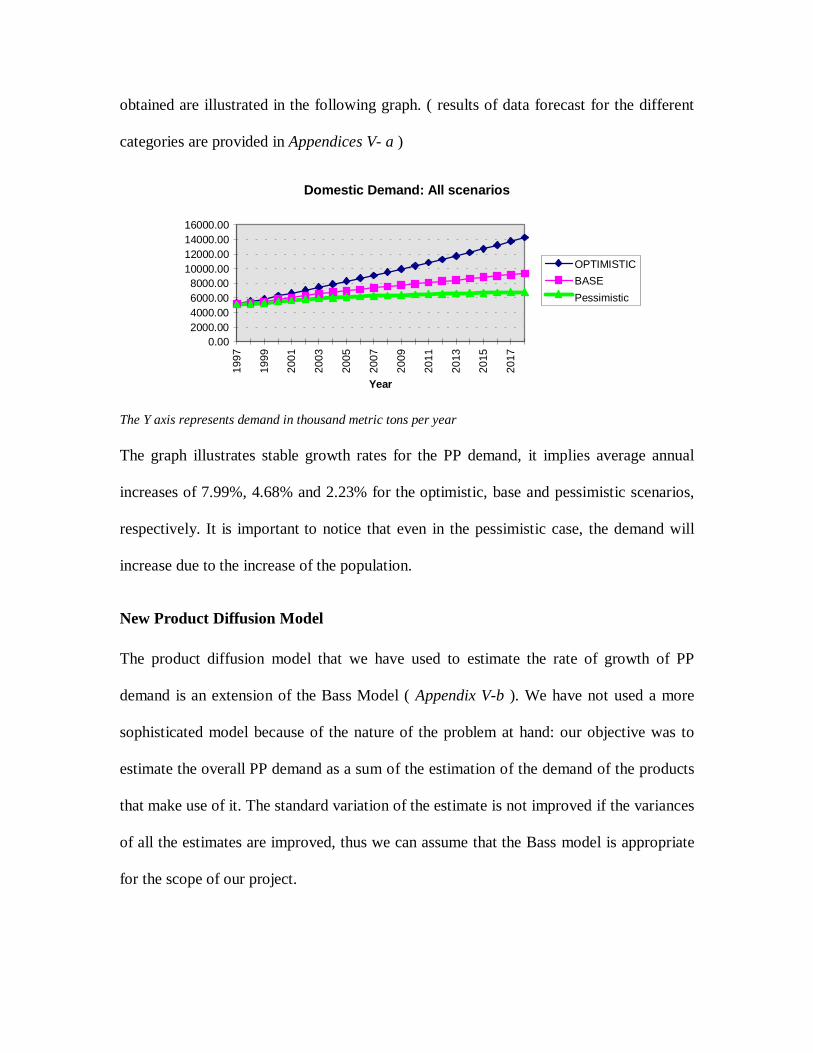
obtained are illustrated in the following graph. ( results of data forecast for the different
categories are provided in Appendices V- a )
Domestic Demand: All scenarios
0.002000.004000.006000.008000.00
10000.0012000.0014000.0016000.00
1997
1999
2001
2003
2005
2007
2009
2011
2013
2015
2017
Year
OPTIMISTIC
BASE
Pessimistic
The Y axis represents demand in thousand metric tons per year
The graph illustrates stable growth rates for the PP demand, it implies average annual
increases of 7.99%, 4.68% and 2.23% for the optimistic, base and pessimistic scenarios,
respectively. It is important to notice that even in the pessimistic case, the demand will
increase due to the increase of the population.
New Product Diffusion Model
The product diffusion model that we have used to estimate the rate of growth of PP
demand is an extension of the Bass Model ( Appendix V-b ). We have not used a more
sophisticated model because of the nature of the problem at hand: our objective was to
estimate the overall PP demand as a sum of the estimation of the demand of the products
that make use of it. The standard variation of the estimate is not improved if the variances
of all the estimates are improved, thus we can assume that the Bass model is appropriate
for the scope of our project.

We have used our judgment to estimate the value of the following parameters related to
the pattern of purchase of each specific product:
Qa: average units per adoption purchase.
Qr: average units per repeat purchase
Qt: average units per trial purchase.
Pa : percentage of new triers in year t-1 who become adopters in year t
Pr : percentage of adopters in year t-1 who become repeaters in year t
A simple way to think about the first three parameters is to fix the average units per
repeat purchase and then think about the ratios Qa/Qr and Qt/Qr. As the end-use products
we considered have become over time commodities, we found out that these ratios may
be considered equal to one. We considered values between 0.5 and 1 for Pa and Pr, with
Pr usually greater than Pa. This is explained by the following assumption: once one tries a
product, one becomes an adopter with high probability and similarly, given that one is an
adopter, one becomes a repeater with high probability.
Available historical data of PP resins total sales (1982-1996) allowed us to estimate the
parameters p, q and m of the basic Bass Model using linear regression. In order for this
methodology to be valid and to get reasonable values, we have generated data prior to
1982 because this particular year does not represent the start of the considered markets
(we have assumed a constant rate of growth of sales up to 1982).
PP Production and Capacity Utilization in the North American Market
The overall production in the domestic market is obtained by the demand forecast (which
includes the exports) added to the net stock increase minus the imports, and has been
computed for all three scenarios: pessimistic, base and optimistic ( Appendix VI )

Production = Domestic Demand + Exports + Net Stock Increase - Imports
As Category VII represents the estimates of Exports to North America, we had to forecast
both the Net Stock Increase and the Imports in order to estimate the PP production from
1997 to 2010.
Net Stock Increase
For all scenarios, we have assumed that the net stock increase for 1998 is 1% of the total
demand of 1997 and this percentage decreases linearly each year by 0.04% (up to 2010).

Imports
The level of imports of 1996 are assumed to grow at a constant yearly rate for each
scenario. For the base case this rate is 3% , which is the expected growth of the world
economy. In the optimistic case, it is assumed to be 5% : this value is higher than the base
case because we assume that our economy grows faster than the capacity of reaction of
the PP producer. As for the pessimistic case, we assume a rate of 8% , expecting the
national consumers to buy foreign PP.
Domestic Pr oduction
0.00
2000.00
4000.00
6000.00
8000.00
10000.00
12000.00
14000.00
16000.00
18000.00
1997
1999
2001
2003
2005
2007
2009
2011
2013
2015
2017
OPTIMISTIC
BASE
Pessimistic
The Y axis represents production in thousand metric tons per year
Our model to forecast the domestic production insinuates a linear relationship between
the demand and the domestic production for each scenario. Consequently, the future
variation of both quantities have the same shape.
Operating Rate
As we have already mentioned previously, the overall capacity of the PP industry is given
by the sum of the actual and the future announced capacities of all the 15 companies
involved in the production of PP in North America (Appendix VII). The estimate of the

future production capacity takes into account only the capacity expansion projects
already announced.
In the previous section we presented our estimates of the production of PP, these numbers
divided by the nominal capacities (existing and announced) determine the operating rate
of the whole industry.
Operating rate for the PP Industry
80
82
84
86
88
90
92
94
1997
1998
1999
2000
2001
2002
2003
2004
2005
2006
2007
2008
2009
2010
%
BASE
OPTIMISTIC
PESSIMISTIC
Our assumption that the PP Industry is characterized by avoiding war prices and
cooperating each time any one of the 15 producers increases its capacity of production
provoked that the variation of operating rate estimates in the three scenarios have the
same shape and are relatively close. Our result suggests that the current upward trend in
the PP industry will continue until 1998, when it will starts the cyclical downward path
for two years. In 2000, we forecast that the positive cycle will start again and will last 5
years. As explained in the literature, when the demand is high, the prices of
petrochemicals in general and PP in particular augment. Consequently, the producers
increase their respective capacities provoking a decrease in the operating rate, which
causes a drop in the prices.

Amoco announced that the increase of capacity will start operation in 1999, during our
study we assumed that half of the new capacity will begin operation in 1999 and the
entire additional capacity will start in 2000. According to our analysis, this is an adequate
timing because the capacity utilization will start increasing at this time, provoking a
gradual improvement of prices and margins.
Producers market share
The main objective of this phase of the study is to estimate Amoco’s market share from
1997 to 2010, in order to determine its capacity utilization . As stated earlier in this
report, the behavior of PP industry is characterized by avoiding war prices. Therefore,
whenever a producer increases its capacity, all other players make room for the additional
production, i.e. the overall operating rate in the industry decreases and apply
approximately to all producers. This behavior indicates a global cooperation in the
industry in favor of maintaining the stability.
We estimated every producer’s market share; Amoco’s market share is presented in the
graph below (refer to Appendix VIII for other producers’ market share).
1997
1999
2001
2003
2005
2007
2009
OPT.BASE
PESS.10%
11%
12%
13%
14%
15%
YEAR
AMOCO's MARKET SHARE
OPT.
BASE
PESS.

As shown in the above graph, the market share for Amoco is almost maintained under the
three scenarios and this is explained by the cooperative behavior in this industry and our
assumptions.
Forecast of PP Price
We used the Hockey Stick Profiles3 which relates the operating rate of the entire industry
to the marginal cash flow return of investment (CFROI) for petrochemical products in
general and PP in particular.
The main concept of this methodology is that there exists a critical operating rate and
when attained it affects drastically the margin of the petrochemical under consideration.
Below the critical point, the market is a buyer’s market because the supply is higher than
the demand. Above this critical point, the market is a producer’s market because the
major part of the capacity available is being used so the producers can set the prices. We
estimated the price of each one of the 35 products following the steps:
Step 1
A low grade product is chosen as the marker, in our analysis this product is
Fiber_Raffia/Slit Film (mkt14). Historical data are used in order to find the relationship
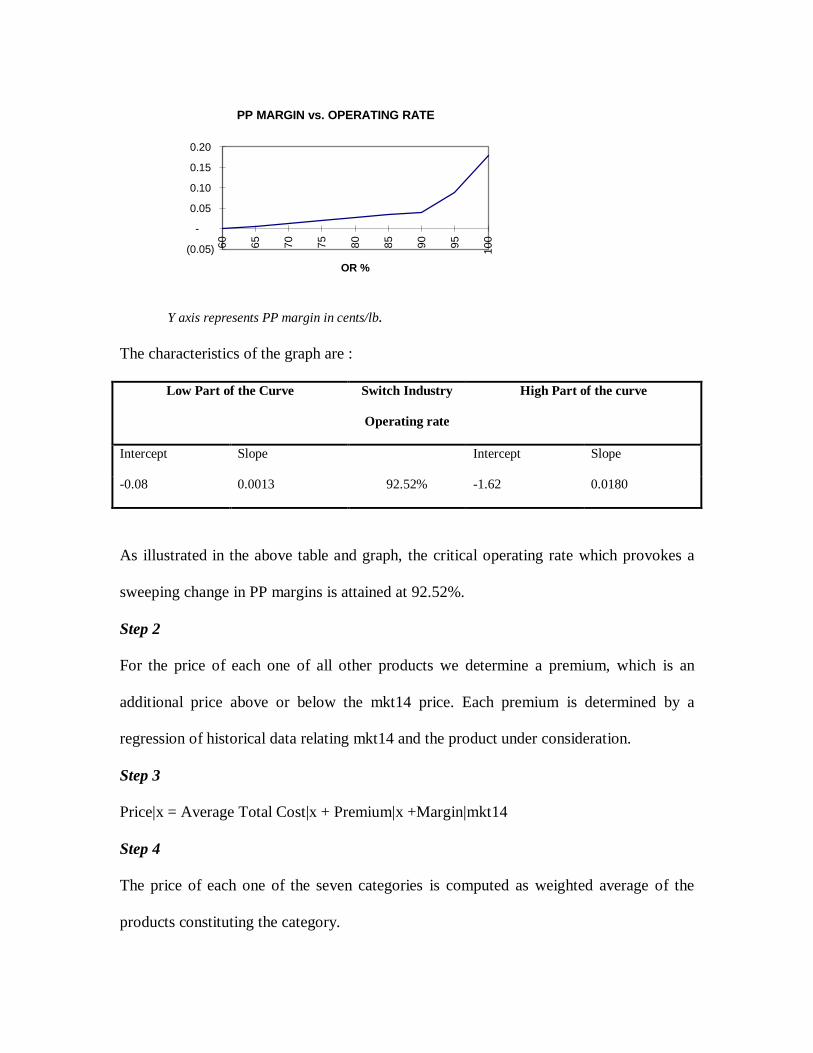
between mkt14 margin and the operating rate of the entire industry. The result is shown
as follows:
31. Walter Sedriks “Petrochemical Industry Cycles and Scenarios”, CMRA Atlanta Meeting. Atlanta,. October 1, 1996.2. Walter Sedriks “Petrochemical Industry Drivers”, CHEMTECH November 1995.3. Walter Sedriks “ Understanding the Petrochemical Cycle” Hydrocarbon Processing March 1994
PP MARGIN vs. OPERATING RATE
(0.05)
-
0.05
0.10
0.15
0.20
60 65 70 75 80 85 90 95 100
OR %
Y axis represents PP margin in cents/lb.
The characteristics of the graph are :
Low Part of the Curve Switch Industry
Operating rate
High Part of the curve
Intercept Slope Intercept Slope
-0.08 0.0013 92.52% -1.62 0.0180
As illustrated in the above table and graph, the critical operating rate which provokes a
sweeping change in PP margins is attained at 92.52%.
Step 2
For the price of each one of all other products we determine a premium, which is an
additional price above or below the mkt14 price. Each premium is determined by a
regression of historical data relating mkt14 and the product under consideration.
Step 3
Price|x = Average Total Cost|x + Premium|x +Margin|mkt14
Step 4
The price of each one of the seven categories is computed as weighted average of the
products constituting the category.

The final result for the optimistic scenario is shown as follows (refer to Appendix IX for
the base and pessimistic scenarios)
Estimated Prices for the Optimistic Scenario
1997
1999
2001
2003
2005
2007
2009
I
III
VVII
0
20
40
60
80
100
Pric
e (c
/lb)
Year
Category
I
II
III
IV
V
VI
VII
Financial Model
Cost Structure of Amoco
Amoco is using the Horizontal Stirred Bed process which has the following costs
structure:
AMOCO's COST STRUCTURE1 LINE: 138 Kmt/year
INITIAL INVESTMENT34.01 Million$
FIXED COSTS9.10 Million$
VARIABLE COSTS27.22 C/LB
Raw Materials 17.67 27% Total Direct Costs 21.04 33% Plant Gate Cost 25.56 40%

2 LINES: 276 Kmt/year
INITIAL INVESTMENT51.2 Million$
FIXED COSTS21.47 Million$
VARIABLE COSTS24.46 C/LB
Raw Materials 17.67 29% Total Direct Costs 19.96 33% Plant Gate Cost 23.00 38%
4 LINES: 551 Kmt/year
INITIAL INVESTMENT73.35 Million$
FIXED COSTS50.54 Million$
VARIABLE COSTS24.19 C/LB
Raw Materials 17.67 30% Total Direct Costs 19.36 33% Plant Gate Cost 21.40 37%
The above costs estimation come from the financial statement provided by SRI (refer toAppendix X).
Financial Evaluation of Each Alternative
In our project, we assume the following:
• The new lines of production will have the same distribution and marketing strategy
as the current ones, i.e. we don’t take into account any possible variation in the
current general sales expenses.
• The after tax discount rate is 12%
• The income tax rate is 34%

• When either the two or four lines of production alternatives is implemented, half of
the expanded capacity starts operation in 1999 and the entire capacity operates at the
estimated Amoco’s operating rate in 2000.
The calculations of total revenues, costs, and cash flows are presented in Appendix XI .
The final results are:
(All numbers in million)PV OPTIMISTIC BASE PESSIMISTIC
ONE (138) 82.39$ 81.50$ 82.90$ TWO(276) 171.03$ 168.15$ 175.19$ FOUR(551) 300.06$ 296.42$ 262.40$
INVESTMENT OPTIMISTIC BASE PESSIMISTIC
ONE (138) 34.01$ 34.01$ 34.01$ TWO(276) 51.20$ 51.20$ 51.20$ FOUR(551) 73.35$ 73.35$ 73.35$
NPV OPTIMISTIC BASE PESSIMISTIC
ONE (138) 48.38$ 47.48$ 48.89$ TWO(276) 119.83$ 116.95$ 123.99$ FOUR(551) 226.71$ 223.07$ 189.05$

CONCLUSIONS
Recommendations
We recommend that Amoco Chemicals :
• Increase its capacity of production of PP by four lines, i.e. 551 thousand metric tons
per year. This is the best alternative under any future scenario.
• Start the construction of the new lines of production in 1997, as it takes two years to
finish the construction and the PP industry will have lower operating rates and
margins during 1998-1999.
• Start operating of the additional capacity in 2000, when the PP industry will initiate a
five year upward cycle. This will profit to Amoco Chemicals because:
⇒ The market demand for its products will be high
⇒ The high margins will favor a positive and constantly increasing cash flows,
allowing a large return on the initial investment.
⇒ The strength of the PP industry in this moment will allow Amoco to use above
88% of the new capacity for the next five years.
Summary
The timing to start operation (1999-2000) in any scenario and for any given alternative is
the best one, as the new expanded capacity will profit from the PP industry upward cycle.
The PP industry has a very good potential, the optimistic scenario estimates an average
annual growth of 7.99%, the base case which is considered to be the most likely has an
estimated growth rate of 4.68%. Even in the worst scenario, the demand will still grow at
an average rate of 2.23% per year due mainly to demographics.

In any given scenario the best alternative for Amoco Chemicals is to start the
construction of four lines of production, which implies 551 thousand metric tons per year.
The four line alternative has the highest Net Present Value in each scenario.
Suggestions for further analysis.
• Variation of market share of all producers in the PP industry can be meticulously
thought about by applying Game Theory. This will generate more scenarios for
Amoco’s capacity utilization.
• Analysis of the composition of sales of Amoco Chemicals and the estimated demand
for PP products should be further investigated in order to determine the best sales mix
permitting a higher profitability. This will generate more alternatives in the strategy
table.
• Evaluation of real option: consider the immediate construction of one or two lines of
production and depending on the market demand and margins, expand the capacity by
additional lines.
• Assessment of Amoco’s risk aversion coefficient for the evaluation of each
alternative under consideration.
TABLE OF CONTENTS
EXECUTIVE SUMMARY..................................................................................................................... 1
INTRODUCTION .................................................................................................................................. 2
POLYPROPYLENE INDUSTRY................................................................................................................... 2
COMPANY BACKGROUND....................................................................................................................... 2
PROBLEM STATEMENT........................................................................................................................... 3
PROBLEM FRAMING.......................................................................................................................... 4
DECISION HIERARCHY ........................................................................................................................... 4
DECISION ANALYSIS.............................................................................................................................. 4
CONCEPTUAL TOOLS........................................................................................................................ 7
PORTER’S FIVE FORCES ANALYSIS ( APPENDIX II ) ................................................................................. 7
SCENARIO ANALYSIS ............................................................................................................................. 9
“A MOCO CHEMICALS” A LTERNATIVES................................................................................................. 10
FORECAST AND ANALYSIS ............................................................................................................. 11
PP DEMAND FORECAST FOR THE NORTH AMERICAN MARKET .............................................................. 11
Categories...................................................................................................................................... 11
Composition of each category......................................................................................................... 12
Forecast......................................................................................................................................... 13
New Product Diffusion Model........................................................................................................ 14
PP PRODUCTION AND CAPACITY UTILIZATION IN THE NORTH AMERICAN MARKET ............................... 15
OPERATING RATE................................................................................................................................ 17
PRODUCERS MARKET SHARE................................................................................................................ 19
FORECAST OF PP PRICE ....................................................................................................................... 20
FINANCIAL MODEL .......................................................................................................................... 22
COST STRUCTURE OF AMOCO............................................................................................................... 22
FINANCIAL EVALUATION OF EACH ALTERNATIVE................................................................................. 23
CONCLUSIONS................................................................................................................................... 25
RECOMMENDATIONS............................................................................................................................ 25
SUMMARY ........................................................................................................................................... 25
SUGGESTIONS FOR FURTHER ANALYSIS................................................................................................. 26

APPENDIX X
AMOCO's COST STRUCTURE2 LINES: 276 Kmt/year 1 LINE: 138 Kmt/year 4 LINES: 551 Kmt/year
INITIAL INVESTMENT INITIAL INVESTMENT INITIAL INVESTMENT51.2 Million$ 34.01 Million$ 73.35 Million$
FIXED COSTS FIXED COSTS FIXED COSTS21.47 Million$ 9.10 Million$ 50.54 Million$
VARIABLE COSTS VARIABLE COSTS VARIABLE COSTS24.46 C/LB 27.22 C/LB 24.19 C/LB
Raw Materials 17.67 29% Raw Materials 17.67 27% Raw Materials 17.67 30% Total Direct Costs 19.96 33% Total Direct Costs 21.04 33% Total Direct Costs 19.36 33% Plant Gate Cost 23.00 38% Plant Gate Cost 25.56 40% Plant Gate Cost 21.40 37%
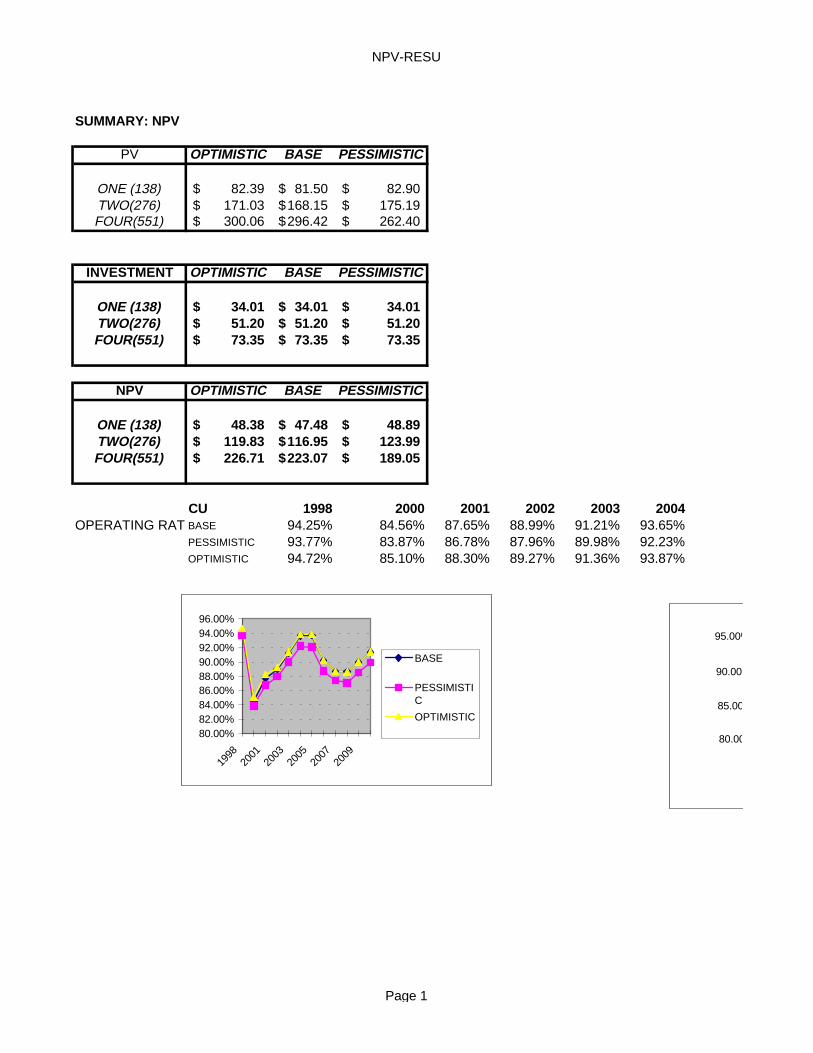
NPV-RESU
SUMMARY: NPV
PV OPTIMISTIC BASE PESSIMISTIC
ONE (138) 82.39$ 81.50$ 82.90$ TWO(276) 171.03$ 168.15$ 175.19$ FOUR(551) 300.06$ 296.42$ 262.40$
INVESTMENT OPTIMISTIC BASE PESSIMISTIC
ONE (138) 34.01$ 34.01$ 34.01$ TWO(276) 51.20$ 51.20$ 51.20$ FOUR(551) 73.35$ 73.35$ 73.35$
NPV OPTIMISTIC BASE PESSIMISTIC
ONE (138) 48.38$ 47.48$ 48.89$ TWO(276) 119.83$ 116.95$ 123.99$ FOUR(551) 226.71$ 223.07$ 189.05$
CU 1998 2000 2001 2002 2003 2004OPERATING RAT BASE 94.25% 84.56% 87.65% 88.99% 91.21% 93.65%
PESSIMISTIC 93.77% 83.87% 86.78% 87.96% 89.98% 92.23%OPTIMISTIC 94.72% 85.10% 88.30% 89.27% 91.36% 93.87%
80.00%82.00%84.00%86.00%88.00%90.00%92.00%94.00%96.00%
1998
2001
2003
2005
2007
2009
BASE
PESSIMISTIC
OPTIMISTIC
80.00
85.00
90.00
95.00%
Page 1

NPV-RESU
2005 2006 2007 2008 2009 201093.66% 90.20% 88.65% 88.60% 90.00% 91.35%92.09% 88.73% 87.40% 87.09% 88.51% 89.88%93.82% 90.20% 88.65% 88.60% 90.00% 91.35%
1998
2001
2003
2005
2007
2009
BASE
OPTIMISTIC80.00%
85.00%
90.00%
95.00%
BASE
PESSIMISTIC
OPTIMISTIC
Page 2