executive summary - kirkwood community college web viewmanagement information systems -mis (t....
TRANSCRIPT
LSA Market Intelligence 1.3Learner Success Agenda
Market Intelligence
Objective #1To increase understanding of Kirkwood student/learners and organizational customers through a formal study process.
Tactic 1.3Determine the top three consumer segments within each of six large categories and their needs. (January 2012 – May 2012)
Team
Lauri Hughes, Manager Institutional Effectiveness Prof. Development Coord.Brandi Speicher Marketing Graphic DesignerAmy Lasack Continuing Education - KTOS DirectorAlison Heims Student Development Student Dev. SpecialistSamantha Hench Business & IT FacultyTrudie Pearcy Information Technology until 5/11/12

LSA Market Intelligence 1.3

LSA Market Intelligence 1.3
Table of ContentsExecutive Summary................................................................................................................................................3
Consumer Segments...............................................................................................................................................5
Preliminary Data Review.......................................................................................................................................6
Data Collection Summary by Segment...................................................................................................................7
Segment 1a: Credit Students - AA/AAS Seekers...................................................................................................8
Segment 1b: Credit Students - Developmental Program Learners.......................................................................9
Segment 1c: Credit Students - International Students
Segment 2a & 2b: K12 Education - Career Academies & PSEO...........................................................................11
Segment 3a: Workforce Training/HS Diploma Seekers - Skills to Employment..................................................12
Segment 3b: Workforce Training/HS Diploma Seekers - GED/ABE.....................................................................13
Segment 3c: Workforce Training/HS Diploma Seekers - ELL...............................................................................14
Segment 4a: 2nd Career Job Seekers/Leisure Seekers – 2nd Career or Job Seekers..............................................15
Segment 4b & 4c: 2nd Career Job Seekers/Leisure Seekers – Leisure Seekers & Hobbyists................................16
Segment 5a & 5b: Business/Industry, Government, and Nonprofit Centers – All organizations purchasing worker training and learning & Senior Citizens..................................................................................................17
Segment 6a: Commercial/Business Entraprises, Facility Users - Kirkwood Center
Segment 6b: Commercial/Business Enterprises, Facility Users – Equestrian Center..........................................19
Segment 6c: Commercial/Business Enterprises, Facility Users – Facility Rental.................................................20
National Trends....................................................................................................................................................22
Team Recommendations......................................................................................................................................24
Appendix I: Survey Questions..............................................................................................................................25
Appendix II: Maslow’s Hierarchy of Needs.........................................................................................................26
Appendix III: Listening to Our Students.............................................................................................................27
All meeting agendas, minutes and additional documents are in KIN.KIN>Learner Success Agenda>Market Intelligence>Tactic 1.3

LSA Market Intelligence 1.3
Executive Summary
This tactic team’s objective was to determine the top three consumer segments within each of six large categories and their needs. The team thought it was best to align our work with the segments already identified by Cabinet (see page 4). The team then had to define what “needs” meant, in order to focus our work. The team agreed to make “needs” things that would impact a student’s ability to be successful in the classroom. This also aligns with the Learner Success Agenda established in June, 2011: By 2016, we will increase first-time, full-time degree seeking graduation and certificate completion rate (within the 150 percent time frame) from 29 to 38 percent.
In five short months this team has conducted student interviews, focus group discussions with instructors and Zoomerang surveys with several segment groups. The team met bi-weekly from late December 2011 through the end of May. The initial meetings were spent identifying and understanding what types of data are currently available to help with our work (see page 5).
We realized early on that the learners’ need in the classroom, and the data we had reviewed, did not align. We then identified ways to obtain that data by interviewing students and conducting focus groups and surveys of faculty in several segment groups (see page 6). The interview questions (see Appendix I) were drafted and reviewed by the Director of Institutional Research. The team’s goal was to interview 100 students from several of our campuses and a variety of majors. Faculty surveys in a variety of sub-segments of Segments #1, #2, & #3 were done via focus groups, Zoomerang surveys and e-mail questionnaires. Responses from all sub-segments were strong.
Focusing on what learners need, we discovered that segments # 4, #5, and #6 are already doing a rather thorough job of identifying the needs of their consumer segments. In this report we’ve described their current processes and on change/improvement tasks, based upon the data they continually assess.
While compiling and studying the data, the team collaborated with the Kirkwood Library staff to obtain reports and articles regarding students’ needs on a national level. Based upon the national data our consumer segments tend to be in alignment with the national trends.
After investigation, it was apparent throughout our data collection process that the inability for some people to identify needs in the learning environment was most pronounced when the basic needs of students (Maslow’s Hierarchy of Needs – Appendix II) were not being met. Students would have a greater chance of achieving success in the classroom if they had an affordable place to call home, food on the table, reliable transportation and access to technology. Listening to our students and instructors was very revealing. We have summarized several Kirkwood student stories for your review (Appendix III).
4 | P a g e

LSA Market Intelligence 1.3This tactic team has reviewed the internal and external data and could justify all suggestions to help students succeed in the learning environment. Knowing that isn’t currently possible, the team recommends Kirkwood Community College spend the next 12 – 18 months identifying ways to make textbooks, when needed, more affordable for students. Many students expressed the disappointment in never being assigned readings from a textbook that was required for a class. Other students want to know why they need to purchase textbooks when everything is available on the internet. In addition, many students expressed a strong interest in e-books or book rentals to cut down on costs. This also aligns with the national trends. According to Kelton Research, in a July 2011 survey, 506 college students gave a variety of responses showing a readiness to give up the traditional textbook.
71 percent of college students, the survey found, are eager to stop using paper textbooks and go digital
62 percent of college students say they would study more often, and 54 percent say they would do so more efficiently
45 percent have had to cut back on food in order to pay for their books 35 percent are afraid that they won't be able to find the exact book or edition required 34 percent of college students would rather take 8am classes every day for their entire college
career if it meant never having to carry another textbook
Within each sub-segment the team has identified the top needs that should be considered to help all students achieve a higher level of success. These are color coded in red within each chart found within this report. As a final recommendation, the tactic team believes the most powerful part of their work was the opportunity to speak with our students. We highly recommend future tactic teams and college-wide initiatives include students! This will provide some of the most valuable input from our number one resource.
5 | P a g e
LSA Market Intelligence 1.3
Consumer Segments
The 6 consumer segments identified by the cabinet are shown in Table 1 below.
Table 1. Consumer Segments
Category 1:Credit Students
Segment 2: K-12 Education
Segment 3: Workforce
Training/HS Diploma Seekers
Segment 4: 2nd
Career or Job Seekers/Leisure
Seekers
Segment 5: Business/ Industry,
Government, and Non-Profit
Clients
Segment 6: Commercial/
Business Enterprises,
Facility Users
AA/AAS Seekers Career Academies Skills to Employment
2nd Career or job seekers
All organizations purchasing
worker training and learning
Hotel – Kirkwood Center
Dev. Program Learners PSEO GED / ABE Leisure Seekers Senior Citizens Equestrian Center
International Students ELL Hobbyists Facility Rental
6 | P a g e

LSA Market Intelligence 1.3
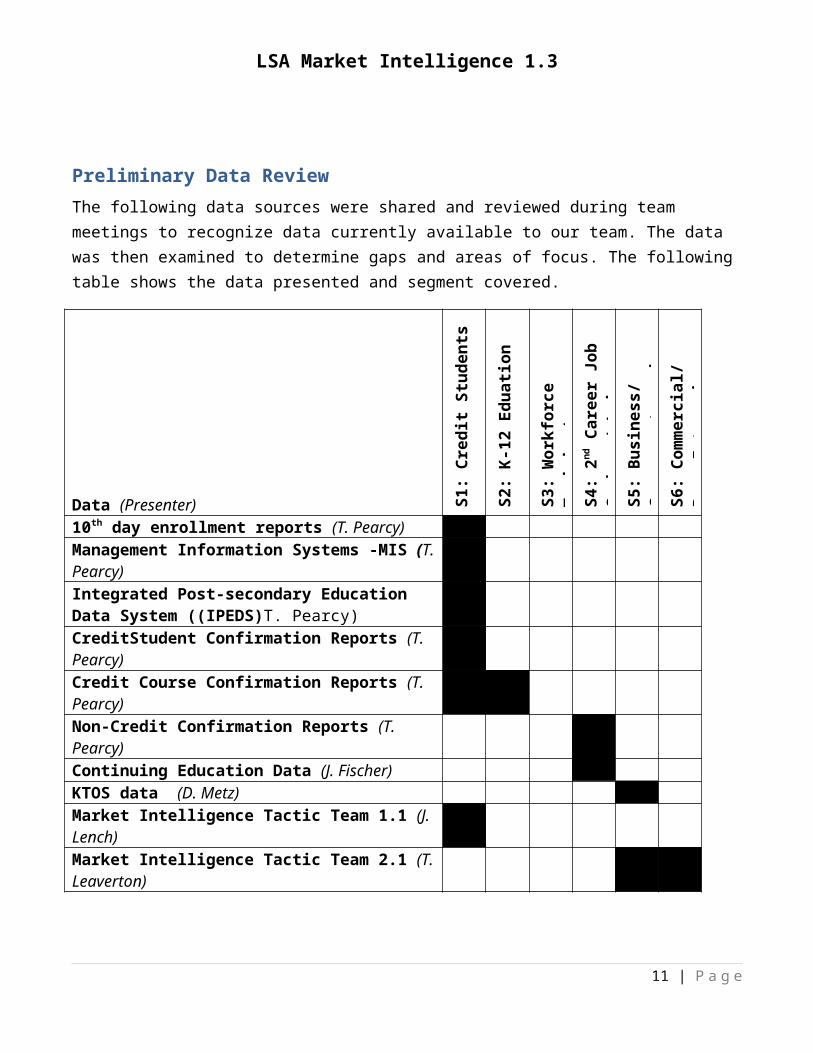
Preliminary Data Review
The following data sources were shared and reviewed during team meetings to recognize data currently available to our team. The data was then examined to determine gaps and areas of focus. The following table shows the data presented and segment covered.
Data (Presenter) S1: C
redi
t Stu
dent
s
S2: K
-12
Edua
tion
S3: W
orkf
orce
Tra
inin
g/
High
scho
ol D
iplo
ma
Seek
ers
S4: 2
nd C
aree
r Job
See
kers
/ Le
isure
See
kers
S5: B
usin
ess/
Gov
ernm
ent,
and
Non
-Pro
fitS6
: Com
mer
cial
/ Bu
s.
Ente
rpric
es, F
avili
y U
sers
10th day enrollment reports (T. Pearcy)Management Information Systems -MIS (T. Pearcy)Integrated Post-secondary Education Data System ((IPEDS)T. Pearcy)CreditStudent Confirmation Reports (T. Pearcy)Credit Course Confirmation Reports (T. Pearcy)Non-Credit Confirmation Reports (T. Pearcy)Continuing Education Data (J. Fischer)KTOS data (D. Metz)Market Intelligence Tactic Team 1.1 (J. Lench) Market Intelligence Tactic Team 2.1 (T. Leaverton)
After a thorough review by the team, the existing data showed a major gap in the area of workforce training. Data for credit students also revealed an abundance of information on demographics, programs, GPA’s, etc., but nothing that identified needs to help them be successful in the learning environment.
7 | P a g e
LSA Market Intelligence 1.3
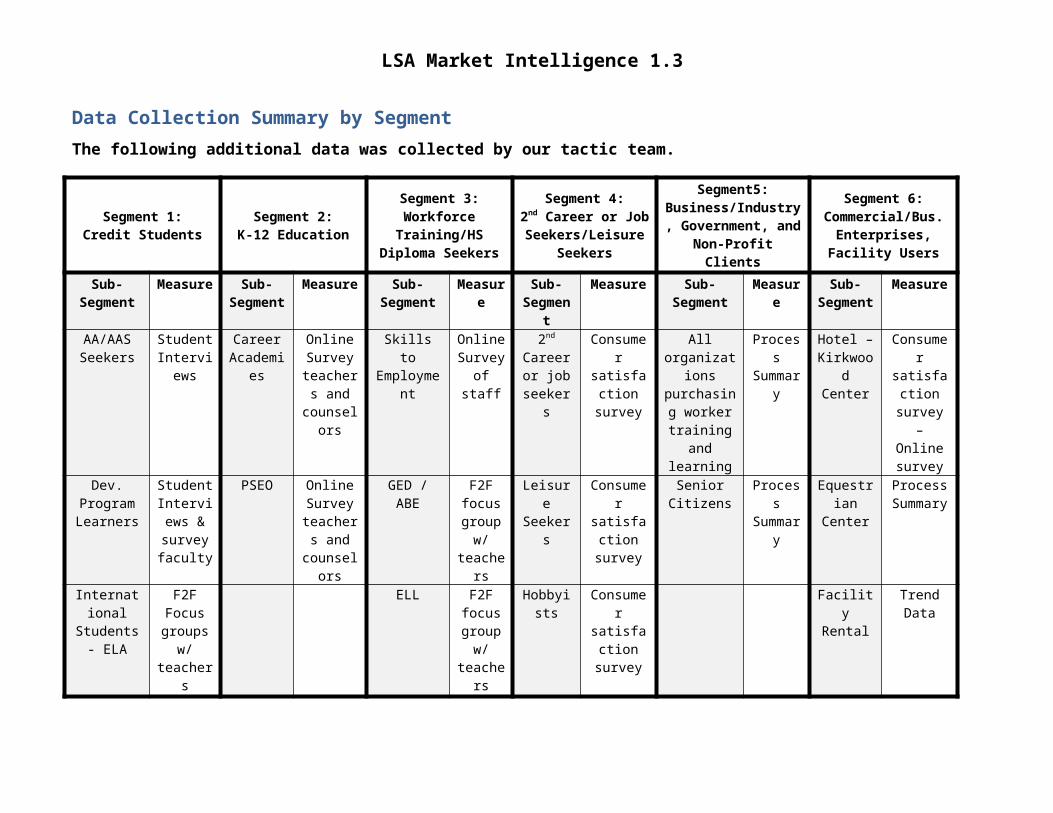
Data Collection Summary by Segment
The following additional data was collected by our tactic team.
Segment 1: Credit Students
Segment 2: K-12 Education
Segment 3:Workforce Training/HS
Diploma Seekers
Segment 4:2nd Career or Job Seekers/Leisure
Seekers
Segment5: Business/Industry,
Government, and Non-Profit Clients
Segment 6: Commercial/Bus.
Enterprises, Facility Users
Sub-Segment
Measure Sub-Segment
Measure Sub-Segment
Measure
Sub-Segment
Measure Sub-Segment
Measure Sub-Segment
Measure
AA/AAS Seekers
Student Interviews
Career Academies
Online Survey
teachers and
counselors
Skills to Employment
Online Survey of staff
2nd
Career or job
seekers
Consumer satisfaction
survey
All organizations
purchasing worker
training and learning
Process Summary
Hotel – Kirkwood
Center
Consumer satisfaction
survey – Online survey
Dev. Program Learners
Student Interviews & survey faculty
PSEO Online Survey
teachers and
counselors
GED / ABE F2F focus group
w/ teachers
Leisure Seekers
Consumer satisfaction
survey
Senior Citizens
Process Summary
Equestrian Center
Process Summary
International Students -
ELA
F2F Focus groups w/ teachers
ELL F2F focus group
w/ teachers
Hobbyists Consumer satisfaction
survey
Facility Rental
Trend Data
The next several sections will summarize the data collected by the team.

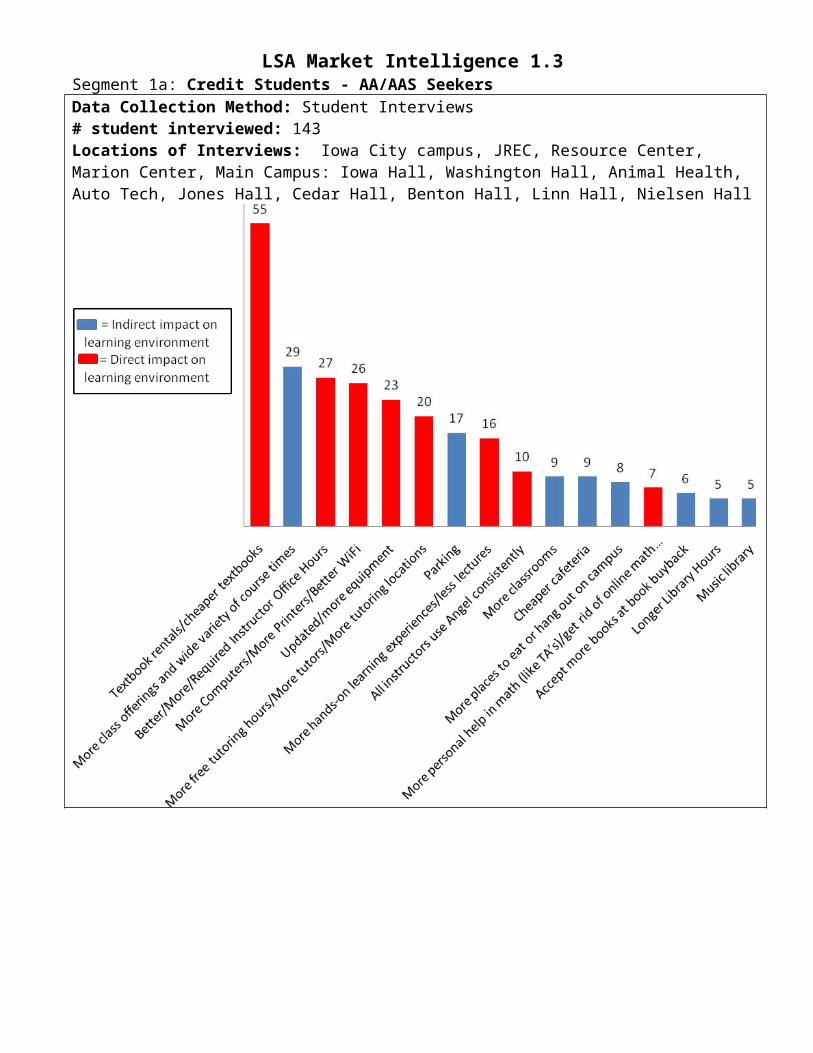
LSA Market Intelligence 1.3Segment 1a: Credit Students - AA/AAS Seekers Data Collection Method: Student Interviews# student interviewed: 143Locations of Interviews: Iowa City campus, JREC, Resource Center, Marion Center, Main Campus: Iowa Hall, Washington Hall, Animal Health, Auto Tech, Jones Hall, Cedar Hall, Benton Hall, Linn Hall, Nielsen Hall

LSA Market Intelligence 1.3
Segment 1b: Credit Students - Developmental Program LearnersData Collection Method: Survey to faculty in Learning Services# of Participants: 8NOTE: The results of this survey take into account the wide range of developmental learners and how best to help them as a whole. To obtain a more comprehensive report of learner needs within this sub-segment, additional investigation is recommended, studying how current resources are connected to the learners.
10 | P a g e
= Indirect impact on learning environment = Direct impact on learning environment
LSA Market Intelligence 1.3
Segment 1c: Credit Students - International Student/ ELA
Data Collection Method: Focus Group w/ ELA instructors and International Dept. staff
11 | P a g e

= Indirect impact on learning environment = Direct impact on learning environment
LSA Market Intelligence 1.3# of Participants:
12 | P a g e
= Indirect impact on learning environment = Direct impact on learning environment
LSA Market Intelligence 1.3
Segment 2a & 2b: K12 Education - Career Academies & PSEOData Collection Method: Online Survey of teachers and counselors at all high schools in 7-county area# of Participants: 35 high school teachers & 22 high school counselors
13 | P a g e
= Indirect impact on learning environment = Direct impact on learning environment
LSA Market Intelligence 1.3
Segment 3a: Workforce Training/HS Diploma Seekers - Skills to EmploymentData Collection Method: Zoomerang Survey to Skills to Employment staff# of Participants: 9
14 | P a g e
= Indirect impact on learning environment = Direct impact on learning environment
LSA Market Intelligence 1.3
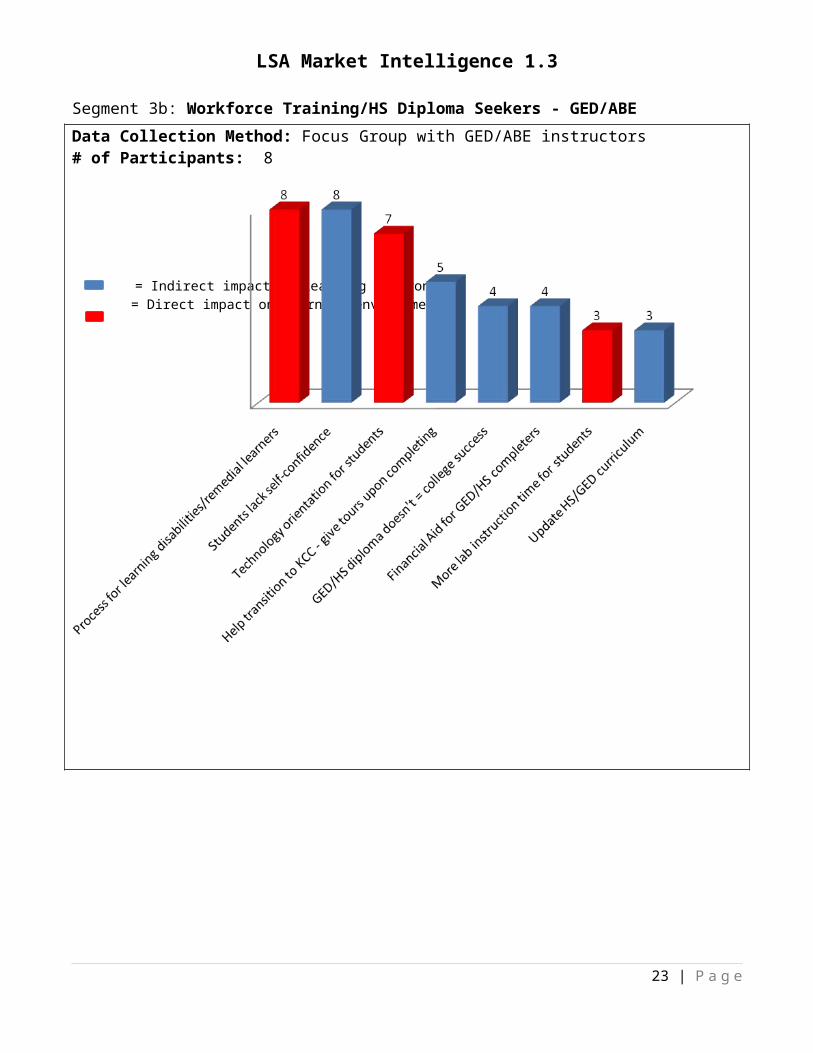
Segment 3b: Workforce Training/HS Diploma Seekers - GED/ABEData Collection Method: Focus Group with GED/ABE instructors# of Participants: 8
15 | P a g e
= Indirect impact on learning environment = Direct impact on learning environment
LSA Market Intelligence 1.3
Segment 3c: Workforce Training/HS Diploma Seekers – English Language LearnersData Collection Method: Focus Group w/ ELL instructors# of Participants: 4
16 | P a g e

LSA Market Intelligence 1.3
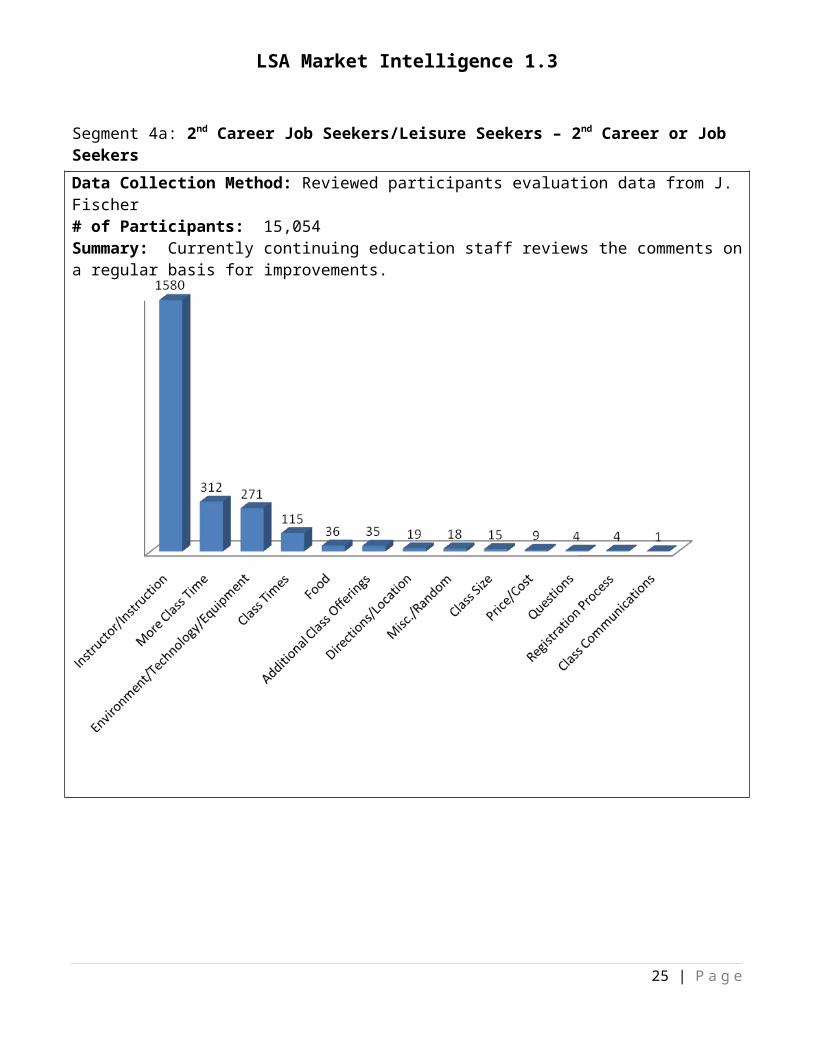
Segment 4a: 2nd Career Job Seekers/Leisure Seekers – 2nd Career or Job SeekersData Collection Method: Reviewed participants evaluation data from J. Fischer# of Participants: 15,054Summary: Currently continuing education staff reviews the comments on a regular basis for improvements.
17 | P a g e

LSA Market Intelligence 1.3
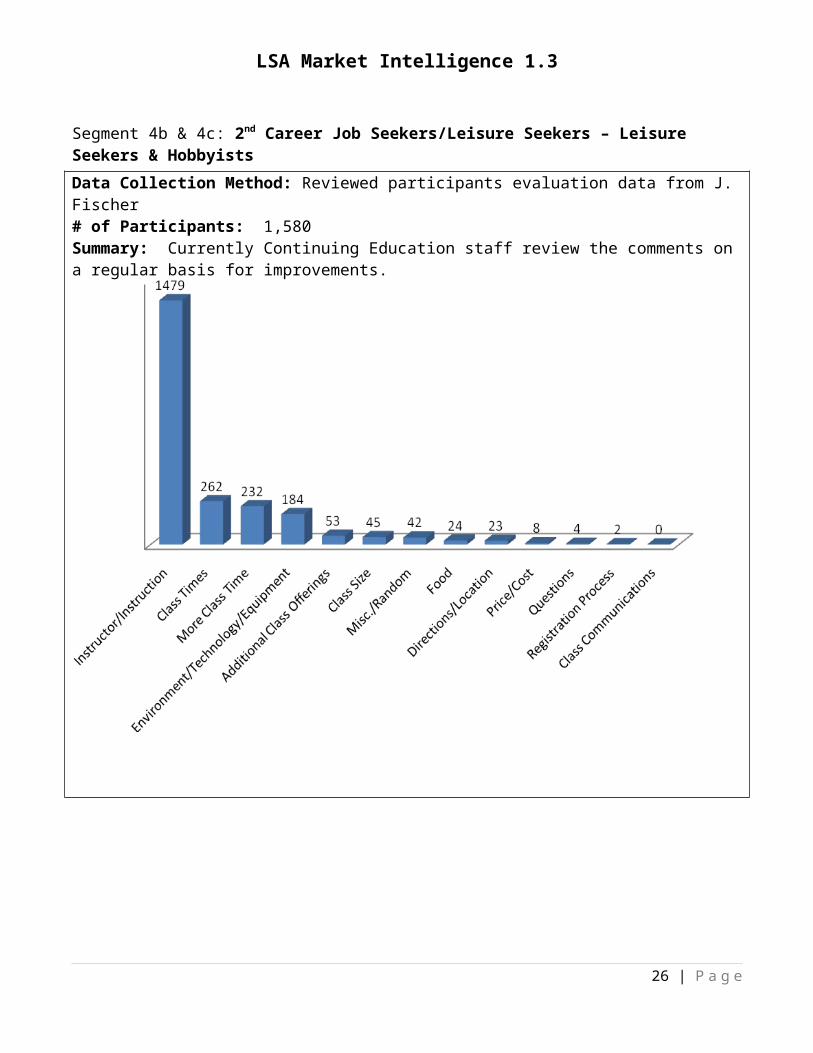
Segment 4b & 4c: 2nd Career Job Seekers/Leisure Seekers – Leisure Seekers & HobbyistsData Collection Method: Reviewed participants evaluation data from J. Fischer# of Participants: 1,580Summary: Currently Continuing Education staff review the comments on a regular basis for improvements.
18 | P a g e

LSA Market Intelligence 1.3
Segment 5a & 5b: Business/Industry, Government, and Nonprofit Centers – All organizations purchasing worker training and learning & Senior Citizens
Contracted TrainingThe KTOS staff follows the LERN Model for identifying and assessing needs of their clients. Under the LERN model they learn how to complete needs assessments and how to identify needs by listening and asking proper questions. The Program Directors at KTOS are certified to do this.How to identify clients* Cold calls (60 per year)* Call inactive clients* Focus groups w/ local companies* Corridor Business Journal list* Repeat clients (approx. 51 percent this year)* ReferralsPartner with community companies/resources* 260E funding (new company development)* 260F funding (Grow Iowa Values Funds)* Iowa WorksLeverage community outreach within the KTOS team*Skills Advantage*Community Response and Training Center (CRTC) Needs Assessments reveal the most popular training needs/topics:* Generations in the workplace* Etiquette (written, verbal, etc.)* Leadership* Human Resource related topics* How to effectively run meetings* Technical skills* Soft skillsFollow-up Surveys* Learning survey to all attendees after each training* Companies surveyed quarterly (those who paid for training)* Instructor survey (annually)
Business success can be summarized in one word: relationships
Based upon surveys and needs assessments the KTOS staff want to get better at:* Hybrid training – need to hire an instructional designer * Turnaround time for clients when they don’t have a trainer for a particular training and they need to search for one (10% of customers ask for specialized training)
KTOS staff feels confident their current means to assess needs is working effectively
19 | P a g e

LSA Market Intelligence 1.3Segment 6a: Commercial/Business Enterprises, Facility Users – Hotel/Kirkwood Center
Hotel at Kirkwood Center
The Hotel at Kirkwood Center has several means by which to measure customer needs. The following lists the ways by which they collect information from those they serve.
Department Type of Survey FrequencyKirkwood Center – Learning Event attendees
1-page questionnaire Every session
Banquet/Caterer POC Electronically emailed Every other weekClass Act Restaurant Comment Cards DailyFront Desk Electronically emailed weekly
These responses are reviewed regularly. In addition to the assessments listed above people sometimes leave thoughts/comments on online sources (Open Table, Trip Advisor, etc.). These are also reviewed but little is then done with the feedback obtained.
The Kirkwood Center staff makes tweaks/adjustments to their services based upon the feedback they receive. Most recently they’ve begun to include an option for customers/clients to leave their name/contact information so that they may follow-up with them to improve service and/or to thank them for their kindness. Approx. 50 percent are leaving contact information so the Kirkwood Center staff may continue communication with them.
20 | P a g e

LSA Market Intelligence 1.3
Segment 6b: Commercial/Business Enterprises, Facility Users – Equestrian Center
Iowa Equestrian Center
The Iowa Equestrian Center (IEC) utilizes an evaluation process in which each of their show managers receive an evaluation form to provide feedback about their show including overall success, conditions of the facility, responsiveness of staff, amenities, etc. The survey is emailed to them. The survey results are sent to Ag Science Dean Scott Ermer, He then sends them to Center Director Patrick Klatt, who shares that information with his staff. Several years ago they received the evaluation feedback forms back rather routinely. Now they don’t have a very high return rate. This may be because about 90 percent of their shows are scheduled with ongoing customers. They like the service and facilities and now may find the evaluation form unnecessary. Patrick reports they rarely have a “new” client. That speaks volumes to customer satisfaction.
Currently they don’t do any formal surveys with event exhibitors but each show has its own personality and the IEC staff is familiar with the general demographics of the exhibitors that attend the shows. They also have a good idea of where the exhibitors come from. Most average size shows routinely draw clienteles from four to five states in the U.S.
The IEC, on average, has scheduled shows almost every weekend of the year since its opening in 2000.
21 | P a g e

LSA Market Intelligence 1.3
Segment 6c: Commercial/Business Enterprises, Facility Users – Facility RentalData Collection Method: R25 Facility Rental trend data by date (months) for usageYears in Review: 2010-2011
22 | P a g e
LSA Market Intelligence 1.3
23 | P a g e

LSA Market Intelligence 1.3
National Trends
1) "Survey: 71 Percent of College Students Want to Switch to Digital Textbooks." Schools.com. Web. 21 Mar. 2012. <http://www.schools.com/news/survey-71-percent-of-college-students-want-to-switch-to-digital-textbooks.html >.
The survey of 506 college students was conducted by Kelton Research between July 14 and July 21, 2011 through an e-mail invitation and online survey. The key findings include the following:
o 87 percent of college students say they've had to cut back on other expenses in order to pay for textbooks
o 71 percent of college students, the survey found, are eager to stop using paper textbooks and go digital
o 62 percent of college students say they would study more often, and 54 percent say they would do so more efficiently
o 46 percent of college students say they've been prevented from studying because they forgot a specific textbook
o 45 percent have had to cut back on food in order to pay for their bookso 35 percent are afraid that they won't be able to find the exact book or edition required o 34 percent of college students would rather take 8am classes every day for their entire
college career if it meant never having to carry another textbook o 34 percent would stay home every Saturday night for a semester if it meant never having
to carry another textbook o 20 percent say they've lost their textbookso 16 percent have had to deal with missing pages in a textbook
2) "Pearson Foundation Community College Student Survey." Pearsonfoundation.org. Pearson Foundation, 2011. Web. 21 Mar. 2012. <http://www.pearsonfoundation.org/education-leadership/research/community-college-survey.html>
Pearson Foundation Community College Student Survey was administered to 1,434 community college students in the U.S. between the ages of 18-59 in 2010. This survey helped to identify what factors were roadblocks for students in being successful, and four main barriers were discovered.
A) Course enrollment difficulties (more course time need of credit students)a. About 20% of students surveyed said it was difficult for them to enroll in a required course
during Fall 2010b. 32% of students said the reason they could not enroll in the required course was because
the course was already fullc. 28% of students surveyed said they were unable to enroll in all the courses recommended
on placement test results
B) Dropping out/consider dropping in first few weeks
24 | P a g e
LSA Market Intelligence 1.3a. 15% said they considered dropping out or did drop out during the first few weeks because
of time struggles between courses, work, and familyb. The most popular reason for dropping a course was problems with the instructor
C) Relationships with professors and access to academic advisors also help successa. 25% of students who thought about dropping out said they had not sought help when
struggling with courseworkb. 20% of students said they could not get the necessary help when struggling with coursework
(more office hours for instructors)
D) Online learning is growinga. 6 in 10 students had taken at least one online course
3) “Wi-Fi Access a Must“ 29 Dec. 2011. http://www.care2.com/causes/what-students-want-in-a-college.html
Original survey: http://www.educause.edu/2011IssuesResources
“Students today are the “most wired” ever, so it’s no surprise that a recent study by Educause found that 60 percent of students said they would not attend a college if it does not offer free Wi-Fi. Students want to be online anywhere. In fact, 78 percent of students surveyed believe Wi-Fi access is extremely valuable to their academic success. The Educause study also found that, while 47 percent of students believe technology makes professors better at their jobs, more than 30 percent of students think that their instructors are “incapable of getting technology working without student aid.”
4) Schaffhauser, Dian. "What Students Want." Campustechnology.com. Campus Technology, 1 Feb. 2010. Web. 21 Mar. 2012. <http://campustechnology.com/Articles/2010/02/01/What-Students-Want.aspx>.
“In 2009, for example, 76 percent of students surveyed said that it was “extremely important” for their campuses to offer wireless networks, compared to 50 percent in 2008.”
5) “Future Work Skills 2020”-- 14 Apr. 2011. http://apolloresearchinstitute.com/research-studies/workforce-preparedness/future-work-skills-2020
10 Skills for the Future WorkforceI) Sense Making - ability to determine the deeper meaning or significance of what is being
expressedII) Social Intelligence - ability to connect to others in a deep and
direct way, to sense and stimulate reactions and desired interactionsIII) Novel & adaptive thinking - proficiency at thinking and coming up
with solutions and responses beyond that which is rote or rule-basedIV) Cross-Cultural Competency - ability to operate in different cultural settingsV) Computational Thinking - ability to translate vast amounts of data into abstract concepts and to
understand data-based reasoningVI) New Media Literacy - ability to critically assess and develop content
that uses new media forms, and to leverage these media for persuasive communicationVII) Transdisciplinarity - literacy in and ability to understand concepts across multiple disciplines
25 | P a g e
LSA Market Intelligence 1.3VIII) Design Mindset - ability to represent and develop tasks and work processes for desired
outcomeIX) Cognitive Load Management - ability to discriminate and filter information for
importance, and to understand how to maximize cognitive functioning using a variety of tools and techniques
X) Virtual Collaboration - ability to work productively, driveengagement, and demonstrate presence as a member of a virtual team.
6) Chen, Grace. "At-Risk Students Find Success at Community Colleges” Community College Review, 21 Apr. 2010. Web. 21 May 2012. < http://www.communitycollegereview.com/articles/237 >
Northern Virginia Community College, more commonly known as NOVA, started a “Pathway to the Baccalaureate” program in 2006. The program follows a number of steps for success for its at-risk students.
Eight transition counselors head to area high schools in search of students who show potential for academic success, but lack the necessary support system to achieve it. Nearly 80% of students recruited are accepted into the program – as long as they express a desire to graduate from NOVA and move into a four-year college.
Students accepted into the program get to know their counselors through a variety of teaching and social events. These counselors help students navigate the sometimes complex maze of college registration, scheduling and financial aid applications.
Once enrolled at NOVA, students are matched with retention counselors who prepare students for academic success on a variety of levels. Counselors also track students' progress and are notified if any student falls below a C-grade average.
Students are also enrolled in a College Success Skills class that teaches them everything from how to take notes during class to time management and making good choices.
During the program, students are prepared for the next big challenge of enrolling in a traditional university to earn a four-year degree. Students who successfully graduate from the Pathway to the Baccalaureate program may enroll in a college of their choice, and many choose GMU, Virginia Tech or a wealth of other universities nearby.
26 | P a g e
LSA Market Intelligence 1.3
Team Recommendations
The team has reviewed the internal and external data and has identified the top needs for each sub-segment in segment #1, #2, and #3 that appear to have the greatest potential to increase learner success. The following table is meant to serve as a guide to Kirkwood administrators and colleagues with the needs of our students and how best to allocate resources to help more students reach a higher level of success.
Sub-Segment #1 Recommendation
Supported by Nat’l. Data
#2 Recommendation
Supported by Nat’l. Data
A.A./A.A.S. Seekers
Digital textbooks / reduce costs of
textbooks
Instructor available outside of
class/office hours
Developmental Learners
Reading levels – alignment with
textbooks
Orientation to Developmental
Programs/process
International Students
Need for assessment
mastery at each level
International student
orientation for all Intl. students
High School/PSEO
Soft Skills COMPASS test earlier / explain
results to studentsSkills-to-Employment
Process for remedial learners
& learning services
Advisor/Advising for appropriate Class/program
GED/ABE Process for remedial learners
Orientation to technology
ELL students Have ELA classes at county centers
Have ELA books available at Bookstore
All Above Develop a “Pathway to
Success” program for at-risk students
27 | P a g e

LSA Market Intelligence 1.3
Appendix I: Survey Questions
Questions for Student Interviews
1) What are 2 – 3 things that Kirkwood is doing well to help you succeed?2) In order to help more college credit students succeed, this tactic team (Market Intelligence 1.3) is focusing
on student needs in the classroom/learning environment. What are 2 – 3 educational/learning needs that you have, that if addressed, would impact your success in a positive way?
3) What barriers or challenges do you and your classmates have that if we could change/improve would mean a higher level of success for you all?
Questions for Faculty Focus Groups:
1) What are 2 – 3 things that Kirkwood is doing well to help your students succeed?2) In order to help more college credit students succeed, this tactic team (Market Intelligence 1.3) is focusing
on student needs in the classroom/learning environment. What are 2 – 3 educational/learning needs that your students have, that if addressed, would impact their success in a positive way?
3) What barriers or challenges do you see standing in the way of student success?
Questions for Zoomerang Survey to high school teachers and counselors
1) I am a (check box with 2 options) a. High school teacherb. High school counselor
2) What are 2 – 3 things that Kirkwood is doing well to help student success in the college credit in high school offerings at your high school?
3) Kirkwood is focusing on student needs in the classroom/learning environment. In order to help more students succeed what are 2 – 3 educational/learning needs that high school students have, that if addressed, would impact student success in a positive way?
4) What barriers or challenges to you see your students have in order to make the transition from high school to college? How can Kirkwood help students get off to a great start?
Questions for Zoomerang Survey to Skills-To-Employment
1) What are 2 – 3 things that Kirkwood is doing well to help your clients succeed?2) In order to help more college credit students succeed, this tactic team (Market Intelligence 1.3) is focusing
on student needs in the classroom/learning environment. What are 2 – 3 educational/learning needs that your clients have, that if addressed, would impact their success in a positive way?
3) What barriers or challenges do you see your clients have in order to make the transition from current state to college? How can Kirkwood help students get off to a great start?
28 | P a g e

LSA Market Intelligence 1.3Appendix II: Maslow’s Hierarchy of Needs
29 | P a g e

LSA Market Intelligence 1.3
Appendix III: Listening to Our Students
Female – has mental issues, is bipolar and can’t succeed in the high school environment. She’s at Kirkwood to obtain her GED.
Female – immigrant from Africa. She’s working in a nursing home for low wages and is working on her Nursing degree at Kirkwood.
Female – previously incarcerated, has a 14-year old daughter who’s pregnant and a 17-year old daughter who’s in juvie. She wants to be a good example for turning your life around and making good choices. She can’t leave her home county – on parole.
Male – the Kirkwood center is the safest place for him, no gangs or threats of his life here. “This place is good for me.”
Mother/daughter (ages 54 and 25)-- mom broke down and cried due to stresses of day-to-day living, has 4 generations living in a home; her aging parents, her, her daughter and grandchild.
Female – 31 year old Wal-Mart employee. Mother took her out of public school at 3 rd grade to be home-schooled. But, then did not home-school her. She can’t read or write. Wal-Mart will pay for her to learn. No curriculum in high school/GED program to help her.
ELL program – previously allowed attendees to bring their child/children. Got to be too distracting and had to tell them no. Attendance dropped.
Many students at county centers expressed a concern of not being successful without reliable transportation to main campus.
30 | P a g e