executive compensation and policy choices at u.s. commercial
TRANSCRIPT
Executive Compensation and Business Policy Choices at U.S. Commercial Banks
Robert DeYoungUniversity of Kansas, KU School of Business
1300 Sunnyside AvenueLawrence, KS 66045
Emma Y. PengFordham University, Graduate School of Business Administration
1790 Broadway, 13th FloorNew York, NY 10019
Meng YanFordham University, Graduate School of Business Administration
1790 Broadway, 13th FloorNew York, NY 10019
Presented at FDIC-JFSR Bank Research ConferenceThursday, September 17, 2009
Abstract: In response to the huge losses taken by U.S. financial institutions in mortgage-backed securities investments, federal legislators have proposed laws that would constrain the ability of bank boards to freely set the size and terms of executive pay. Underlying these proposals is the belief that corporate risk-taking can be controlled by inserting the proper incentives into executive compensation contracts. This study examines whether and how the terms of CEO compensation contracts at large, publicly traded commercial banks between 1994 and 2006 influenced, and were influenced by, the risk-profiles of these firms. We find evidence linking contractual risk-taking incentives, which we proxy with standard measures of vega and delta, to risk-increasing business policy choices. Moreover, these linkages became stronger after 1999, when financial industry deregulation created new growth opportunities for commercial banks. Our results suggest that compensation committees provided new incentives for bank CEOs to exploit these growth opportunities, and also to shift from traditional on-balance sheet portfolio lending to less traditional investments (e.g., private-issue mortgage-backed securities) and nontraditional fee-generating activities. Apart from these strategic reallocations, our results also suggest that bank boards designed CEO compensation contracts to limit excessive risk taking, especially after deregulation.

1. Introduction
The historic collapse of housing values in the U.S., and the subsequent losses in mortgages and
mortgage-backed securities, has wreaked havoc on the capital positions of both large and small financial
institutions around the world. The market value of the global banking industry sector declined by slightly
more than half during 2008; the market capitalization of the ten largest U.S. commercial banks fell by
approximately $630 billion in 2007-2008, a 65% reduction in value.1 To encourage banks to continue
lending and to prevent the most heavily impacted banks from collapsing, the U.S. Treasury in late 2008
and early 2009 injected over $300 billion in preferred and common equity capital into commercial
banking companies through its Troubled Asset Relief Program (TARP). The Treasury and the Federal
Reserve provided an even larger amount of aid—in the form of equity injections, loans, and loss
guarantees—to rescue the large and insolvent financial firms American International Group (AIG),
Fannie Mae, Freddie Mac, and Bear Stearns.
Predictably, politicians and policymakers quickly sought to limit the compensation of executives
at the banking companies that received taxpayer support. In March 2009, second-round capital injections
from TARP were made contingent on executive pay limits. Also in March, President Obama dramatically
instructed the Treasury Department to "pursue every legal avenue" to block bonuses due to executives
and other financial professionals at AIG:2
"This is a corporation that finds itself in financial distress due to recklessness and greed… Under these circumstances, it's hard to understand how derivative traders at AIG warranted any bonuses, much less $165 million in extra pay. How do they justify this outrage to the taxpayers who are keeping the company afloat?”
A few days later, the House of Representatives did the President one better by passing a bill that placed a
90% tax surcharge on compensation above $250,000 at any financial institution that received more than
$5 billion from TARP. Although this measure did not become law, members of both Congress and the
1 Estimates from the Boston Consulting Group (2009) and Reuters (2009), respectively.2 “Obama Asks Geithner to Find Way to Rescind AIG Payouts,” Wall Street Journal Online, March 16, 2009, http://online.wsj.com/article/SB123721970101743003.html?mod=djemalertNEWS.
1
Administration continue to advocate for new rules to curb executive pay, e.g., by increasing shareholder
power and board responsibility over the terms of compensation contracts, by strengthening bank
supervisors’ ability to monitor and restrict executive pay, or by imposing outright restrictions on pay
practices thought to encourage short-run risk taking at the expense of long-run firm value.3 At mid-year
2009, presidentially appointed “pay czar” Kenneth Feinberg was poised to exercise his authority to
review and potentially re-write the terms of executive contracts at banks that had not yet repaid their
TARP injections.
Government interference in private firm executive compensation is rare in the U.S.4 Nonetheless,
the taxpayer assistance granted to large financial firms in 2008 and 2009 has generated populist support
for intervention. The language of the President’s statement above plays to this public: his reference to
“greed” is consistent with the populist notion that executive pay at public corporations is in general too
high even regardless of corporate performance, while his reference to “recklessness” invokes an image of
irresponsible (i.e., principal-agent) executive behavior for which discipline deserves to be meted out.
Good public policy, however, should be based on less subjective phenomena.
One can think of company financial performance as being driven by three key elements: the
business model in place, how well executives execute the business model, and external conditions beyond
the control of executives. These three elements converged in late-2007 for many of the largest U.S.
financial companies, with dire results. For much of the preceding two decades, large commercial banks
had been transitioning their retail businesses away from the traditional “originate-and-hold” lending
model that relies on interest income generated from repeat borrower-lender relationships, and toward an
“originate-and-distribute” loan securitization model that relies heavily on the fee income generated by
non-repeat, arms-length financial transactions. This new business model efficiently channels trillions of
3 See “U.S. Eyes Bank Pay Overhaul,” Wall Street Journal, May 13, 2009, page 1, and “Investors Take Note: New Bill to Target Boards, Say on Pay,” Wall Street Journal, May 24, 2009, http://online.wsj.com/article/SB124061794487355095.html. 4 One of the few recent examples is the Omnibus Budget Reconciliation Act of 1993 which capped the allowable corporate tax deduction on the salaries of a firm’s five highest paid managers to $1 million; beyond this amount, only "qualified performance based pay" merits a deduction. The law was intended to better align executive compensation with corporate performance. Gritsch and Snyder (2005) find that stock option compensation has increased as a result of this change.
2

investor dollars to mortgage borrowers, in exchange for which investors—large commercial and
investment banks among them—hold mortgage-backed securities (MBS) and/or derivatives of MBS. 5
This business model proved very profitable, generating record earnings for the commercial banking
industry from the mid-1990s through the mid-2000s. But these were years of relatively benign economic
conditions, and growing this business model for well over a decade absent the disciplining effects of
economic stress encouraged excesses.6 The collapse of the housing bubble exposed these excesses, most
notable the investment grade-rated securitizations of subprime mortgages that performed so abysmally
once home prices stopped rising.
In retrospect, it is clear that managers at commercial and investment banks committed a number
of fundamental risk-management mistakes. Portfolios were over-weighted in MBS, as institutional
investors (like some well-known economists) underestimated the covariances of regional housing price
movements.7 The financial leverage used against these investments was often excessive, both on the
balance sheet and in off-balance sheet investment vehicles. And these levered portfolios of long-term
assets were often financed with short-term debt, suggesting that managers forgot or simply ignored the
key lessons of the 1980s savings and loan crisis.
Arguments favoring regulation or reform of executive compensation practices at such institutions
must ultimately be judged based on the answers to two questions. First, did the incentives embedded in
executive compensation contracts at U.S. financial firms during the 1990s and 2000s cause or contribute
to this record of financial mismanagement? Second, did corporate boards respond to mismanagement and
excessive risk-taking by adjusting the performance incentives in executive contracts—or is government
5 These derivative securities include interest-only and principal-only instruments backed by pools of mortgages, and more complex collateralized debt obligations which are backed by pools of MBS. Loan securitization has also increased in credit card, auto loan, student loan, and small business credit markets; financial losses on the asset-backed securities created in these transactions have not occurred as quickly, however, nor have they been as large, as for MBS.6 Between 1991 and 2007 there was only a single, relatively shallow recession. And ironically, the consumer spending generally credited for the mildness of the 2001 recession was made possible by mortgage securitization, which permitted homeowners to more readily access the equity that would previously been locked up in their homes. 7 This view was not limited to investors in home real estate securities. Alan Greenspan famously stated during congressional testimony that upward pressure on home prices was largely a regional phenomenon and that nationwide declines in home prices were unlikely. (Testimony to Congress on July 20, 2005.)
3
intervention necessary to realign incentives and curtail future episodes of mismanagement? In this paper,
we devise and implement empirical tests of both these questions.
As shown in Figure 1, the total compensation paid to CEOs at large U.S. commercial banks over
the past two decades has differed little from that paid to CEOs at large U.S. industrial corporations.
However, the incentive structures embedded within these two sets of compensation packages have
diverged. We use two market proxies to capture these incentives. Pay-risk sensitivity, or vega, measures
the change in CEO wealth (in dollars) with respect to changes in stock return volatility (in annualized
standard deviations). Pay-performance sensitivity, or delta, measures the semi-elasticity of CEO wealth
(in dollars) to changes in the firm’s stock price (in percent). As measured by vega, the risk-taking
incentives of bank CEOs diverged permanently and substantially from those of non-bank CEOs around
2000, when bank CEO wealth became substantially more sensitive to stock return volatility, as shown in
Figure 2. This divergence occurred concurrently with two important changes in the U.S. banking
environment: the Financial Modernization (Gramm-Leach-Bliley) Act of 1999 that allowed banks to
engage in non-traditional financial activities, and the climb in U.S. housing prices that fueled demand for
one of those activities—the investment banking services necessary for securitizing home mortgages.
We test whether and to what degree CEO vega and CEO delta influence the risky investment and
policy decisions of large U.S. commercial banking companies between 1994 and 2006, employing a
multiple-equation model that allows for simultaneity among vega, delta, and investment. We find
plentiful evidence to suggest that bank business policies are influenced by the incentives present in CEO
compensation contracts. On average, banks in which CEOs have high pay-risk sensitivity (high-vega
banks) generate a larger percentage of their incomes from noninterest activities, invest a larger percentage
of their assets in private (i.e., subprime or otherwise non-conforming) mortgage securitizations and a
smaller percentage of their assets in portfolios of real estate loans, and take more credit risk. Importantly,
the data also indicate that this bundle of relatively risky business policies exposes high-vega banks to
greater systematic risk, and thus exacerbates the financial stress often experienced by banks during
macroeconomic downturns. In general, these business policy decisions became more responsive to CEO
4
pay-risk sensitivity after Gramm-Leach-Bliley expanded the investment opportunity set for commercial
banks.
We also find evidence that the risk-taking incentives embedded in CEO compensation contracts
are influenced by existing bank business policies. Our results suggest that compensation committees
provided high-vega contracts as incentives for bank CEOs to exploit post-deregulation growth
opportunities and to shift from traditional on-balance sheet portfolio lending to less traditional
investments (e.g., private-issue mortgage-backed securities) and nontraditional fee-generating activities.
But we also find evidence that compensation committees attempted to manage excessive risk-taking
incentives at these banks by establishing complementarily high values of delta.
The remainder of the paper is organized as follows. Section 2 discusses the transactions banking
model central to the expansion of mortgage credit in the U.S. and how the adoption of this model has
affected bank financial performance. Section 3 reviews the relevant literature on executive compensation
and risk-taking. Section 4 presents our empirical model, defines the variables we use to specify the
model, and identifies the specific hypotheses we are testing. Section 5 describes the data. Section 6
reports our empirical results. Section 7 summarizes the findings and discusses their implications.
2. Transactions banking
The top commercial banking companies in the U.S. have grown immensely larger over the past
two decades. During the mid-1980s only Citibank had more than $100 billion in assets; by the mid-2000s
nearly 20 U.S. banking companies had more than $100 billion with three exceeding $1 trillion. And yet,
this rapid growth in assets substantially understates the increased size of U.S. banks, because fees
(noninterest revenue) per dollar of bank assets have also doubled since the mid-1980s.
The staggering growth rates of large U.S. commercial banks reflect the confluence of three
factors—one posing a threat to banks, the other two providing opportunities. First, innovations in
financial markets and information technologies created new options for depositors and savers (money
market mutual funds, 401K plans, discount brokerage) and borrowers (commercial paper, high-yield debt,
5

OTC stock markets) and set in motion a process of disintermediation that threatened to make the heavily
regulated U.S. banking sector obsolete. Second, federal deregulation allowed banks to expand their
geographic footprints across state lines (the Riegle-Neal Interstate Banking and Branching Efficiency Act
of 1994) and expand into non-banking products such as investment banking, brokerage, and insurance
sales and underwriting (the Gramm-Leach-Bliley Financial Services Modernization Act of 1999). Third,
a scale-intensive business model—often referred to as “transactions banking”—emerged that exploited
new channels of information (credit bureaus) and new financial processes (asset securitization).
Transactions banking embraces financial disintermediation. Banks use their traditional expertise
in loan underwriting to originate loans, but instead of issuing deposits to fund these loans on-balance
sheet they (or their investment bank partners) issue securities to fund large pools of loans in off-balance
sheet loan securitizations. Loan securitizations are investment trusts that purchase existing home
mortgage loans (or auto loans, or credit card receivables) from banks, using funds raised by selling
mortgage-backed securities (MBSs) to third-party investors—usually other financial institutions who
want exposure to the risks and returns of diversified pools of mortgage loans without having to generate
these loans themselves. This process allows banks to sell their otherwise illiquid loans to the
securitization, and use the proceeds of these sales to fund additional loans—in a sense, recycling bank
capital. Banks earn noninterest income from loan origination fees, loan securitization fees, and loan
servicing fees, while the loan interest and principal repayments are shared by the MBS investors.
Depending on the terms of the securitization contract, the originating or securitizing banks may hold a
portion of the MBSs themselves or provide recourse agreements to MBS investors.
Well over half of the residential mortgage debt in the U.S. is securitized by, held in the portfolios
of, or guaranteed by government-sponsored enterprises (GSEs) such as Ginnie Mae, Fannie Mae, and
Freddie Mac. Most of the MBSs issued by these GSEs are relatively safe and easy-to-understand “pass-
through” securities: the pooled mortgages are either backed by government guarantees, private insurance,
6
or large down payments, and the interest and principal cash flows are shared equally by the investors. 8
But investors in other types of MBS can bear substantial amounts of risk. Private (non-GSE) mortgage-
backed securities are backed by pools of non-conforming loans that carry additional risk for a wide range
of reasons: they are large (jumbo) loans, they have low down payments, borrows provided incomplete
documentation of income (low-doc loans), or borrowers had poor credit ratings (subprime loans).9
The transactions banking model has yielded large production and financing efficiencies for banks
that use it, and by sharing credit risk with investors outside of the banking system has increased access to
credit for millions of households and small businesses. Transactions banks gain access to enormous
economies of scale (Hughes et al. 1996, Rossi 1998) associated with the collection and analysis of the
“hard,” quantifiable borrower information central to the automated lending processes used to evaluate,
originate, and pool large volumes of retail loans (Stein 2002). But because transactions banks all have
access to the same information (e.g., credit scores) and all produce non-differentiated financial
commodities such as mortgage loans and credit card loans, price competition is intense and profit margins
are tight. Hence, transactions banks have strong incentives to grow larger in order to exploit further unit
cost reductions. Once external growth options (i.e., acquiring other transactions banks) are exhausted,
internal growth requires increasing the number of loan originations, which creates an incentive to relax
lending standards and make loans to less creditworthy borrowers. This incentive is exacerbated by the
fact that, in this business model, loan underwriting is separated from both loan monitoring and the bearing
of credit risk. Aside from the reduction in idiosyncratic credit risk associated with loan pooling, and any
recourse arrangements with the originating or securitizing banks, MBS investors bear the bulk of the
8 Because Fannie Mae and Freddie Mac initially securitized or held only conforming mortgages (non-jumbo first mortgages with either 20% down payments or private mortgage insurance), they were permitted to operate with very little capital; moreover, their lines of credit at the U.S. Treasury created the perception that they were “too-big-to-fail,” which gave them a funding advantage over private-sector mortgage securitizers. But in response to political pressure during the early 2000s, both Fannie and Freddie began purchasing subprime MBSs. As these investments soured and the GSEs reached the verge of insolvency, the Treasury Department made good on its “implicit government guarantee” by injecting equity funding and nationalizing ownership of the two GSEs. 9 Investors can take on even more risk by purchasing structured mortgage-backed securities—derivative MBS products that are backed by pools of other MBS—that decompose the underlying mortgage interest and principal repayments into “tranches” according to financial needs and risk appetites of investors: interest-only tranches, principal-only tranches, and tranches that are either more or less exposed to prepayment risk or credit risk.
7
credit risk in this model, and given the information problems associated with pools comprised of
hundreds or thousands of individual loans, these investors typically cede the task of evaluating risk to
third-party securities rating firms.
Earnings at large banking companies have become more reliant on noninterest income over time
—not just from their transactions banking activities, but also from other nontraditional lines of business
made accessible by deregulation such as securities underwriting and brokerage, and from selling backup
lines of credit that enable their business clients to issue their own debt securities. A number of empirical
studies have investigated the volatility of noninterest income at banks and its effect on risk. DeYoung
and Roland (2001) show that (non-deposit-related) fee income is associated with higher revenue
volatility, higher operating leverage, and higher earnings volatility at U.S. commercial banks. DeYoung
and Rice (2004) find that marginal increases in non-interest income are associated with a worsening of
banks’ risk-return trade-off. Stiroh (2004a, 2004b) finds no evidence of diversification gains at banks that
combine interest and non-interest income. Choi et al. (2006) find that noninterest income at commercial
banking companies in 42 different countries is strongly and positively related to systematic risk. Clark et
al. (2007) emphasize how the increasingly retail-focused strategies of large U.S. banking companies
expose these banks to economic and business cycle volatility. Elysiani and Wang (2008) demonstrate
that noninterest income makes it more difficult for analysts to forecast the quarterly earnings of banking
companies.
The sub-prime mortgage crisis provides an illustration of the income volatility associated with
fee-driven transactions banking. While the headlines in the financial press have justifiably dwelled on the
over $2 trillion of capital losses suffered by banks and other investors in sub-prime mortgage-backed
securities, transactions banking companies that originated, serviced, and securitized mortgages have
experienced material, and in some cases crippling, reductions in fee income as investor demand for new
MBS dried up and household demand for both new and existing houses declined. Total industry
noninterest income fell from 43% to 38% of operating income between 2006 and the first three quarters
of 2008, the largest two-year decline since the mid-1970s. Many of the largest financial institutions with
8
non-diversified, “mono-line” mortgage banking strategies failed (e.g., American Home Mortgage, New
Century Financial, Countrywide Financial, Washington Mutual, Golden West-Wachovia) due to the
combined impact of plummeting fee income and large losses in their portfolios of subprime mortgages
and mortgage-backed securities.
3. Executive Compensation
The manner in which corporate managers are compensated can shape their incentives, and delta
and vega are two important measures of those incentives (Core and Guay 2002). Vega, or pay-risk
sensitivity, captures the change in the dollar value of CEO wealth for a 0.01 change in stock return
volatility. Typically, including a large amount of stock option grants in CEO compensation packages will
result in high vega. Delta, or pay-performance sensitivity, measures the change in the dollar value of
CEO wealth for a 1% change in stock price. Typically, including a large amount of stock grants (and to a
lesser extent, stock option grants) in CEO compensation packages will result in high delta.
The impact of delta on manager incentives is not straightforward. As a first principle, high-delta
compensation reduces conflicts of interest between managers and shareholders by linking manager wealth
to the value of the firm’s stock (Jensen and Meckling 1976; Morck et al. 1988; McConnell and Servaes
1990; Berger et al. 1997). But high-delta compensation can concentrate managerial wealth in the shares
of the firm and create new principal-agent problems. The primary concern is that poorly diversified
managers with high deltas may become risk-averse and pass up positive-NPV projects that carry high
absolute levels of risk (Smith and Stulz 1985). However, shareholding managers can benefit along with
the other equity investors if risk is shifted to debt-holders, and the extent to which such shifting is
possible gives high-delta managers an incentive to take more risk (John and John 1993); this is a
legitimate concern here, given that asset substitution problems can be more serious in banks where a large
portion of debt is in the form of deposit contracts guaranteed by the Federal Deposit Insurance
Corporation (FDIC).
9
The impact of vega on manager incentives is more clear. Because it rewards stock return
volatility, high-vega compensation should make risk more valuable to managers and mitigates potential
managerial risk aversion (Jensen and Meckling 1976; Smith and Stulz 1985). Studies of non-financial
firms provide evidence that high-vega compensation encourages riskier policy choices while high-delta
compensation encourages less risky policy choices (Knopf et al. 2002; Rogers 2002; Nam et al. 2003;
Coles et al. 2006).
Vega and delta are not necessarily exogenous. Boards are likely set the parameters of CEO
compensation in conjunction with the business policies put in place by managers, either to complement
those policies or to influence the amount of risk managers take in the implementation of those policies.
For example, firms that face growing market demand might choose high-vega compensation to encourage
the risk-taking necessary to grow the firm rapidly and take advantage of the new investment
opportunities. Guay (1999) suggests that firms with more growth options are more likely to have high-
vega contracts. Coles et al. (2006) further show that vega increases in R&D expenditures, firm focus, and
leverage, while vega decreases in investments in plant assets. Some similar evidence has been compiled
for banking companies: Hubbard and Palia (1995) find stronger pay-performance relationships in
deregulated interstate banking markets where investment opportunities are arguably greater.
Compensation of banking industry executives traditionally has not been structured to encourage
risk-taking (Smith and Watts 1992; Houston and James 1995). However, this appears to have changed
with industry deregulation, which expanded banks’ investment opportunities by allowing them to expand
into new geographic markets and provide non-banking financial services such as investment banking,
securities brokerage, and insurance sales and underwriting. There is some evidence that option-based
compensation was positively related to market-based risk measures at U.S. banks during the 1990s (Chen
et al. 2006). However, the post-1990 data (see Figure 2) strongly suggest that bank boards reshaped the
incentives of bank CEOs, consistent with encouraging executives to exploit the new—and to a large
extent risky—growth options made possible by the Gramm-Leach-Bliley Act.
10
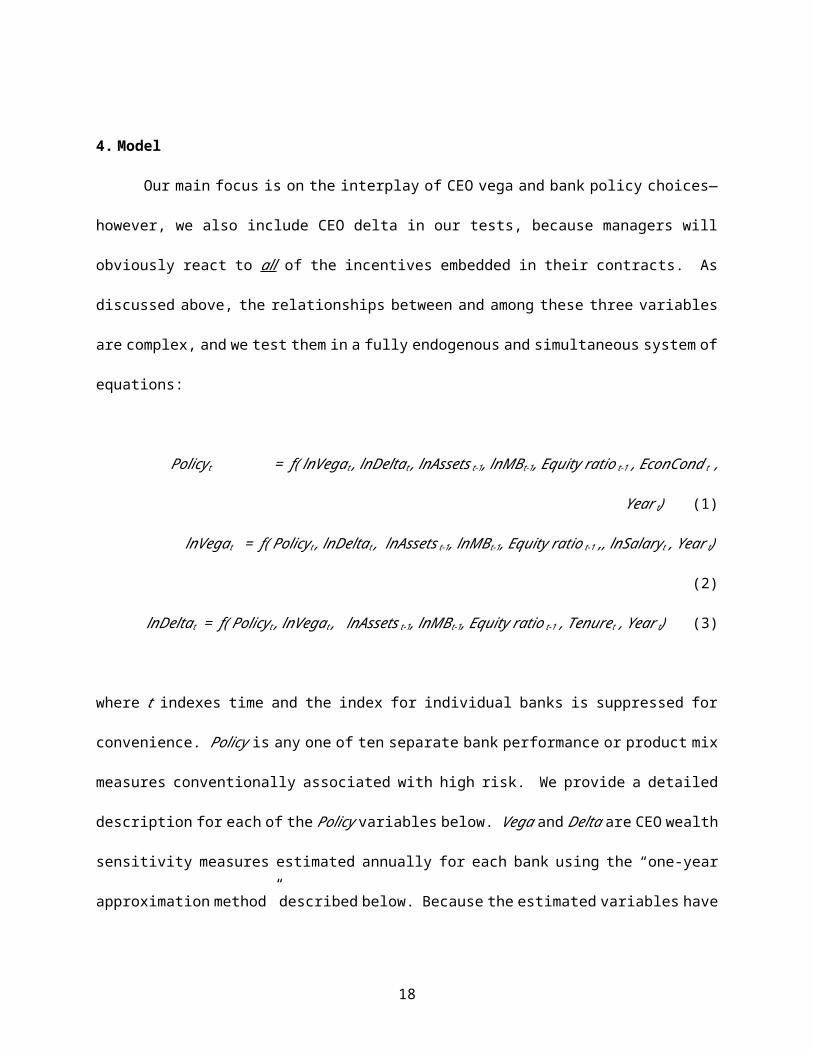
4. Model
Our main focus is on the interplay of CEO vega and bank policy choices—however, we also
include CEO delta in our tests, because managers will obviously react to all of the incentives embedded
in their contracts. As discussed above, the relationships between and among these three variables are
complex, and we test them in a fully endogenous and simultaneous system of equations:
Policyt = f( lnVegat , lnDeltat , lnAssets t-1, lnMBt-1, Equity ratio t-1 , EconCond t , Year t) (1)
lnVegat = f( Policyt , lnDeltat , lnAssets t-1, lnMBt-1, Equity ratio t-1 ,, lnSalaryt , Year t) (2)
lnDeltat = f( Policyt , lnVegat , lnAssets t-1, lnMBt-1, Equity ratio t-1 , Tenuret , Year t) (3)
where t indexes time and the index for individual banks is suppressed for convenience. Policy is any one
of ten separate bank performance or product mix measures conventionally associated with high risk. We
provide a detailed description for each of the Policy variables below. Vega and Delta are CEO wealth
sensitivity measures estimated annually for each bank using the “one-year approximation method”
described below. Because the estimated variables have distributions heavily skewed to the right, we
specify them in natural logs as lnVegat and lnDeltat.
We employ a parsimonious specification. Each of the equations include three common control
variables, observed at the beginning of time t: the log of total assets (lnAssets) accounts for differences in
firm size, the log of the market-to-book equity ratio (lnMB) accounts for differences in bank-specific
investment opportunities, and the ratio of book equity to assets (Equity ratio) accounts for differences in
financial leverage across firms. Each of the equations also contains a unique control variable. The Policy
regression (1) includes a market-weighted economic conditions variable (EconCondt) which varies over
time with economic conditions and varies across banks based on the percentage of their deposits raised in
each of the states in which they operate branches.10 We expect banks facing stronger (weaker) economic 10 The EconCond variable is defined differently across the ten versions of our model, but is always constructed from one of the following four different state-level data sources: the Federal Reserve Bank of Philadelphia’s Coincident Index of economic conditions for each state; the per-capita income for each state; and the payroll employment percentage for each state; and the ratio of non-core deposits to total deposits for each bank. Details available upon
11
conditions will have more (less) leeway for choosing risky business policies. The Vega regression (2)
includes the natural log of CEO salary (lnSalary). Cash compensation allows the CEO to diversify
outside the firm, thus reducing risk aversion and permitting lower risk-taking incentives (Guay 1999) or
may be an indication of CEO entrenchment, thus inducing risk aversion and requiring higher risk-taking
incentives (Berger et al 1997); we have no a priori expectation for the sign on this variable. The Delta
regression (3) includes the number of years that the current CEO has held his/her position (Tenure). Prior
studies have shown that compensation committees are more likely to provide CEOs with high-delta
contracts when the approach of CEO retirement creates horizon problems (Core and Guay 1999). A
vector of year dummies (Year) is included in all three equations.
4.1. Policy equation. In order to form explicit expectations about the coefficient signs on the
Policy, Vega, and Delta variables throughout our model, we must establish a set of a priori assumptions
about the risk qualities of these three variables. For now, we proceed based on three maintained
assumptions: (a) bank risk is increasing in each of our Policy measures, (b) CEO risk-taking incentives
are increasing in Vega, and (c) CEO risk-taking incentives are decreasing in Delta. Assumption (a) holds
to the extent that both CEOs and bank boards believed the policy in question to be risk-increasing at the
time it was implemented. Assumption (b) is not controversial. Assumption (c) arguably holds as a first
principle although, as discussed above, theoretical exceptions exist.
We use ten different definitions of the Policy variable to estimate the model: seven are narrow
business policy variables commonly associated with relatively risky investment choices by banks, and
three are broad market measures that capture the overall riskiness of banks’ policies. Noninterest is total
noninterest income and Noninterest Less is total noninterest income less fees from traditional fiduciary
and depositor service activities; each measure is scaled by net operating income (i.e., noninterest income
+ interest income – interest expense).11 Based on the findings in the extant literature on noninterest
income (e.g., DeYoung and Roland 2001, Stiroh 2006, Elysiani and Wang 2008), and assuming that bank
request. 11 More detailed data on banks’ noninterest income from nontraditional banking activities such as loan securitization, loan servicing, investment banking, brokerage, trading, venture capital, and insurance underwriting, or detailed data on banks’ derivatives holdings, did not become available until 2001.
12
managers during our sample period understood the risks embedded in these activities, we expect
noninterest income to be a risk-increasing activity on average and thus positively related to Vega in
equation (1).
Commercial, Commercial RE, and Mortgage are, respectively, commercial and industrial loans,
commercial real estate loans, and 1-to-4 family mortgage loans scaled by bank assets. These three
categories of loans have been linked to high levels of risk at banks—commercial loans traditionally have
the highest default rates, commercial real estate loan defaults tend to spike during recessions, and
mortgage defaults are at the root of the current financial crisis—which suggests a positive association
with Vega in equation (1). However, during our sample period large banks increasingly shifted credit risk
off their balance sheets and onto their income statements via securitization and other methods (Stiroh
2004a, 2004b, 2006) which, depending on the extent of this risk shifting, could offset or even reverse the
expected positive relationship. We measure the overall riskiness of the loans banks hold on-balance sheet
with annual provisions for loan and lease losses (Provisions) scaled by total assets, and expect a positive
association with Vega in equation (1).12
Losses in mortgage-backed securities investments were a central element in the financial and
banking crisis of 2007-2009. Private MBS is the fair value of private mortgage securitizations held on-
balance sheet, scaled by assets. (We get nearly identical results using the amortized book values of these
investments.) Private MBS are backed by pools of sub-prime, Alt-A, jumbo, or other non-conforming
mortgages, and as such they were known to be at least somewhat riskier investments than agency MBS
(i.e., those issued by Fannie Mae, Freddie Mac, or Ginnie Mae) that are backed by conforming
12 All measures of loan quality derived from bank financial statements are flawed. We choose loan loss provisions because it reflects expected loan losses on recent loan investment decisions (compared with the allocation for loan losses, which includes expected losses for both recent and past loan investment decisions) and because it is more of an ex ante measure of risk (compared with loan charge-offs, which is a pure ex post measure of risk).
13
mortgages.13 If bank managers understood that these investments entailed large amounts of credit risk,
then we expect investments in private MBS products to be positively related to Vega in equation (1).
In addition to these seven narrow measures of business policy, we also include three broad
measures of market risk measures which might reflect the overall riskiness of banks’ business policies.
Total Risk is the standard deviation of daily stock returns over the year in question, Systematic Risk is the
market returns slope coefficient (beta) estimated from a three-factor model (market return, yield on 3-
month Treasuries, 2-year to 10-year yield spread on Treasuries), and Idiosyncratic Risk is the standard
deviation of the residuals from the market model.14 We expect all three market risk measures to be
positively related to Vega in equation (1).15
Given that the compensation literature (discussed above) provides ambiguous theoretical
predictions about the relationship between delta and CEO risk-taking incentives, our expectations for the
sign on the Delta coefficient in equation (1) are not as strong as those just stated for Vega. Nonetheless,
based on our maintained assumption (c), we expect the coefficient on Delta to be negative in all ten
specification of equation (1), just the opposite of our expected positive coefficients on Vega in those
regressions.
We note that our Policy variables focus exclusively on banks’ business policy (investment)
decisions, and that we do not explore banks’ financial policy decisions. At depository intermediaries, the
type and duration of liabilities are determined in large part by the type and duration of assets; that is, the
investment decision and the financing decision are clearly not independent. At large banks like those in
our data, liability mix tends to be determined by bank size (DeYoung et al. 2004, Table A1) and by bank
business policy choices (DeYoung and Yom 2008) and, hence, is less likely to be a primary driver of
13 A conforming mortgage is a small loan that is covered by private mortgage insurance or has a loan-to-value ratio no more than 80%. A third type of mortgage-backed security is the so-called structured MBS, which is essentially an MBS that is backed by a pool of other MBSs. Depending on the details of contract, structured MBS can be even riskier investments that private MBS; we do not use these investments in our study because they were held by a relatively small percentage of the banks in our sample. 14 All of the results on our main tests were robust to using either a one-factor or two-factor market model. 15 Meulbroek (2001) and Duan and Wei (2005) find that the value of executive stock options increases with systematic risk after controlling for total risk.
14
risk.16 Focusing on just one type of policy decision also allows us to keep the model specification
relatively simple and tractable.
4.2. Vega and Delta equations. Charting a business strategy requires fixed investments in
expertise, location, inter-firm contracting, marketing, and customer relationships, so bank business
policies do not change much from year-to-year. The incentives that compensation committees embed in
CEO contracts exhibit similar inertia. Delta and Vega are determined primarily by the accumulation of
past stock grants and past stock option grants, and as shown in Figure 4 this tends to be a very gradual
process. After the first three years of CEO tenure, stock and option grants add no more than 15% on
average to CEO wealth in any given year. (CEO tenure exceeds three years in 76% of the observations in
our data.) The dominance of cross-sectional variation over time-series variation in Delta, Vega, and
Policy has implications for the way we estimate our model, and this will be re-visited in Section 6 below.
A negative sign on Policy in equation (2) would indicate that bank boards provide fewer risk-
taking incentives for CEOs (lower Vega) at banks with strategies that feature large investments in that
particular (risky) business policy. A positive sign on Policy in equation (3) would indicate that bank
boards attempt to align CEO more closely with shareholders (higher Delta) at banks with strategies that
feature large investments in that particular (risky) business policy. Either or both of these findings would
provide evidence that bank boards have been using executive compensation incentives to limit or
constrain risk taking. An opposite finding (a positive sign on Policy in equation (2) and/or a negative sign
on Policy in equation (3)) would provide evidence that bank boards have been using executive
compensation incentives to reinforce or support increased risk taking.
It is logical to think that bank boards will set CEO incentives holistically. A positive sign on
Delta in equation (2) and/or a positive sign on Vega in equation (3) would indicate that bank boards use
these incentive parameters in an offsetting fashion, for example, tempering high-vega incentives to
16 DeYoung and Yom (2008) find that, for large and medium-size U.S. commercial banks between 1990 and 2005, the cross-sectional variation in asset mix is substantially better at explaining the cross-sectional variation in liability mix than vice versa. They find little difference in the direction of this association for small banks, for which the deposit franchise is often an important driver of business policy. The authors also find that, regardless of the causal direction, the correlations between asset mix and liability mix become stronger as banks grow larger.
15
increase the second moment of the stock price distribution with high-delta incentives to increase the first
moment of the stock price distribution.
5. Data
Our sample is based on the intersection of the ExecuComp database and the Federal Reserve Y-
9C database in 1994 through 2006. ExecuComp reports top executive compensation information
extracted from the annual proxy statements for large, publicly traded U.S. corporations; we estimate our
key variables Vega and Delta from these data. The Y-9Cs report quarterly financial statement data for
large U.S. bank holding companies; we extract most of our Policy variables and control variables from
the cumulative year-end December 31 reports. We start out with 141 commercial banking companies
(SIC code 6020) that appear in ExecuComp during any of the years of our sample period, which
generates a total of 1,057 bank-year observations. A relatively small number of observations are lost
when we merge the two databases, lag some of the variables by one year, and estimate Vega and Delta.
As shown in Table 1, our final sample includes 883 bank-year observations of 134 different banks run by
202 different CEOs between 1994 and 2006. We augmented these data with bank stock prices from the
Center for Research in Securities Prices (CRSP) database, macroeconomic conditions data from the
Federal Reserve Bank of Philadelphia, and interest rate data from the Federal Reserve Board.
Table 2 presents summary statistics for the variables in our model. To reduce the influence of
extreme values, the distributions of all variables are winsorized at the 1st and 99th percentiles of
their sample distributions. Following Core and Guay (2002), we use the “one-year approximation”
method to generate annual estimates of Vega and Delta.17 Vega has a mean (median) of $179,701
($63,334), and Delta has a mean (median) of $753,160 ($358,719). In other words, the typical bank CEO
17 We value CEO stock options using the Black-Scholes (1973) model modified by Merton (1973) to account for dividends payouts. Vega is the partial derivative of the option value with respect to stock-return volatility, multiplied by 0.01 times the number of options. Delta equals delta from options plus delta from stock holdings: delta from options is the partial derivative of the option value with respect to stock price, multiplied by 1% of the current stock price times the number of options; delta from stock holdings is simply the product of 1% of the current stock price and the number of shares.
16

enjoys an increase of $63,334 in his/her equity portfolio for a 0.01 increase in stock return volatility, and
an increase of $358,719 for a 1% increase in stock price. Since the two variables have large standard
deviations and are skewed to the right, we use log transformations to produce more symmetric data
distributions. The average CEO in the sample has about 9 years of tenure in the position, and earns $5.52
million in total annual compensation—approximately $840,000 in salary, $1.16 million in bonus, $2.00
million in option grants, and $824,000 in restricted stock. The sample banks are substantially larger than
the typical U.S. commercial bank—mean (median) Assets is approximately $66 billion ($20 billion)
measured in 2006 dollars—and with average Noninterest of 36% rely far more on fee-generating
activities for income than the typical U.S. bank. The typical loan portfolio is relatively balanced between
Commercial, Commercial RE, and Mortgage loans (about 14%, 15%, and 17% of assets on average).
Although Private MBS holdings are small on average, the top quartile of banks invest heavily in these
assets. Provisions for loan losses are low—less than 1% on average—reflecting the relatively good
banking climate during most of the years in our sample, but the standard deviation is relatively large.
Table 3 reports correlations between the ten Policy variables, the overall market risk measures
(Total Risk, Systematic Risk, Idiosyncratic Risk), and the CEO incentive variables lnVega and lnDelta.18
Consistent with our expectations, fee-based income, investments in commercial loans and private MBS,
and expected loan write-offs are all positively correlated with market risk, with the fee income measures
more closely associated with systematic risk (DeYoung and Roland 2001, Choi et al 2006, Clark et al
2007) and the portfolio investment measures associated more closely with idiosyncratic risk. Despite
their historical links to episodes of widespread bank failure, both commercial real estate loans and 1-to-4
family mortgage loans are negatively correlated with market risk. This likely reflects the relatively stable
and predictable cash flows generated by these lines of business except during real estate downturns,
combined with the fact that, prior to the 2007-2009 recession, real estate downturns had been regional
phenomena and hence large banks could expect to diversify away much of the credit risk associated with
18 The table display Pearson correlations. Results are similar for Spearman correlations.
17
these loans. (This is in contrast to small banks that hold non-diversified portfolios of local commercial
real estate loans which, as a result, historically comprise the largest percentage of bank insolvencies.)
Although high-vega and high-delta compensation theoretically impart very different incentives on
CEOs, lnVega and lnDelta have identical qualitative correlations with each of the ten Policy variables in
Table 3. Fee income, loan provisions, MBS holdings, and systematic risk are positively correlated with
both of the CEO incentive measures, while commercial real estate loans, mortgage loans, and
idiosyncratic risk are negatively correlated with both of the CEO incentive measures. This suggests that
when banks embed strong wealth incentives in their CEO compensation packages they tend to include
both high-vega and high-delta incentives. However, this could also indicate the driving presence of other
variables and conditions uncontrolled for in these bivariate tests, and in any case these correlations shed
little light on the motivations of bank compensation committees. We turn to the results of our system of
equations model to untangle these potential effects.
6. Model estimation and results
Repeated and non-trivial changes in the corporate governance environments of our sample banks
influence the manner in which we estimate our model. Our 1994-2006 data includes 134 different
banking companies, although only 3 of these firms existed in all 13 years of the data with the same CEO.
Collectively, these 134 banks employed 202 different CEOs during the sample period, and 61 of these
134 banks made at least one acquisition during the sample period that increased asset size by 25% or
greater. For the 51 CEO changes for which we have complete compensation information, the average
incoming CEO’s Delta was 10.9% lower than the average outgoing CEO’s Delta, consistent with a
change in governance in which new CEOs have different incentives than long-time CEOs. (The change
in Vega around CEO changes was non-significant.) For the 22 largest and most acquisitive banks in our
sample (i.e., banks with assets of at least $50 billion that increased their size by at least 25% via
acquisition in one year), Vega was 14.4% higher in the year of the acquisition relative to the year prior to
the acquisition, consistent with a change in governance in which CEOs of large/growing banks face
18

different incentives than other CEOs. (The change in Delta around these acquisitions was non-
significant.)
These complications, combined with the relative bank-level inertia in Policy, Vega, and Delta
discussed above in Section 4, rule out a standard fixed-bank effects panel estimation approach. We apply
three alternative treatments to the panel data.19 In the first approach we simply pool the unbalanced data
panel. In the second approach we impose a 3-lag Newey-West autocorrelation structure at the CEO-level.
The third (and our preferred) approach combines the first two approaches, pooling the data for CEOs who
engaged in major acquisitions during the sample period but imposing the 3-lag Newey-West structure for
CEOs who did not.20 In all cases, we estimate the system of equations (1), (2) and (3) using standard two-
stage general method of moments estimation with instrumental variables (IV/2SGMM). Each equation is
estimated individually, using the full set of exogenous right-hand side variables from the three-equation
system as instruments for the two right-hand side endogenous variables. The system is exactly identified
in the mechanical sense that the number of exclusions equals the number of equations; as described
above, we exclude Salary and Tenure from equation (1), EconCond and Tenure from equation (2), and
EconCond and Salary from equation (3).
We estimate 90 different versions of the model: ten different Policy variables, three different
panel data treatments, three different model specifications/sub-samples. This generates a large volume of
results, so to conserve space we report only the estimated coefficients for the Policy, lnVega, and lnDelta
variables in Table 4 (full sample), Table 5 (sub-sample that excludes the largest banks) and Table 6 (full
sample, testing for post-1999 effects). However, we do display the complete results for one full-sample
version of the model (in which Policy = Systematic Risk) in Appendix Table A2. The control variable
coefficients and the diagnostic test results displayed there are reasonably representative of those obtained
19 We also performed Fama-McBeth estimation (results not displayed, available upon request). The signs and magnitudes of the test coefficients are highly robust to this approach, but the small number of annual cross-sections in our data (T=13) make statistical inference difficult. 20 We choose 3 lags for the Newey-West autocorrelation structure based on the distribution of the CEO tenure variable. Of the 202 chief executives at our sample banks, 170 ran their banks for 7 years or less. According to Petersen (2009, ft. 18), in the standard application of Newey-West a lag length of M implies that one allows a correlation between the error terms of observations t and t-k, where k runs from –M to M. Thus, if we use 3 lags in Newey-West estimation, the autocorrelation structure completely covers 84% of the CEOs in our sample.
19
for the other Policy specifications (not shown here, but available upon request). As can be seen in Table
A2, system under-identification is rejected at high levels of significance for all the equations.
One must be careful when interpreting the estimated coefficients in the tables below. The
coefficients largely capture cross-sectional variation in the data, not inter-temporal reactions within given
firms. For example, a negative coefficient on Commercial in equation (2) would indicate that boards at
banks with high concentrations of business lending relative to average industry levels of business lending
tend to set lower than average pay-risk incentives (Vega) for their CEOs.
6.1. Full-sample results. The estimates displayed in Table 4 strongly infer that banks’ business
policy choices and risk profiles were influenced by CEO wealth incentives between 1994 and 2006. In
equation (1), high-vega compensation is associated with statistically significant increases in systematic
and idiosyncratic risk, noninterest income, investment in private mortgage-backed securities, and loan
portfolio credit risk—all of which are risk-increasing activities or indicators. Some of these increases are
economically substantial. At the means of the data, a 10% increase in Vega is associated with a 2.0%
increase in Idiosyncratic Risk, a 2.8% increase in Noninterest, a 3.1% increase in Systematic Risk, a 3.5%
increase in NoninterestLess, a 6.7% increase in Provisions, and a 21.9% increase in Private MBS.21 (The
last of these estimates is clearly too large: Since about one-in-three observations of Private MBS are
zeros, we re-estimated using Tobit-IV techniques and found a smaller yet still substantial 10.3% increase
in Private MBS for a 10% increase in Vega.) Not all of the Policy variables increased with Vega: a 10%
increase in Vega is associated with statistically significant 2.1% and 3.2% decreases, respectively, in
Mortgage and Commercial RE. Collectively, these results infer that risk-seeking bank management shifts
away from traditional portfolio lending and toward less traditional investment and off-balance sheet
activities.
High-delta compensation affects business policy less often and somewhat less substantially. A
10% increase in Delta is associated with statistically significant decreases in risk—a 3.3% decrease in
21 An example of these calculations: Given the semi-log regression specification, the estimated coefficient 0.286 is interpreted as the unit change in Systematic Risk associated with the percent change in Vega. Thus, 0.286*0.10/0.909 = 0.03146 = 3.1% gives the result, where 0.909 is the sample mean of Systematic Risk.
20
NoninterestLess, a 2.9% decrease in Noninterest, a 1.4% decrease in Commercial, and a 1.1% decrease in
Systematic Risk—suggesting that bank boards provide offsetting pay-performance and pay-risk incentives
for some activities. Similarly, a 10% increase in Delta is associated with a statistically significant 2.8%
increase in Commercial RE.
There is a sensible symmetry in these results. CEOs with high pay-performance incentives (high-
delta banks) tend to expand investment in lower risk activities and away from activities less well
understood by investors. Within their loan portfolios, high-delta banks substitute commercial real estate
loans for general (non-real estate) business loans; outside their loan portfolio they generate smaller
portions of their income from difficult-to-value noninterest activities (Elysiani and Wang 2008). Thus,
the results suggest that high pay-performance sensitivity creates incentives for bank executives to run
relatively traditional banking models. In contrast, CEOs with high pay-risk incentives (high-vega banks)
choose policies more consistent with modern transactions banking models: more reliant on noninterest
income and the systematic risk that comes with it (Clark et al. 2007) and less reliant on traditional
portfolio lending. Also note that the strong positive relationship between lnVega and lnAssets in Table
A2 (a result that obtains in all estimations of the lnVega equation) is consistent with the large size
required by the transactions banking model.
We find less evidence that bank boards take existing bank business policies into account when
setting CEO wealth incentives. In the case of Vega, interpreting this scant evidence is straightforward.
The Policy variable carries a statistically significant coefficient in equation (2) only three times, and in
each case—for Idiosyncratic Risk, Total Risk, and Private MBS—the coefficient is negative. This
suggests that compensation committees at banks with the highest (lowest) levels of these business policy
measures attempted to constrain (encourage) further risk taking in these areas by giving their CEOs
relatively low-vega (high-vega) compensation. In the case of Delta, however, interpretation is less
straightforward. The Policy variable carries a statistically significant coefficient in equation (3) only
twice, and in each case—for Noninterest and NoninterestLess—the coefficient is negative. Why would
compensation committees at banks with the highest levels of fee-generating activities impose low pay-
21
performance sensitivity on their CEOs, i.e., weakening CEO alignment with shareholders and/or reducing
CEO risk aversion? There are two diametrically possible interpretations. First, during much of our
sample period many banking experts mistakenly believed that converting from interest-based banking to
fee-based banking was risk-reducing (DeYoung and Roland 2001). Second, compensation committees at
transactions banks (i.e., high amounts of noninterest income) offered low-delta contracts to encourage
further risk taking. The tests reported below in Table 6 help us differentiate between these two
possibilities.
The most consistent result in equations (2) and (3) is the positive and statistically significant
coefficient on lnVega in the lnDelta regressions. This is consistent with our observation above from
Table 3, that is, when banks embed strong wealth incentives in their CEO compensation packages they
tend to include both high-vega and high-delta incentives. But we note that the symmetric result (a
positive coefficient on lnDelta) does not obtain in the lnVega regression. A likely explanation:
compensation committees use high-delta incentives to moderate risk-taking behavior by CEOs with the
highest vegas.
6.2. Excluding large banks. The risk-taking and corporate governance environments at the very
largest banks may differ from the environment found at the typical publicly traded bank in our sample.
For instance, “too-big-to-fail” regulatory policies reduces the cost of taking risk at these companies. The
large market capitalization of these banks makes it is less likely that monitoring by shareholder blocks
will be effective at constraining the actions of the CEOs. And the sheer size of compensation in terms of
salary, options, stock grants alters the personal wealth incentives facing these CEOs. To check whether
any of the full-sample results displayed in Table 4 are driven by the largest banking companies, we re-
estimated the model after excluding bank-year observations in which banking assets exceeded $100
billion (2006 dollars). Table 5 displays these sub-sample results. The results are qualitatively and for the
most part quantitatively unchanged.
6.3. Pre- and post-1999 model. As displayed above in Figures 2 and 3, the incentive structure of
bank CEO compensation diverged from the incentive structure in non-bank CEO compensation around
22
2000. Bank-CEO vega increased markedly, suggesting that bank boards were encouraging executives to
exploit the new investment opportunities made possible by Gramm-Leach-Bliley Act and perhaps
exacerbated by the boom in securitized mortgage lending markets. Bank-CEO delta also increased
markedly after 2000, but quickly returned to “normal” levels—potentially, evidence that bank boards at
first sought to temper the new high-vega CEO incentives. To test whether these changes in risk-taking
incentives influenced bank policy making, we added a Post1999 dummy to all three equations in our
model, both as an independent exogenous variable and interacted with the right-hand side Policy, lnVega,
and lnDelta variables.
The results of this more flexible specification, which we estimated using two-stage least squares
(2SLS) techniques on pooled time series-cross section data, are displayed in Table 6. 22 We find two
general patterns in the post-1999 data: business policy became more sensitive to the contractual risk-
taking incentives of the CEO, and compensation committees began managing the risk-taking incentives in
CEO compensation in a more coordinated fashion.
Column [1] in Table 6 shows that five of the ten business policies—Idiosyncratic Risk, Total
Risk, Noninterest, NoninterestLess, and Provisions—became both more positively associated with vega
and more negatively associated with delta after 1999. This arguably indicates that compensation
committees became better able to influence the decisions of CEOs, and thus the riskiness of their banks,
after deregulation. Column [2] shows that after 1999 boards at banks with high levels of Private MBS
(and to a lesser statistical extent Idiosyncratic Risk and Total Risk) became more likely to choose low-
vega CEO incentives, while boards at banks with high levels of Commercial and Mortgage loans became
more likely to choose high-vega CEO incentives. This arguably indicates that post-deregulation
compensation committees attempted to constrain risk-taking at banks that purchased large amounts of
securities from other banks, while encouraging increased risk-taking at banks with more traditional on-
balance sheet lending strategies. Column [3] shows that compensation committees at high-vega banks 22 These simple pooled time series-cross section estimates are most comparable to those displayed in columns [1], [4], and [7] in Table 4. Adding the interaction terms doubled the number of endogenous variables in the equation system, and given a lack of good additional instruments this precluded us from performing IV/2SGMM estimation. We performed these 2SLS estimations manually, which precluded Newey-West estimation.
23
became more likely to moderate those risk-taking incentives by choosing high deltas after 1999. In
addition, the results indicate that the negative relationships between Delta and the noninterest income
variables discussed above are largely post-1999 phenomena, suggesting that bank boards were
encouraging their CEOs to take advantage of nontraditional growth opportunities provided by
deregulation.
7. Summary, Discussion, and Conclusions
The huge losses suffered by large U.S. financial institutions that created and invested in risky
mortgage-backed securities—and the equally huge government equity injections, debt guarantees, and
liquidity creation aimed at keeping these firms afloat and financial markets functioning—have raised the
public’s ire. True to form, politicians have responded with a variety of schemes to limit the pay of the
financial executives who “got us into this mess.” While much of this is political theater—in time, a
substantial portion of the government loans and capital injections are likely to be paid back, and ex post
facto sanctions on employee pay and bonuses may not withstand constitutional scrutiny—the episode has
raised public consciousness and increased the likelihood of a more permanent role for government in
monitoring and determining executive pay in publicly traded companies. In 2005, Representative Barney
Frank introduced “The Protection Against Executive Compensation Abuse Act,” which called for
increased public disclosure of executive pay—including the targets for short-term and long-term
performance incentives—and would have required shareholder approval of executive compensation
contracts. The bill did not progress beyond initial stages. However, Frank and others are considering
new legislation that would link executive pay to company performance, and such a bill would have a
better chance for passage in today’s environment.23
Underlying the efforts to control executive pay is the belief that corporate risk-taking can be
controlled by inserting the proper incentives into executive compensation contracts. We examine whether
and how the terms of CEO compensation contracts at large, publicly traded U.S. commercial banks
23 “Cuomo, Frank Seek to Link Executive Pay, Performance,” Susanne Craig, Wall Street Journal, March 13, 2009.
24
influenced the risk-profiles of these firms between 1994 and 2006, and also whether and how bank boards
set CEO compensation terms with respect to the riskiness of their banks. We find evidence that bank
CEOs respond to risk-taking incentives by taking more risk, and that bank boards determine CEO risk-
taking incentives conditional on extant bank business policies. On average, banks in which CEOs have
high pay-risk sensitivity (high-vega banks) generate a larger percentage of their incomes from noninterest
activities, invest a larger percentage of their assets in private (i.e., subprime or otherwise non-conforming)
mortgage securitizations and a smaller percentage of their assets in portfolios of real estate loans, and take
more credit risk. In general, these policy decisions became more responsive to CEO pay-risk sensitivity
after the Gramm-Leach-Bliley Act of 1999 expanded the investment opportunity set for commercial
banks. The evidence also indicates that compensation committees provided high-delta contracts as
incentives for bank CEOs to exploit post-deregulation growth opportunities, as well as to shift from
traditional on-balance sheet portfolio lending to less traditional investments (e.g., private-issue mortgage-
backed securities) and nontraditional fee-generating activities. However, we also find strong evidence
that bank boards managed excessive risk-taking incentives at these banks by establishing
complementarily high values of delta, particularly after industry deregulation expanded the scope of bank
managers to take risk.
We draw four broad conclusions from these findings. First, banking executives were aware to at
least some extent of the risks associated with their investments in private issue MBS; our results linking
high-vega CEOs to private MBS investments run contrary to the claim that banks were misled by over-
optimistic ratings on MBS (although such claims may be valid for less sophisticated investors).24
Similarly, our results linking high-vega CEOs to noninterest income suggest that large bank executives
had become, sometime during our 1994-2006 sample period, well aware of the increased risks associated
with transactions banking business strategies. Second, banking executives respond in economically
24 Internal rating agency emails from before the time the credit markets deteriorated, discovered and released publicly by U.S. congressional investigators, suggest that some rating agency employees suspected at the time that lax standards for rating structured credit products would produce negative results. (U.S. House of Representatives Committee on Government Oversight and Reform, 10-12-2008, “Committee Holds Hearings on the Credit Rating Agencies and the Financial Crisis,” http://oversight.house.gov/story.asp?ID=2250.)
25
meaningful ways to the incentives present in their compensation contracts. While this lends some
legitimacy to arguments for government intervention to limit contractual risk-taking incentives for
executives at systemically important financial institutions, this is merely a necessary and not a sufficient
condition for such policies. Moreover, nothing in this study supports such policies for banks that do not
pose systemic risks. Third, government intervention to limit risk-taking incentives in financial executive
compensation contracts could at best strengthen, and at worst interfere with, the compensation-based risk
mitigation behaviors already being exhibited by bank boards that we detect here. The terms of optimal
contract incentives are likely to vary substantially across firms and CEOs, while government prescriptions
almost by necessity tend to be one size fits all. Furthermore, the contractual incentives that we test here
were designed by boards to mitigate principal-agent problems on the behalf of shareholders, while
contractual incentives imposed via regulation are presumably aimed at providing public goods (i.e.,
financial market stability, fairness) and could work far differently. Fourth, putting aside populist
arguments that executive compensation is too large in the absolute, as well as the argument that the
Gramm-Leach-Bliley Act was a policy misstep, bank compensation committees appear to have acted
efficiently and effectively in response to deregulation. Bank boards altered compensation incentives
(higher vegas) in hopes that executives would take advantage of new growth opportunities and, so-
incented, CEOs exploited those opportunities, as evidenced by increases in fee-based income from
nontraditional activities.
In interpreting our 1994-2006 findings, it is important to realize that bank managers were making
their policy decisions conditional not only on the incentives structured into their compensation
agreements, but also conditional on their beliefs regarding the risk-return tradeoffs associated with their
various policy options. The 2007-2009 financial crisis is likely to have changed managers’ understanding
of risks and returns in some lines of business. For example, the housing downturn revealed that many
mortgage-backed securities were far riskier than suggested by either their third-party ratings or their
contractual yields; managers’ beliefs about the risk-return tradeoffs inherent in MBS are likely to have
changed post-downturn. Thus, our 1994-2006 tests reflect bank managers’ pre-crisis beliefs about the
26
risk-return qualities of MBS, and may only imperfectly capture how their business policy choices will
react to contractual risk-taking incentives in a more informed post-crisis environment. Similarly, our
estimates are based on the incomplete pre-crisis understanding of these risk-return tradeoffs by bank
boards and compensation committees. Thus, one must be careful when drawing inferences about optimal
post-crisis policy based on our pre-crisis results. Proposals to foster macroeconomic stability by rolling
back banking powers may be misguided, because informed post-crisis managers will arguably be better
able to implement those powers effectively. And proposals to constrain risk-taking by constraining the
ability of bank boards to set the terms of executive compensation may also be misguided, because
informed post-crisis boards will arguably be better able to determine efficient incentives.
Finally, we note that none of these conclusions are meant to extend to non-banking firms.
Commercial banks are subject to supervisory monitoring that, if not explicitly, implicitly creates extra
pressure for boards to mitigate risk-taking managerial behaviors. Moreover, the level and types of risk
taken by bank executives, and endorsed by bank compensation committees, during the 1990s and 2000s,
to some large extent are special to the newness of the transactions banking business model and the
incomplete understanding of the risks inherent in that model and the products it created.
27
References
Berger, P.G., Ofek, E., Yermack, D.L., 1997. Managerial entrenchment and capital structure decisions. Journal of Finance 52, 1411-1438.
Black, F., Scholes, M.S., 1973. The pricing of options and corporate liabilities. Journal of Political Economy 81, 637-654.
Chen, C.R., Steiner, T.L., Whyte, A.M., 2006. Does stock option-based executive compensation induce risk-taking? An analysis of the banking industry. Journal of Banking and Finance 30, 915-945.
Choi, S., DeYoung, R., Hasan, I., 2006. “Risk, Return, and Noninterest Income at Commercial Banks: Cross-Country Evidence, unpublished working paper, Rensselaer Polytechic Institute.
Clark, T., Dick, A., Hirtle, B., Stiroh, K., Williams R., 2007. The role of retail banking in the U.S. banking industry: risk, return, and industry structure. Economic Policy Review – Federal Reserve Bank of New York 13, 39-56.
Coles, J.L., Daniel, N.D., Naveen, L., 2006. Managerial incentives and risk-taking. Journal of Financial Economics 79, 431-468.
Core, J., Guay, W., 1999. The use of equity grants to manage optimal equity incentive levels. Journal of Accounting and Economics 28, 151–184.
Core, J., Guay, W., 2002. Estimating the value of employee stock option portfolios and their sensitivities to price and volatility. Journal of Accounting Research 40, 613-630.
DeYoung, R., Hunter, W.C., Udell, G.F., 2004. The Past, Present, and Probable Future for Community Banks, Journal of Financial Services Research 25: 85-133.
DeYoung, R., Roland, K.P., 2001. Product mix and earnings volatility at commercial banks: evidence from a degree of total leverage model. Journal of Financial Intermediation 10, 54-84.
DeYoung, R., Rice, T., 2004. Noninterest income and financial performance at U.S. commercial banks. The Financial Review 39, 101-127.
DeYoung, R., Yom, C., 2008. On the Independence of Assets and Liabilities: Evidence from U.S. Commercial Banks. Journal of Financial Stability 4, 275-303.
Duan, J., Wei J., 2005. Executive stock options and incentive effects due to systematic risk. Journal of Banking and Finance 29, 1185-1211.
Elysiani, E., Wang, Y., 2008. Non-Interest Income Diversification and Information Asymmetry of Bank Holding Companies, unpublished working paper, Temple University.
Gritsch, M., Snyder, T.C., 2005. The impact of current tax policy on CEO stock option compensation: a quantile analysis. Academy of Accounting and Financial Studies Journal, September.
Guay, W., 1999. The sensitivity of CEO wealth to equity risk: an analysis of the magnitude and determinants. Journal of Financial Economics 53, 43-71.
28

Houston, J.F., James, C., 1995. CEO compensation and bank risk: is compensation in banking structured to promote risk taking. Journal of Monetary Economics 36, 405-431.
Hubbard, R.G., Palia, D., 1995. Executive pay and performance: evidence from the U.S. banking industry. Journal of Financial Economics 39, 105-130.
Hughes, J. P., Lang, W., Mester, L. J., Moon, C., 1996. Efficient banking under interstate branching. Journal of Money, Credit, and Banking 28, 1045-1071.
Jensen, M.C., Meckling, W.H., 1976. Theory of the firm: managerial behavior, agency costs, and ownership structure. Journal of Financial Economics 3, 305-360.
John, T.A., John, K., 1993. Top-management compensation and capital structure. Journal of Finance 48, 949-974.
Knopf, J.D., Nam, J., Thornton, J.H. Jr., 2002. The volatility and price sensitivities of managerial stock option portfolios and corporate hedging. Journal of Finance 57, 801-814.
McConnell, J.J., Servaes, H., 1990. Additional evidence on equity ownership and corporate value. Journal of Financial Economics 27, 595-612.
Merton, R.C., 1973. Theory of rational option pricing. Bell Journal of Economics and Management Science 4, 141-183.
Meulbroek, L., 2001. The efficiency of equity-linked compensation: understanding the full cost of awarding executive stock options. Financial Management 30, 5-44.
Morck, R., Shleifer, A., Vishny, R., 1988. Management ownership and market valuation: an empirical analysis. Journal of Financial Economics 20, 293-315.
Nam, J., Ottoo, R.E., Thornton Jr., J.H. 2003. The effect of managerial incentives to bear risk on corporate investment and R&D investment. The Financial Review 38, 77-101.
Petersen, M., 2009. Estimating Standard Errors in Finance Panel Data Sets: Comparing Approaches. Review of Financial Studies 22, 435-480.
Rogers, D.A., 2002. Does executive portfolio structure affect risk management? CEO risk-taking incentives and corporate derivative usage. Journal of Banking and Finance 26, 271-295.
Rossi, C. V., 1998. Mortgage banking cost structure: resolving an enigma. Journal of Economics and Business 50, 219-234.
Smith, C.W., Stulz, R.M., 1985. The determinants of firms’ hedging policies. Journal of Financial and Quantitative Analysis 20, 391-405.
Smith, C.W., Watts, R.L., 1992. The investment opportunity set and corporate financing, dividend, and compensation policies. Journal of Financial Economics 32, 263-293.
Stein, J. C., 2002. Information production and capital allocation: decentralized versus hierarchical firms. Journal of Finance 57, 1891-1921.
29
Stiroh, K., 2004a. Do community banks benefit from diversification? Journal of Financial Services Research 25, 135-160.
Stiroh, K., 2004b. Diversification in banking: is noninterest income the answer? Journal of Money, Credit, and Banking 36, 853-882.
Stiroh, K., 2006. New evidence on the determinants of bank risk. Journal of Financial Service Research 30, 237-263.
30

Table 1Data Structure
(N=883, 1994-2006)
Panel A: Number of observations by year
YearNo. of
Observations1994 711995 651996 691997 691998 731999 712000 682001 612002 692003 712004 642005 692006 63Total 883
Panel B: Number and distribution of banks and CEOs
number of years that banks or CEOs appear in the data sampleNumber of banks or CEOs
in the data samplemean standard
deviation25th
percentilemedian 75th
percentileBanks 134 6.590 4.157 3 6 10CEOs* 202 4.371 3.036 2 4 6
* 56 banks changed CEOs at least once during the sample period.
Panel C: Number and incidence of significant increases in bank size.(Significant increase = 25% inflation-adjusted year-to-year increase in assets.)
a. Number of significant annual increases in asset size* 96b. Number of annual observations for CEOs involved with significant increases 496c. Mean years between significant increases for CEOs involved with significant increases (a /b) 5.2* 61 banks experienced significant increases in asset size at least once during the sample period.
31
Table 2Summary statistics for variables used in the model (1994-2006)
# ofObs
MeanStandardDeviation
25thPercentile
Median75th
PercentileEndogenous variablesVega ($000s) 883 179.701 283.049 25.946 63.334 197.797lnVega 883 4.195 1.578 3.294 4.164 5.292Delta ($000s) 883 753.160 1213.490 153.074 358.719 879.189lnDelta 883 5.881 1.243 5.037 5.885 6.780Total Risk 883 0.017 0.006 0.013 0.016 0.021Systematic Risk 883 0.909 0.341 0.677 0.884 1.128Idiosyncratic Risk 883 0.015 0.006 0.011 0.013 0.017Noninterest 883 0.362 0.165 0.246 0.323 0.432NoninterestLess 883 0.206 0.140 0.111 0.168 0.251Commercial 883 0.144 0.077 0.092 0.137 0.185Commercial RE 883 0.149 0.102 0.077 0.129 0.205Mortgage 883 0.172 0.096 0.107 0.168 0.225Provisions 883 0.003 0.003 0.001 0.002 0.004Private MBS 882 0.016 0.034 0.000 0.001 0.017Control variables
Assets ($000s)883
65,655,482
132,066,564 7,368,241
20,396,090 57,283,875
lnAssets 883 16.963 1.362 15.813 16.831 17.864MB 882 2.411 0.969 1.716 2.179 2.857lnMB 882 1.191 0.262 0.999 1.157 1.350Equity Ratio 883 0.083 0.016 0.072 0.081 0.093Salary ($000s) 883 840.440 330.581 603.093 836.936 1,030.930lnSalary 883 6.660 0.394 6.404 6.731 6.939Tenure 882 8.997 6.703 4 7 13Coincident index 883 134.642 15.226 122.503 136.397 144.891Per capita income 883 33.714 4.448 30.795 33.000 36.945Payroll employment 883 0.398 0.032 0.376 0.394 0.417Noncore Deposit Ratio 844 0.868 0.089 0.843 0.894 0.928Addendum: Details of compensation Total compensation ($000s) 880 5,519.280 6,186.310 1,734.360 3,144.790 6,708.490Salary ($000s) 883 840.440 330.581 603.093 836.936 1,030.930Bonus ($000s) 883 1,157.700 1,627.570 246.914 560.000 1,348.310Option grants ($000s) 880 1,998.710 3,101.420 209.082 802.539 2,416.370Restricted stock grants ($000s) 883 823.538 2,110.960 0.000 0.000 656.211
All variable definitions are included in Appendix Table A1.
32
Table 3Pearson correlations (N=883, 1994-2006)
Policy variables Total RiskSystematic
RiskIdiosyncratic
RisklnVega lnDelta
Noninterest 0.094*** 0.272*** -0.005 0.434*** 0.387***NoninterestLess 0.115*** 0.260*** 0.029 0.405*** 0.373***Commercial 0.069** 0.014 0.075** -0.006 -0.020Commercial RE -0.120*** -0.091*** -0.089*** -0.219*** -0.251***Mortgage -0.194*** -0.250*** -0.160*** -0.103*** -0.077**Provisions 0.289*** 0.112*** 0.214*** 0.193*** 0.173***Private MBS 0.083*** 0.039 0.084** 0.076** 0.141***Total Risk -- -- -- 0.042 0.038Systematic Risk -- -- -- 0.278*** 0.228***Idiosyncratic Risk -- -- -- -0.097*** -0.068**
All variable definitions are included in Appendix Table A1.
33
Table 4Selected two-stage least squares parameters from equations (1), (2) and (3). Unbalanced data panel of 881 annual observations for 134 different publicly traded U.S. banking companies from 1994-2006.
Robust standard errors in brackets. The superscripts ***, **, and * indicate statistical significance at the 1%, 5%, and 10% levels.
[1] [2] [3] [4] [5] [6] [7] [8] [9]dependent variable:
Policy Policy Policy lnVega lnVega lnVega lnDelta lnDelta lnDelta
panel data treatment:
pooledNewey-West by
CEO
Newey-West by
CEO if no large M&A
pooledNewey-West by
CEO
Newey-West by
CEO if no large M&A
pooledNewey-West by
CEO
Newey-West by
CEO if no large M&A
Policy: Systematic Risk -3.396 -3.396 -3.396 1.193 1.193 1.193
[2.148] [2.544] [2.426] [0.742] [1.030] [0.893]
lnVega 0.286*** 0.286** 0.286*** 0.481*** 0.481** 0.481***
[0.085] [0.122] [0.105] [0.143] [0.218] [0.174]
lnDelta -0.100** -0.100 -0.100* -0.429 -0.429 -0.429
[0.045] [0.065] [0.055] [0.311] [0.425] [0.391]
Policy: Idiosyncratic Risk -180.595* -180.595 -180.595* 81.395 81.395 81.395
[94.579] [110.179] [104.388] [49.968] [69.021] [60.273]
lnVega 0.003*** 0.003* 0.003** 0.575*** 0.575*** 0.575***
[0.001] [0.001] [0.001] [0.127] [0.198] [0.147]
lnDelta -0.001* -0.001 -0.001 -0.226 -0.226 -0.226
[0.001] [0.001] [0.001] [0.206] [0.302] [0.272]
Policy: Total Risk -210.156* -210.156* -210.156* 100.905 100.905 100.905
[109.316] [127.664] [120.320] [62.359] [85.648] [74.768]
lnVega 0.002** 0.002 0.002 0.602*** 0.602*** 0.602***
[0.001] [0.001] [0.001] [0.128] [0.201] [0.148]
lnDelta 0.000 0.000 0.000 -0.165 -0.165 -0.165
[0.000] [0.001] [0.001] [0.193] [0.286] [0.256]
Policy: Noninterest 1.231 1.231 1.231 -2.077** -2.077 -2.077*
[1.175] [1.780] [1.687] [0.925] [1.298] [1.183]
lnVega 0.102*** 0.102* 0.102** 0.791*** 0.791*** 0.791***
[0.038] [0.060] [0.048] [0.171] [0.266] [0.211]
lnDelta -0.106*** -0.106*** -0.106*** 0.078 0.078 0.078
[0.022] [0.033] [0.029] [0.248] [0.379] [0.354]
Policy: NoninterestLess 2.273 2.273 2.273 -3.802** -3.802 -3.802
[2.182] [3.321] [3.123] [1.837] [2.653] [2.357]
lnVega 0.072** 0.072 0.072* 0.822*** 0.822*** 0.822***
[0.032] [0.052] [0.038] [0.200] [0.316] [0.241]
lnDelta -0.068*** -0.068*** -0.068*** 0.105 0.105 0.105
[0.017] [0.026] [0.023] [0.269] [0.411] [0.382]
Policy: Private MBS -31.504** -31.504 -31.504 -12.456 -12.456 -12.456
[15.801] [24.114] [19.652] [9.285] [14.338] [11.716]
lnVega 0.035** 0.035 0.035* 0.947*** 0.947*** 0.947***
[0.014] [0.021] [0.019] [0.198] [0.279] [0.252]
lnDelta 0.008 0.008 0.008 0.412** 0.412 0.412*
[0.006] [0.010] [0.008] [0.203] [0.293] [0.242]
34
Policy: Commercial -1.807 -1.807 -1.807 0.796 0.796 0.796
[6.291] [10.257] [9.707] [5.516] [8.714] [7.393]
lnVega 0.011 0.011 0.011 0.693*** 0.693*** 0.693***
[0.012] [0.019] [0.015] [0.154] [0.252] [0.190]
lnDelta -0.020** -0.020 -0.020** -0.124 -0.124 -0.124
[0.008] [0.012] [0.010] [0.185] [0.285] [0.257]
Policy: Commercial RE -0.488 -0.488 -0.488 0.219 0.219 0.219
[1.672] [2.729] [2.594] [1.519] [2.400] [2.043]
lnVega -0.048*** -0.048* -0.048** 0.695*** 0.695*** 0.695***
[0.018] [0.026] [0.023] [0.160] [0.263] [0.202]
lnDelta 0.042*** 0.042*** 0.042*** -0.063 -0.063 -0.063
[0.011] [0.016] [0.014] [0.187] [0.296] [0.274]
Policy: Mortgage -0.948 -0.948 -0.948 0.431 0.431 0.431
[3.251] [5.298] [5.037] [2.999] [4.741] [4.041]
lnVega -0.036** -0.036 -0.036* 0.701*** 0.701** 0.701***
[0.018] [0.027] [0.021] [0.185] [0.305] [0.241]
lnDelta 0.019* 0.019 0.019 -0.065 -0.065 -0.065
[0.011] [0.017] [0.014] [0.182] [0.287] [0.265]
Policy: Provisions 20.984 20.984 20.984 -29.299 -29.299 -29.299
[160.385] [262.549] [248.260] [140.532] [222.251] [189.935]
lnVega 0.002** 0.002* 0.002** 0.679*** 0.679** 0.679***
[0.001] [0.001] [0.001] [0.185] [0.281] [0.220]
lnDelta -0.001* -0.001 -0.001 -0.095 -0.095 -0.095
[0.000] [0.000] [0.000] [0.175] [0.269] [0.243]
35
Table 5Selected two-stage least squares parameters from equations (1), (2) and (3). Unbalanced data panel of
747 annual observations for 134 different publicly traded U.S. banking companies from 1994-2006 with assets less than $100 billion in 2006 dollars. Robust standard errors in brackets. The superscripts ***,
**, and * indicate statistical significance at the 1%, 5%, and 10% levels.
[1] [2] [3] [4] [5] [6] [7] [8] [9]dependent variable: Policy Policy Policy lnVega lnVega lnVega lnDelta lnDelta lnDelta
panel data treatment:
PooledNewey-West by
CEO
Newey-West by
CEO if no large M&A
pooledNewey-West by
CEO
Newey-West by
CEO if no large M&A
pooledNewey-West by
CEO
Newey-West by
CEO if no large M&A
Systematic Risk -3.294 -3.294 -3.294 1.783* 1.783 1.783
[2.335] [2.799] [2.711] [1.056] [1.478] [1.321]
lnVega 0.214*** 0.214** 0.214** 0.534*** 0.534** 0.534***
[0.067] [0.095] [0.084] [0.159] [0.245] [0.196]
lnDelta -0.091** -0.091* -0.091* -0.297 -0.297 -0.297
[0.038] [0.054] [0.048] [0.269] [0.370] [0.344]
Idiosyncratic Risk -179.012* -179.012 -179.012 100.862* 100.862 100.862
[107.672] [127.229] [122.664] [55.890] [75.873] [67.981]
lnVega 0.003*** 0.003** 0.003** 0.556*** 0.556** 0.556***
[0.001] [0.002] [0.001] [0.141] [0.217] [0.168]
lnDelta -0.001 -0.001 -0.001 -0.174 -0.174 -0.174
[0.001] [0.001] [0.001] [0.199] [0.292] [0.268]
Total Risk -206.125* -206.125 -206.125 117.507* 117.507 117.507
[123.131] [144.727] [139.383] [64.613] [86.518] [77.662]
lnVega 0.002*** 0.002* 0.002* 0.563*** 0.563*** 0.563***
[0.001] [0.001] [0.001] [0.139] [0.211] [0.164]
lnDelta -0.001 -0.001 -0.001 -0.139 -0.139 -0.139
[0.001] [0.001] [0.001] [0.193] [0.283] [0.259]
Noninterest 1.161 1.161 1.161 -1.870** -1.870 -1.870
[1.102] [1.687] [1.606] [0.939] [1.322] [1.219]
lnVega 0.100*** 0.100* 0.100** 0.830*** 0.830*** 0.830***
[0.037] [0.059] [0.049] [0.166] [0.261] [0.212]
lnDelta -0.093*** -0.093*** -0.093*** 0.094 0.094 0.094
[0.022] [0.034] [0.030] [0.221] [0.340] [0.323]
NoninterestLess 1.964 1.964 1.964 -3.215* -3.215 -3.215
[1.867] [2.873] [2.719] [1.737] [2.511] [2.278]
lnVega 0.080** 0.080 0.080** 0.882*** 0.882*** 0.882***
[0.032] [0.052] [0.040] [0.194] [0.307] [0.245]
lnDelta -0.062*** -0.062** -0.062** 0.110 0.110 0.110
[0.018] [0.027] [0.024] [0.231] [0.356] [0.335]
Private MBS -24.410** -24.410 -24.410 -10.241 -10.241 -10.241
[11.732] [17.956] [15.166] [8.266] [12.947] [10.787]
lnVega 0.034** 0.034 0.034* 0.937*** 0.937*** 0.937***
[0.014] [0.021] [0.019] [0.174] [0.246] [0.224]
lnDelta 0.007 0.007 0.007 0.378** 0.378 0.378*
[0.006] [0.010] [0.009] [0.161] [0.233] [0.196]
36
Commercial 9.927 9.927 9.927 -1.971 -1.971 -1.971
[14.317] [23.433] [21.684] [10.332] [16.321] [13.935]
lnVega 0.000 0.000 0.000 0.702*** 0.702 0.702*
[0.012] [0.018] [0.014] [0.270] [0.446] [0.375]
lnDelta -0.024*** -0.024* -0.024** 0.191 0.191 0.191
[0.009] [0.013] [0.010] [0.355] [0.572] [0.523]
Commercial RE 1.549 1.549 1.549 -0.301 -0.301 -0.301
[1.999] [3.308] [3.143] [1.589] [2.510] [2.148]
lnVega -0.057*** -0.057** -0.057** 0.730*** 0.730*** 0.730***
[0.018] [0.028] [0.025] [0.165] [0.276] [0.220]
lnDelta 0.044*** 0.044** 0.044*** -0.124 -0.124 -0.124
[0.011] [0.017] [0.016] [0.205] [0.327] [0.303]
Mortgage 16.592 16.592 16.592 -2.249 -2.249 -2.249
[34.599] [55.330] [45.676] [11.722] [18.482] [15.454]
lnVega -0.034** -0.034 -0.034* 0.676* 0.676 0.676
[0.016] [0.025] [0.021] [0.391] [0.636] [0.531]
lnDelta 0.010 0.010 0.010 -0.243 -0.243 -0.243
[0.011] [0.017] [0.014] [0.535] [0.839] [0.724]
Provisions 252.154 252.154 252.154 -124.676 -124.676 -124.676
[281.257] [468.991] [443.881] [335.712] [536.142] [474.621]
lnVega 0.001** 0.001 0.001* 0.804*** 0.804* 0.804**
[0.001] [0.001] [0.001] [0.303] [0.459] [0.383]
lnDelta -0.001** -0.001* -0.001** 0.134 0.134 0.134
[0.000] [0.000] [0.000] [0.255] [0.408] [0.385]
37
Table 6 Selected two-stage least squares parameters from flexible specifications of equations (1), (2) and (3) that include post-1999 intercept and slope parameters. Unbalanced data panel for 881 annual observations of 134 different
publicly traded U.S. banking companies from 1994-2006. Robust standard errors in brackets. The superscripts ***, **, and * indicate statistical significance at the 1%, 5%, and 10% levels. The asterisks in the shaded SUM cells
indicate whether the post-1999 influences of Policy, lnVega or lnDelta on the dependent variable were statistically significant.
[1] [2] [3] [1] [2] [3]
dependent variable: Policy lnVega lnDelta dependent variable: Policy lnVega lnDeltapanel data treatment: pooled pooled pooled
panel data treatment: pooled pooled pooled
Systematic Risk 0.162 2.096** Private MBS -18.229 -6.325[1.075] [0.828] [12.465] [6.994]
Post1999* -1.091 -1.560* Post1999* -26.775*** 1.441 Systematic Risk [1.064] [0.847] Private MBS [7.492] [5.253]SUM SUM ***lnVega 0.387*** 0.432** lnVega 0.026*** 0.763***
[0.070] [0.185] [0.008] [0.155]
Post1999*lnVega-
0.318*** 0.314*** Post1999*lnVega 0.002 0.186***[0.043] [0.092] [0.006] [0.059]
SUM *** SUM *** ***lnDelta -0.089** -0.250 lnDelta 0.007* 0.331**
[0.040] [0.161] [0.004] [0.145]Post1999*lnDelta 0.037 0.316** Post1999*lnDelta 0.006 0.394***
[0.048] [0.153] [0.007] [0.088]SUM SUM *** ***
Post1999 0.890*** 0.071 -0.200 Post1999-
0.050*** -0.750-
1.239***[0.165] [0.524] [0.557] [0.017] [0.497] [0.282]
Idiosyncratic Risk -85.980 182.852 Commercial -17.613** -0.894[179.030] [113.877] [6.865] [5.856]
Post1999*-
187.961*** -55.257 Post1999* 21.654*** 1.713 Idiosyncratic Risk [39.960] [38.591] Commercial [4.694] [3.921]SUM SUMlnVega 0.002 0.389 lnVega 0.018 0.659***
[0.001] [0.269] [0.016] [0.213]Post1999*lnVega 0.004*** 0.099 Post1999*lnVega -0.022* 0.137**
[0.001] [0.073] [0.012] [0.059]SUM *** *** SUM ***lnDelta 0.002*** -0.076 lnDelta -0.017 -0.260
[0.001] [0.142] [0.012] [0.187]
Post1999*lnDelta-
0.005*** 0.109 Post1999*lnDelta 0.002 0.199***[0.001] [0.078] [0.013] [0.077]
SUM *** SUMPost1999 0.007** 2.905*** 0.405 Post1999 0.066* -3.480*** -1.180*
[0.003] [0.793] [0.717] [0.039] [0.833] [0.622]Total Risk -112.185 172.404 Commercial RE -1.330 -1.615
[176.129] [114.070] [2.039] [2.121]
38
Post1999*-
163.326*** -50.604* Post1999* -0.800 3.134* Total Risk [36.681] [30.565] Commercial RE [1.983] [1.798]SUM SUM
lnVega 0.002* 0.343 lnVega-
0.076*** 0.563**[0.001] [0.279] [0.018] [0.263]
Post1999*lnVega 0.004*** 0.142** Post1999*lnVega-
0.040*** 0.291***[0.001] [0.058] [0.012] [0.107]
SUM *** *** SUM *** ***lnDelta 0.003*** -0.254* lnDelta 0.052*** -0.046
[0.001] [0.153] [0.011] [0.194]
Post1999*lnDelta-
0.006*** 0.266*** Post1999*lnDelta 0.009 0.168[0.001] [0.079] [0.014] [0.119]
SUM *** SUM ***
Post1999 0.015*** 2.252*** 0.188 Post1999 0.257*** 0.113-
2.018***[0.003] [0.719] [0.595] [0.043] [0.968] [0.681]
Noninterest 1.495 -0.773 Mortgage -10.422** -4.455[1.213] [0.971] [4.646] [3.970]
Post1999* -0.340 -1.929** Post1999* 11.783*** 7.017** Noninterest [0.964] [0.872] Mortgage [4.024] [3.327]SUM *** SUM
lnVega 0.110*** 0.668*** lnVega-
0.080*** 0.610**[0.032] [0.216] [0.023] [0.282]
Post1999*lnVega 0.066*** 0.304*** Post1999*lnVega 0.047*** 0.186***[0.021] [0.086] [0.016] [0.057]
SUM *** *** SUM ***
lnDelta-
0.087*** -0.001 lnDelta 0.042*** -0.051[0.019] [0.244] [0.016] [0.183]
Post1999*lnDelta -0.058** 0.232** Post1999*lnDelta -0.036** 0.284***[0.023] [0.109] [0.017] [0.084]
SUM *** SUM
Post1999 -0.006 -0.414-
0.974*** Post1999 0.056 -2.857***-
2.326***[0.067] [0.481] [0.306] [0.052] [1.031] [0.692]
NoninterestLess 0.956 -1.349 Provisions -376.939** 91.595[2.185] [1.748] [166.754] [152.508]
Post1999* 1.883 -2.974* Post1999*456.119**
* -180.611 NoninterestLess [1.492] [1.719] Provisions [153.564] [186.251]SUM *** SUMlnVega 0.060** 0.614*** lnVega 0.002*** 0.574**
[0.030] [0.224] [0.001] [0.223]Post1999*lnVega 0.048*** 0.335*** Post1999*lnVega 0.001*** 0.272**
[0.018] [0.121] [0.000] [0.128]SUM *** *** SUM *** ***lnDelta -0.036** 0.047 lnDelta 0.000 -0.156
39
[0.016] [0.243] [0.000] [0.177]
Post1999*lnDelta-
0.061*** 0.097 Post1999*lnDelta-
0.002*** -0.098[0.021] [0.117] [0.000] [0.129]
SUM *** SUM ***
Post1999 0.122* -0.127-
1.149*** Post1999 0.005*** 0.359-
0.998***[0.063] [0.521] [0.310] [0.001] [0.493] [0.317]
40
Figure 1
Mean CEO Compensation: Banks and Non-Banks
0
1,000
2,000
3,000
4,000
5,000
6,000
7,000
8,000
1994
1995
1996
1997
1998
1999
2000
2001
2002
2003
2004
2005
2006
$ th
ou
san
ds
banks
non-banks
Figure 2
Mean Vega: Banks and Non-Banks
0
50
100
150
200
250
300
350
1994
1995
1996
1997
1998
1999
2000
2001
2002
2003
2004
2005
2006
$ th
ou
san
ds
banks
non-banks
41
Figure 3
Mean Delta: Banks and Non-Banks
0
200
400
600
800
1,000
1,200
1994
1995
1996
1997
1998
1999
2000
2001
2002
2003
2004
2005
2006
$ th
ou
san
ds
banks
non-banks
Figure 4
Annual CEO stock and options grants as % of total CEO stock and options holdings (annual means)
0%
5%
10%
15%
20%
25%
30%
35%
1 2 3 4 5 6-10 11-15 16-20 20+
CEO tenure in years
42
Table A1
Variable definitions in alphabetical order*
Assets The ending balance of total assets.Commercial Commercial and industrial loans, scaled by total assets.Commercial RE Commercial real estate loans, scaled by total assets.Delta The pay-performance sensitivity, which is the change in the dollar value of CEO wealth
for a 1% change in stock price, measured by partial derivatives of Black-Scholes value of options and market value of stock holdings with respect to stock price.
EconCond
Defined differently across the ten versions of our model, but is always constructed from one of the following four different state-level data sources: the Federal Reserve Bank of Philadelphia’s Coincident Index of economic conditions for each state; the per-capita income for each state; and the payroll employment percentage for each state; and the ratio of non-core deposits to total deposits for each bank.
Equity Ratio Total equity capital over total assets at the beginning of the year.Idiosyncratic Risk The standard deviation of the three-factor market model residuals over a year.MB The ending balance of the market-to-book ratio of equity.Mortgage Loans Secured by 1–4 family residential properties, scaled by total assets.Noninterest Total noninterest income, scaled by net operating income.NoninterestLess Total noninterest income less fiduciary income and deposit service charges, scaled by
net operating income.Provisions Provision for loan and lease losses, scaled by total assets.Private MBS The fair value of private mortgage backed securities, scaled by total assets.Salary The CEO’s annual base salary.Systematic Risk The beta coefficient estimated from the three-factor market model over a year (The
three factors are daily returns on a CRSP value-weighted market portfolio, daily three-month T-bill yields, and daily treasury yield spreads (10-yeare T-bond minus 2-year T-note) obtained from the Federal Reserve Bank of St. Louis).
Tenure The number of years in the CEO’s term.Total Risk The standard deviation of daily stock returns over a year.Vega The pay-risk sensitivity, which is the change in the dollar value of CEO wealth for a
0.01 change in stock return volatility, measured by partial derivatives of Black-Scholes value of options with respect to stock return volatility.
*All dollar values are in thousands of 2006 dollars.
43

Table A2: Full Regression Results for Systematic Risk Estimated two-stage least squares parameters for equations (1), (2) and (3) using systematic risk as the dependent variable. Unbalanced data panel: 881
annual observations for 134 different publicly traded U.S. banking companies from 1994-2006. Robust standard errors in brackets. The superscripts ***, **, and * indicate statistical significance at the 1%, 5%, and 10% levels.
[1] [2] [3] [4] [5] [6] [7] [8] [9]
dependent variable: Policy Policy Policy lnVega lnVega lnVega lnDelta lnDelta lnDelta
panel data treatment: pooledNewey-West
by CEO
Newey-West by CEO if no large M&A
pooledNewey-West
by CEO
Newey-West by CEO if no large M&A
pooledNewey-West
by CEO
Newey-West by CEO if no large M&A
Systematic Risk -3.396 -3.396 -3.396 1.193 1.193 1.193[2.148] [2.544] [2.426] [0.742] [1.030] [0.893]
lnVega 0.286*** 0.286** 0.286*** 0.481*** 0.481** 0.481***[0.085] [0.122] [0.105] [0.143] [0.218] [0.174]
lnDelta -0.100** -0.1 -0.100* -0.429 -0.429 -0.429[0.045] [0.065] [0.055] [0.311] [0.425] [0.391]
lnAssets -0.081 -0.081 -0.081 0.822*** 0.822*** 0.822*** 0.119 0.119 0.119[0.052] [0.073] [0.063] [0.206] [0.254] [0.242] [0.096] [0.151] [0.112]
lnMB 0.176* 0.176 0.176 1.710* 1.71 1.71 0.959*** 0.959*** 0.959***[0.091] [0.122] [0.112] [0.934] [1.178] [1.089] [0.226] [0.321] [0.279]
Equity Ratio -1.748* -1.748 -1.748 4.984 4.984 4.984 -2.853 -2.853 -2.853[0.990] [1.326] [1.160] [3.823] [5.670] [5.300] [2.000] [2.739] [2.395]
EconCond 0.008*** 0.008*** 0.008***[0.002] [0.003] [0.003]
lnSalary 1.770*** 1.770** 1.770**[0.554] [0.776] [0.696]
Tenure 0.050*** 0.050*** 0.050***[0.005] [0.008] [0.007]
constant 0.812 0.812 0.812 -19.880*** -19.880*** -19.880*** -0.734 -0.734 -0.734[0.644] [0.944] [0.816] [4.510] [5.953] [5.454] [1.379] [2.105] [1.654]
Year dummies yes yes yes yes yes yes yes yes yesObservations 881 881 881 881 881 881 881 881 881Kleibergen-Paap test of under-identification
17.965*** 9.045*** 10.680*** 8.705*** 4.945** 5.942** 17.963*** 10.311*** 13.417***
44