executive brief - deloitte.com
TRANSCRIPT
Economic study into an Australian continuous launch small satellite program for Earth observation2021
Executive Brief
• The Australian Space Agency is developing the Earth Observations from Space Technology Roadmap (“the Roadmap”), in collaboration with Geoscience Australia (GA), the Bureau of Meteorology, Commonwealth Scientific and Industrial Research Organisation (CSIRO) and in close partnership with the broader Earth observation community.̀
• Deloitte Access Economics has been engaged by GA to support GA’s contribution to the Roadmap through a detailed economic study of Australia’s Earth observation (EO) sector. This study has:
1. Estimated the economic contribution of the EO sector and its benefits to end users of EO data across the Australian economy
2. Estimated the impact of a denial of service event (DOS) to the EO sector and end users of EO data
3. Estimated the potential economic impact of a hypothetical EO satellite program.
• In 2019-20, the Australian EO sector directly contributed $283 million in value added to the Australian economy and employed 1,570 FTEs. 1
• In addition, the sector generated benefits for end users of EO data of more than $2.5 billion. The largest benefits are to agriculture, mining, construction, and severe weather management.
– This estimate of the broader economic benefits of EO data is conservative. There is a large gap in the research on the use of, and benefit derived from, EO data by other industries.
• Australia’s EO sector, and the benefits EO data generates for other industries, is exposed to a significant sovereign supply risk: Australia does not own or operate any EO satellite systems. At the same time, the threat of a DOS event is becoming increasingly real, particularly in the context of Australia’s role in the Global Observing System (GOS).
• The annual economic cost of a DOS event for EO is estimated as follows.
– 81% of activity in the EO sector would almost immediately cease to exist as we know it. This equates to $226 million in lost (direct) value added.
– The Australian economy (GDP) would contract by $1.9 billion due to the disruption in activity by end users of EO data (based on currently available data).
• To ameliorate this risk of a DOS event, the Roadmap considers a hypothetical investment in Australia’s EO sector that will signal to the international community Australia’s intention to play a larger role in the GOS while also meeting broader strategic policy objectives to provide a sustainable investment pipeline to underpin innovation and growth in Australia’s space sector. Australia’s defence industry has also invested in precautionary measures through JP9102 and DEF799 to establish resilient satellite communications and Earth observation systems to reduce the industry’s exposure to a catastrophic DOS event.
• This hypothetical program considers an investment in the manufacture, launch and maintenance of a sovereign end-to-end EO satellite and cross-calibration data program at an annual cost of $36 million.
– This would stimulate activity in Australia’s space sector and its supply chain, increasing Australia’s GDP by $141 million in present value terms between 2023 and 2040.
– The hypothetical program has been designed to maximise opportunities for domestic space capability building, including specifically addressing the need for flight heritage, investment surety, on-project learning, local content, and an acceptance of risk (among others).
2
Economic study into an Australian continuous launch small satellite program for Earth observation
Acknowledgement
This report has been prepared by Deloitte Access Economics for Geoscience Australia to inform the development of the Australian Space Agency’s Earth Observations from Space Technology Roadmap.
Deloitte Access Economics would like to thank stakeholders in the Earth observation and space sectors who have provided their time and expertise in consultations.
In addition, Deloitte Access Economics would like to thank the following key supporting agencies for their assistance and cooperation:
Ian McLeodVice President, InternationalMDA
Professor Russell BoyceDirectorUNSW Space Canberra
Matthew AdamsManager, ImageryLandgate, WA
Rod SmithSTaR Shot Leader Resilient Multi-mission SpaceDepartment of Defence
Dr Matthew TetlowChief Executive OfficerInovor
Martin RowseStrategic Campaign LeadAirbus Australia
Professor Stuart PhinnDirectorEarth Observation Australia
Geoscience Australia The Australian Space Agency (ASA)
The Australian Bureau of Meteorology (BOM)
The Commonwealth Scientific and Industrial Research Organisation (CSIRO)
3
Economic study into an Australian continuous launch small satellite program for Earth observation
Contents
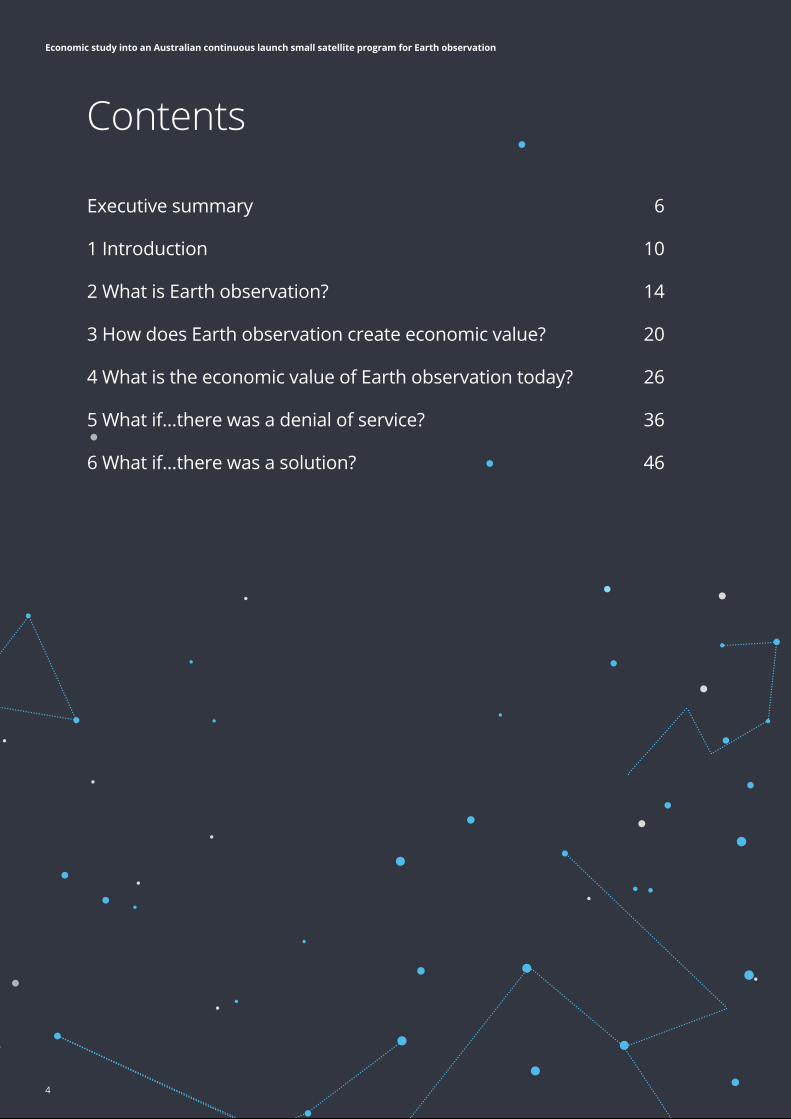
Executive summary 6
1 Introduction 10
2 What is Earth observation? 14
3 How does Earth observation create economic value? 20
4 What is the economic value of Earth observation today? 26
5 What if…there was a denial of service? 36
6 What if…there was a solution? 46
4
Economic study into an Australian continuous launch small satellite program for Earth observation
Appendix A Economic contribution methodology 59
Appendix B Broader economic benefits 63
Appendix C Denial of service methodology 74
Appendix D Hypothetical program methodology 75
Appendix E Government Earth observation programs 78
Appendix F The excludability and rivalry of Earth observation programs 80
Endnotes 82
Contact us 84
Limitation of our work 85
5

Executive summary
6
Economic study into an Australian continuous launch small satellite program for Earth observation
The wider Australian economy is now looking to the domestic space sector to have ownership of its capability and to build out critical parts of the value chain. And this is happening; the domestic sector has the capability to manufacture and launch Australian cube satellites with Australian payloads. However, if the sector is to meet its goals for growth and to become a globally competitive producer of small satellites, significant and ongoing investment is required.
A continuous launch small satellite program for Earth observation Geoscience Australia is currently investigating how a hypothetical continuous launch small satellite program for Earth observation can both mitigate Australia’s risk against an Earth observation data denial of service event and provide a sustainable investment stream to underpin growth in domestic satellite capability.
Historically, the Australian space sector has been a niche supplier in the global space ecosystem, trading on specific comparative advantages in research and development capabilities and world-renowned expertise. Where gaps in capability and infrastructure existed, Australia tapped into global supply chains to meet domestic needs. To date, this specialisation approach has worked well for the sector, allowing Australia to compete where we had the means and the know-how.
As the domestic space sector evolved, it embedded itself in the wider Australian economy, tailoring its unique applications and insights to the Australian environment. The data and knowledge sent down from space are now used for vital industry innovation, environmental management, critical services and research to help solve Australia’s most complex – and costly – problems. With the wider Australian economy strongly interconnected to the space sector and its many applications, the risk profile of space has changed.
As the sector looks to its next phase of development, this changing risk profile is key. Failure in supply – particularly of data supply – can have significant consequences not just for the space sector, but for the wider Australian economy.
Earth observation is a good case in point, and the purpose of this report. Earth observation data is essential for the delivery of critical services such as weather forecasting and emergency response, enhances economic productivity in key industries including agriculture and insurance, enables sustainable development within our environment, and supports the nation to deliver on its international commitments. However, despite the increasing reliance on Earth observation data for ‘mission critical’ activities, Australia remains exposed to a significant data supply risk – Australia does not own the satellite infrastructure that underpins Earth observation.
Australia is highly dependent on Earth observation data that is provided under open access arrangements by foreign government programs.
With Australia now seen as a “free rider”, the risk of a denial of service is significant, and the economic consequences of such an event grow, with
Australia’s ever-increasing reliance on Earth observation data.
It is in this context that Deloitte Access Economics was commissioned to:
• Estimate the current economic contribution of Australia’s Earth observation ecosystem
• Estimate the potential cost of Australia “free riding” in the Global Observing System by modelling the impact of an interruption to the supply of Earth observation data
• Estimate the economic impact of a hypothetical continuous launch small satellite program for Earth observation.
7
Economic study into an Australian continuous launch small satellite program for Earth observation
Alongside the direct economic contribution of the Earth observation sector is the significant value that the use and application of Earth observation data supports across the wider economy. Wider economic benefits are observed where users leverage analysis-ready data to improve and/or inform their products or process to derive economic value but are not wholly dependent on the data. The productivity improvements, avoided costs, improved policy and regulation and wider benefits in industries like agriculture, utilities and transport are currently sizeable and are only expected to increase over time.
The economic benefits attributable to Earth observation data were estimated to be in the order of $2.5 billion in 2020.
A denial of service event Despite the increasing reliance on Earth observation data for ‘mission critical’ activities, Australia remains exposed to a significant data supply risk. In 2014, more than 60 per cent of Australia’s public Earth observation programs relied on US satellites, with around a third of Earth observation programs relying on Landsat alone. At the same time, 25 per cent of Australia’s public Earth observation programs relied on satellite data provided by Europe, and 11 per cent relied on satellite data provided by Japan.2 Almost all of these programs rely on open access data agreements.3
The Earth observation ecosystem Earth observation involves the gathering of information about Earth’s physical, chemical and biological systems via remote sensing technologies. This information, collected with the use of satellites carrying imaging devices, is used to monitor, measure and understand the status of (and changes in) the natural and manmade environment.
The value of Earth observation is derived from the insights and understanding generated by the data. In Australia, the majority of Earth observation data is used by government (defence and civil) and researchers. Weather forecasting, disaster management, bushfire management and environmental management are examples of public sector uses of Earth observation data. In addition, there is an increasing number of industry uses supporting a small, but growing number of commercial value added resellers.
This report estimates the economic contribution of the Earth observation ecosystem. That is, the activity/program/function/business would cease to operate in its current form in the absence of Earth observation data – the core government agencies that depend on Earth observation data, the specific Earth observation programs across government and the commercial value added resellers of Earth observation data.
The Australian Earth observation sector directly contributed $283 million in value added to the Australian economy and employed 1,570 FTEs in 2020. This comprises $192 million from the core agencies, $13 million from the Earth observation programs, and $78 million from commercial organisations.
The Australian Earth observation sector directly contributed $283 million in value added to the Australian economy and
employed 1,570 FTEs in 2020. The economic benefits attributable to Earth observation data were estimated to be in the order of
$2.5 billion in 2020.
A denial of service event where all open access data used by the Australian EO sector is no longer available would result in an 81 per cent reduction in the value added by Earth observation in 2020. Further to the direct impact on the EO sector, a denial of service event would also impact end users in the broader economy. The extent to which end users would be impacted depends on their reliance on data products derived from open access data. A denial of service event where all open access data used by Australian end users is no longer available results in a $1.9 billion contraction in the Australian economy.
8
Economic study into an Australian continuous launch small satellite program for Earth observation
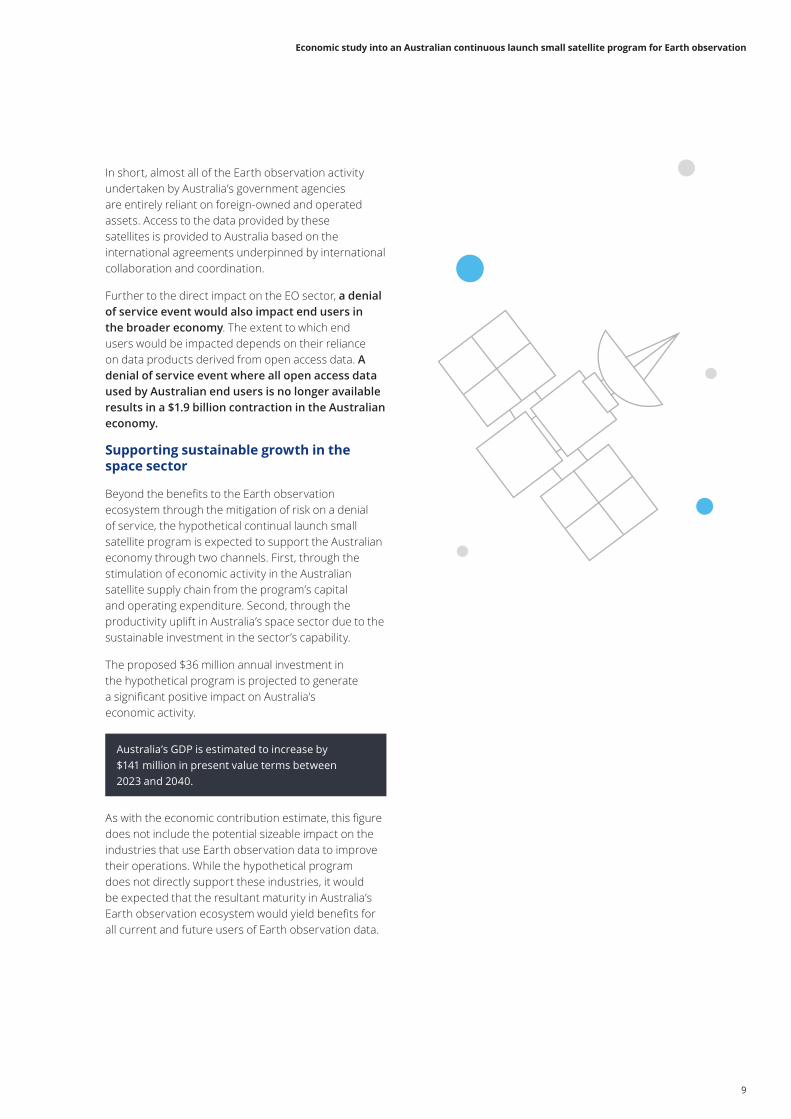
In short, almost all of the Earth observation activity undertaken by Australia’s government agencies are entirely reliant on foreign-owned and operated assets. Access to the data provided by these satellites is provided to Australia based on the international agreements underpinned by international collaboration and coordination.
Further to the direct impact on the EO sector, a denial of service event would also impact end users in the broader economy. The extent to which end users would be impacted depends on their reliance on data products derived from open access data. A denial of service event where all open access data used by Australian end users is no longer available results in a $1.9 billion contraction in the Australian economy.
Supporting sustainable growth in the space sector
Beyond the benefits to the Earth observation ecosystem through the mitigation of risk on a denial of service, the hypothetical continual launch small satellite program is expected to support the Australian economy through two channels. First, through the stimulation of economic activity in the Australian satellite supply chain from the program’s capital and operating expenditure. Second, through the productivity uplift in Australia’s space sector due to the sustainable investment in the sector’s capability.
The proposed $36 million annual investment in the hypothetical program is projected to generate a significant positive impact on Australia’s economic activity.
Australia’s GDP is estimated to increase by $141 million in present value terms between 2023 and 2040.
As with the economic contribution estimate, this figure does not include the potential sizeable impact on the industries that use Earth observation data to improve their operations. While the hypothetical program does not directly support these industries, it would be expected that the resultant maturity in Australia’s Earth observation ecosystem would yield benefits for all current and future users of Earth observation data.
9
Economic study into an Australian continuous launch small satellite program for Earth observation

1 Introduction
10
Economic study into an Australian continuous launch small satellite program for Earth observation
1.1 Australia’s Earth observation sectorAustralia’s Earth observation (EO) sector today is characterised by significant public sector investment and activity. Presently, Australia’s supply of EO data is derived entirely from internationally owned (public or private) satellite infrastructure. All satellite data used by the EO industry (with the exception of commercial organisations) is received from international partners, including China, Japan, Korea, United States, and Europe, who share the data freely and openly under World Meteorological Organization (WMO) Resolution 40.2 The coordination of this global system is one of the most ambitious forms of international collaboration.
Australian Government has formed several other partnerships through global Earth Observation networks. Namely, Geoscience Australia, CSIRO and the Bureau of Meteorology have a strong presence in the Group on Earth Observations (GEO), an intergovernmental organisation to improve the coordination of global EO systems. Australia also plays an active role in the Committee on Earth Observation Satellites (CEOS) through CSIRO.
The CSIRO Centre for Earth Observation also manages several bilateral agreements with the European Space Agency (ESA) and Centre National d’Etudes Spatiales (CNES). The CSIRO also leads Australia’s engagement with the Committee on Observation Satellites (CEOS), actively supported by Geoscience Australia. In addition, Geoscience Australia has a longstanding partnership with the United States Geological Survey (the GA-USGS), as well as other critical partnerships.
Historically, Australia has not owned satellite infrastructure due to the significant capital investment required to own and operate satellites. Until recently, limited upstream space capability (i.e. manufacturing and launch) existed in Australia, in terms of industry knowledge and expert personnel.
This study presents economic insights on the potential costs of “free riding” in the Global Observing System through modelling the impact of
an interruption to Earth observation data supply, as well as the economic impact of a continuous launch small satellite program for Earth observation.
Instead, Australia’s Earth observation capability is concentrated in services that add significant value to the satellite data supplied from foreign space agencies. Contributions include promoting the uptake of data developing Earth observation analytics as well as calibrating and validating data.
For example, Australia developed the Open Data Cube (ODC) to process petabytes of satellite EO data. ODC is an open source software project, which can be used to manage large volumes of raster data, including Earth observation data, initiated by Geoscience Australia and CSIRO. The ODC is also used to assist developing countries build capability in using earth observation data and analytics.
Providing analytical and data enhancing capability such as the ODC is one way in which Australia contributes to the global Earth observation system. Australia consciously ‘gives back’ to international space partners by providing in kind support to increase the value derived from their investment in infrastructure.
With major international space partners considering the commercialisation of Earth observation data, there is a question of whether Australia’s ‘in kind’ support is enough for Australia to continue to benefit from the investment made by Australia’s international space partners.
Going forward there is no guarantee that access to satellite data will continue in the long-term, posing a significant supply risk to the Australian EO sector.
11
Economic study into an Australian continuous launch small satellite program for Earth observation
What is less discussed is the intrinsic relationship between space and spatial data.4 Without access to space, provided by the Space Manufacturing and Space Operations sub-sectors, the EO sector would be unable to provide the wealth of data that drives productivity and improves our way of life in the modern economy.
For the Australian EO sector, this relationship between space and spatial data is underpinned by an international supply chain, facilitated by international collaboration and goodwill. Presently, the relationship between the Space Manufacturing and Space Operations sub-sectors of the Australian space economy and the Australian EO sector are either small (Space Manufacturing) or reliant on international space actors (Space Operations).
However, as the Australian Space Agency (ASA) looks to grow sovereign capability across the breadth of the supply chain, it is important to ensure that investments in the sector identify key economic interlinkages that are bounded by sustainable demand that could be leveraged to support activity and growth.
1.2 Earth observation and the space ecosystemAustralia’s space sector is largely made up of space application creators and enablers of space activities. . That is, most activity that occurs in the Australian space sector use space-derived resources (mostly EO data from satellites) to create applications for end users and enable space activity by providing access to launch facilities, undertaking research, and providing regulatory support.
Of the Australian 481 organisations that directly contribute to space-related economic activity, 38 per cent create space applications for end users, and 52 per cent enable space activity.3
The focus on less capital-intensive, downstream activity in the Australian space sector is largely driven by the significant demand for the activities that space infrastructure can provide. For example, satellite communications and direct-to-home television. The EO sector sits within the Space Applications sub-sector of the space value chain shown in Figure 1.1.
What is often spoken about with respect to the EO sector is its importance to critical services (such as weather forecasting and disaster management) and the extent to which it is likely to drive significant revenue for the Space Applications sub-sector as it evolves and diversifies into various non-space industrial segments.
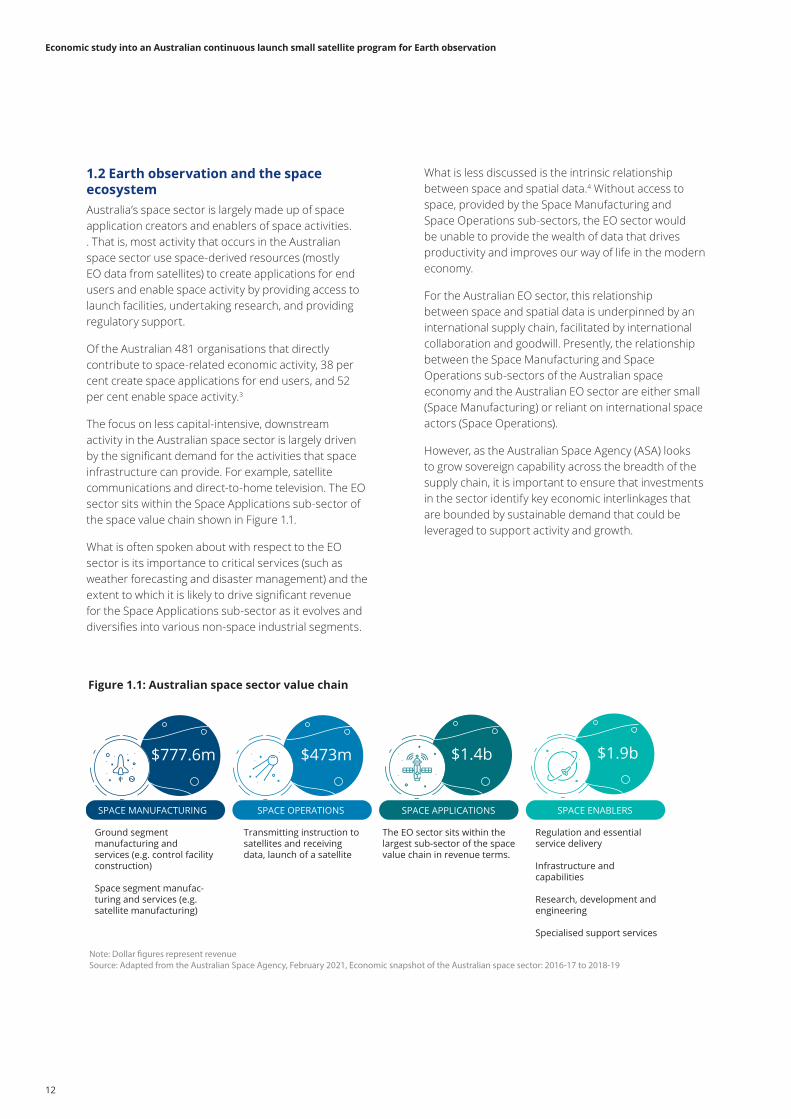
Figure 1.1: Australian space sector value chain
SPACE MANUFACTURING SPACE OPERATIONS SPACE APPLICATIONS SPACE ENABLERS
Ground segment manufacturing and services (e.g. control facility construction)
Space segment manufac-turing and services (e.g. satellite manufacturing)
Transmitting instruction to satellites and receiving data, launch of a satellite
The EO sector sits within the largest sub-sector of the space value chain in revenue terms.
Regulation and essential service delivery
Infrastructure and capabilities
Research, development and engineering
Specialised support services
$777.6m $473m $1.4b $1.9b
Note: Dollar �gures represent revenueSource: Adapted from the Australian Space Agency, February 2021, Economic snapshot of the Australian space sector: 2016-17 to 2018-19
12
Economic study into an Australian continuous launch small satellite program for Earth observation
1.3 This reportIt is in this context that Deloitte Access Economics was commissioned by Geoscience Australia to conduct an economic study of the EO sector to inform the development of the Roadmap.
This study presents economic insights on the potential costs of “free riding” in the Global Observing System by modelling the impact of an interruption to EO data supply, as well as the economic impact of a continuous launch small satellite program for EO.
Earth observation and its economic valueTo demonstrate the relationship between data, the EO sector and economic activity, this report has developed a framework that articulates the economic interlinkages that flow throughout the EO value chain. This framework is used to estimate the economic contribution of the Earth observation sector to the Australian economy.
A denial of service eventPresently, Australia’s supply of EO data is derived entirely from internationally owned (public or private) satellite infrastructure. To overcome this gap in ownership, Australia has relied on its strong international relationships and open data agreements. Access to data from foreign owned satellites depends on the capacity and goodwill of foreign governments and may not always be assured.
This section of the report analyses the impact of an event which results in Australia’s EO ecosystem (public and private users) losing access to all open access data.
A platform for growth (hypothetical continuous launch small satellite program)To demonstrate the potential economic impact that an Australian continuous launch small satellite program could have on the Australian space economy and the broader Australian economy, an economic impact analysis has been undertaken.
13
Economic study into an Australian continuous launch small satellite program for Earth observation
2 What is Earth observation?
14
Economic study into an Australian continuous launch small satellite program for Earth observation
Data from EO satellites provide public and private actors with insights which are then applied to areas such as:
• Weather forecasting • Wildlife conservation • Agriculture • Resource management • Natural disaster response • Climate science • Infrastructure • Urban planning • Financial services.
2.2 Seeing beyond the visibleOver the last 40 years, remote sensing technology has allowed us to see beyond the visible, transforming the way in which we are able to process and understand the world around us.
Remote sensing is the acquiring of information from a distance.7 Having evolved from the interpretation of aerial photographs to the analysis of satellite imagery, advances in sensor system technologies and digital computing mean that today remote sensor systems can provide data from energy emitted, reflected, and/or transmitted from all parts of the electromagnetic spectrum.8
Not all sensors are created equal, differing in sensor type, sensitivity, resolution, and temporality, requiring users to make a trade-off between one or all these characteristics depending on the intended use of EO data.
Earth observation data helps us to do what we are doing now, better; to answer questions and provide solutions.
2.1 The big pictureThe use of EO data has been an important feature in our economy for decades. Government and private sector organisations have been utilising the insights transferred from remote sensing technology for decades to understand, educate, inform, and manage the world around us. Today, there are 6,000 satellites in orbit. Approximately 40 per cent considered to be operational, and 446 are used for Earth observation purposes.5
EO involves the gathering of information about Earth’s physical, chemical and biological systems via remote sensing technologies. This information, collected with the use of satellites carrying imaging devices, is used to monitor, measure and understand the status of, and changes in, the natural and manmade environment. The recent Bushfire Earth Observation Taskforce report defined Earth observation as follows:
[Earth observation] encompasses a broad suite of activities that gather observations and produce measurements and spatial data to monitor and examine our planet, its environments, human activities, and infrastructure. EO data is collected at a range of scales from centimetres to kilometres, throughout all environments – built, natural, and managed.6
The EO sector has been a focal point not only of the space industry, but for scientific and economic development. Initially underpinned by a strong public sector contribution and interest (particularly driven by defence and security interests), there is now a significant and growing commercial EO satellite and data industry.
15
Economic study into an Australian continuous launch small satellite program for Earth observation
ResolutionThe choice of orbit will also impact the quality of the image – naturally, the further away from Earth, the less detail the image will provide. For example, a high spatial resolution will be difficult to obtain from a geostationary satellite in high orbit (approximately 36,000km above Earth).
There are four resolutions which reflect the quality of the image:
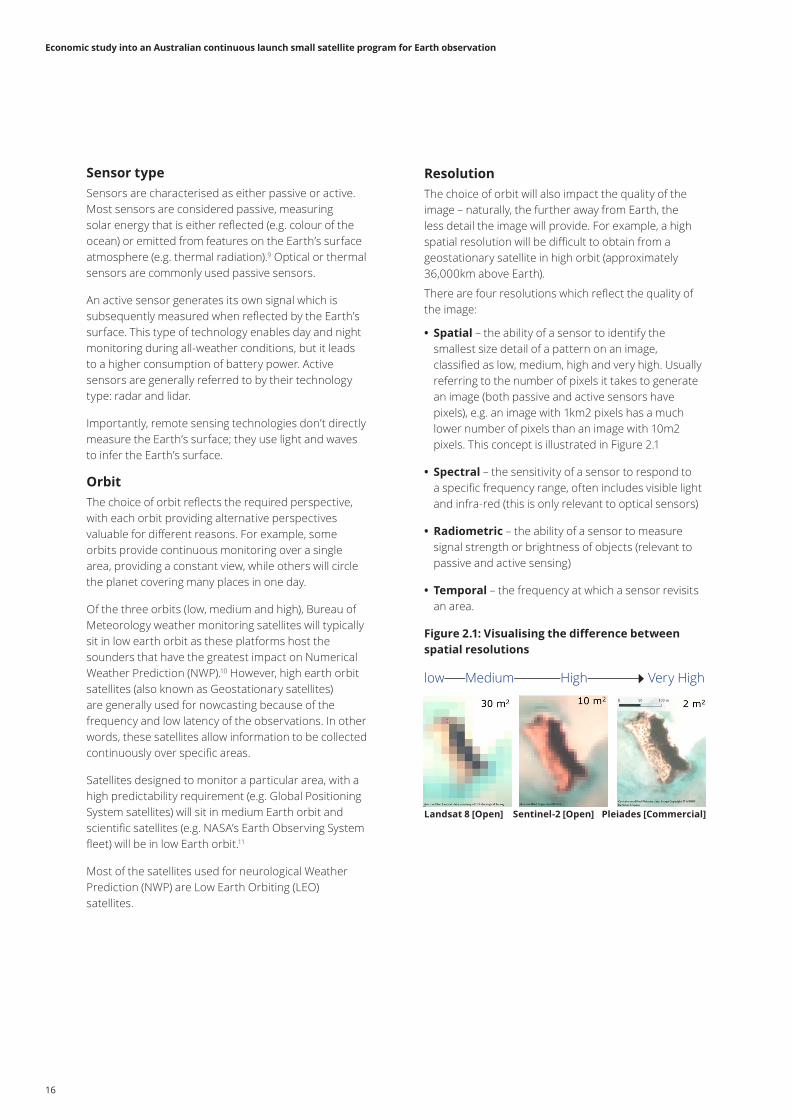
• Spatial – the ability of a sensor to identify the smallest size detail of a pattern on an image, classified as low, medium, high and very high. Usually referring to the number of pixels it takes to generate an image (both passive and active sensors have pixels), e.g. an image with 1km2 pixels has a much lower number of pixels than an image with 10m2 pixels. This concept is illustrated in Figure 2.1
• Spectral – the sensitivity of a sensor to respond to a specific frequency range, often includes visible light and infra-red (this is only relevant to optical sensors)
• Radiometric – the ability of a sensor to measure signal strength or brightness of objects (relevant to passive and active sensing)
• Temporal – the frequency at which a sensor revisits an area.
Figure 2.1: Visualising the difference between spatial resolutions
Sensor typeSensors are characterised as either passive or active. Most sensors are considered passive, measuring solar energy that is either reflected (e.g. colour of the ocean) or emitted from features on the Earth’s surface atmosphere (e.g. thermal radiation).9 Optical or thermal sensors are commonly used passive sensors.
An active sensor generates its own signal which is subsequently measured when reflected by the Earth’s surface. This type of technology enables day and night monitoring during all-weather conditions, but it leads to a higher consumption of battery power. Active sensors are generally referred to by their technology type: radar and lidar.
Importantly, remote sensing technologies don’t directly measure the Earth’s surface; they use light and waves to infer the Earth’s surface.
OrbitThe choice of orbit reflects the required perspective, with each orbit providing alternative perspectives valuable for different reasons. For example, some orbits provide continuous monitoring over a single area, providing a constant view, while others will circle the planet covering many places in one day.
Of the three orbits (low, medium and high), Bureau of Meteorology weather monitoring satellites will typically sit in low earth orbit as these platforms host the sounders that have the greatest impact on Numerical Weather Prediction (NWP).10 However, high earth orbit satellites (also known as Geostationary satellites) are generally used for nowcasting because of the frequency and low latency of the observations. In other words, these satellites allow information to be collected continuously over specific areas.
Satellites designed to monitor a particular area, with a high predictability requirement (e.g. Global Positioning System satellites) will sit in medium Earth orbit and scientific satellites (e.g. NASA’s Earth Observing System fleet) will be in low Earth orbit.11
Most of the satellites used for neurological Weather Prediction (NWP) are Low Earth Orbiting (LEO) satellites.
low Medium High Very High
Landsat 8 [Open] Sentinel-2 [Open] Pleiades [Commercial]
16
Economic study into an Australian continuous launch small satellite program for Earth observation
The GOS consists of observing facilities on land, sea, air and space observation systems that are owned by the Member countries of the WMO. Member countries provide observations of the state of the atmosphere and ocean surface for the preparation of weather analyses, forecasts, advisories, and warnings for climate monitoring and environmental activities.
Moreover, Australia has several individual partnerships with international space agencies to secure additional satellite data that are not part of the GOS. For example, the Copernicus Australasia Regional Data Hub, in partnership with the several Australian government agencies,16 provides free and open access to Sentinel Satellite data. Australia has also participated in the Landsat program for over 40 years, partnering with NASA and the United States Geological Survey who provide Australia with access to critical Landsat satellite data in exchange for the development of critical ground facilities required to process the data.
Australia has also entered into a $10.45 million agreement over seven years to operate a share of NOVASAR-1, developed by the Surrey Satellite Technology Limited (SSTL) in the UK. The SAR technology, which operates in all weather conditions, will enable Australian researchers with the opportunity to task the satellite to acquire imagery for research and development purposes.
2.3 An industry underpinned by global collaborationEO is a unique industry – with traditionally high set-up costs and very low marginal (additional) costs to sharing the benefits of EO data. A single satellite program can cost up to $12 billion depending on the size of the satellite, and requires highly experienced personnel to develop the satellite technology.13 The large capital and operational costs present significant barriers to entry for commercial entrants. For this reason, the production and funding of EO data – that is the design and launch of multisensory platforms – is concentrated in large, publicly funded national space organisations such as NASA and the European Space Agency (ESA).
Even though the initial capital costs are high, the EO sector produces important benefits to third parties (discussed in Section 4.3) at almost no additional cost to global space agencies.
These conditions provide the grounds for international collaboration. The World Meteorological Organisation (WMO), established in 1950, underpins this collaborative environment.14 The WMO is responsible for the establishment of the World Weather Watch Programme (WWW, 1963) which includes the Global Observing System (GOS), the Global Telecommunication System (GTS) and the Global Data-processing and Forecasting System (GDPFS), all of which are all operated by its members.15
17
Economic study into an Australian continuous launch small satellite program for Earth observation
Australia’s role in the Global Observing System (GOS)
Australia actively participates in three international Earth observation organisations: The Group on Earth Observations (GEO), The Committee on Earth Observation Satellites (CEOS) and the World Meteorological Organisation (WMO).
The Group on Earth Observations (GEO) is an intergovernmental organisation working to improve and coordinate global EO systems and promote broad, open data sharing. GEO consists of 105 member countries and 127 participating organisations. Geoscience Australia currently leads Australia’s engagement in this forum and was the GEO Executive Committee member in 2018. As vice-Chair of CEOS Strategic Implementation Team, CSIRO is also a member on the GEO Executive Committee, as well as a member of the GEO Global Agricultural Monitoring Advisory Committee.
The Committee on Earth Observation Satellites (CEOS) is an international organisation involving 60 agencies operating 156 satellites and aims to ensure the international coordination of civil space-based EO programs, and advocacy of the free and open exchange of data. CSIRO is an active member of CEOS and leads Australia’s engagement in this forum, that includes the widest global membership of civilian government EO satellite agencies.
Australia participates in the formal framework of the constituent bodies, especially the WMO Congress, Executive Council, Regional Association V (South-West Pacific) and all eight Technical Commissions. The Director of Meteorology is the Permanent Representative of Australia with WMO, responsible for the overall coordination of Australian participation in WMO programmes and activities.
The Bureau participates in WMO’s World Weather Watch Programme through the operation of one of the three World Meteorological Centres in Melbourne, Regional Specialised Meteorological Centres in Melbourne and Darwin, and a Regional Instruments Centre of Regional Association V (for South-West Pacific). The Bureau is also a major hub of the WMO Global Telecommunication System, a vital element of the World Weather Watch Programme.
Australia support the Intergovernmental Oceanographic Commission (IOC) and the World Meteorological Organisation (WMO) in several ways, including through major contributions to the Global Ocean Observing System (GOOS) and the Joint WMO/IOC Technical Commission for Oceanography and Marine Meteorology (JCOMM). JCOMM is an intergovernmental body of experts that provides the mechanism for international coordination, regulation and management of oceanographic and marine meteorological observing, data management and services systems.
18
Economic study into an Australian continuous launch small satellite program for Earth observation

19
3 How does Earth observation create economic value?
20
Economic study into an Australian continuous launch small satellite program for Earth observation
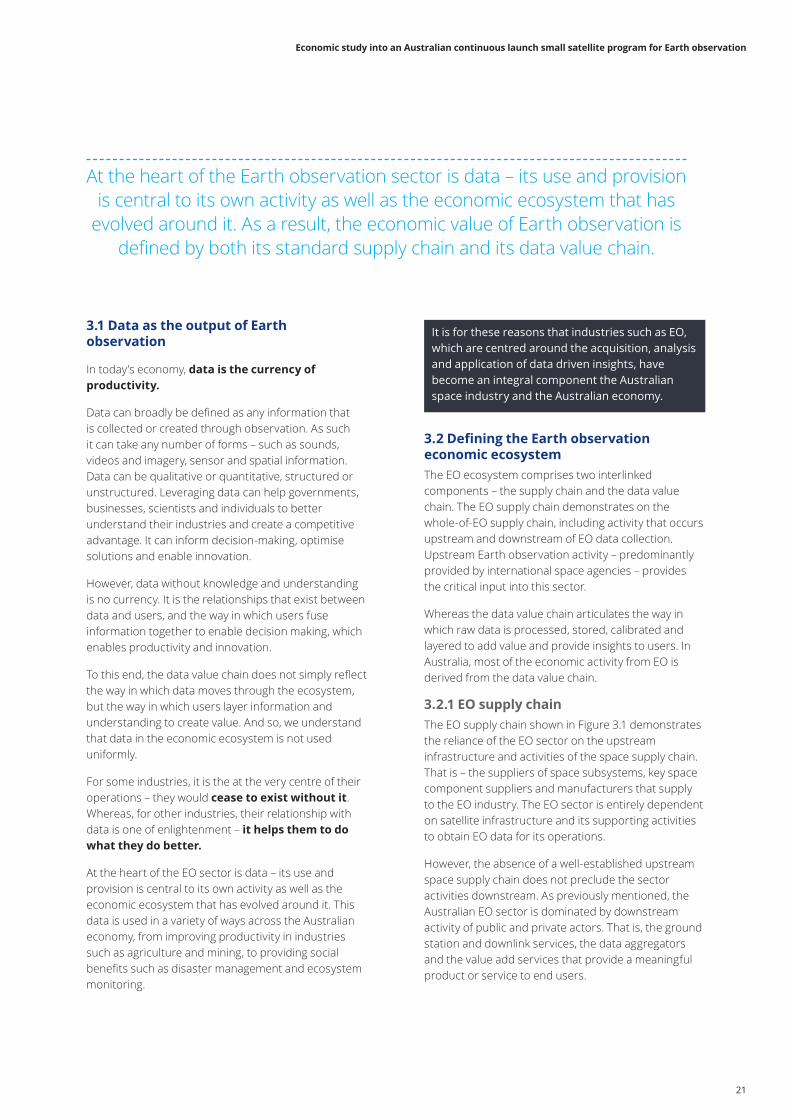
It is for these reasons that industries such as EO, which are centred around the acquisition, analysis and application of data driven insights, have become an integral component the Australian space industry and the Australian economy.
At the heart of the Earth observation sector is data – its use and provision is central to its own activity as well as the economic ecosystem that has
evolved around it. As a result, the economic value of Earth observation is defined by both its standard supply chain and its data value chain.
3.1 Data as the output of Earth observation
In today’s economy, data is the currency of productivity.
Data can broadly be defined as any information that is collected or created through observation. As such it can take any number of forms – such as sounds, videos and imagery, sensor and spatial information. Data can be qualitative or quantitative, structured or unstructured. Leveraging data can help governments, businesses, scientists and individuals to better understand their industries and create a competitive advantage. It can inform decision-making, optimise solutions and enable innovation.
However, data without knowledge and understanding is no currency. It is the relationships that exist between data and users, and the way in which users fuse information together to enable decision making, which enables productivity and innovation.
To this end, the data value chain does not simply reflect the way in which data moves through the ecosystem, but the way in which users layer information and understanding to create value. And so, we understand that data in the economic ecosystem is not used uniformly.
For some industries, it is the at the very centre of their operations – they would cease to exist without it. Whereas, for other industries, their relationship with data is one of enlightenment – it helps them to do what they do better.
At the heart of the EO sector is data – its use and provision is central to its own activity as well as the economic ecosystem that has evolved around it. This data is used in a variety of ways across the Australian economy, from improving productivity in industries such as agriculture and mining, to providing social benefits such as disaster management and ecosystem monitoring.
3.2 Defining the Earth observation economic ecosystemThe EO ecosystem comprises two interlinked components – the supply chain and the data value chain. The EO supply chain demonstrates on the whole-of-EO supply chain, including activity that occurs upstream and downstream of EO data collection. Upstream Earth observation activity – predominantly provided by international space agencies – provides the critical input into this sector.
Whereas the data value chain articulates the way in which raw data is processed, stored, calibrated and layered to add value and provide insights to users. In Australia, most of the economic activity from EO is derived from the data value chain.
3.2.1 EO supply chainThe EO supply chain shown in Figure 3.1 demonstrates the reliance of the EO sector on the upstream infrastructure and activities of the space supply chain. That is – the suppliers of space subsystems, key space component suppliers and manufacturers that supply to the EO industry. The EO sector is entirely dependent on satellite infrastructure and its supporting activities to obtain EO data for its operations.
However, the absence of a well-established upstream space supply chain does not preclude the sector activities downstream. As previously mentioned, the Australian EO sector is dominated by downstream activity of public and private actors. That is, the ground station and downlink services, the data aggregators and the value add services that provide a meaningful product or service to end users.
21
Economic study into an Australian continuous launch small satellite program for Earth observation
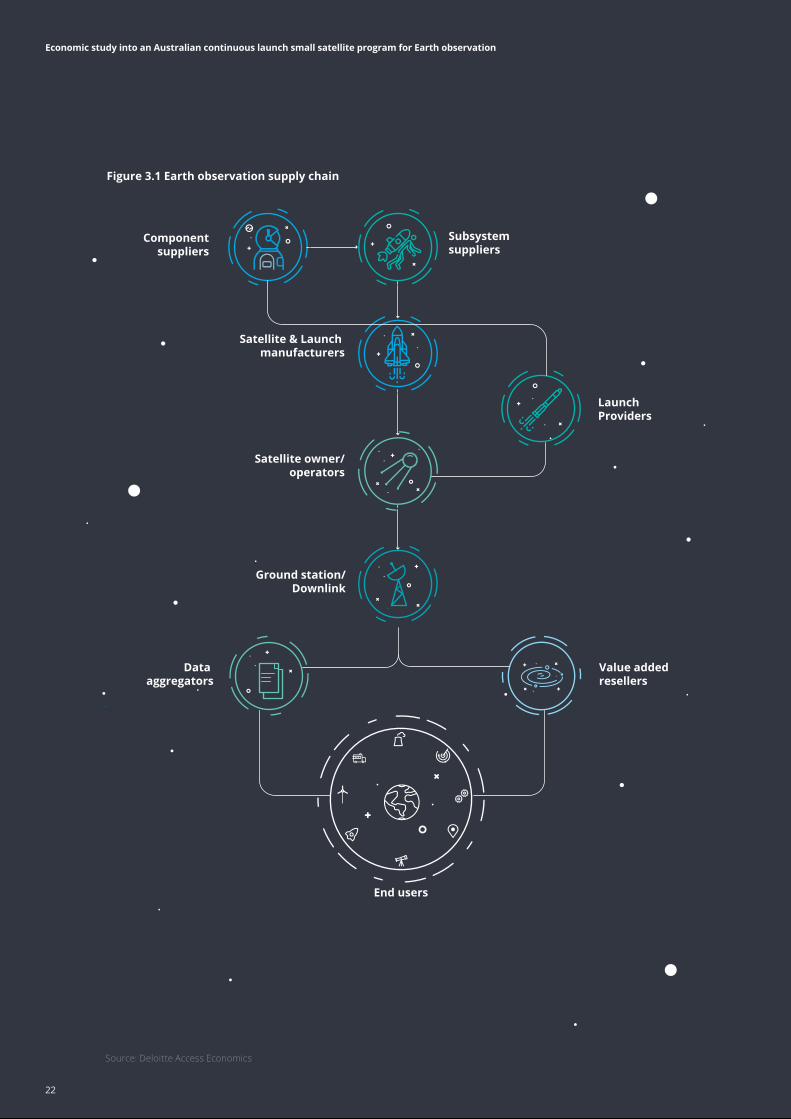
Figure 3.1 Earth observation supply chain
Componentsuppliers
Subsystemsuppliers
Launch Providers
End users
Value added resellers
Satellite & Launch manufacturers
Satellite owner/operators
Ground station/Downlink
Data aggregators
Source: Deloitte Access Economics
22
Economic study into an Australian continuous launch small satellite program for Earth observation

Figure 3.2: The Earth observation data value chain
Owning/operating satellite assets
Operating satellite ground station
Data storage Turning satellite images into meaningful
insights
Customising insights for distribution
TailoringAnalysisStorageRetrievalCollection
Source: Deloitte Access Economics
Australia has already begun investing in initiatives to assist with the storage, management and processing of big EO data. The Open Data Cube (ODC), managed by the ODC Steering Council and is an OSGeo Community Project, provides one of seven core global systems for organising and analysing large volumes of EO data. A study by Gomes, Queiroz and Ferreira (2020) assessed the performance of seven global EO data storage against ten evaluation criteria that assess platforms’ ability to manage and access data. The ODC performed well against other data management approaches, achieving six ‘high’ ratings – the most out of all platforms assessed.19
Analysis and tailoring are the final stages of the value chain and involves the transformation of EO data into useful analytics and imagery.
3.2.2 Earth observation data value chainThe data value chain interlinks with the EO supply chain at the satellite owner/operator supply chain component. At the collection stage of the data value chain, satellite owners – none of which are Australian – manufacture, maintain and operate satellite assets. Data is then retrieved at ground stations in Australia and around the world.
Australia has invested in building ground station capability. Our weather conditions (e.g. the number of clear skies exceeding 250 days in Alice Springs and remote parts of Australia) present a great advantage for ground station activity. Australia is continuing to invest in this capability, for example, Australia’s first Indigenous ground station came online in 2020 based in Alice Springs.17 The station is one of nine Earth observation ground stations managed by the Australian National Ground Segment Technical Team (ANGSTT) and is part of a global network of ground stations operated by European agency, ViaSat.
The Australian EO sector has also heavily invested in improving the storage and management of EO data. Businesses and public agencies collect data points at all times, from an ever-increasing number of sensors that are connected all over our planet.18 This rapid increase in data volume and diversity means that enormous amounts of raw data need to be processes and made available in order to be used by industry. EO storage, management, processing and analytics is an ever-increasing component of the data value chain.
23
Economic study into an Australian continuous launch small satellite program for Earth observation
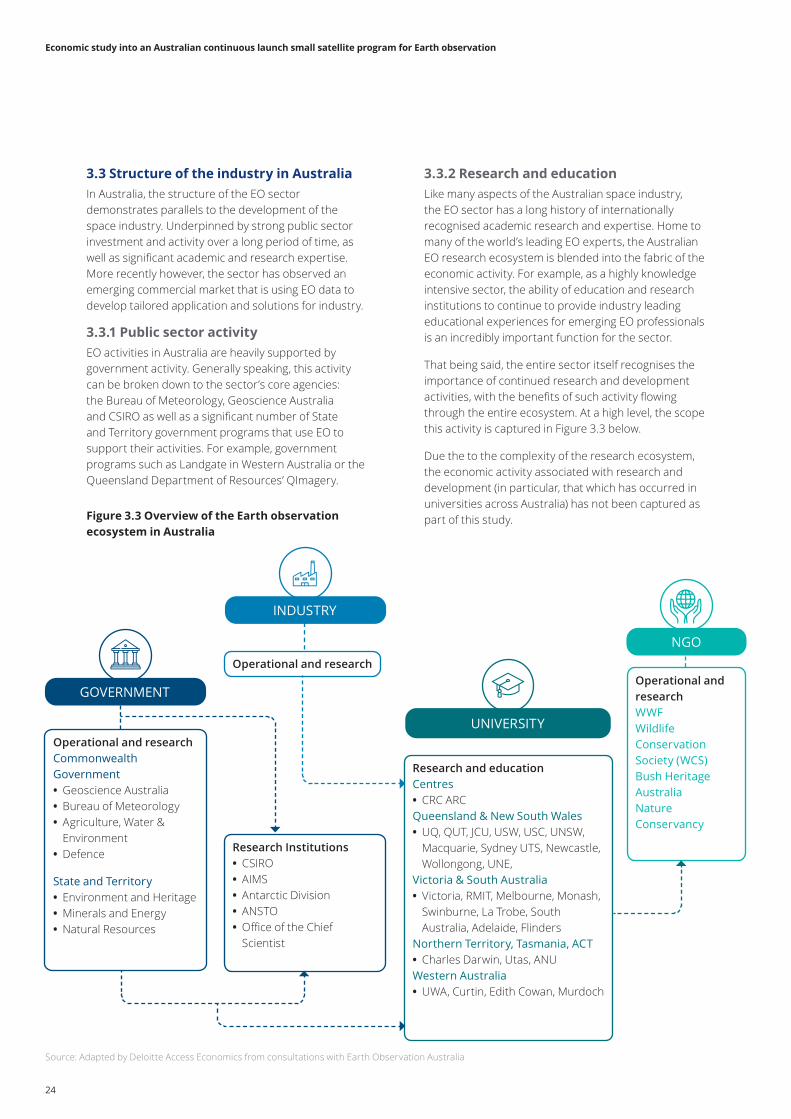
3.3.2 Research and educationLike many aspects of the Australian space industry, the EO sector has a long history of internationally recognised academic research and expertise. Home to many of the world’s leading EO experts, the Australian EO research ecosystem is blended into the fabric of the economic activity. For example, as a highly knowledge intensive sector, the ability of education and research institutions to continue to provide industry leading educational experiences for emerging EO professionals is an incredibly important function for the sector.
That being said, the entire sector itself recognises the importance of continued research and development activities, with the benefits of such activity flowing through the entire ecosystem. At a high level, the scope this activity is captured in Figure 3.3 below.
Due the to the complexity of the research ecosystem, the economic activity associated with research and development (in particular, that which has occurred in universities across Australia) has not been captured as part of this study.
3.3 Structure of the industry in AustraliaIn Australia, the structure of the EO sector demonstrates parallels to the development of the space industry. Underpinned by strong public sector investment and activity over a long period of time, as well as significant academic and research expertise. More recently however, the sector has observed an emerging commercial market that is using EO data to develop tailored application and solutions for industry.
3.3.1 Public sector activityEO activities in Australia are heavily supported by government activity. Generally speaking, this activity can be broken down to the sector’s core agencies: the Bureau of Meteorology, Geoscience Australia and CSIRO as well as a significant number of State and Territory government programs that use EO to support their activities. For example, government programs such as Landgate in Western Australia or the Queensland Department of Resources’ QImagery.
GOVERNMENT
INDUSTRY
UNIVERSITY
NGO
Operational and research Commonwealth Government • Geoscience Australia • Bureau of Meteorology • Agriculture, Water & Environment
• Defence
State and Territory • Environment and Heritage • Minerals and Energy • Natural Resources
Research and educationCentres • CRC ARC
Queensland & New South Wales • UQ, QUT, JCU, USW, USC, UNSW, Macquarie, Sydney UTS, Newcastle, Wollongong, UNE,
Victoria & South Australia • Victoria, RMIT, Melbourne, Monash, Swinburne, La Trobe, South Australia, Adelaide, Flinders
Northern Territory, Tasmania, ACT • Charles Darwin, Utas, ANU
Western Australia • UWA, Curtin, Edith Cowan, Murdoch
Research Institutions • CSIRO • AIMS • Antarctic Division • ANSTO • Office of the Chief Scientist
Operational and researchWWF Wildlife ConservationSociety (WCS)Bush Heritage Australia Nature Conservancy
Operational and research
Source: Adapted by Deloitte Access Economics from consultations with Earth Observation Australia
Figure 3.3 Overview of the Earth observation ecosystem in Australia
24
Economic study into an Australian continuous launch small satellite program for Earth observation
Commercial organisations have become the crucial link between the data and end users. To deliver these insights, organisations will often use a combination of open access data (leveraging the benefits of historical data sources) as well as tailored high-resolution data from commercial satellite operators (such as Amazon, Google, Maxar or Planet). For example, organisations are being engaged to provide insights including:
• The use of satellite imagery to track and locate small vessels
• Monitor and validate rehabilitation processes through a combination of climate and timeseries data
• AI crop monitoring to address seed production challenges
• The use of Australia’s archival satellite imagery data to draw every field boundary in Australia using machine learning algorithms to define the edge of paddocks.
The greatest value of EO data in the future will be driven by the use of its applications across the economy. Private sector organisations will be key to unlocking this through the identification of where and how EO data can benefit other sectors, as well as the development of tailored and timely solutions.
3.3.3 Private sector activityCommercial activity in the EO sector in Australia is an innovative area that has demonstrated significant capability and potential for growth. These organisations are comprised of highly skilled knowledge workers, typically targeting niche areas of the economy to provide tailored solutions to industry. Commercial organisations range from those that consume satellite data directly to those that transform the processed data into applications for end users.
Over the past 5 years, commercial business models have undergone substantial change. A reduction in the need for large processing power, and the significant costs that accompany it, led to a change in cost structure that increased market access for smaller and more niche organisations. Today, the commercial sector is focussed heavily on delivering value to end users through the processing and tailoring of EO data to suit the needs of the wider economy. Often, this means that organisations will lean into specific sectors, building capability in understanding the unique needs of the industry and developing a tailored suite of products. This is most evident in the agriculture, mining and financial industries.
25
Economic study into an Australian continuous launch small satellite program for Earth observation
4 What is the economic value of Earth observation today?
26
Economic study into an Australian continuous launch small satellite program for Earth observation
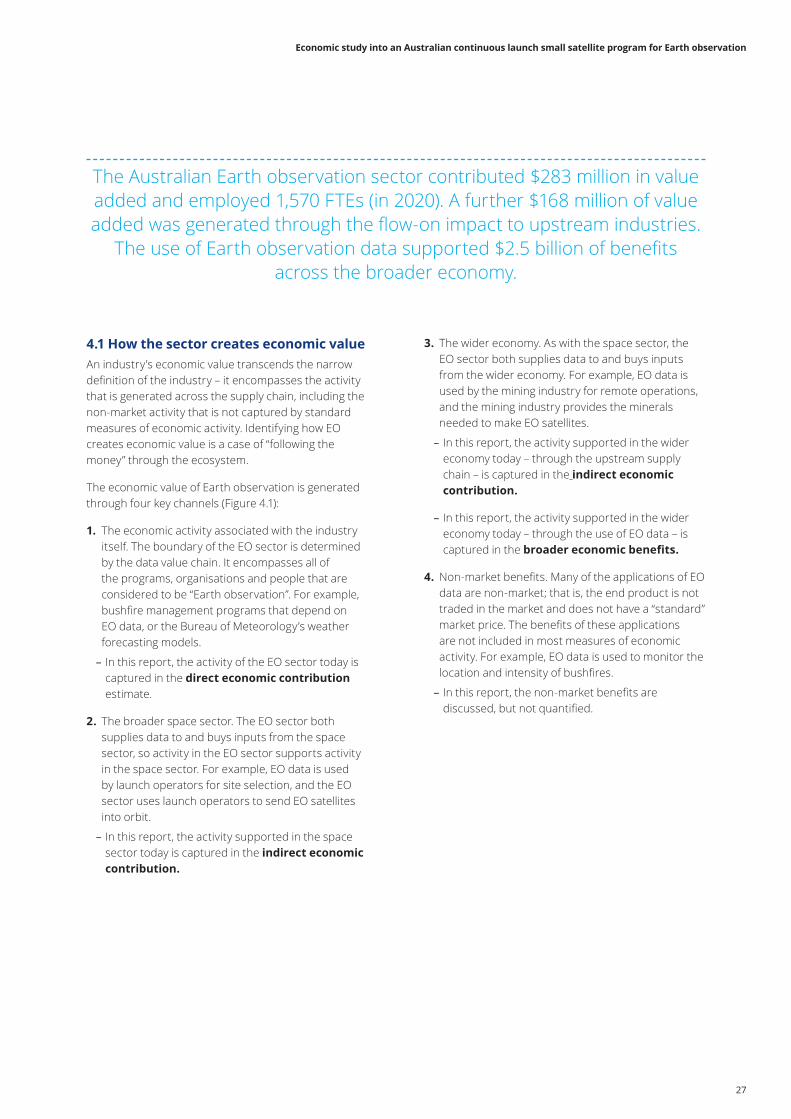
3. The wider economy. As with the space sector, the EO sector both supplies data to and buys inputs from the wider economy. For example, EO data is used by the mining industry for remote operations, and the mining industry provides the minerals needed to make EO satellites.
– In this report, the activity supported in the wider economy today – through the upstream supply chain – is captured in the indirect economic contribution.
– In this report, the activity supported in the wider economy today – through the use of EO data – is captured in the broader economic benefits.
4. Non-market benefits. Many of the applications of EO data are non-market; that is, the end product is not traded in the market and does not have a “standard” market price. The benefits of these applications are not included in most measures of economic activity. For example, EO data is used to monitor the location and intensity of bushfires.
– In this report, the non-market benefits are discussed, but not quantified.
The Australian Earth observation sector contributed $283 million in value added and employed 1,570 FTEs (in 2020). A further $168 million of value added was generated through the flow-on impact to upstream industries.
The use of Earth observation data supported $2.5 billion of benefits across the broader economy.
4.1 How the sector creates economic valueAn industry’s economic value transcends the narrow definition of the industry – it encompasses the activity that is generated across the supply chain, including the non-market activity that is not captured by standard measures of economic activity. Identifying how EO creates economic value is a case of “following the money” through the ecosystem.
The economic value of Earth observation is generated through four key channels (Figure 4.1):
1. The economic activity associated with the industry itself. The boundary of the EO sector is determined by the data value chain. It encompasses all of the programs, organisations and people that are considered to be “Earth observation”. For example, bushfire management programs that depend on EO data, or the Bureau of Meteorology’s weather forecasting models.
– In this report, the activity of the EO sector today is captured in the direct economic contribution estimate.
2. The broader space sector. The EO sector both supplies data to and buys inputs from the space sector, so activity in the EO sector supports activity in the space sector. For example, EO data is used by launch operators for site selection, and the EO sector uses launch operators to send EO satellites into orbit.
– In this report, the activity supported in the space sector today is captured in the indirect economic contribution.
27
Economic study into an Australian continuous launch small satellite program for Earth observation
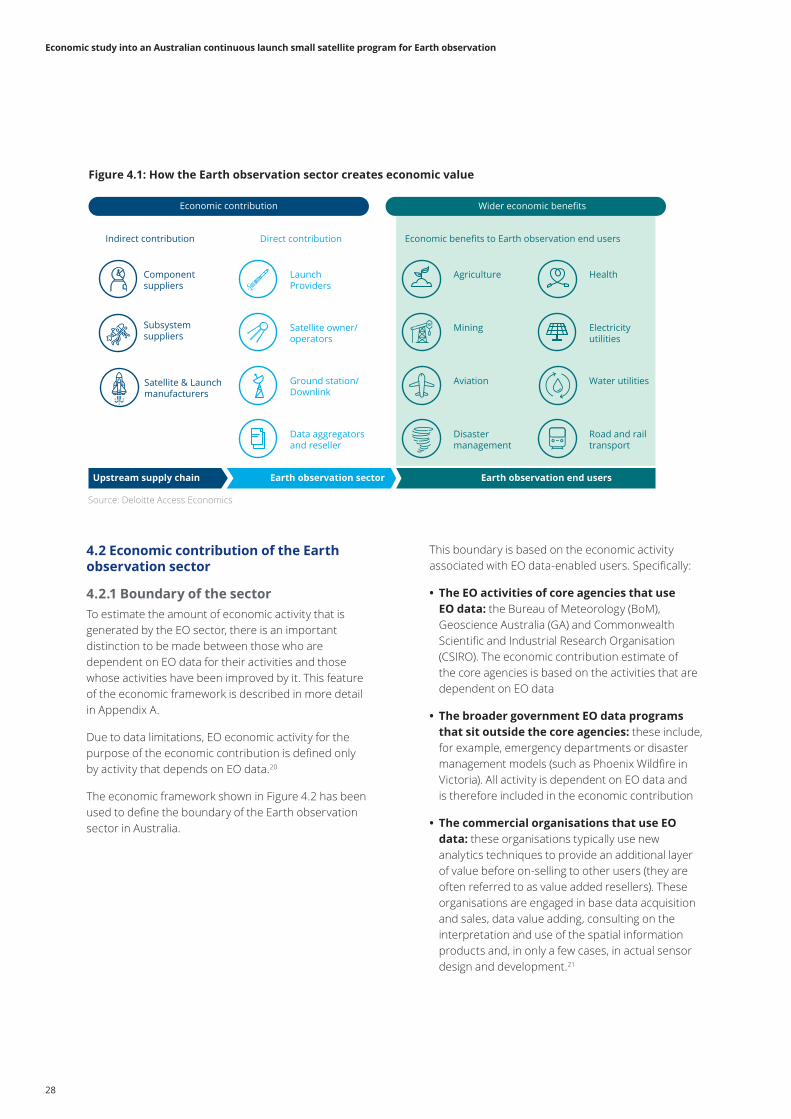
This boundary is based on the economic activity associated with EO data-enabled users. Specifically:
• The EO activities of core agencies that use EO data: the Bureau of Meteorology (BoM), Geoscience Australia (GA) and Commonwealth Scientific and Industrial Research Organisation (CSIRO). The economic contribution estimate of the core agencies is based on the activities that are dependent on EO data
• The broader government EO data programs that sit outside the core agencies: these include, for example, emergency departments or disaster management models (such as Phoenix Wildfire in Victoria). All activity is dependent on EO data and is therefore included in the economic contribution
• The commercial organisations that use EO data: these organisations typically use new analytics techniques to provide an additional layer of value before on-selling to other users (they are often referred to as value added resellers). These organisations are engaged in base data acquisition and sales, data value adding, consulting on the interpretation and use of the spatial information products and, in only a few cases, in actual sensor design and development.21
4.2 Economic contribution of the Earth observation sector
4.2.1 Boundary of the sector To estimate the amount of economic activity that is generated by the EO sector, there is an important distinction to be made between those who are dependent on EO data for their activities and those whose activities have been improved by it. This feature of the economic framework is described in more detail in Appendix A.
Due to data limitations, EO economic activity for the purpose of the economic contribution is defined only by activity that depends on EO data.20
The economic framework shown in Figure 4.2 has been used to define the boundary of the Earth observation sector in Australia.
Source: Deloitte Access Economics
Figure 4.1: How the Earth observation sector creates economic value
Economic contribution
Indirect contribution Direct contribution
Wider economic benefits
Componentsuppliers
Subsystemsuppliers
Satellite & Launch manufacturers
Launch Providers
Satellite owner/operators
Ground station/Downlink
Data aggregators and reseller
Economic benefits to Earth observation end users
Agriculture
Mining
Aviation
Disastermanagement
Health
Electricityutilities
Water utilities
Road and rail transport
Upstream supply chain Earth observation sector Earth observation end users
28
Economic study into an Australian continuous launch small satellite program for Earth observation
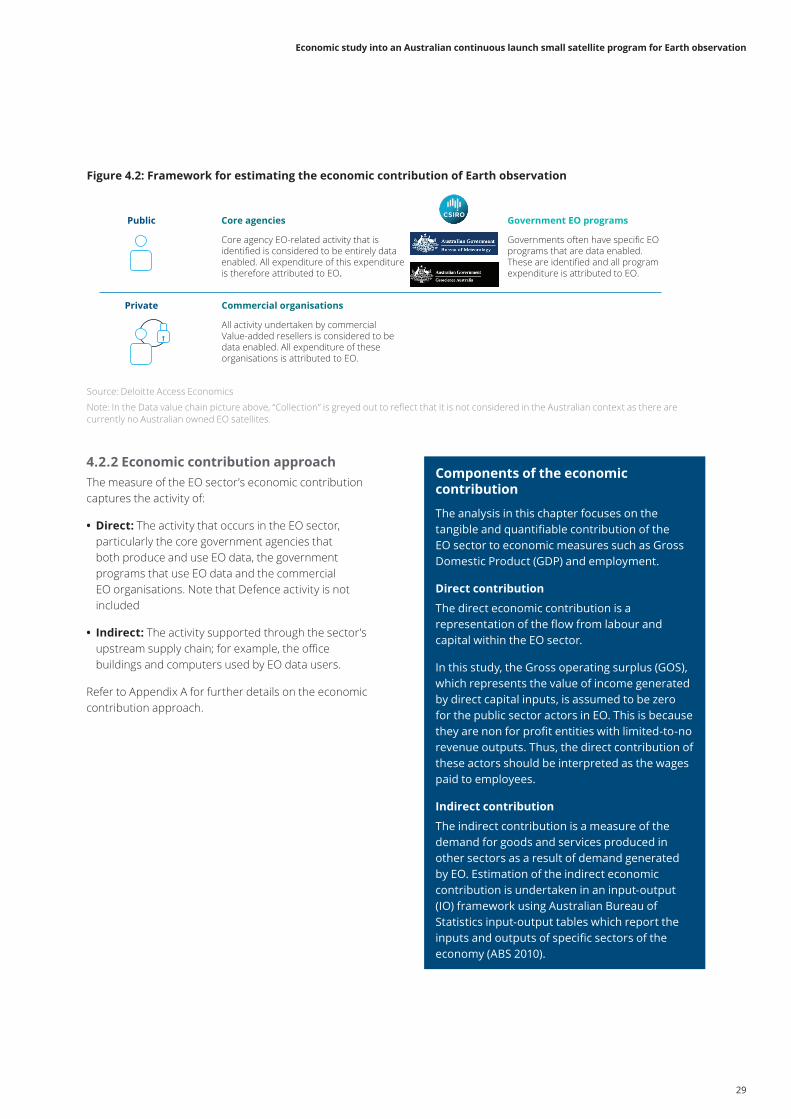
Figure 4.2: Framework for estimating the economic contribution of Earth observation
Public Core agencies
Core agency EO-related activity that is identified is considered to be entirely data enabled. All expenditure of this expenditure is therefore attributed to EO.
Government EO programs
Governments often have specific EO programs that are data enabled. These are identified and all program expenditure is attributed to EO.
Private Commercial organisations
All activity undertaken by commercial Value-added resellers is considered to be data enabled. All expenditure of these organisations is attributed to EO.
Source: Deloitte Access Economics
Note: In the Data value chain picture above, “Collection” is greyed out to reflect that it is not considered in the Australian context as there are currently no Australian owned EO satellites.
Components of the economic contribution
The analysis in this chapter focuses on the tangible and quantifiable contribution of the EO sector to economic measures such as Gross Domestic Product (GDP) and employment.
Direct contribution
The direct economic contribution is a representation of the flow from labour and capital within the EO sector.
In this study, the Gross operating surplus (GOS), which represents the value of income generated by direct capital inputs, is assumed to be zero for the public sector actors in EO. This is because they are non for profit entities with limited-to-no revenue outputs. Thus, the direct contribution of these actors should be interpreted as the wages paid to employees.
Indirect contribution
The indirect contribution is a measure of the demand for goods and services produced in other sectors as a result of demand generated by EO. Estimation of the indirect economic contribution is undertaken in an input-output (IO) framework using Australian Bureau of Statistics input-output tables which report the inputs and outputs of specific sectors of the economy (ABS 2010).
4.2.2 Economic contribution approachThe measure of the EO sector’s economic contribution captures the activity of:
• Direct: The activity that occurs in the EO sector, particularly the core government agencies that both produce and use EO data, the government programs that use EO data and the commercial EO organisations. Note that Defence activity is not included
• Indirect: The activity supported through the sector’s upstream supply chain; for example, the office buildings and computers used by EO data users.
Refer to Appendix A for further details on the economic contribution approach.
29
Economic study into an Australian continuous launch small satellite program for Earth observation
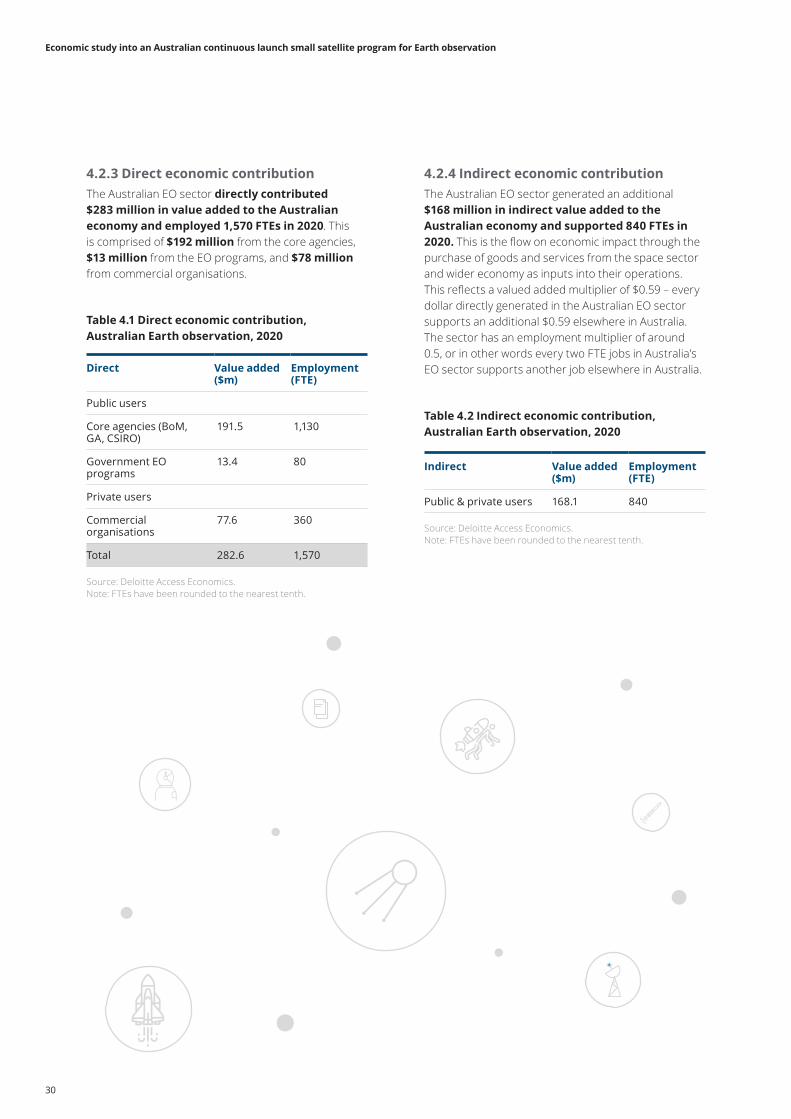
4.2.3 Direct economic contributionThe Australian EO sector directly contributed $283 million in value added to the Australian economy and employed 1,570 FTEs in 2020. This is comprised of $192 million from the core agencies, $13 million from the EO programs, and $78 million from commercial organisations.
4.2.4 Indirect economic contributionThe Australian EO sector generated an additional $168 million in indirect value added to the Australian economy and supported 840 FTEs in 2020. This is the flow on economic impact through the purchase of goods and services from the space sector and wider economy as inputs into their operations. This reflects a valued added multiplier of $0.59 – every dollar directly generated in the Australian EO sector supports an additional $0.59 elsewhere in Australia. The sector has an employment multiplier of around 0.5, or in other words every two FTE jobs in Australia’s EO sector supports another job elsewhere in Australia.
Table 4.2 Indirect economic contribution, Australian Earth observation, 2020
Indirect Value added ($m)
Employment (FTE)
Public & private users 168.1 840
Source: Deloitte Access Economics. Note: FTEs have been rounded to the nearest tenth.
Table 4.1 Direct economic contribution, Australian Earth observation, 2020
Direct Value added ($m)
Employment (FTE)
Public users
Core agencies (BoM, GA, CSIRO)
191.5 1,130
Government EO programs
13.4 80
Private users
Commercial organisations
77.6 360
Total 282.6 1,570
Source: Deloitte Access Economics. Note: FTEs have been rounded to the nearest tenth.
30
Economic study into an Australian continuous launch small satellite program for Earth observation
4.3.1 Benefits to end users of Earth observation data
Types of benefits Earth observation data provides to end users
The application of tailored EO data to end users like agriculture and mining delivers four types of benefits:
• Productivity improvements: operational cost savings and efficiency gains from EO solutions
• Avoided costs: costs to end users (and society at large) that are avoided due to EO solutions
• Improved policy and regulation: improved policy and regulation process and outcomes due to EO solutions
• Wider economic benefits: catalytic benefits accrued to third parties and the wider economy due to EO solutions.
4.3 Economic benefits to end users of Earth observation dataEarth observation generates economic benefits beyond the boundary of its sector through the application of the insights and understanding generated by EO data. In Australia, government (defence and civil) and researchers are key users of EO data, supporting a vast array of programs from bushfire monitoring to natural disaster preparedness.
There is also a growing number of non-space22 industries across the economy that leverage EO data. End users are not directly related to the collection, storage or analysis of (untransformed) EO data. Instead, these users leverage the application of analysis-ready EO information to improve and/or inform their products or processes to derive economic value. The productivity improvements, avoided costs, improved policy and regulation and wider benefits in industries like agriculture, utilities and transport are currently sizeable and are only expected to increase over time.
Importantly, weather information is a critical enabler of economic benefits to end users – specifically, weather forecasts, which are primarily derived from earth observation data. According to the Bureau of Meteorology, around 95 per cent of the observations used in the Bureau’s weather, hydrological and ocean models come from about 30 satellites.23 For this reason, the benefit framework treats the end users of weather forecast data as end users of EO data.
Estimating the value of EO to Australia would ideally be done through a detailed study of all the different applications in all their different uses in each economy. This task would be enormous and would require a complex matrix that would consider each industry segment and each application – with hundreds of thousands of variables needing to be estimated.
For this reason, the benefits outlined in this report are limited to those currently available through desktop research. The lack of evidence available on the uses and benefits of EO data is well acknowledged, and this limitation does mean that the estimates reported here are expected to be an underestimation of the true value of EO to the broader Australian economy.
Productivity improvements are the core driver of benefits from the application of EO data to other industries.
In resource-extracting industries such as agriculture, forestry and fishing and mining, EO technology drives productivity improvements by reducing the cost of operations,enabled by better planning of weather conditions and more precise environmental monitoring. This remains true for aviation, where environmental conditions significantly impact operations, and electricity utilities, where solar forecasts are an increasingly important requirement to electricity demand management.
Wider economic benefits are also derived from better management of natural resources. In particular, EO facilitates better management of Australia’s water supply for drinking and irrigation purposes and improves the response effectiveness towards natural disasters by enabling the public to be better prepared.
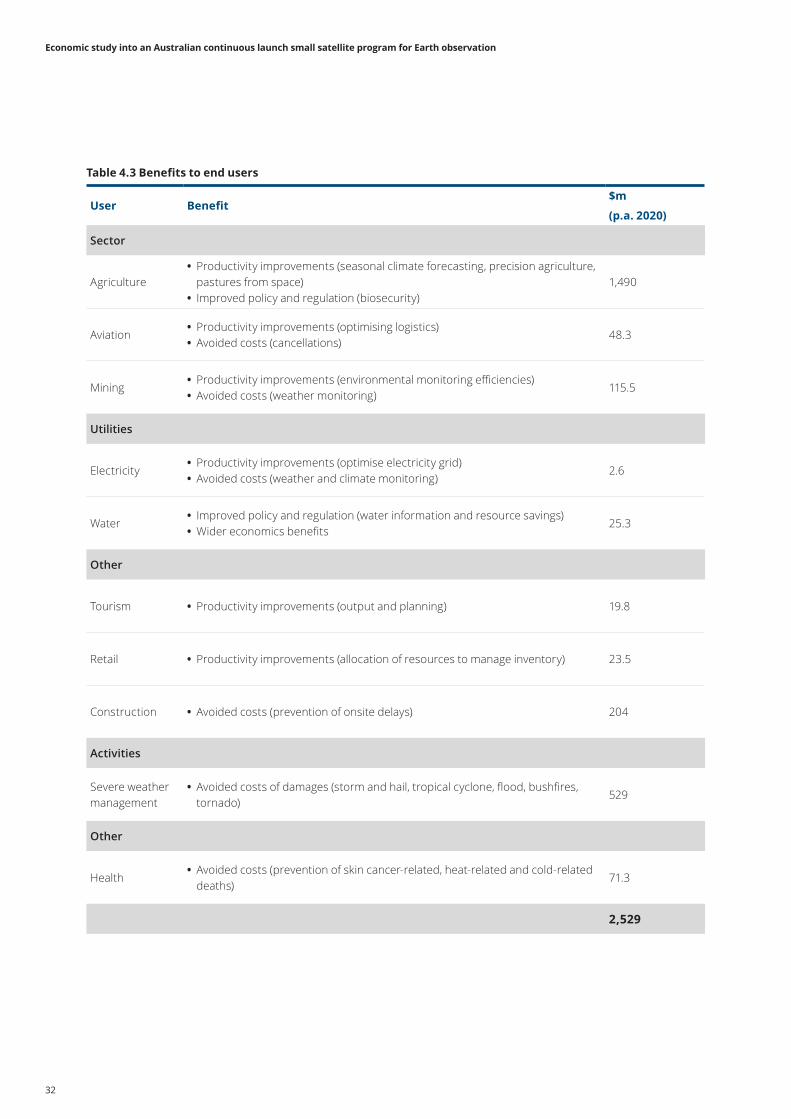
A summary of the benefits of EO data and how the benefits are derived is summarised in Table 4.3. Refer to Appendix B for the full research on the benefits to end users.
31
Economic study into an Australian continuous launch small satellite program for Earth observation
Source: Deloitte Access Economics.
User Benefit$m
(p.a. 2020)
Sector
Agriculture • Productivity improvements (seasonal climate forecasting, precision agriculture, pastures from space)
• Improved policy and regulation (biosecurity)1,490
Aviation • Productivity improvements (optimising logistics) • Avoided costs (cancellations)
48.3
Mining • Productivity improvements (environmental monitoring efficiencies) • Avoided costs (weather monitoring)
115.5
Utilities
Electricity • Productivity improvements (optimise electricity grid) • Avoided costs (weather and climate monitoring)
2.6
Water • Improved policy and regulation (water information and resource savings) • Wider economics benefits
25.3
Other
Tourism • Productivity improvements (output and planning) 19.8
Retail • Productivity improvements (allocation of resources to manage inventory) 23.5
Construction • Avoided costs (prevention of onsite delays) 204
Activities
Severe weather management
• Avoided costs of damages (storm and hail, tropical cyclone, flood, bushfires, tornado)
529
Other
Health • Avoided costs (prevention of skin cancer-related, heat-related and cold-related deaths)
71.3
2,529
Table 4.3 Benefits to end users
32
Economic study into an Australian continuous launch small satellite program for Earth observation
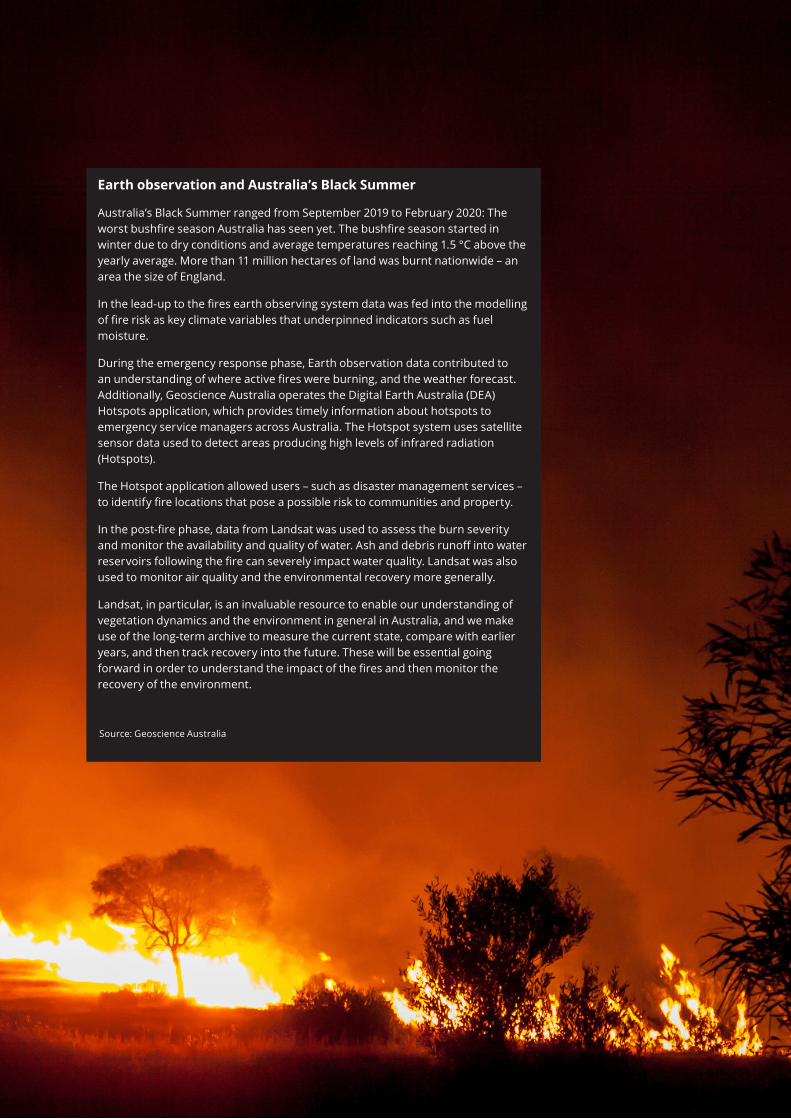
Earth observation and Australia’s Black Summer
Australia’s Black Summer ranged from September 2019 to February 2020: The worst bushfire season Australia has seen yet. The bushfire season started in winter due to dry conditions and average temperatures reaching 1.5 °C above the yearly average. More than 11 million hectares of land was burnt nationwide – an area the size of England.
In the lead-up to the fires earth observing system data was fed into the modelling of fire risk as key climate variables that underpinned indicators such as fuel moisture.
During the emergency response phase, Earth observation data contributed to an understanding of where active fires were burning, and the weather forecast. Additionally, Geoscience Australia operates the Digital Earth Australia (DEA) Hotspots application, which provides timely information about hotspots to emergency service managers across Australia. The Hotspot system uses satellite sensor data used to detect areas producing high levels of infrared radiation (Hotspots).
The Hotspot application allowed users – such as disaster management services – to identify fire locations that pose a possible risk to communities and property.
In the post-fire phase, data from Landsat was used to assess the burn severity and monitor the availability and quality of water. Ash and debris runoff into water reservoirs following the fire can severely impact water quality. Landsat was also used to monitor air quality and the environmental recovery more generally.
Landsat, in particular, is an invaluable resource to enable our understanding of vegetation dynamics and the environment in general in Australia, and we make use of the long-term archive to measure the current state, compare with earlier years, and then track recovery into the future. These will be essential going forward in order to understand the impact of the fires and then monitor the recovery of the environment.
Source: Geoscience Australia
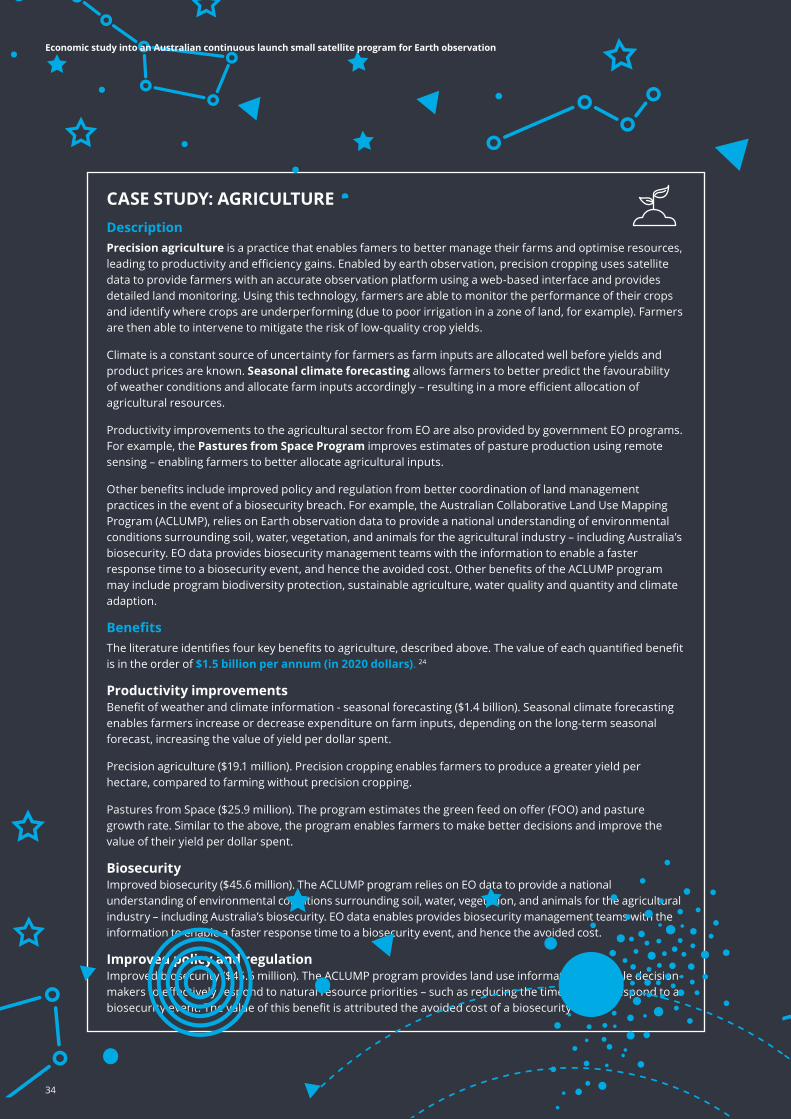
CASE STUDY: AGRICULTUREDescriptionPrecision agriculture is a practice that enables famers to better manage their farms and optimise resources, leading to productivity and efficiency gains. Enabled by earth observation, precision cropping uses satellite data to provide farmers with an accurate observation platform using a web-based interface and provides detailed land monitoring. Using this technology, farmers are able to monitor the performance of their crops and identify where crops are underperforming (due to poor irrigation in a zone of land, for example). Farmers are then able to intervene to mitigate the risk of low-quality crop yields.
Climate is a constant source of uncertainty for farmers as farm inputs are allocated well before yields and product prices are known. Seasonal climate forecasting allows farmers to better predict the favourability of weather conditions and allocate farm inputs accordingly – resulting in a more efficient allocation of agricultural resources.
Productivity improvements to the agricultural sector from EO are also provided by government EO programs. For example, the Pastures from Space Program improves estimates of pasture production using remote sensing – enabling farmers to better allocate agricultural inputs.
Other benefits include improved policy and regulation from better coordination of land management practices in the event of a biosecurity breach. For example, the Australian Collaborative Land Use Mapping Program (ACLUMP), relies on Earth observation data to provide a national understanding of environmental conditions surrounding soil, water, vegetation, and animals for the agricultural industry – including Australia’s biosecurity. EO data provides biosecurity management teams with the information to enable a faster response time to a biosecurity event, and hence the avoided cost. Other benefits of the ACLUMP program may include program biodiversity protection, sustainable agriculture, water quality and quantity and climate adaption.
Benefits The literature identifies four key benefits to agriculture, described above. The value of each quantified benefit is in the order of $1.5 billion per annum (in 2020 dollars). 24
Productivity improvementsBenefit of weather and climate information - seasonal forecasting ($1.4 billion). Seasonal climate forecasting enables farmers increase or decrease expenditure on farm inputs, depending on the long-term seasonal forecast, increasing the value of yield per dollar spent.
Precision agriculture ($19.1 million). Precision cropping enables farmers to produce a greater yield per hectare, compared to farming without precision cropping.
Pastures from Space ($25.9 million). The program estimates the green feed on offer (FOO) and pasture growth rate. Similar to the above, the program enables farmers to make better decisions and improve the value of their yield per dollar spent.
BiosecurityImproved biosecurity ($45.6 million). The ACLUMP program relies on EO data to provide a national understanding of environmental conditions surrounding soil, water, vegetation, and animals for the agricultural industry – including Australia’s biosecurity. EO data enables provides biosecurity management teams with the information to enable a faster response time to a biosecurity event, and hence the avoided cost.
Improved policy and regulationImproved biosecurity ($45.6 million). The ACLUMP program provides land use information to enable decision-makers to effectively respond to natural resource priorities – such as reducing the time taken to respond to a biosecurity event. The value of this benefit is attributed the avoided cost of a biosecurity event.
34
Economic study into an Australian continuous launch small satellite program for Earth observation
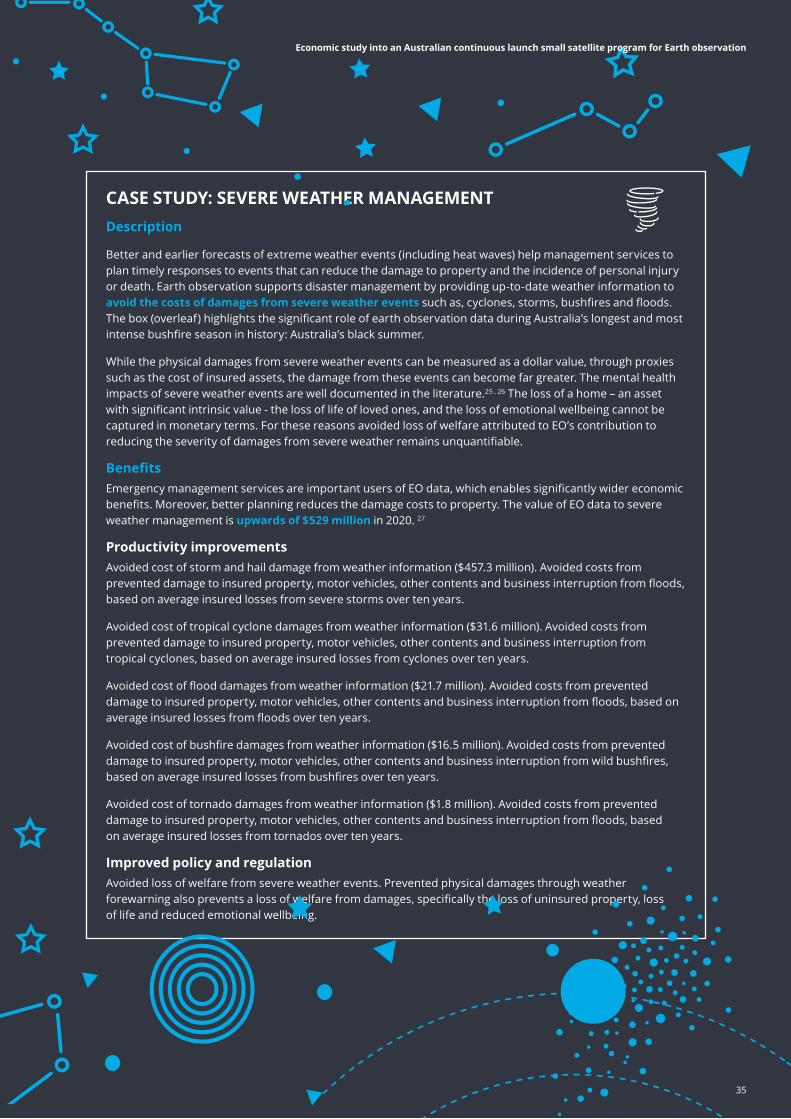
CASE STUDY: SEVERE WEATHER MANAGEMENTDescription
Better and earlier forecasts of extreme weather events (including heat waves) help management services to plan timely responses to events that can reduce the damage to property and the incidence of personal injury or death. Earth observation supports disaster management by providing up-to-date weather information to avoid the costs of damages from severe weather events such as, cyclones, storms, bushfires and floods. The box (overleaf) highlights the significant role of earth observation data during Australia’s longest and most intense bushfire season in history: Australia’s black summer.
While the physical damages from severe weather events can be measured as a dollar value, through proxies such as the cost of insured assets, the damage from these events can become far greater. The mental health impacts of severe weather events are well documented in the literature.25 , 26 The loss of a home – an asset with significant intrinsic value - the loss of life of loved ones, and the loss of emotional wellbeing cannot be captured in monetary terms. For these reasons avoided loss of welfare attributed to EO’s contribution to reducing the severity of damages from severe weather remains unquantifiable.
Benefits Emergency management services are important users of EO data, which enables significantly wider economic benefits. Moreover, better planning reduces the damage costs to property. The value of EO data to severe weather management is upwards of $529 million in 2020. 27
Productivity improvementsAvoided cost of storm and hail damage from weather information ($457.3 million). Avoided costs from prevented damage to insured property, motor vehicles, other contents and business interruption from floods, based on average insured losses from severe storms over ten years.
Avoided cost of tropical cyclone damages from weather information ($31.6 million). Avoided costs from prevented damage to insured property, motor vehicles, other contents and business interruption from tropical cyclones, based on average insured losses from cyclones over ten years.
Avoided cost of flood damages from weather information ($21.7 million). Avoided costs from prevented damage to insured property, motor vehicles, other contents and business interruption from floods, based on average insured losses from floods over ten years.
Avoided cost of bushfire damages from weather information ($16.5 million). Avoided costs from prevented damage to insured property, motor vehicles, other contents and business interruption from wild bushfires, based on average insured losses from bushfires over ten years.
Avoided cost of tornado damages from weather information ($1.8 million). Avoided costs from prevented damage to insured property, motor vehicles, other contents and business interruption from floods, based on average insured losses from tornados over ten years.
Improved policy and regulationAvoided loss of welfare from severe weather events. Prevented physical damages through weather forewarning also prevents a loss of welfare from damages, specifically the loss of uninsured property, loss of life and reduced emotional wellbeing.
35
Economic study into an Australian continuous launch small satellite program for Earth observation

5 What if…there was a denial of service?
36
Economic study into an Australian continuous launch small satellite program for Earth observation
Instead, Australia contributes to the global observation network though services that increase the value derived from foreign space agency partners. Contributions include promoting uptake of the data and sharing of technology, expertise, ground station capacity, and calibration and validation of data.
Over time, Australia has contributed to the Global Observing System (GOS) and the international EO community, largely through in-kind value adding activities of existing EO data. However, without directly contributing to the GOS by way of Australian owned large-scale EO programs, Australia is largely considered a free rider.
That is, most of the value Australia derives from EO data is provided for free by foreign government programs (in the past, the purchase of commercial data has been relatively sporadic). The box (overleaf) provides an economic justification for why Australia remains a free rider.30
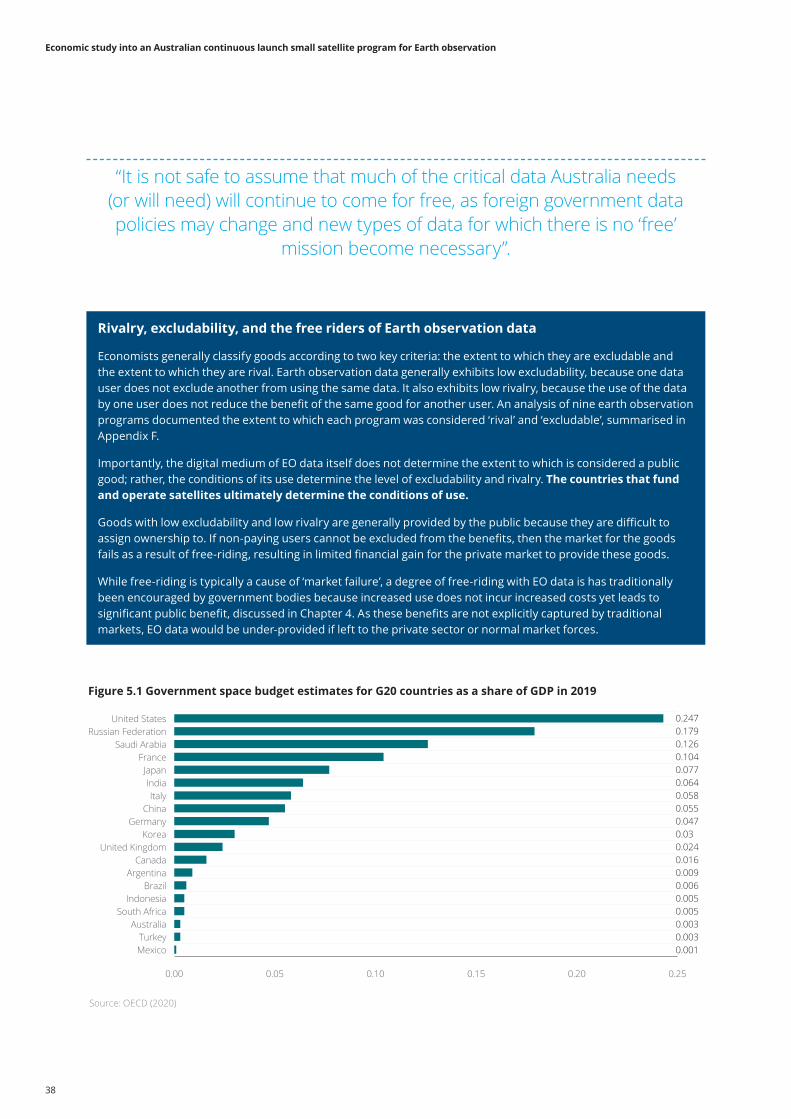
While free-riding of EO data is acceptable, if not encouraged, the dialogue between Australia and EO-providing nations shifted in recent years. Australia’s government space budget as a share of GDP is only 0.003 per cent, the third lowest of all G20 countries (Figure 5.1). There is an increasingly prominent view by international space partners that Australia should be doing more to contribute to the global EO community.
Despite the goodwill with the international space community that Australia intends to uphold, there is a limited expectation that EO data will continue to be provided to Australia free of charge. As summarised in the Australian Space Industry Capability Review (quote overleaf): 31
A denial of service event would see 81 per cent of activity in the Earth observation sector almost immediately cease to exist as we know it. In
addition, the Australian economy would contract by $1.9 billion due to the disruption in activity by end users of Earth observation data.
5.1 Australia; an Earth observation free riderEO data is essential for delivery of critical services such as weather forecasting and emergency response, enhances economic productivity in key industries including agriculture and insurance, enables sustainable development within our environment, and supports the nation to deliver on its international commitments.
Despite our increasing reliance on EO data for ‘mission critical’ activities, Australia remains exposed to a significant data supply risk.
In 2014, more than 60 per cent of Australia’s public EO programs relied on US satellites, with around a third of EO programs relying on Landsat alone. At the same time, 25 per cent of Australia’s public EO programs relied on satellite data provided by Europe, and 11 per cent relied on satellite data provided by Japan.28 Almost all of these programs rely on open access data agreements.29
Meaning, almost all of the EO activity undertaken by Australia’s government agencies are entirely reliant on foreign-owned and operated assets. Access to the data provided by these satellites is provided to Australia based on the international agreements underpinned by international collaboration coordination outlined in section 2.3.
The growing dependence on satellite data presents a key sovereign risk for Australia due to its reliance on the global space-based system. The enormous cost of designing and launching satellites, as well as the expertise required to develop the technology means it would be infeasible for Australia to develop its own satellite network that would be of an equivalent size and scope.
37
Economic study into an Australian continuous launch small satellite program for Earth observation
“It is not safe to assume that much of the critical data Australia needs (or will need) will continue to come for free, as foreign government data policies may change and new types of data for which there is no ‘free’
mission become necessary”.
Rivalry, excludability, and the free riders of Earth observation data
Economists generally classify goods according to two key criteria: the extent to which they are excludable and the extent to which they are rival. Earth observation data generally exhibits low excludability, because one data user does not exclude another from using the same data. It also exhibits low rivalry, because the use of the data by one user does not reduce the benefit of the same good for another user. An analysis of nine earth observation programs documented the extent to which each program was considered ‘rival’ and ‘excludable’, summarised in Appendix F.
Importantly, the digital medium of EO data itself does not determine the extent to which is considered a public good; rather, the conditions of its use determine the level of excludability and rivalry. The countries that fund and operate satellites ultimately determine the conditions of use.
Goods with low excludability and low rivalry are generally provided by the public because they are difficult to assign ownership to. If non-paying users cannot be excluded from the benefits, then the market for the goods fails as a result of free-riding, resulting in limited financial gain for the private market to provide these goods.
While free-riding is typically a cause of ‘market failure’, a degree of free-riding with EO data is has traditionally been encouraged by government bodies because increased use does not incur increased costs yet leads to significant public benefit, discussed in Chapter 4. As these benefits are not explicitly captured by traditional markets, EO data would be under-provided if left to the private sector or normal market forces.
Source: OECD (2020)
Figure 5.1 Government space budget estimates for G20 countries as a share of GDP in 2019
0.00 0.05 0.10 0.15 0.20 0.25
MexicoTurkey
AustraliaSouth Africa
IndonesiaBrazil
ArgentinaCanada
United KingdomKorea
GermanyChina
ItalyIndia
JapanFrance
Saudi ArabiaRussian Federation
United States
0.0010.0030.0030.0050.0050.0060.0090.0160.0240.030.0470.0550.0580.0640.0770.1040.1260.1790.247
38
Economic study into an Australian continuous launch small satellite program for Earth observation
5.2 A denial of service eventAs with any supply chain, continuity and confidence is key and Australia’s reliance on internationally owned government and commercial satellite infrastructure has long been a topic of national discourse. This presents a potential risk to the Australian EO sector that should be explored and understood.
To demonstrate the potential economic significance of EO data to Australia, an economic assessment of a ‘denial of service event’, has been undertaken. This reflects a scenario where Australia is denied access to all currently available open access EO data. The denial of service scenario analysis quantifies the answer to the following question: What would be the economic impact of denying Earth observation data to the Australian economy?
There exists a wide variety of reasons from which a DOS scenario may occur. This can extend from geopolitical tensions, technology malfunctions, change in satellite owner priorities (e.g. major satellites are not replenished at the end of life) or unforeseen events (collisions that wipe out entire satellites). These are explored in greater detail below:
A change in policy. First and foremost, a denial of service event could occur where Australia is no longer able to access data from key satellites free-of-charge.
Large international organisations with a significant stake in Earth observation data may have a greater incentive to place pressure on governments to allow the commercialisation of EO data – particularly as the production of satellite technology becomes more commercially viable
Technical failure. Satellites go offline for a prolonged period of time due to a technical failure. For example, in December and January of 2020, Landsat 7 and 8 went offline for prolonged periods, significantly impacting the quality of the data available to 26 per cent of Australian public EO programs
Environmental damage. To a lesser degree, the increasing volume of space debris orbiting the earth increases the risk that satellites will be damaged by man-made debris and limit the operation of EO data.
A denial of service event would significantly impact critical services provided to the Australian public. EO data is crucial for the provision of weather forecasts and warnings across Australia and internationally. 95 per cent of the observations used in the Bureau’s weather, hydrological and ocean models come from about 30 satellites. The remaining 5 per cent come from surface-based observations networks. The output from the Bureau’s weather models underpin most of the Bureau’s weather and warning services delivered to the Australian public and internationally (see case study overleaf).32, 33
39
Economic study into an Australian continuous launch small satellite program for Earth observation
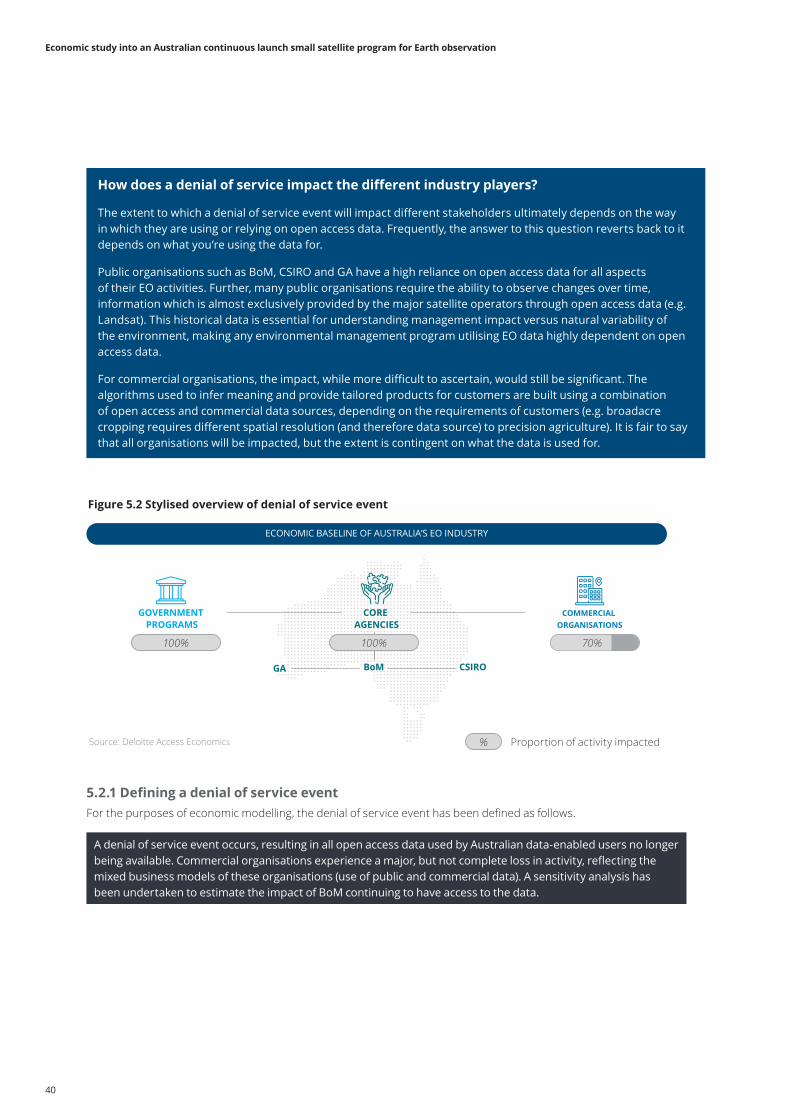
How does a denial of service impact the different industry players?
The extent to which a denial of service event will impact different stakeholders ultimately depends on the way in which they are using or relying on open access data. Frequently, the answer to this question reverts back to it depends on what you’re using the data for.
Public organisations such as BoM, CSIRO and GA have a high reliance on open access data for all aspects of their EO activities. Further, many public organisations require the ability to observe changes over time, information which is almost exclusively provided by the major satellite operators through open access data (e.g. Landsat). This historical data is essential for understanding management impact versus natural variability of the environment, making any environmental management program utilising EO data highly dependent on open access data.
For commercial organisations, the impact, while more difficult to ascertain, would still be significant. The algorithms used to infer meaning and provide tailored products for customers are built using a combination of open access and commercial data sources, depending on the requirements of customers (e.g. broadacre cropping requires different spatial resolution (and therefore data source) to precision agriculture). It is fair to say that all organisations will be impacted, but the extent is contingent on what the data is used for.
5.2.1 Defining a denial of service eventFor the purposes of economic modelling, the denial of service event has been defined as follows.
A denial of service event occurs, resulting in all open access data used by Australian data-enabled users no longer being available. Commercial organisations experience a major, but not complete loss in activity, reflecting the mixed business models of these organisations (use of public and commercial data). A sensitivity analysis has been undertaken to estimate the impact of BoM continuing to have access to the data.
Figure 5.2 Stylised overview of denial of service event
ECONOMIC BASELINE OF AUSTRALIA’S EO INDUSTRY
GOVERNMENT PROGRAMS
COMMERCIAL ORGANISATIONS
Source: Deloitte Access Economics
CORE AGENCIES
GA BoM CSIRO
100% 100%
%
70%
Proportion of activity impacted
40
Economic study into an Australian continuous launch small satellite program for Earth observation
What if …BoM wasn’t impacted?
In the event of a denial of service, there are a multitude of international agreements from which the BoM could identify a way to work around and continue to obtain the necessary EO data from foreign-owned satellites. If a meteorological earth observation supplier were to deny service, it would likely be a global issue that the WMO would address. However, the other core agencies, GA and CSIRO and commercial organisations are still impacted by the event.
The modelled immediate impact is an estimated 41 per cent reduction in direct value added. Furthermore, it is estimated that 44 per cent of employment in the industry will be impacted.
The impact of this second scenario, is substantially lower than the first – over half. This shows the importance of the BoM in the economic contribution of the Australian EO sector.
Table 5.2 DOS (BoM remains), economic contribution, Earth observation, 2020
Scenario 2 Value added ($m)
Employment (FTE)
Direct 166.4 875
Source: Deloitte Access Economics. Note: FTEs have been rounded to the nearest tenth.
5.3 Impact of a denial of service event
5.3.1 Impact on the Earth observation sectorThe denial of service event is imposed on the economic baseline estimated in Sections 4.2.2 and 4.2.4. As such, the numbers presented represent a static deviation from the economic baseline (i.e. economic contribution).
In the event of a denial of service, it is assumed that the majority of the expenditure attributable to public users (i.e. core agency activity and government programs that have a high dependency on EO data) cease to exist. Effectively, this removes their economic activity from the baseline estimate of the economic contribution.
Commercial organisations are also impacted under this scenario, losing up to 70 per cent of their commercial activity as a result of a loss of access to publicly available data (informed through stakeholder consultation). While it may be assumed that commercial organisations could experience a loss that is relatively more short-term than the public sector, it is anticipated that the immediate impact would be significant.
Table 5.1 DOS, economic contribution, Earth observation, 2020
After a denial of service
Value added ($m)
Employment (FTE)
Direct contribution of the EO sector
54.3 250
Source: Deloitte Access Economics. Note: FTEs have been rounded to the nearest tenth.
The modelled immediate impact is an estimated 81 per cent reduction in direct value added by the EO sector. Furthermore, it is estimated that 84 per cent of employment in the sector will be impacted.
41
Economic study into an Australian continuous launch small satellite program for Earth observation
Earth observation and the Bureau of MeteorologyThe Australian Bureau of Meteorology (BoM) provides a respected public weather service – and is considered one of the leading meteorological services in the world.
BoM’s role in the earth observation ecosystem
BoM has been a substantial user of EO from space for several decades, assimilating data from over 30 satellites into weather prediction and visualisation systems.
EO data is crucial for the provision of weather forecasts and warnings across Australia and internationally. Only 5 per cent of the organisations forecasting ability able to be provided by ground monitoring systems. Forecasting services provided to the public rely on four atmospheric, ocean and hydrology (river flow) forecasting models to provide weather forecasting services to the Australian public and internationally.
BoM’s activities
A number of sectors rely on accurate weather forecasts to be able to operate efficiently. According to a study by London Economics (2016), the economic value of the BoM’s services are estimated to range from $98 to $375 million. These benefits are derived from a number of key sectors, shown overleaf. It is no coincidence that the benefits from BoM services are similar to the EO beneficiaries outlined in this report. BoM is a significant enabler of benefits to Earth observation users. That is, without BoM, many of the benefits derived from EO data would not exist in Australia.
In addition to its public weather services, BoM provides a commercial offering to users who seek bespoke meteorological solutions. Since 2010, BoM’s revenue has increased by more than 30 per cent, to $352.7 million.
The impact of a Denial of Service event on BoM
According to BoM experts responsible for the data assimilation systems for numerical weather predictions, denying BoM of EO data would be similar to reverting BoM’s operations to their capacity in the 1970s. Prior to the availability of satellite data, accurate weather forecasts were only available one day in advance. Comparatively, one-day forecasting accuracy in 1970 was worse than the accuracy of today’s five-day forecast.
Denying BoM of EO data would severely limit BoMs current capability to provide critical public weather forecasting services, as well as private data enhanced services.
Moreover, BoM’s commercial services are significantly enhanced EO data developments. BoM’s commercial services would be severely impacted with the elimination of EOS data, limiting the ability of the organisation to recoup expenditure on value adding activity.
42
Economic study into an Australian continuous launch small satellite program for Earth observation
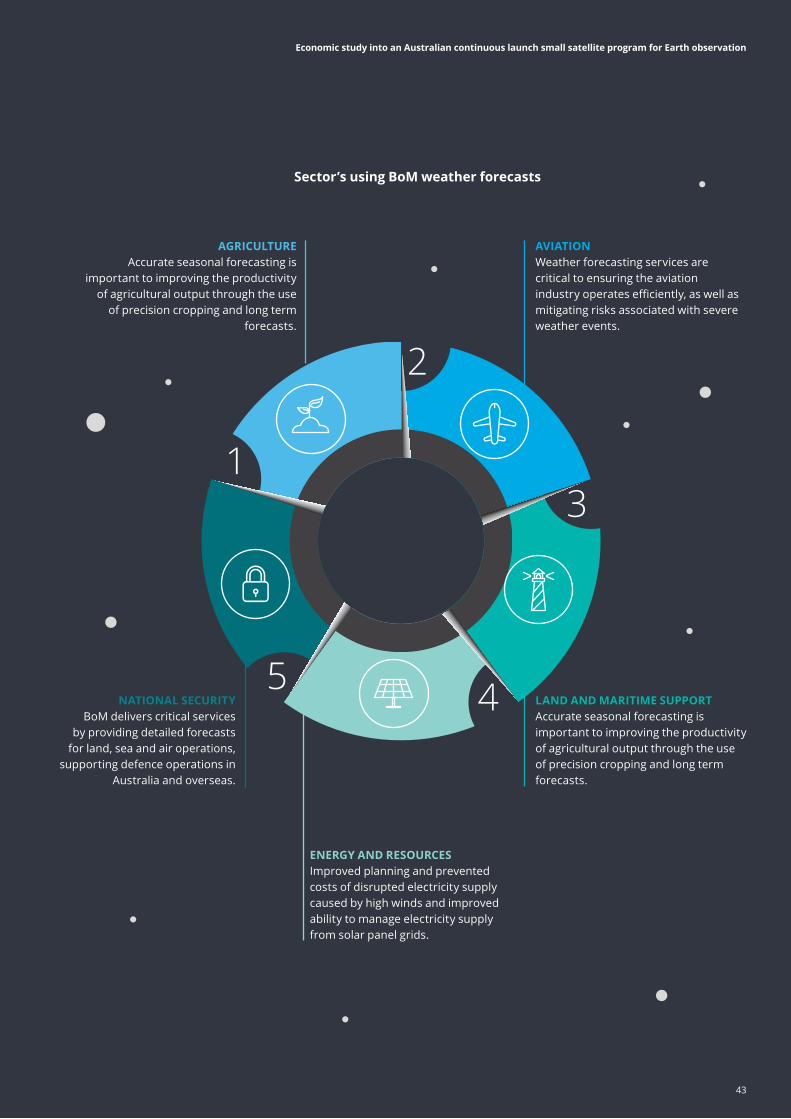
AGRICULTUREAccurate seasonal forecasting is
important to improving the productivity of agricultural output through the use
of precision cropping and long term forecasts.
AVIATIONWeather forecasting services are critical to ensuring the aviation industry operates efficiently, as well as mitigating risks associated with severe weather events.
LAND AND MARITIME SUPPORT Accurate seasonal forecasting is important to improving the productivity of agricultural output through the use of precision cropping and long term forecasts.
ENERGY AND RESOURCESImproved planning and prevented costs of disrupted electricity supply caused by high winds and improved ability to manage electricity supply from solar panel grids.
NATIONAL SECURITYBoM delivers critical services
by providing detailed forecasts for land, sea and air operations,
supporting defence operations in Australia and overseas.
1
2
3
45
Sector’s using BoM weather forecasts
43
Economic study into an Australian continuous launch small satellite program for Earth observation
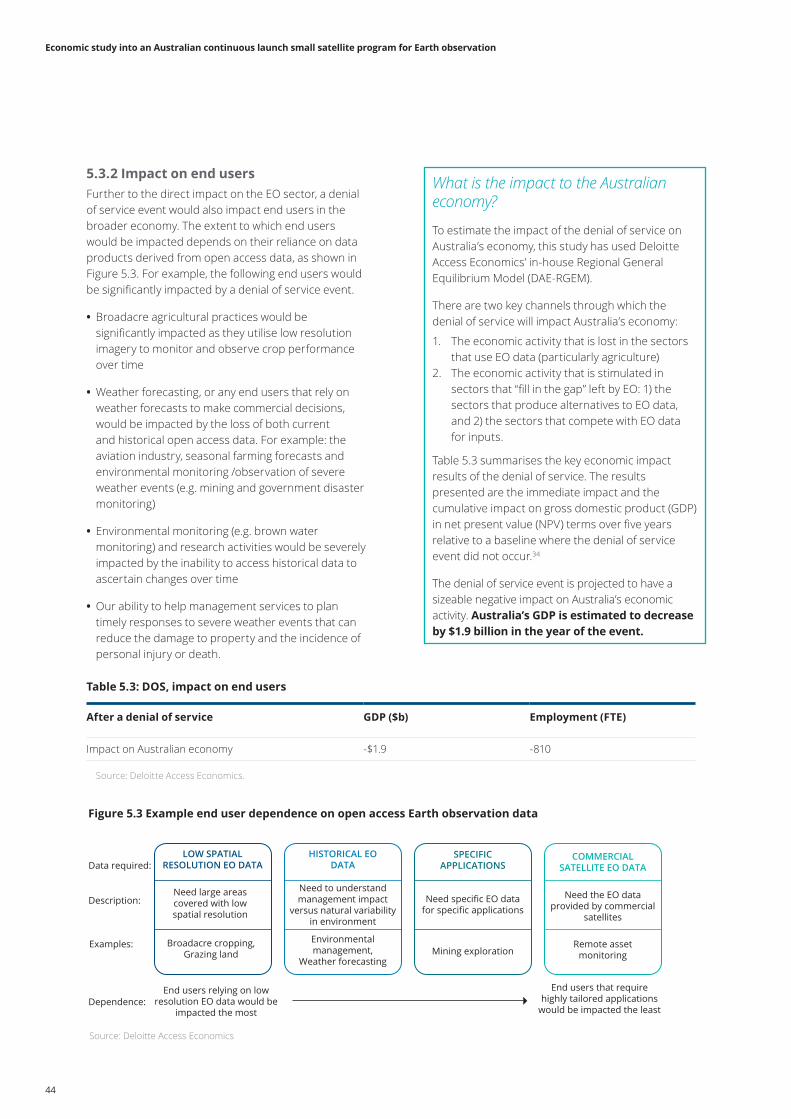
What is the impact to the Australian economy?
To estimate the impact of the denial of service on Australia’s economy, this study has used Deloitte Access Economics’ in-house Regional General Equilibrium Model (DAE-RGEM).
There are two key channels through which the denial of service will impact Australia’s economy:
1. The economic activity that is lost in the sectors that use EO data (particularly agriculture)
2. The economic activity that is stimulated in sectors that “fill in the gap” left by EO: 1) the sectors that produce alternatives to EO data, and 2) the sectors that compete with EO data for inputs.
Table 5.3 summarises the key economic impact results of the denial of service. The results presented are the immediate impact and the cumulative impact on gross domestic product (GDP) in net present value (NPV) terms over five years relative to a baseline where the denial of service event did not occur.34
The denial of service event is projected to have a sizeable negative impact on Australia’s economic activity. Australia’s GDP is estimated to decrease by $1.9 billion in the year of the event.
5.3.2 Impact on end usersFurther to the direct impact on the EO sector, a denial of service event would also impact end users in the broader economy. The extent to which end users would be impacted depends on their reliance on data products derived from open access data, as shown in Figure 5.3. For example, the following end users would be significantly impacted by a denial of service event.
• Broadacre agricultural practices would be significantly impacted as they utilise low resolution imagery to monitor and observe crop performance over time
• Weather forecasting, or any end users that rely on weather forecasts to make commercial decisions, would be impacted by the loss of both current and historical open access data. For example: the aviation industry, seasonal farming forecasts and environmental monitoring /observation of severe weather events (e.g. mining and government disaster monitoring)
• Environmental monitoring (e.g. brown water monitoring) and research activities would be severely impacted by the inability to access historical data to ascertain changes over time
• Our ability to help management services to plan timely responses to severe weather events that can reduce the damage to property and the incidence of personal injury or death.
Table 5.3: DOS, impact on end users
After a denial of service GDP ($b) Employment (FTE)
Impact on Australian economy -$1.9 -810
Source: Deloitte Access Economics.
Source: Deloitte Access Economics
Figure 5.3 Example end user dependence on open access Earth observation data
Data required:
Description:
Examples:
Dependence:
LOW SPATIAL RESOLUTION EO DATA
HISTORICAL EO DATA
SPECIFIC APPLICATIONS
COMMERCIAL SATELLITE EO DATA
Need large areas covered with low spatial resolution
Need to understand management impact
versus natural variability in environment
Need specific EO data for specific applications
Need the EO data provided by commercial
satellites
Broadacre cropping, Grazing land
Environmental management,
Weather forecasting Mining exploration
Remote asset monitoring
End users relying on low resolution EO data would be
impacted the most
End users that require highly tailored applications
would be impacted the least
44
Economic study into an Australian continuous launch small satellite program for Earth observation
How real is a denial of service event for Australia?
In recent years, the EO sector in Australia – and indeed globally – has become increasingly alive to the reality of a denial of service event occurring. Many factors have influenced this, including a tumultuous geopolitical climate, changes in policy and the increasing cost burden associated with maintaining such significant satellite programs. Indeed, as of 2018, the U.S federal government is seeking to “explore how putting a price on Landsat data might affect scientists and other user”.35
A comparable event, demonstrating the extent to which the ecosystem is vulnerable to international policy changes, included the impact of the US government shutdown in 2019. NASA was one of the government agencies impacted by the shutdown, limiting the availability of NASA’s workforce for two months. Large programs such as the international space station remained; only smaller programs – including earth observation programs – were affected. One such program was the National Oceanic and Atmospheric Administration (NOAA), which provides wind data. Aerospace agencies rely on NOAA as part of safety analysis for commercial launches. Without it, organisations such as Exos were unable to conduct safety checks on sounding rocket launches, causing costly delays.
Another example of a denial of service event was the technical failure of Landsat 7 and 8 in 2003. When Landsat 7’s Scan Line Corrector (SLC) failed in 2003, the spaciously continuous fields observed from the sensor were affected by a line-of-sight zig-zag pattern, resulting in large data gaps. Applications requiring complete and focused retrievals over localised areas such as mapping, or event monitoring, were significantly impaired as a consequence. For over ten years, a body of research was dedicated to gap-filling Landsat imagery data from this 2003 event.36
In the European Union, three countries face exclusion from key space projects previously available to association countries who had negotiated the rights to access EU research programs. The provision of Brexit has shifted the terms of ownership of space data, with ramifications for the United Kingdom, Israel and Switzerland.
5.4 Implications of a denial of serviceEvery industry seeks to understand and mitigate against supply chain risks. For the EO sector, however, the structure of the supply chain presents a particular challenge – everyone is reliant on a few. And those few are foreign-owned assets subject to foreign relations and investment decisions.
For Australia, this presents a sizeable economic risk.
First, there’s the risk to the EO sector itself – the people and assets that are focused on turning EO data into meaningful insights. In the language of data economics, this is the EO data-enabled activity. The modelling shows that $226 million of value added – or 81 per cent of the EO sector – is at risk if a denial of service event was to occur.
Second, there’s the risk to the broader Australian economy through the industries that leverage analysis-ready Earth observation data to drive increased economic value (e.g. agriculture) or avoid potentially catastrophic costs (e.g. from bushfires). While not quantified here, a denial of service event would have unquestionably large implications for these EO data users and their supply chains.
45
Economic study into an Australian continuous launch small satellite program for Earth observation

6 What if…there was a solution?
46
Economic study into an Australian continuous launch small satellite program for Earth observation
6.2 Earth observation as an anchorAs the Australian Space Agency (ASA) looks to foster, support, and sustain the growth of the Australian space industry, it makes sense to identify opportunities that are centred around areas of long-standing expertise and capability.
The EO sector in Australia is exposed to a supply risk – data is entirely derived from internationally owned assets. As such, there is an opportunity for Australia to satisfy two goals through one program – meet the expectations of the GOS and no longer be a free-rider and provide a sustainable investment pipeline to underpin space sector growth.
As previous sections have explored, Australia’s use of EO data is pervasive. Extending beyond the sector itself and to the everyday lives of the public. Looking ahead, as the sector innovates and new types of data are developed, it will be challenging to continue to access important and complex EO data to underpin a growing ecosystem without ‘paying’. While it may be the case that Australia could pay for access to data should the requirement arise, this would be of no benefit to the Australian EO sector, space sector or broader economy. There exists an opportunity for Australia make a tangible contribution to the growing needs of the global EO sector, thereby simultaneously reducing our risk and signalling our intent to pull our weight and bolster the GOS.
Identifying ways in which the ASA can build a sustainable investment pipeline to underpin space sector growth presents an opportunity for the EO sector. The challenges facing the EO sector and the ASA are complimentary: the EO sector is facing a supply risk and the ASA is creating the conditions for sustainable investment in the Australian civil space sector that can galvanise production, distribution, and consumption patterns across various sectors.37 An investment in a program such as the one proposed in 6.3 demonstrates how mitigating the current data supply risk of the EO sector could be designed to uplift other sub-sectors of the Australian space sector.
The proposed $36 million annual investment in the hypothetical program is projected to generate a significant positive impact on Australia’s economic activity. Australia’s GDP is estimated to increase by $141 million in present
value terms between 2023 and 2040.
6.1 Investing in the Australian space industry Space has outgrown the confines of pure research and defence and is now a thriving commercial activity that Australia is seeking an ever-growing share of. However, building an industry is no mean feat; it requires long-term strategy, investment, and commitment. Particularly for an industry as niche and complex as space.
The needs of the space industry are reflected in its industry structure. With origins in aerospace and defence, the industry is characterised by high capital and R&D costs and long lead times, which over time has led to the dominance of a few key players with the means and know-how: government agencies with national security interests and their core suppliers (primes). Globally, space industry capability has been built from the inside out, driven by public investment and need.
The Australian space industry has strong prospects for growth – across several players and sub-sectors. However, as the industry looks to mature and scale, consistent sustainable investment is needed.
This is an important industry dynamic for space, as without a focal point from which activity can form, the features of its industry structure can hinder start-ups and small-medium enterprises (SMEs) from entering new growth phases.
This then begs the question, what does sustainable investment for the Australian space industry look like, and how would it drive growth?
47
Economic study into an Australian continuous launch small satellite program for Earth observation
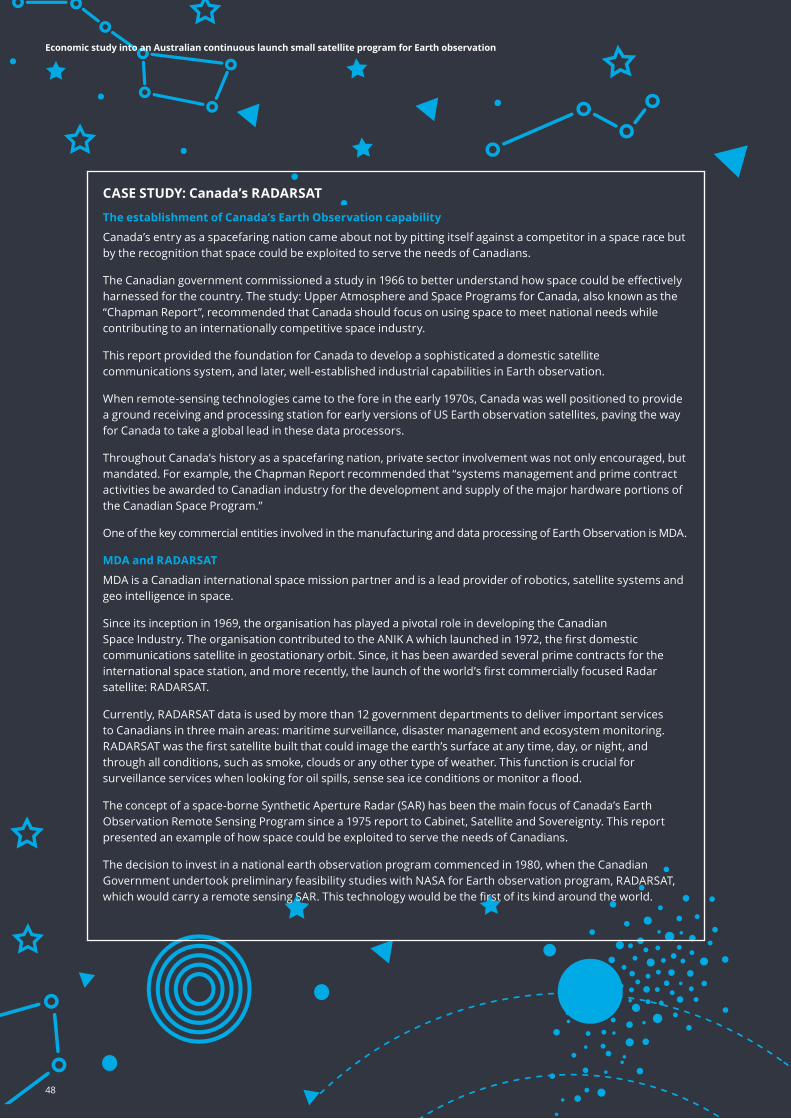
CASE STUDY: Canada’s RADARSAT
The establishment of Canada’s Earth Observation capability
Canada’s entry as a spacefaring nation came about not by pitting itself against a competitor in a space race but by the recognition that space could be exploited to serve the needs of Canadians.
The Canadian government commissioned a study in 1966 to better understand how space could be effectively harnessed for the country. The study: Upper Atmosphere and Space Programs for Canada, also known as the “Chapman Report”, recommended that Canada should focus on using space to meet national needs while contributing to an internationally competitive space industry.
This report provided the foundation for Canada to develop a sophisticated a domestic satellite communications system, and later, well-established industrial capabilities in Earth observation.
When remote-sensing technologies came to the fore in the early 1970s, Canada was well positioned to provide a ground receiving and processing station for early versions of US Earth observation satellites, paving the way for Canada to take a global lead in these data processors.
Throughout Canada’s history as a spacefaring nation, private sector involvement was not only encouraged, but mandated. For example, the Chapman Report recommended that “systems management and prime contract activities be awarded to Canadian industry for the development and supply of the major hardware portions of the Canadian Space Program.”
One of the key commercial entities involved in the manufacturing and data processing of Earth Observation is MDA.
MDA and RADARSAT
MDA is a Canadian international space mission partner and is a lead provider of robotics, satellite systems and geo intelligence in space.
Since its inception in 1969, the organisation has played a pivotal role in developing the Canadian Space Industry. The organisation contributed to the ANIK A which launched in 1972, the first domestic communications satellite in geostationary orbit. Since, it has been awarded several prime contracts for the international space station, and more recently, the launch of the world’s first commercially focused Radar satellite: RADARSAT.
Currently, RADARSAT data is used by more than 12 government departments to deliver important services to Canadians in three main areas: maritime surveillance, disaster management and ecosystem monitoring. RADARSAT was the first satellite built that could image the earth’s surface at any time, day, or night, and through all conditions, such as smoke, clouds or any other type of weather. This function is crucial for surveillance services when looking for oil spills, sense sea ice conditions or monitor a flood.
The concept of a space-borne Synthetic Aperture Radar (SAR) has been the main focus of Canada’s Earth Observation Remote Sensing Program since a 1975 report to Cabinet, Satellite and Sovereignty. This report presented an example of how space could be exploited to serve the needs of Canadians.
The decision to invest in a national earth observation program commenced in 1980, when the Canadian Government undertook preliminary feasibility studies with NASA for Earth observation program, RADARSAT, which would carry a remote sensing SAR. This technology would be the first of its kind around the world.
48
Economic study into an Australian continuous launch small satellite program for Earth observation
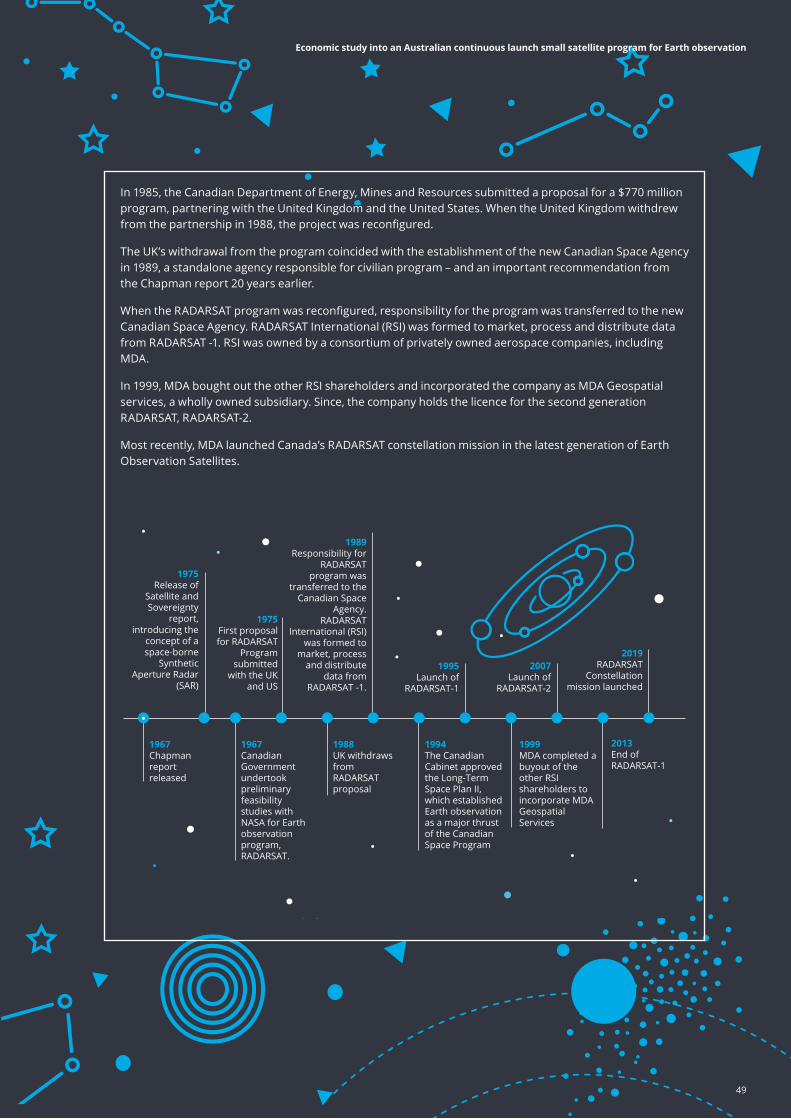
In 1985, the Canadian Department of Energy, Mines and Resources submitted a proposal for a $770 million program, partnering with the United Kingdom and the United States. When the United Kingdom withdrew from the partnership in 1988, the project was reconfigured.
The UK’s withdrawal from the program coincided with the establishment of the new Canadian Space Agency in 1989, a standalone agency responsible for civilian program – and an important recommendation from the Chapman report 20 years earlier.
When the RADARSAT program was reconfigured, responsibility for the program was transferred to the new Canadian Space Agency. RADARSAT International (RSI) was formed to market, process and distribute data from RADARSAT -1. RSI was owned by a consortium of privately owned aerospace companies, including MDA.
In 1999, MDA bought out the other RSI shareholders and incorporated the company as MDA Geospatial services, a wholly owned subsidiary. Since, the company holds the licence for the second generation RADARSAT, RADARSAT-2.
Most recently, MDA launched Canada’s RADARSAT constellation mission in the latest generation of Earth Observation Satellites.
1967Chapman report released
1967Canadian Government undertook preliminary feasibility studies with NASA for Earth observation program, RADARSAT.
1988UK withdraws from RADARSAT proposal
1994The Canadian Cabinet approved the Long-Term Space Plan II, which established Earth observation as a major thrust of the Canadian Space Program
1999MDA completed a buyout of the other RSI shareholders to incorporate MDA Geospatial Services
2013End of RADARSAT-1
1975Release of
Satellite and Sovereignty
report, introducing the
concept of a space-borne
Synthetic Aperture Radar
(SAR)
1975First proposal for RADARSAT
Program submitted
with the UK and US
1989Responsibility for
RADARSAT program was
transferred to the Canadian Space
Agency. RADARSAT
International (RSI) was formed to
market, process and distribute
data from RADARSAT -1.
1995Launch of
RADARSAT-1
2007Launch of
RADARSAT-2
2019RADARSAT
Constellation mission launched
49
Economic study into an Australian continuous launch small satellite program for Earth observation
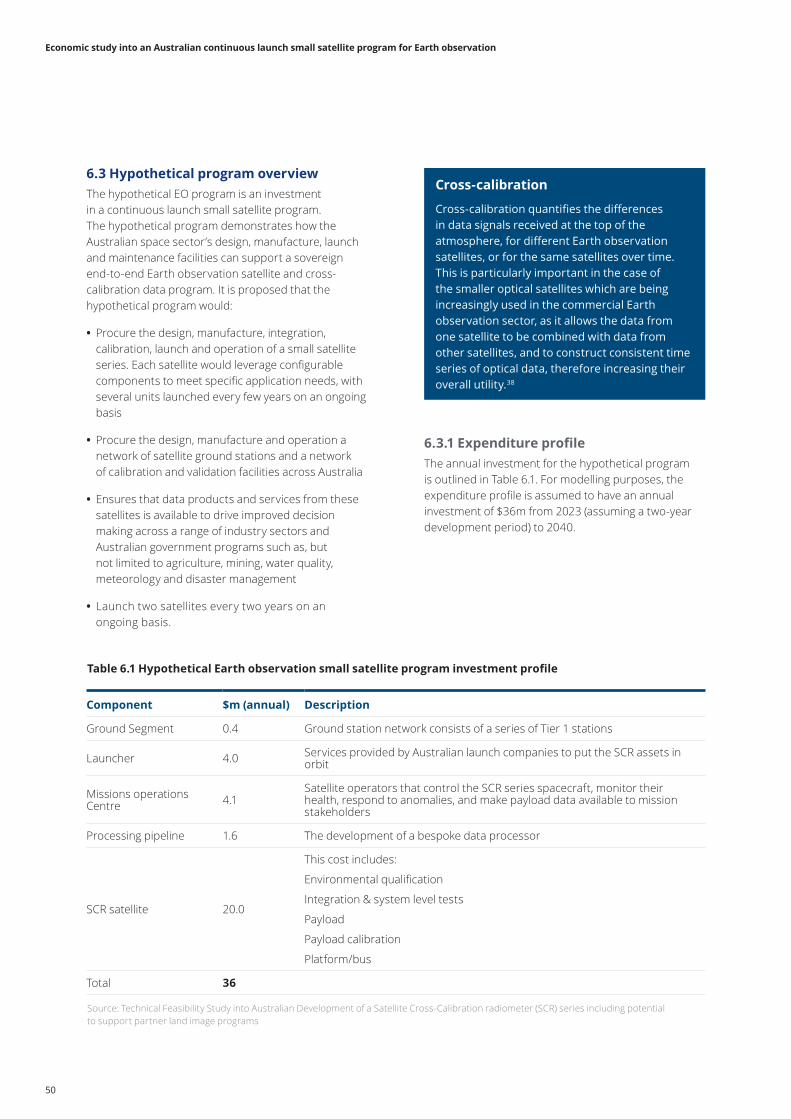
6.3.1 Expenditure profileThe annual investment for the hypothetical program is outlined in Table 6.1. For modelling purposes, the expenditure profile is assumed to have an annual investment of $36m from 2023 (assuming a two-year development period) to 2040.
6.3 Hypothetical program overviewThe hypothetical EO program is an investment in a continuous launch small satellite program. The hypothetical program demonstrates how the Australian space sector’s design, manufacture, launch and maintenance facilities can support a sovereign end-to-end Earth observation satellite and cross-calibration data program. It is proposed that the hypothetical program would:
• Procure the design, manufacture, integration, calibration, launch and operation of a small satellite series. Each satellite would leverage configurable components to meet specific application needs, with several units launched every few years on an ongoing basis
• Procure the design, manufacture and operation a network of satellite ground stations and a network of calibration and validation facilities across Australia
• Ensures that data products and services from these satellites is available to drive improved decision making across a range of industry sectors and Australian government programs such as, but not limited to agriculture, mining, water quality, meteorology and disaster management
• Launch two satellites every two years on an ongoing basis.
Cross-calibration
Cross-calibration quantifies the differences in data signals received at the top of the atmosphere, for different Earth observation satellites, or for the same satellites over time. This is particularly important in the case of the smaller optical satellites which are being increasingly used in the commercial Earth observation sector, as it allows the data from one satellite to be combined with data from other satellites, and to construct consistent time series of optical data, therefore increasing their overall utility.38
Table 6.1 Hypothetical Earth observation small satellite program investment profile
Component $m (annual) Description
Ground Segment 0.4 Ground station network consists of a series of Tier 1 stations
Launcher 4.0 Services provided by Australian launch companies to put the SCR assets in orbit
Missions operations Centre 4.1
Satellite operators that control the SCR series spacecraft, monitor their health, respond to anomalies, and make payload data available to mission stakeholders
Processing pipeline 1.6 The development of a bespoke data processor
SCR satellite 20.0
This cost includes:
Environmental qualification
Integration & system level tests
Payload
Payload calibration
Platform/bus
Total 36
Source: Technical Feasibility Study into Australian Development of a Satellite Cross-Calibration radiometer (SCR) series including potential to support partner land image programs
50
Economic study into an Australian continuous launch small satellite program for Earth observation
Building capability in an ecosystem as complex as this requires investments that stimulate bottom-up activity (i.e. non-space related industry) and top-down (i.e. stretch targets for industry that challenge existing entrants to grow). The hypothetical program proposed in this section demonstrates how a consistent and sustainable investment in industry capability that requires existing players to stretch will draw in non-space organisations and grow their capability. Further, where these stretch targets (as identified by the hypothetical program) align to broader national priorities such as long-term defence industry plans ( JP9102 and DEF799) the impact of the program will extend further.
It is anticipated that such an investment would be designed to uplift Australia’s satellite manufacturing capability by increasing technical readiness levels for key components where Australia has a demonstrated or emerging technical advantage, demonstrating flight heritage in an operational context, and establishing international connections.
Ultimately, the long-term payoffs come in the form of economic diversification and potential export revenues as this program enables industry to provide products that not only support national priorities but that are also aligned to the global space market. Eventually resulting in an ability to confidently and consistently compete and deliver in the global supply chain.
6.4 Building a sustainable space sectorNot only is space an industry that inspires, it is also an industry that endures. The advent of New Space has brought a new level excitement and activity, inside and out of the sector. Cutting-edge technology and major scientific breakthroughs have led to big investments (private investment totalled USD$25.6 billion in 202039), big personalities (Elon Musk and Jeff Bezos) joining the New Space race. However, alongside these exciting developments driven by commercial organisations, foundational public sector programs have facilitated consistent capability development from which New Space organisations have relied on for guidance.
As Australia’s space sector continues to build expertise and identify where and how it will play; when it comes to space, it’s important not to get too caught up in the excitement and mystery and run our own race.
Building a sustainable space sector from Australian industry is about identifying where and how investments can support capability – with room for both the new and existing players. While significant structural change is occurring in the sector, space remains categorised by high barriers to entry, long-lead times, and a few dominant industry players.
51
Economic study into an Australian continuous launch small satellite program for Earth observation
Getting procurement right to support industry capability
First and foremost, governments use procurement to fulfil the needs for goods or services. However, significant benefits can also be realised when procurement is leveraged to deliver secondary policy objectives. Taking a strategic policy view of procurement can provide governments with additional instruments to achieve broader policy objectives such as industry development, commercialisation of research, upskilling the workforce, regional investment, or export readiness. Indeed, public procurement has the potential to be a catalyst for innovative solutions to pressing challenges.40
The hypothetical program described in this report is a case in point. Its primary objective is to develop an EO solution that meets Australia’s commitments to the GOS. Critically, though, its secondary policy objective is to support the sustainable development of Australia’s space industry. As explained elsewhere in this report, by procuring the design, manufacturing and, potentially, launch of small satellites within Australia, the hypothetical program is using government demand to underpin growth in the domestic supply chain.
Incorporating secondary policy objectives into procurement necessitates the use of innovative contracting and procurement processes. Consideration must be given to how to deliver on the strategic objectives while still delivering value for money.
It is noted that this study is one step in a series of efforts underway to support the hypothetical program described in this chapter. Additional work is being done to support the successful design, procurement and eventual implementation of a program that can support strategic policy objectives. Presently, some of these considerations include:
• Investigation into the necessary regulatory settings required to support an ongoing, long-term investment that can provide industry with confidence to invest
• Exploring how to build a program that celebrates the highs and lows of the innovation cycles
– Tendering that has an in-built appetite for risk and (where appropriate) acceptance (or celebration) of failure. For example, the hypothetical program is proposing two satellites every two years, in part to de-risk the investment, in part to allow time for innovation and experimentation between launches and in part to allow time for evaluation. These are essential to lifting domestic organisations up the maturity curve
– Such a design ensures the program has flexibility and rigour such that it can learn from failures and spread this knowledge across the ecosystem
– For example, this may include the appointment of multiple tenderers to be engaged in the early design stages, such a provision enables multiple organisations to learn and engage in the design process; also facilitating consistency across the multiple tenderers
• Tailored tendering to meet industry requirements
– Defining the relationship management processes early to ensure efficiency (i.e. removal of administrative burdens where possible), clarity and review are well articulated and understood
• Local industry content
– Local content requirements explicitly involve domestic organisations in large projects. This delivers a number of benefits for Australian organisations, including sustainable demand, mentoring and knowledge transfer (from primes), flight heritage and opportunities for new business connections
– This includes provisions around industry content measured at the subsystem level and whether components have been made or assembled on home soil.
52
Economic study into an Australian continuous launch small satellite program for Earth observation
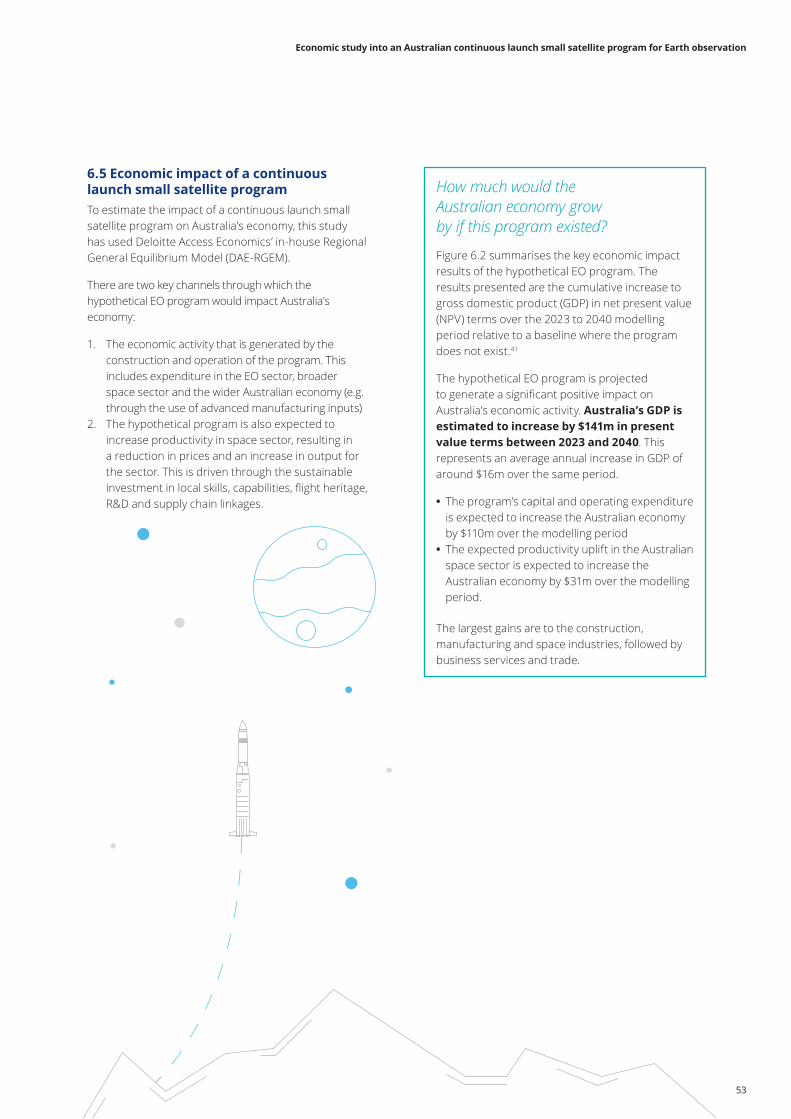
How much would the Australian economy grow by if this program existed?
Figure 6.2 summarises the key economic impact results of the hypothetical EO program. The results presented are the cumulative increase to gross domestic product (GDP) in net present value (NPV) terms over the 2023 to 2040 modelling period relative to a baseline where the program does not exist.41
The hypothetical EO program is projected to generate a significant positive impact on Australia’s economic activity. Australia’s GDP is estimated to increase by $141m in present value terms between 2023 and 2040. This represents an average annual increase in GDP of around $16m over the same period.
• The program’s capital and operating expenditure is expected to increase the Australian economy by $110m over the modelling period
• The expected productivity uplift in the Australian space sector is expected to increase the Australian economy by $31m over the modelling period.
The largest gains are to the construction, manufacturing and space industries, followed by business services and trade.
6.5 Economic impact of a continuous launch small satellite programTo estimate the impact of a continuous launch small satellite program on Australia’s economy, this study has used Deloitte Access Economics’ in-house Regional General Equilibrium Model (DAE-RGEM).
There are two key channels through which the hypothetical EO program would impact Australia’s economy:
1. The economic activity that is generated by the construction and operation of the program. This includes expenditure in the EO sector, broader space sector and the wider Australian economy (e.g. through the use of advanced manufacturing inputs)
2. The hypothetical program is also expected to increase productivity in space sector, resulting in a reduction in prices and an increase in output for the sector. This is driven through the sustainable investment in local skills, capabilities, flight heritage, R&D and supply chain linkages.
53
Economic study into an Australian continuous launch small satellite program for Earth observation
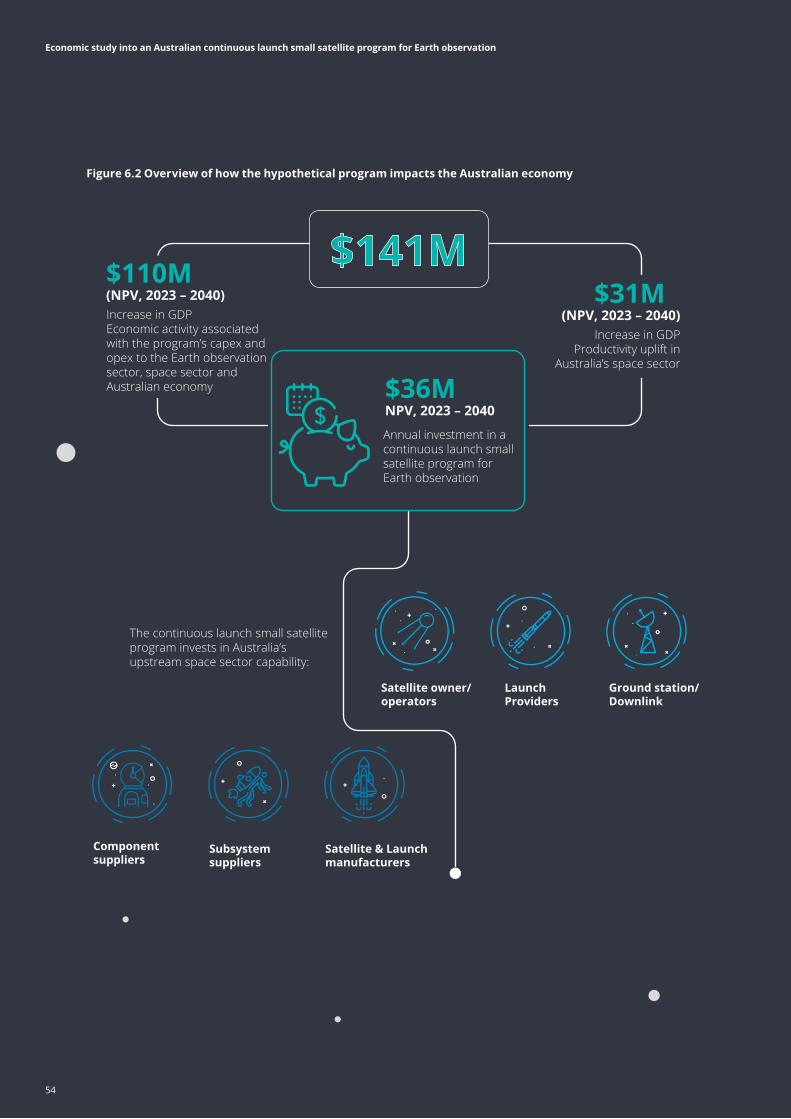
The continuous launch small satellite program invests in Australia’s upstream space sector capability:
Componentsuppliers
Subsystemsuppliers
Launch Providers
Satellite & Launch manufacturers
Satellite owner/operators
Ground station/Downlink
Annual investment in a continuous launch small satellite program for Earth observation
NPV, 2023 – 2040$36M
$141M(NPV, 2023 – 2040)$110MIncrease in GDP Economic activity associated with the program’s capex and opex to the Earth observation sector, space sector and Australian economy
(NPV, 2023 – 2040)$31MIncrease in GDP
Productivity uplift in Australia’s space sector
Figure 6.2 Overview of how the hypothetical program impacts the Australian economy
54
Economic study into an Australian continuous launch small satellite program for Earth observation
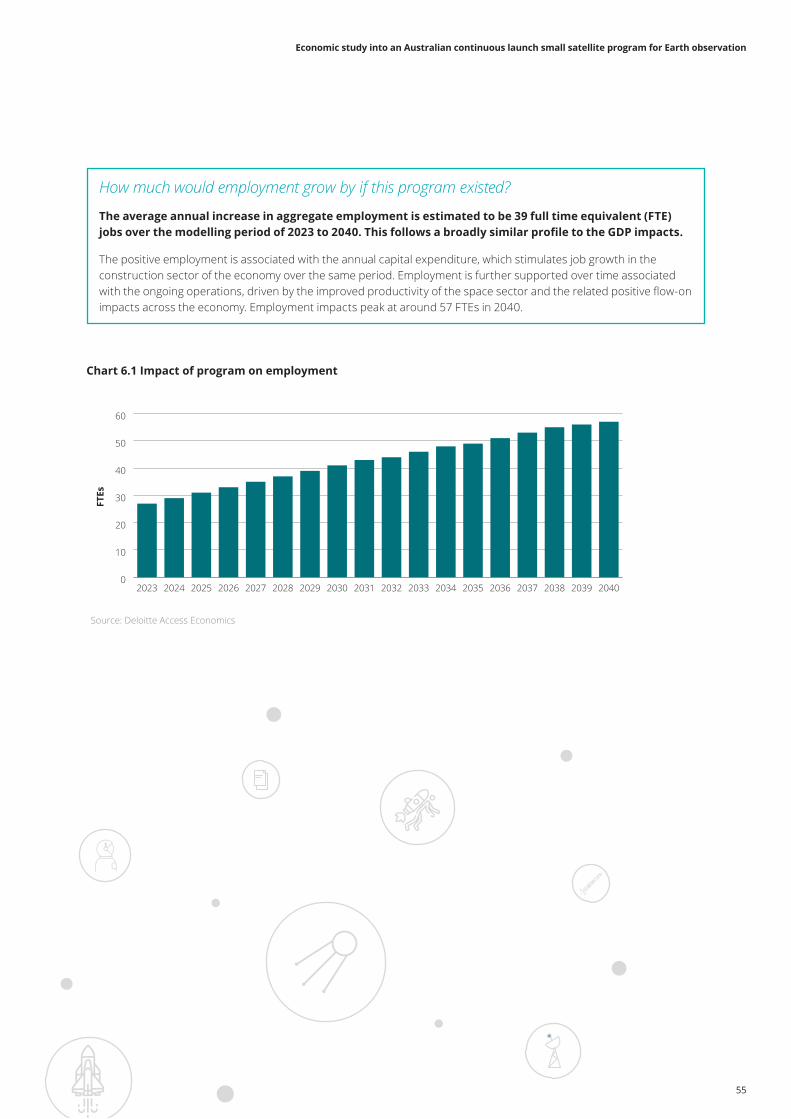
How much would employment grow by if this program existed?
The average annual increase in aggregate employment is estimated to be 39 full time equivalent (FTE) jobs over the modelling period of 2023 to 2040. This follows a broadly similar profile to the GDP impacts.
The positive employment is associated with the annual capital expenditure, which stimulates job growth in the construction sector of the economy over the same period. Employment is further supported over time associated with the ongoing operations, driven by the improved productivity of the space sector and the related positive flow-on impacts across the economy. Employment impacts peak at around 57 FTEs in 2040.
Chart 6.1 Impact of program on employment
Source: Deloitte Access Economics
0
10
20
30
40
50
60
204020392038203720362035203420332032203120302029202820272026202520242023
FTEs
55
Economic study into an Australian continuous launch small satellite program for Earth observation
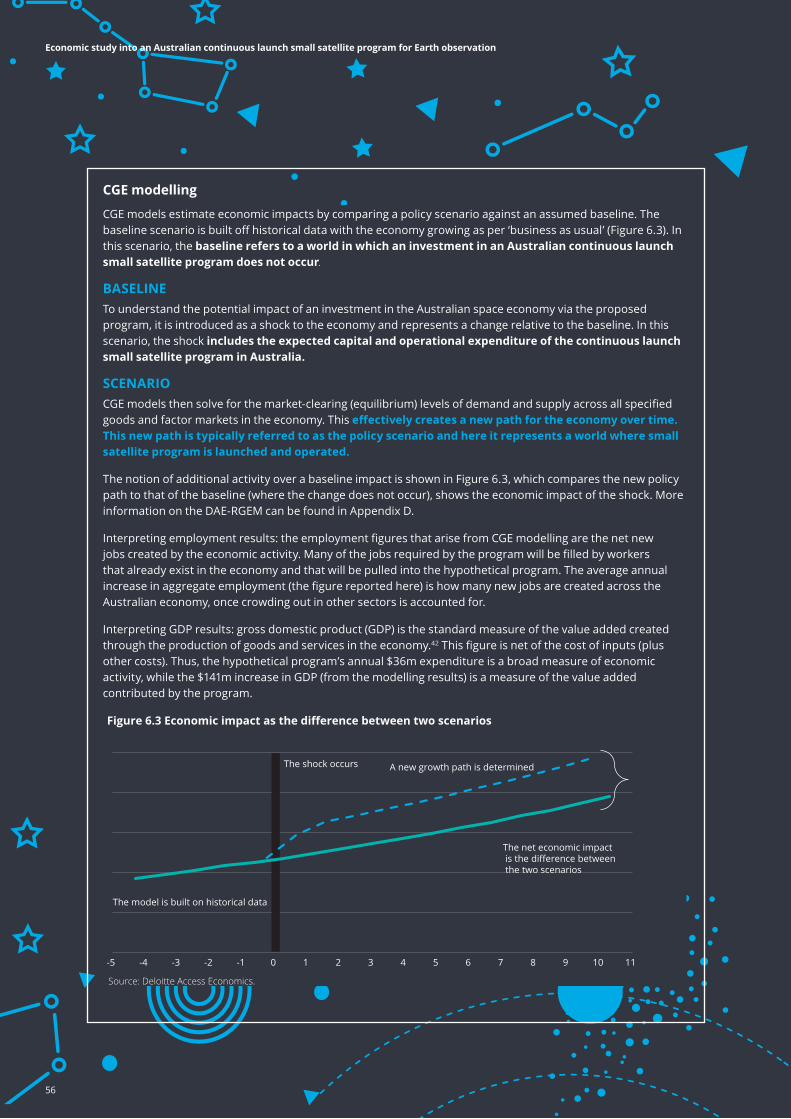
CGE modelling
CGE models estimate economic impacts by comparing a policy scenario against an assumed baseline. The baseline scenario is built off historical data with the economy growing as per ‘business as usual’ (Figure 6.3). In this scenario, the baseline refers to a world in which an investment in an Australian continuous launch small satellite program does not occur.
BASELINETo understand the potential impact of an investment in the Australian space economy via the proposed program, it is introduced as a shock to the economy and represents a change relative to the baseline. In this scenario, the shock includes the expected capital and operational expenditure of the continuous launch small satellite program in Australia.
SCENARIOCGE models then solve for the market-clearing (equilibrium) levels of demand and supply across all specified goods and factor markets in the economy. This effectively creates a new path for the economy over time. This new path is typically referred to as the policy scenario and here it represents a world where small satellite program is launched and operated.
The notion of additional activity over a baseline impact is shown in Figure 6.3, which compares the new policy path to that of the baseline (where the change does not occur), shows the economic impact of the shock. More information on the DAE-RGEM can be found in Appendix D.
Interpreting employment results: the employment figures that arise from CGE modelling are the net new jobs created by the economic activity. Many of the jobs required by the program will be filled by workers that already exist in the economy and that will be pulled into the hypothetical program. The average annual increase in aggregate employment (the figure reported here) is how many new jobs are created across the Australian economy, once crowding out in other sectors is accounted for.
Interpreting GDP results: gross domestic product (GDP) is the standard measure of the value added created through the production of goods and services in the economy.42 This figure is net of the cost of inputs (plus other costs). Thus, the hypothetical program’s annual $36m expenditure is a broad measure of economic activity, while the $141m increase in GDP (from the modelling results) is a measure of the value added contributed by the program.
-5 -4 -3 -2 -1 0 1 2 3 4 5 6 7 8 9 10 11
The model is built on historical data
The shock occurs A new growth path is determined
The net economic impact is the difference between the two scenarios
Figure 6.3 Economic impact as the difference between two scenarios
Source: Deloitte Access Economics.
56
Economic study into an Australian continuous launch small satellite program for Earth observation

57
Appendix
58
Economic study into an Australian continuous launch small satellite program for Earth observation
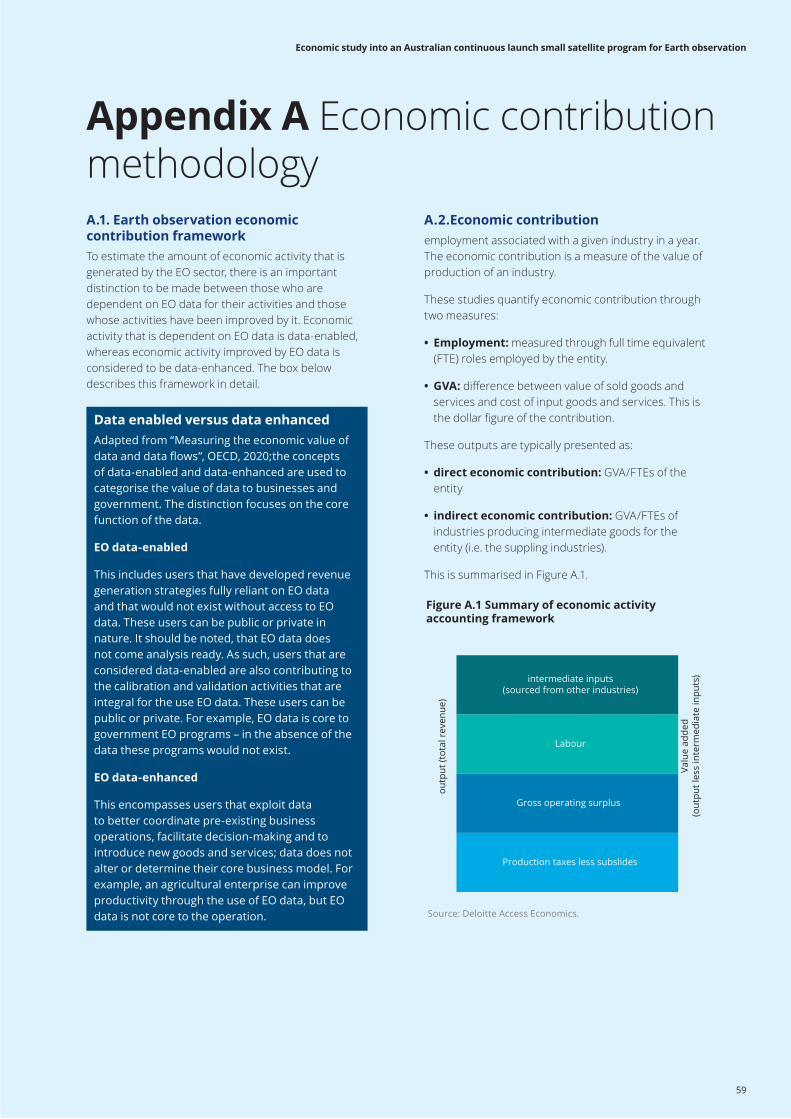
Figure A.1 Summary of economic activity accounting framework
outp
ut (t
otal
rev
enue
)
Valu
e ad
ded
(out
put l
ess
inte
rmed
iate
inpu
ts)intermediate inputs
(sourced from other industries)
Labour
Gross operating surplus
Production taxes less subslides
Source: Deloitte Access Economics.
A.2.Economic contributionemployment associated with a given industry in a year. The economic contribution is a measure of the value of production of an industry.
These studies quantify economic contribution through two measures:
• Employment: measured through full time equivalent (FTE) roles employed by the entity.
• GVA: difference between value of sold goods and services and cost of input goods and services. This is the dollar figure of the contribution.
These outputs are typically presented as:
• direct economic contribution: GVA/FTEs of the entity
• indirect economic contribution: GVA/FTEs of industries producing intermediate goods for the entity (i.e. the suppling industries).
This is summarised in Figure A.1.
A.1. Earth observation economic contribution frameworkTo estimate the amount of economic activity that is generated by the EO sector, there is an important distinction to be made between those who are dependent on EO data for their activities and those whose activities have been improved by it. Economic activity that is dependent on EO data is data-enabled, whereas economic activity improved by EO data is considered to be data-enhanced. The box below describes this framework in detail.
Data enabled versus data enhancedAdapted from “Measuring the economic value of data and data flows”, OECD, 2020;the concepts of data-enabled and data-enhanced are used to categorise the value of data to businesses and government. The distinction focuses on the core function of the data.
EO data-enabled
This includes users that have developed revenue generation strategies fully reliant on EO data and that would not exist without access to EO data. These users can be public or private in nature. It should be noted, that EO data does not come analysis ready. As such, users that are considered data-enabled are also contributing to the calibration and validation activities that are integral for the use EO data. These users can be public or private. For example, EO data is core to government EO programs – in the absence of the data these programs would not exist.
EO data-enhanced
This encompasses users that exploit data to better coordinate pre-existing business operations, facilitate decision-making and to introduce new goods and services; data does not alter or determine their core business model. For example, an agricultural enterprise can improve productivity through the use of EO data, but EO data is not core to the operation.
Appendix A Economic contribution methodology
59
Economic study into an Australian continuous launch small satellite program for Earth observation
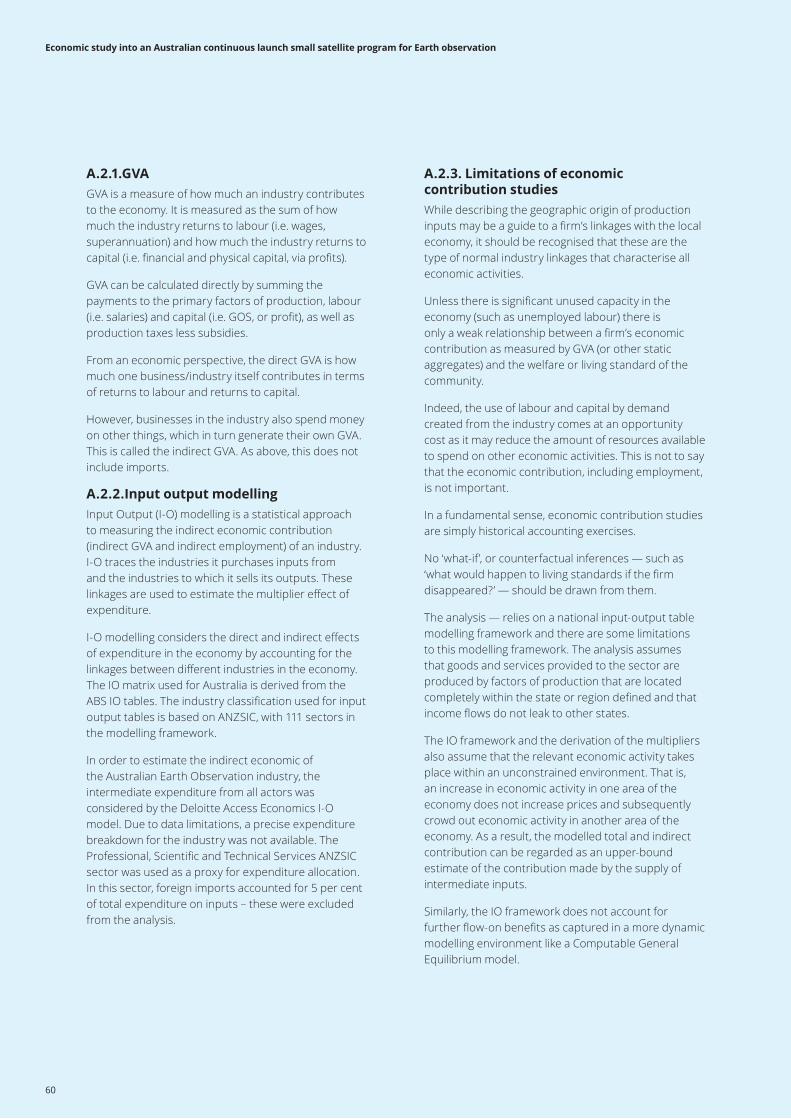
A.2.3. Limitations of economic contribution studiesWhile describing the geographic origin of production inputs may be a guide to a firm’s linkages with the local economy, it should be recognised that these are the type of normal industry linkages that characterise all economic activities.
Unless there is significant unused capacity in the economy (such as unemployed labour) there is only a weak relationship between a firm’s economic contribution as measured by GVA (or other static aggregates) and the welfare or living standard of the community.
Indeed, the use of labour and capital by demand created from the industry comes at an opportunity cost as it may reduce the amount of resources available to spend on other economic activities. This is not to say that the economic contribution, including employment, is not important.
In a fundamental sense, economic contribution studies are simply historical accounting exercises.
No ‘what-if’, or counterfactual inferences — such as ‘what would happen to living standards if the firm disappeared?’ — should be drawn from them.
The analysis — relies on a national input-output table modelling framework and there are some limitations to this modelling framework. The analysis assumes that goods and services provided to the sector are produced by factors of production that are located completely within the state or region defined and that income flows do not leak to other states.
The IO framework and the derivation of the multipliers also assume that the relevant economic activity takes place within an unconstrained environment. That is, an increase in economic activity in one area of the economy does not increase prices and subsequently crowd out economic activity in another area of the economy. As a result, the modelled total and indirect contribution can be regarded as an upper-bound estimate of the contribution made by the supply of intermediate inputs.
Similarly, the IO framework does not account for further flow-on benefits as captured in a more dynamic modelling environment like a Computable General Equilibrium model.
A.2.1.GVAGVA is a measure of how much an industry contributes to the economy. It is measured as the sum of how much the industry returns to labour (i.e. wages, superannuation) and how much the industry returns to capital (i.e. financial and physical capital, via profits).
GVA can be calculated directly by summing the payments to the primary factors of production, labour (i.e. salaries) and capital (i.e. GOS, or profit), as well as production taxes less subsidies.
From an economic perspective, the direct GVA is how much one business/industry itself contributes in terms of returns to labour and returns to capital.
However, businesses in the industry also spend money on other things, which in turn generate their own GVA. This is called the indirect GVA. As above, this does not include imports.
A.2.2.Input output modellingInput Output (I-O) modelling is a statistical approach to measuring the indirect economic contribution (indirect GVA and indirect employment) of an industry. I-O traces the industries it purchases inputs from and the industries to which it sells its outputs. These linkages are used to estimate the multiplier effect of expenditure.
I-O modelling considers the direct and indirect effects of expenditure in the economy by accounting for the linkages between different industries in the economy. The IO matrix used for Australia is derived from the ABS IO tables. The industry classification used for input output tables is based on ANZSIC, with 111 sectors in the modelling framework.
In order to estimate the indirect economic of the Australian Earth Observation industry, the intermediate expenditure from all actors was considered by the Deloitte Access Economics I-O model. Due to data limitations, a precise expenditure breakdown for the industry was not available. The Professional, Scientific and Technical Services ANZSIC sector was used as a proxy for expenditure allocation. In this sector, foreign imports accounted for 5 per cent of total expenditure on inputs – these were excluded from the analysis.
60
Economic study into an Australian continuous launch small satellite program for Earth observation
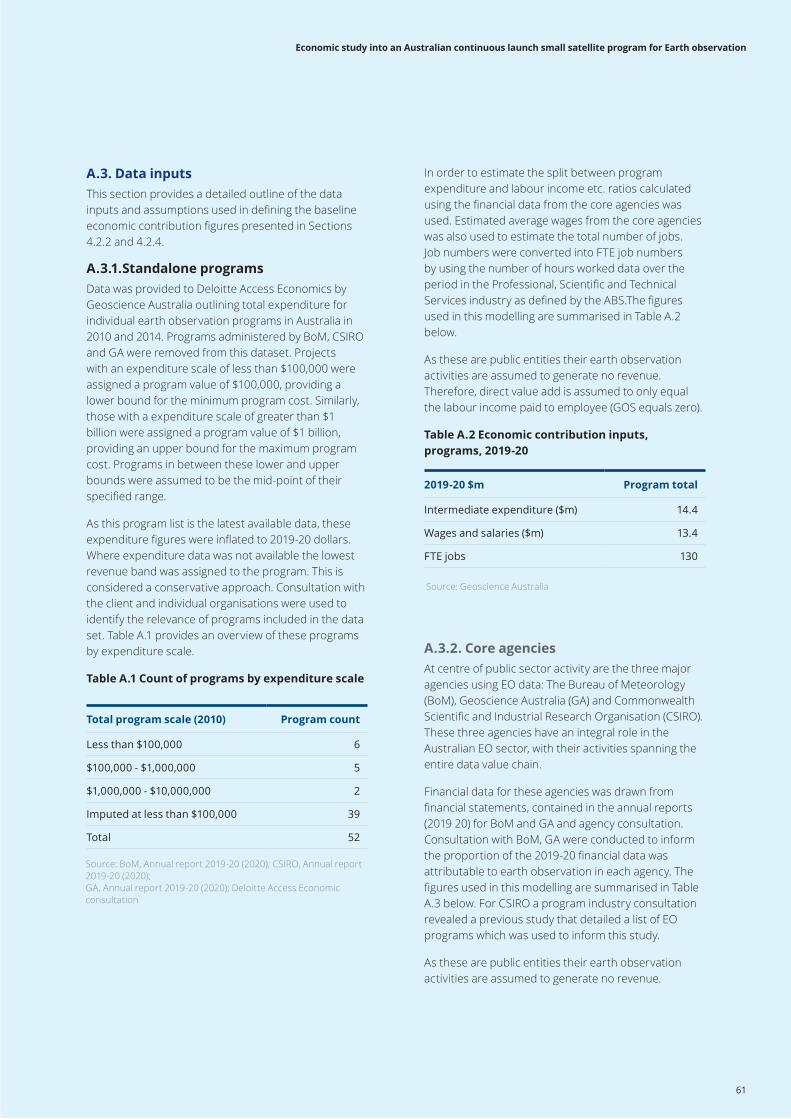
In order to estimate the split between program expenditure and labour income etc. ratios calculated using the financial data from the core agencies was used. Estimated average wages from the core agencies was also used to estimate the total number of jobs. Job numbers were converted into FTE job numbers by using the number of hours worked data over the period in the Professional, Scientific and Technical Services industry as defined by the ABS.The figures used in this modelling are summarised in Table A.2 below.
As these are public entities their earth observation activities are assumed to generate no revenue. Therefore, direct value add is assumed to only equal the labour income paid to employee (GOS equals zero).
Table A.2 Economic contribution inputs, programs, 2019-20
A.3. Data inputsThis section provides a detailed outline of the data inputs and assumptions used in defining the baseline economic contribution figures presented in Sections 4.2.2 and 4.2.4.
A.3.1.Standalone programsData was provided to Deloitte Access Economics by Geoscience Australia outlining total expenditure for individual earth observation programs in Australia in 2010 and 2014. Programs administered by BoM, CSIRO and GA were removed from this dataset. Projects with an expenditure scale of less than $100,000 were assigned a program value of $100,000, providing a lower bound for the minimum program cost. Similarly, those with a expenditure scale of greater than $1 billion were assigned a program value of $1 billion, providing an upper bound for the maximum program cost. Programs in between these lower and upper bounds were assumed to be the mid-point of their specified range.
As this program list is the latest available data, these expenditure figures were inflated to 2019-20 dollars. Where expenditure data was not available the lowest revenue band was assigned to the program. This is considered a conservative approach. Consultation with the client and individual organisations were used to identify the relevance of programs included in the data set. Table A.1 provides an overview of these programs by expenditure scale.
Table A.1 Count of programs by expenditure scale
Source: BoM, Annual report 2019-20 (2020); CSIRO, Annual report 2019-20 (2020); GA, Annual report 2019-20 (2020); Deloitte Access Economic consultation
Source: Geoscience Australia
Total program scale (2010) Program count
Less than $100,000 6
$100,000 - $1,000,000 5
$1,000,000 - $10,000,000 2
Imputed at less than $100,000 39
Total 52
2019-20 $m Program total
Intermediate expenditure ($m) 14.4
Wages and salaries ($m) 13.4
FTE jobs 130
A.3.2. Core agenciesAt centre of public sector activity are the three major agencies using EO data: The Bureau of Meteorology (BoM), Geoscience Australia (GA) and Commonwealth Scientific and Industrial Research Organisation (CSIRO). These three agencies have an integral role in the Australian EO sector, with their activities spanning the entire data value chain.
Financial data for these agencies was drawn from financial statements, contained in the annual reports (2019 20) for BoM and GA and agency consultation. Consultation with BoM, GA were conducted to inform the proportion of the 2019-20 financial data was attributable to earth observation in each agency. The figures used in this modelling are summarised in Table A.3 below. For CSIRO a program industry consultation revealed a previous study that detailed a list of EO programs which was used to inform this study.
As these are public entities their earth observation activities are assumed to generate no revenue.
61
Economic study into an Australian continuous launch small satellite program for Earth observation
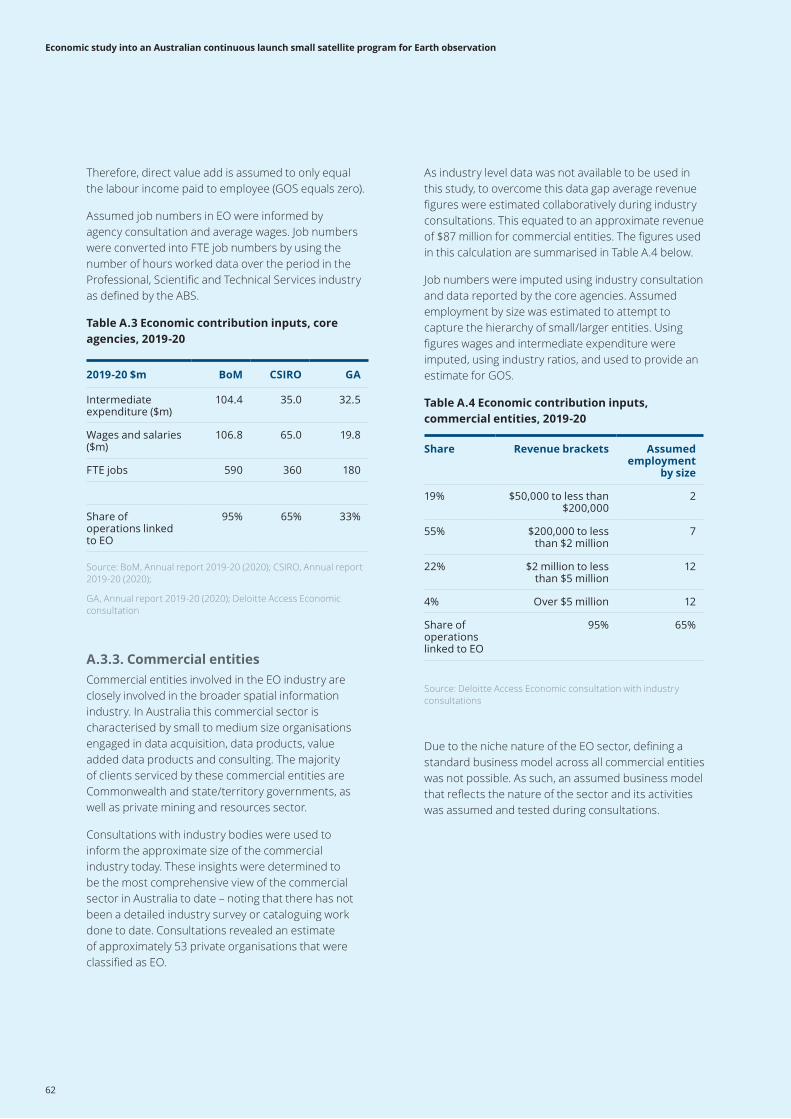
As industry level data was not available to be used in this study, to overcome this data gap average revenue figures were estimated collaboratively during industry consultations. This equated to an approximate revenue of $87 million for commercial entities. The figures used in this calculation are summarised in Table A.4 below.
Job numbers were imputed using industry consultation and data reported by the core agencies. Assumed employment by size was estimated to attempt to capture the hierarchy of small/larger entities. Using figures wages and intermediate expenditure were imputed, using industry ratios, and used to provide an estimate for GOS.
Table A.4 Economic contribution inputs, commercial entities, 2019-20
Therefore, direct value add is assumed to only equal the labour income paid to employee (GOS equals zero).
Assumed job numbers in EO were informed by agency consultation and average wages. Job numbers were converted into FTE job numbers by using the number of hours worked data over the period in the Professional, Scientific and Technical Services industry as defined by the ABS.
Table A.3 Economic contribution inputs, core agencies, 2019-20
2019-20 $m BoM CSIRO GA
Intermediate expenditure ($m)
104.4 35.0 32.5
Wages and salaries ($m)
106.8 65.0 19.8
FTE jobs 590 360 180
Share of operations linked to EO
95% 65% 33%
Share Revenue brackets Assumed employment
by size
19% $50,000 to less than $200,000
2
55% $200,000 to less than $2 million
7
22% $2 million to less than $5 million
12
4% Over $5 million 12
Share of operations linked to EO
95% 65%
Source: BoM, Annual report 2019-20 (2020); CSIRO, Annual report 2019-20 (2020);
GA, Annual report 2019-20 (2020); Deloitte Access Economic consultation
Source: Deloitte Access Economic consultation with industry consultations
A.3.3. Commercial entitiesCommercial entities involved in the EO industry are closely involved in the broader spatial information industry. In Australia this commercial sector is characterised by small to medium size organisations engaged in data acquisition, data products, value added data products and consulting. The majority of clients serviced by these commercial entities are Commonwealth and state/territory governments, as well as private mining and resources sector.
Consultations with industry bodies were used to inform the approximate size of the commercial industry today. These insights were determined to be the most comprehensive view of the commercial sector in Australia to date – noting that there has not been a detailed industry survey or cataloguing work done to date. Consultations revealed an estimate of approximately 53 private organisations that were classified as EO.
Due to the niche nature of the EO sector, defining a standard business model across all commercial entities was not possible. As such, an assumed business model that reflects the nature of the sector and its activities was assumed and tested during consultations.
62
Economic study into an Australian continuous launch small satellite program for Earth observation
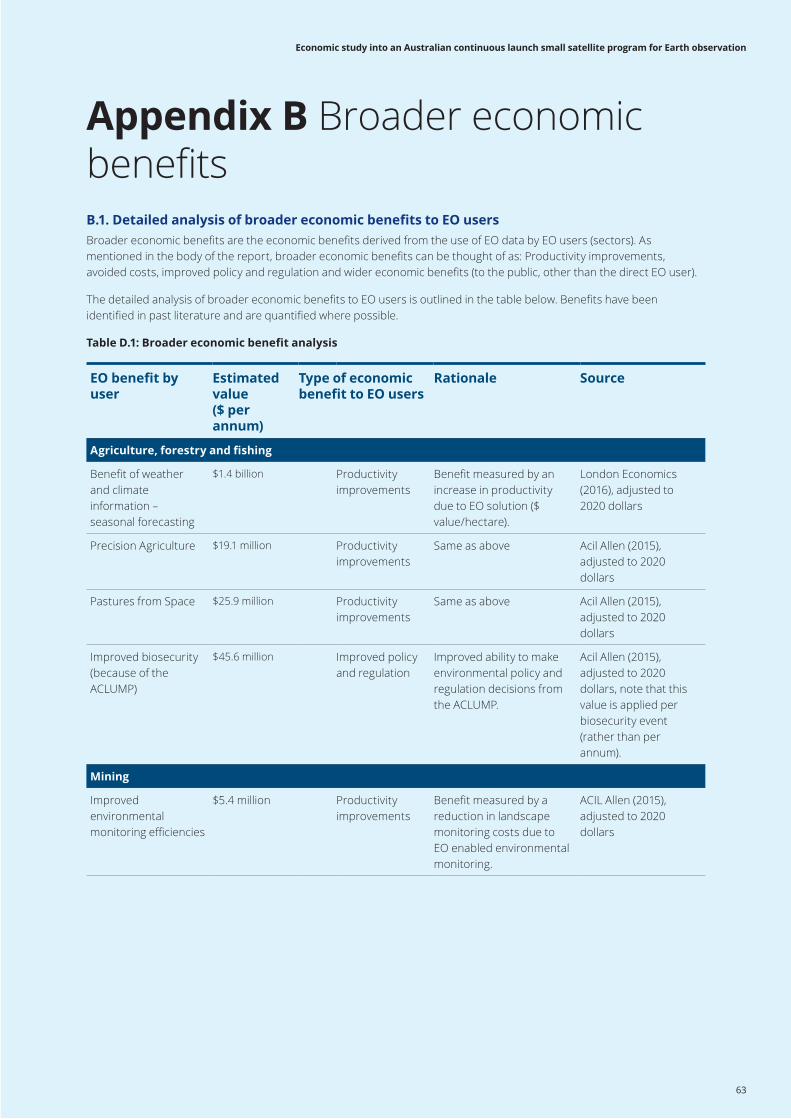
B.1. Detailed analysis of broader economic benefits to EO usersBroader economic benefits are the economic benefits derived from the use of EO data by EO users (sectors). As mentioned in the body of the report, broader economic benefits can be thought of as: Productivity improvements, avoided costs, improved policy and regulation and wider economic benefits (to the public, other than the direct EO user).
The detailed analysis of broader economic benefits to EO users is outlined in the table below. Benefits have been identified in past literature and are quantified where possible.
Table D.1: Broader economic benefit analysis
Appendix B Broader economic benefits
EO benefit by user
Estimated value ($ per annum)
Type of economic benefit to EO users
Rationale Source
Agriculture, forestry and fishing
Benefit of weather and climate information – seasonal forecasting
$1.4 billion Productivity improvements
Benefit measured by an increase in productivity due to EO solution ($ value/hectare).
London Economics (2016), adjusted to 2020 dollars
Precision Agriculture $19.1 million Productivity improvements
Same as above Acil Allen (2015), adjusted to 2020 dollars
Pastures from Space $25.9 million Productivity improvements
Same as above Acil Allen (2015), adjusted to 2020 dollars
Improved biosecurity (because of the ACLUMP)
$45.6 million Improved policy and regulation
Improved ability to make environmental policy and regulation decisions from the ACLUMP.
Acil Allen (2015), adjusted to 2020 dollars, note that this value is applied per biosecurity event (rather than per annum).
Mining
Improved environmental monitoring efficiencies
$5.4 million Productivity improvements
Benefit measured by a reduction in landscape monitoring costs due to EO enabled environmental monitoring.
ACIL Allen (2015), adjusted to 2020 dollars
63
Economic study into an Australian continuous launch small satellite program for Earth observation
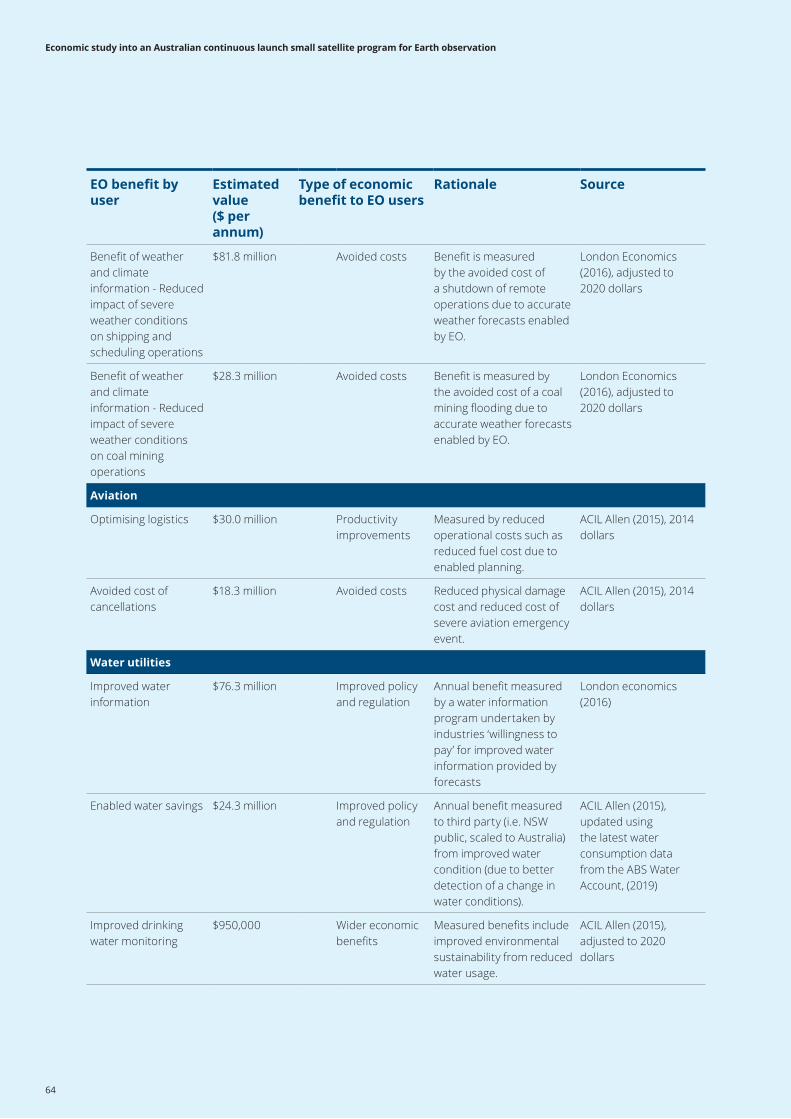
EO benefit by user
Estimated value ($ per annum)
Type of economic benefit to EO users
Rationale Source
Benefit of weather and climate information - Reduced impact of severe weather conditions on shipping and scheduling operations
$81.8 million Avoided costs Benefit is measured by the avoided cost of a shutdown of remote operations due to accurate weather forecasts enabled by EO.
London Economics (2016), adjusted to 2020 dollars
Benefit of weather and climate information - Reduced impact of severe weather conditions on coal mining operations
$28.3 million Avoided costs Benefit is measured by the avoided cost of a coal mining flooding due to accurate weather forecasts enabled by EO.
London Economics (2016), adjusted to 2020 dollars
Aviation
Optimising logistics $30.0 million Productivity improvements
Measured by reduced operational costs such as reduced fuel cost due to enabled planning.
ACIL Allen (2015), 2014 dollars
Avoided cost of cancellations
$18.3 million Avoided costs Reduced physical damage cost and reduced cost of severe aviation emergency event.
ACIL Allen (2015), 2014 dollars
Water utilities
Improved water information
$76.3 million Improved policy and regulation
Annual benefit measured by a water information program undertaken by industries ‘willingness to pay’ for improved water information provided by forecasts
London economics (2016)
Enabled water savings $24.3 million Improved policy and regulation
Annual benefit measured to third party (i.e. NSW public, scaled to Australia) from improved water condition (due to better detection of a change in water conditions).
ACIL Allen (2015), updated using the latest water consumption data from the ABS Water Account, (2019)
Improved drinking water monitoring
$950,000 Wider economic benefits
Measured benefits include improved environmental sustainability from reduced water usage.
ACIL Allen (2015), adjusted to 2020 dollars
64
Economic study into an Australian continuous launch small satellite program for Earth observation
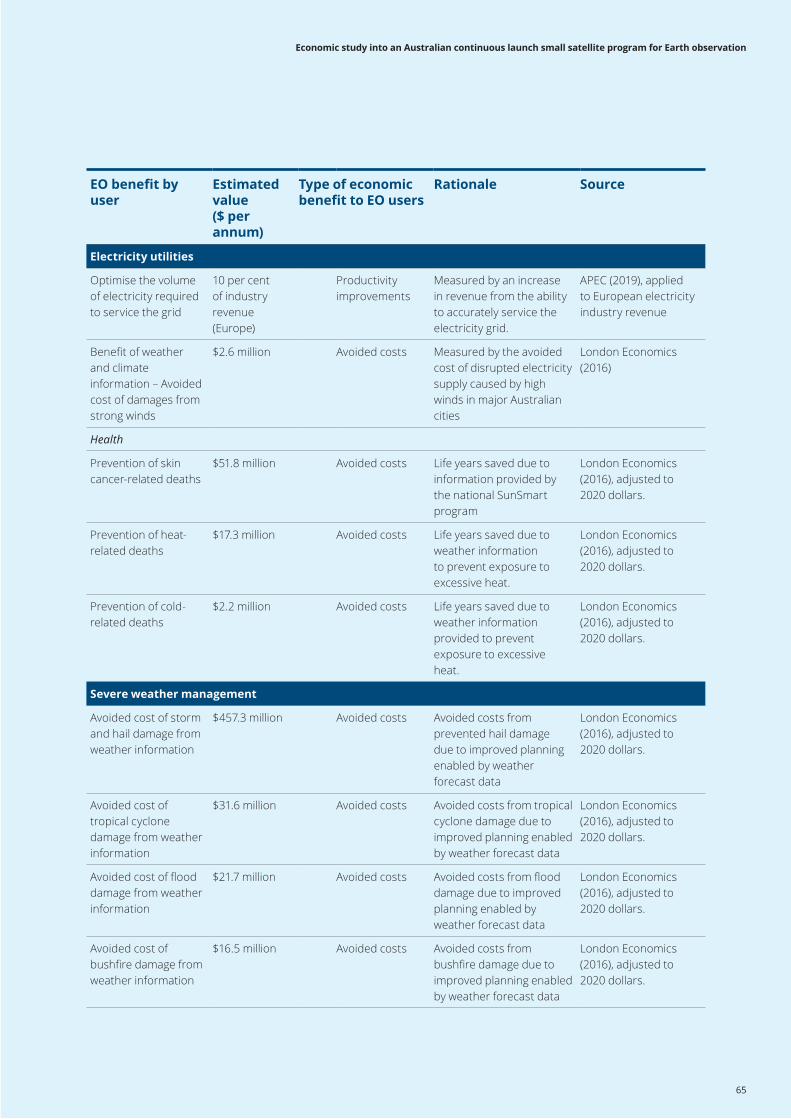
EO benefit by user
Estimated value ($ per annum)
Type of economic benefit to EO users
Rationale Source
Electricity utilities
Optimise the volume of electricity required to service the grid
10 per cent of industry revenue (Europe)
Productivity improvements
Measured by an increase in revenue from the ability to accurately service the electricity grid.
APEC (2019), applied to European electricity industry revenue
Benefit of weather and climate information – Avoided cost of damages from strong winds
$2.6 million Avoided costs Measured by the avoided cost of disrupted electricity supply caused by high winds in major Australian cities
London Economics (2016)
Health
Prevention of skin cancer-related deaths
$51.8 million Avoided costs Life years saved due to information provided by the national SunSmart program
London Economics (2016), adjusted to 2020 dollars.
Prevention of heat-related deaths
$17.3 million Avoided costs Life years saved due to weather information to prevent exposure to excessive heat.
London Economics (2016), adjusted to 2020 dollars.
Prevention of cold-related deaths
$2.2 million Avoided costs Life years saved due to weather information provided to prevent exposure to excessive heat.
London Economics (2016), adjusted to 2020 dollars.
Severe weather management
Avoided cost of storm and hail damage from weather information
$457.3 million Avoided costs Avoided costs from prevented hail damage due to improved planning enabled by weather forecast data
London Economics (2016), adjusted to 2020 dollars.
Avoided cost of tropical cyclone damage from weather information
$31.6 million Avoided costs Avoided costs from tropical cyclone damage due to improved planning enabled by weather forecast data
London Economics (2016), adjusted to 2020 dollars.
Avoided cost of flood damage from weather information
$21.7 million Avoided costs Avoided costs from flood damage due to improved planning enabled by weather forecast data
London Economics (2016), adjusted to 2020 dollars.
Avoided cost of bushfire damage from weather information
$16.5 million Avoided costs Avoided costs from bushfire damage due to improved planning enabled by weather forecast data
London Economics (2016), adjusted to 2020 dollars.
65
Economic study into an Australian continuous launch small satellite program for Earth observation
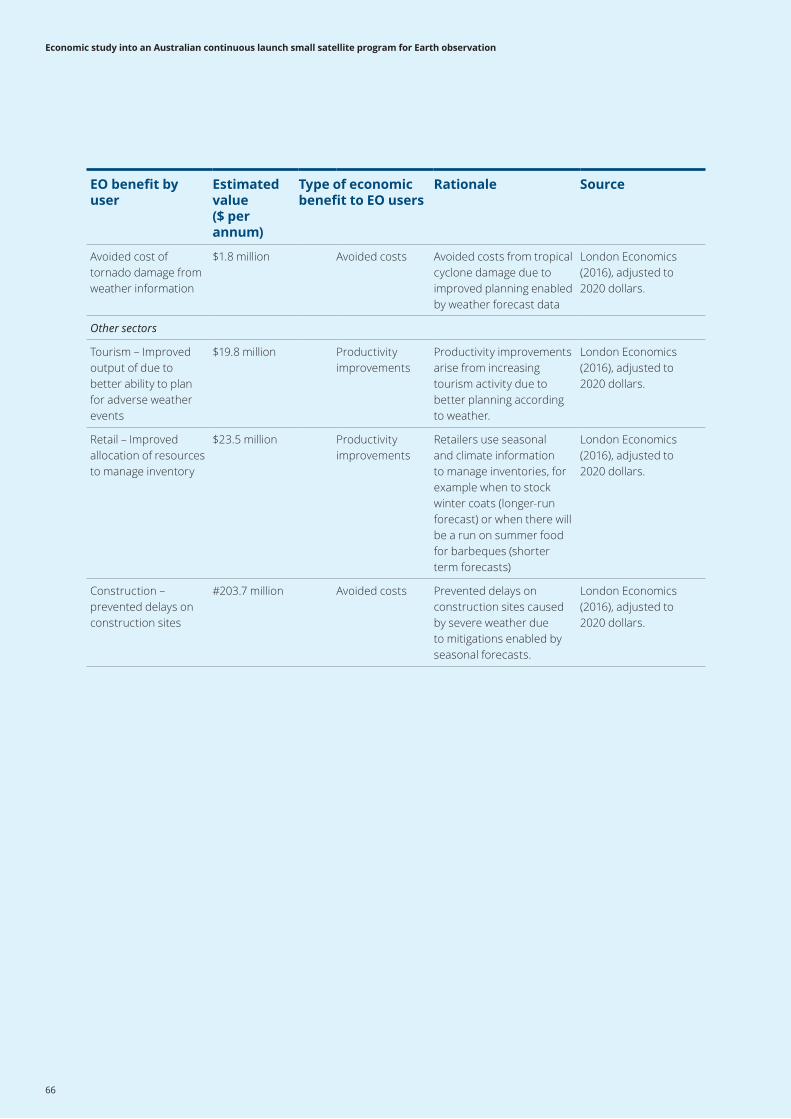
EO benefit by user
Estimated value ($ per annum)
Type of economic benefit to EO users
Rationale Source
Avoided cost of tornado damage from weather information
$1.8 million Avoided costs Avoided costs from tropical cyclone damage due to improved planning enabled by weather forecast data
London Economics (2016), adjusted to 2020 dollars.
Other sectors
Tourism – Improved output of due to better ability to plan for adverse weather events
$19.8 million Productivity improvements
Productivity improvements arise from increasing tourism activity due to better planning according to weather.
London Economics (2016), adjusted to 2020 dollars.
Retail – Improved allocation of resources to manage inventory
$23.5 million Productivity improvements
Retailers use seasonal and climate information to manage inventories, for example when to stock winter coats (longer-run forecast) or when there will be a run on summer food for barbeques (shorter term forecasts)
London Economics (2016), adjusted to 2020 dollars.
Construction – prevented delays on construction sites
#203.7 million Avoided costs Prevented delays on construction sites caused by severe weather due to mitigations enabled by seasonal forecasts.
London Economics (2016), adjusted to 2020 dollars.
66
Economic study into an Australian continuous launch small satellite program for Earth observation
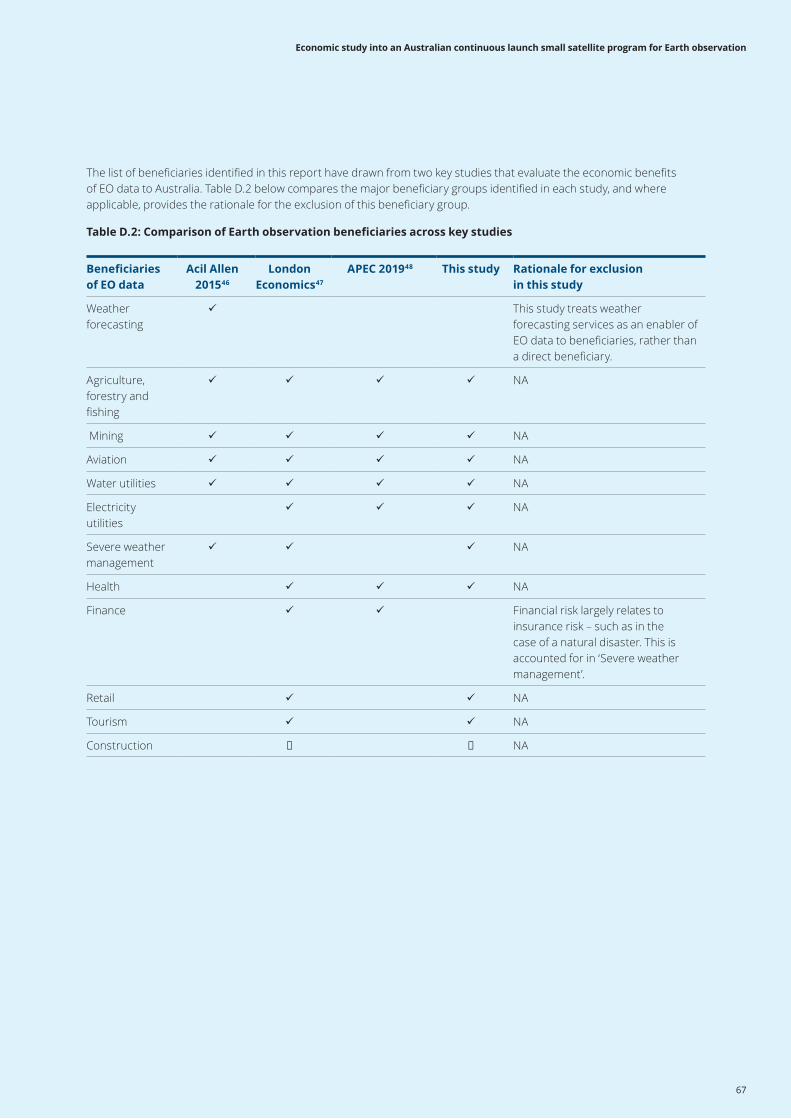
The list of beneficiaries identified in this report have drawn from two key studies that evaluate the economic benefits of EO data to Australia. Table D.2 below compares the major beneficiary groups identified in each study, and where applicable, provides the rationale for the exclusion of this beneficiary group.
Table D.2: Comparison of Earth observation beneficiaries across key studies
Beneficiaries of EO data
Acil Allen 201546
London Economics47
APEC 201948 This study Rationale for exclusion in this study
Weather forecasting
This study treats weather forecasting services as an enabler of EO data to beneficiaries, rather than a direct beneficiary.
Agriculture, forestry and fishing
NA
Mining NA
Aviation NA
Water utilities NA
Electricity utilities
NA
Severe weather management
NA
Health NA
Finance Financial risk largely relates to insurance risk – such as in the case of a natural disaster. This is accounted for in ‘Severe weather management’.
Retail NA
Tourism NA
Construction NA
67
Economic study into an Australian continuous launch small satellite program for Earth observation
B.2. Benefits to users of Earth observation dataThis section provides the rationale for considering the remaining benefits of Earth observation summarised in Section 4.3 in the body of the report. These sectors including mining, aviation, water utilities, electricity utilities, health, retail, tourism, and construction.
CASE STUDY: MININGDescriptionThe cost of resource extraction to the environment can be extensive if not monitored carefully. Mining industries are required monitor the operational environment to ensure they minimise the environmental impact of their operations. EO enables improved environmental monitoring efficiencies by way of ocean land and arial surveys. Without EO support, the labour costs associated with monitoring activities are higher and activities are more time-consuming, delaying the time required to plan and gain approvals.
A key example how EO is used for the environmental monitoring of mining operations is offshore oil spill events. While EOS provides more confidence in the tracking and monitoring of vessel sourced pollution, it is not the sole technology used in monitoring oil spill incidents or for arranging the response to them.
Offshore oil and gas operations rely on a large range of EO weather products to reduce the impact of severe weather conditions on shipping and scheduling operations. For example, Woodside Petroleum’s North West Shelf operations receive feeds from BoM to monitor the projected paths of severe weather events for LNG tankers. This knowledge enables operators to make well-informed decisions to choose an alternative route and limit the total time lost for a tanker to avoid severe weather or implement a storm avoidance operation to avoid severe damages.
In particular, mining activities can be disrupted by flooding as flooded pits cannot be mined. Costs are incurred in order to dewater the pits, repair equipment and to ensure workforce safety. Accurate Weather forecasting enhances the ability of coal miners to mitigate the risk of floods, and therefore reduce the impact of severe weather conditions on coal mining operations.
Benefits The literature identifies three key benefits to mining, described above. The value of EO data to mining is upwards of $28 million per annum (in 2020 dollars). 49,50
Productivity improvements
Improved environmental monitoring efficiencies ($5.4 million). Earth observation reduces the cost of environmental monitoring and enables improved shipping logistics to reduce the time lost to severe weather events.
Avoided costs
Benefit of weather and climate information - Reduced impact of severe weather conditions on shipping and scheduling operations ($81.8 million). Avoided costs of severe weather events, such as physical damages avoided and the cost of implementing a storm avoidance plan for the oil and gas sector.
Benefit of weather and climate information - Reduced impact of severe weather conditions on coal mining operations ($28.3 million). Avoided costs due to improved planning to prevent damages from flooded coal mines.
68
Economic study into an Australian continuous launch small satellite program for Earth observation
CASE STUDY: AVIATIONDescription
Severe weather events are a significant concern to the aviation industry, as they may cause costly delays and cancellations to flights, damage to the aircraft, or in extreme cases, a loss of life. Severe weather events that are a concern to the airline industry in Australia include cyclones, severe storms, ice storms and volcanic ash events.
Earth observation data supports the aviation industry by enabling better planning that is required to adapt flight paths to divert severe weather. Accurate weather warnings provide the aviation industry with the foresight to minimise the additional time spent in the air because of severe weather event diversions. Operators can more efficiently optimise logistics by reducing the operational cost of a diverted flight – for example, by reducing the volume (and hence, the cost) of extra fuel required. Better informed decision-making may also enable aviation operators to minimise the number of cancellations while maintaining passenger’s safety, reducing the cost of cancellations.
Other avoided costs associated with severe weather events include avoided physical damages from diverting the flight path and the avoided cost of implementing a storm avoidance plan.
Benefits The literature identifies two key benefits to aviation, described above. The value of EO benefits to the aviation sector is upwards of $30 million per annum (in 2014 dollars). 51
Productivity improvements
Optimised logistics ($30.0 million). Fuel savings (in terms of reduced carriage of contingency fuel) achieved by Australian airlines landing at Australian airports due to aerodrome forecasts
Avoided costs
Reduced cost of delays and cancellations ($18.3 million). Weather forecasting enables airlines to avoid cancelling flights due to severe weather events while maintaining passenger safety.
Avoided severe weather events such as volcanic ash events. Weather forecasting enables airlines to avoid entering into dangerous weather that may impact the safety of passengers.
69
Economic study into an Australian continuous launch small satellite program for Earth observation
CASE STUDY: WATER UTILITIESDescriptionEarth observation data is used to monitor the condition of drinking water in NSW, enabling wider economic benefits to the public from improving drinking water conditions. Satellite-enabled technology is able to examine vegetation conditions and disturbance, for example, after a catastrophic bushfire event. It is also able to monitor land cover changes and identify sources of water pollution, enabling better detection of a change in water conditions, and therefore avoided health costs from poor water quality consumption. Wider economic benefits to the Australian public are estimated at around $24 million.
Earth observation technology can also facilitate more efficient water usage by improved modelling of water irrigation needs. Satellite-enabled water modelling is able to detect unnecessary releases from water storages and irrigators with great precision – leading to wider economic benefits to the public from improved water savings. This is just of multiple ways EO can reduce surface and groundwater use.
The Water Act 2007 entrusted the Bureau with the responsibility of compiling, managing, interpreting, and disseminating comprehensive water information across Australia. The water information program leads to standardisation and quality improvements in available water information, and information which can be more easily accessed. The improved water information, enables an improved understanding of current and future water availability and water hazards enabled by the program.
Benefits are also derived from government-led water management research programs. For example, CSIRO undertook six water management programs to improve the sustainability of regional water supplies in South Western Australia, Northern Australia, Tasmania, the Great Artisan Basin and the Murray Darling Basin, enabling better management of water. The value of these programs considered in the economic contribution of Australia’s Earth observation industry (chapter 4).
Benefits The literature identifies three key benefits to mining, described above. The value of EO data to mining is upwards of $28 million per annum (in 2020 dollars). 49,50
Improved policy and regulation
Improved water information ($76.3 million). Value of the water information program to reduce industry costs and the risk of infrastructure damage and improved consistency of water monitoring standards between regulatory bodies.
Enabled water savings ($24.3 million). Satellite-enabled modelling detects unnecessary releases from water storage and irrigators, enabling better regulation to preserve water for future use.
Wider economic benefits
Improved drinking water monitoring ($950,000). Improved monitoring of drinking water ensures the public is provided with good quality drinking water, enabling public benefits such as avoided health costs from water contamination.
70
Economic study into an Australian continuous launch small satellite program for Earth observation
CASE STUDY: ELECTICITY UTILITIESDescription
Solar power is an increasingly substantial contributor to the electricity demand-supply balance, with more than 2 million solar photovoltaic (PV) rooftop systems contributing to the electricity grid in 2020. While solar PV systems significantly reduce the carbon footprint of Australian electricity use, it is a highly variable source of energy without sufficient battery storage. For example, on 14 August 2016 Perth, Western Australia set a record where daytime electricity demand was lower than night time electricity demand.
Due to the high volatility of electricity production using current PV systems, there is an increasing need to quantify the total power output from solar PV systems and predict big changes ahead of time, so that electricity producers can better manage demand for electricity and more efficiently service the grid. Solar forecasting models using Earth observation technology are currently being developed in Australia to optimise the volume of electricity required to service the grid.
Benefits The literature identifies two key benefits to aviation, described above. The value of EO benefits to the aviation sector is upwards of $30 million per annum (in 2014 dollars). 51
Productivity improvements
Optimise the volume of electricity required to service the grid (10 per cent of the sector’s revenue). Solar forecasting models using EO data enables electricity management to better predict the level of energy produced by the grid, reducing operational costs of supplying supplementary electricity.
Avoided costs
Benefit of weather and climate information – Avoided cost of damages from strong winds ($2.6 million). Improved planning & prevented costs of disrupted electricity supply caused by high winds in major Australian cities due to mitigation actions enabled by seasonal forecasts
71
Economic study into an Australian continuous launch small satellite program for Earth observation
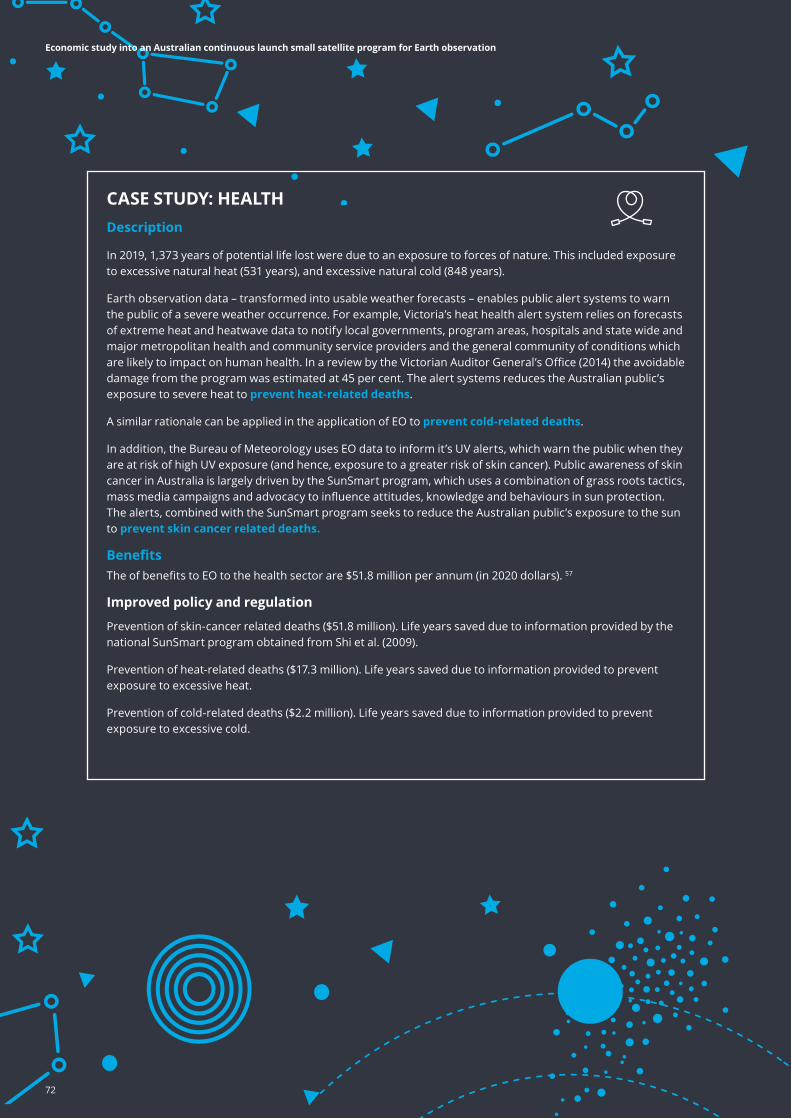
CASE STUDY: HEALTHDescription
In 2019, 1,373 years of potential life lost were due to an exposure to forces of nature. This included exposure to excessive natural heat (531 years), and excessive natural cold (848 years).
Earth observation data – transformed into usable weather forecasts – enables public alert systems to warn the public of a severe weather occurrence. For example, Victoria’s heat health alert system relies on forecasts of extreme heat and heatwave data to notify local governments, program areas, hospitals and state wide and major metropolitan health and community service providers and the general community of conditions which are likely to impact on human health. In a review by the Victorian Auditor General’s Office (2014) the avoidable damage from the program was estimated at 45 per cent. The alert systems reduces the Australian public’s exposure to severe heat to prevent heat-related deaths.
A similar rationale can be applied in the application of EO to prevent cold-related deaths.
In addition, the Bureau of Meteorology uses EO data to inform it’s UV alerts, which warn the public when they are at risk of high UV exposure (and hence, exposure to a greater risk of skin cancer). Public awareness of skin cancer in Australia is largely driven by the SunSmart program, which uses a combination of grass roots tactics, mass media campaigns and advocacy to influence attitudes, knowledge and behaviours in sun protection. The alerts, combined with the SunSmart program seeks to reduce the Australian public’s exposure to the sun to prevent skin cancer related deaths.
Benefits The of benefits to EO to the health sector are $51.8 million per annum (in 2020 dollars). 57
Improved policy and regulation
Prevention of skin-cancer related deaths ($51.8 million). Life years saved due to information provided by the national SunSmart program obtained from Shi et al. (2009).
Prevention of heat-related deaths ($17.3 million). Life years saved due to information provided to prevent exposure to excessive heat.
Prevention of cold-related deaths ($2.2 million). Life years saved due to information provided to prevent exposure to excessive cold.
72
Economic study into an Australian continuous launch small satellite program for Earth observation
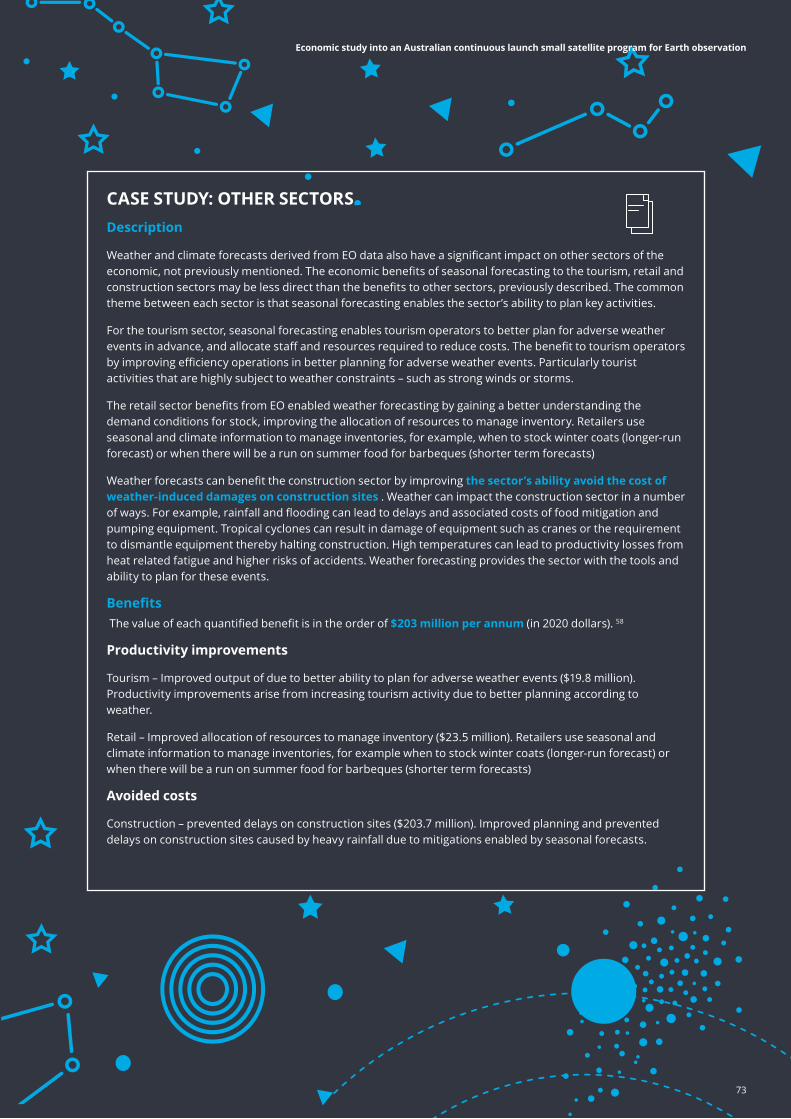
CASE STUDY: OTHER SECTORSDescription
Weather and climate forecasts derived from EO data also have a significant impact on other sectors of the economic, not previously mentioned. The economic benefits of seasonal forecasting to the tourism, retail and construction sectors may be less direct than the benefits to other sectors, previously described. The common theme between each sector is that seasonal forecasting enables the sector’s ability to plan key activities.
For the tourism sector, seasonal forecasting enables tourism operators to better plan for adverse weather events in advance, and allocate staff and resources required to reduce costs. The benefit to tourism operators by improving efficiency operations in better planning for adverse weather events. Particularly tourist activities that are highly subject to weather constraints – such as strong winds or storms.
The retail sector benefits from EO enabled weather forecasting by gaining a better understanding the demand conditions for stock, improving the allocation of resources to manage inventory. Retailers use seasonal and climate information to manage inventories, for example, when to stock winter coats (longer-run forecast) or when there will be a run on summer food for barbeques (shorter term forecasts)
Weather forecasts can benefit the construction sector by improving the sector’s ability avoid the cost of weather-induced damages on construction sites . Weather can impact the construction sector in a number of ways. For example, rainfall and flooding can lead to delays and associated costs of food mitigation and pumping equipment. Tropical cyclones can result in damage of equipment such as cranes or the requirement to dismantle equipment thereby halting construction. High temperatures can lead to productivity losses from heat related fatigue and higher risks of accidents. Weather forecasting provides the sector with the tools and ability to plan for these events.
Benefits The value of each quantified benefit is in the order of $203 million per annum (in 2020 dollars). 58
Productivity improvements
Tourism – Improved output of due to better ability to plan for adverse weather events ($19.8 million). Productivity improvements arise from increasing tourism activity due to better planning according to weather.
Retail – Improved allocation of resources to manage inventory ($23.5 million). Retailers use seasonal and climate information to manage inventories, for example when to stock winter coats (longer-run forecast) or when there will be a run on summer food for barbeques (shorter term forecasts)
Avoided costs
Construction – prevented delays on construction sites ($203.7 million). Improved planning and prevented delays on construction sites caused by heavy rainfall due to mitigations enabled by seasonal forecasts.
73
Economic study into an Australian continuous launch small satellite program for Earth observation
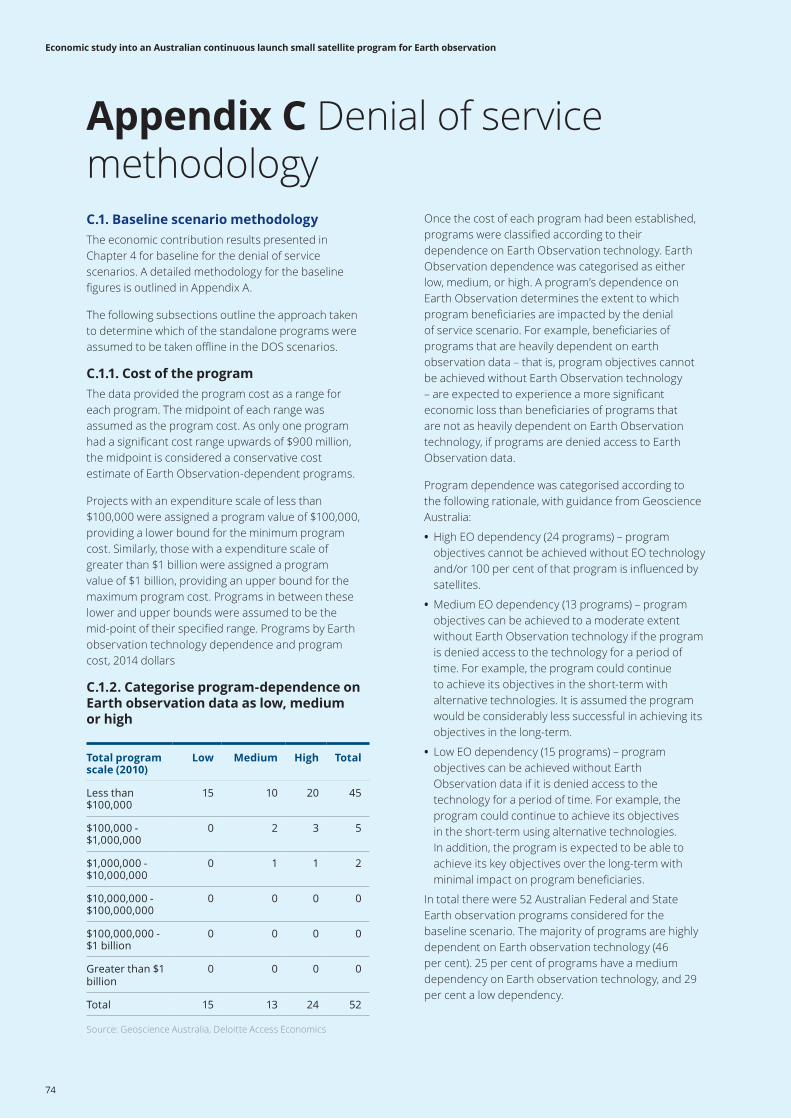
C.1. Baseline scenario methodologyThe economic contribution results presented in Chapter 4 for baseline for the denial of service scenarios. A detailed methodology for the baseline figures is outlined in Appendix A.
The following subsections outline the approach taken to determine which of the standalone programs were assumed to be taken offline in the DOS scenarios.
C.1.1. Cost of the programThe data provided the program cost as a range for each program. The midpoint of each range was assumed as the program cost. As only one program had a significant cost range upwards of $900 million, the midpoint is considered a conservative cost estimate of Earth Observation-dependent programs.
Projects with an expenditure scale of less than $100,000 were assigned a program value of $100,000, providing a lower bound for the minimum program cost. Similarly, those with a expenditure scale of greater than $1 billion were assigned a program value of $1 billion, providing an upper bound for the maximum program cost. Programs in between these lower and upper bounds were assumed to be the mid-point of their specified range. Programs by Earth observation technology dependence and program cost, 2014 dollars
C.1.2. Categorise program-dependence on Earth observation data as low, medium or high
Appendix C Denial of service methodology
Total program scale (2010)
Low Medium High Total
Less than $100,000
15 10 20 45
$100,000 - $1,000,000
0 2 3 5
$1,000,000 - $10,000,000
0 1 1 2
$10,000,000 - $100,000,000
0 0 0 0
$100,000,000 - $1 billion
0 0 0 0
Greater than $1 billion
0 0 0 0
Total 15 13 24 52
Source: Geoscience Australia, Deloitte Access Economics
Once the cost of each program had been established, programs were classified according to their dependence on Earth Observation technology. Earth Observation dependence was categorised as either low, medium, or high. A program’s dependence on Earth Observation determines the extent to which program beneficiaries are impacted by the denial of service scenario. For example, beneficiaries of programs that are heavily dependent on earth observation data – that is, program objectives cannot be achieved without Earth Observation technology – are expected to experience a more significant economic loss than beneficiaries of programs that are not as heavily dependent on Earth Observation technology, if programs are denied access to Earth Observation data.
Program dependence was categorised according to the following rationale, with guidance from Geoscience Australia:
• High EO dependency (24 programs) – program objectives cannot be achieved without EO technology and/or 100 per cent of that program is influenced by satellites.
• Medium EO dependency (13 programs) – program objectives can be achieved to a moderate extent without Earth Observation technology if the program is denied access to the technology for a period of time. For example, the program could continue to achieve its objectives in the short-term with alternative technologies. It is assumed the program would be considerably less successful in achieving its objectives in the long-term.
• Low EO dependency (15 programs) – program objectives can be achieved without Earth Observation data if it is denied access to the technology for a period of time. For example, the program could continue to achieve its objectives in the short-term using alternative technologies. In addition, the program is expected to be able to achieve its key objectives over the long-term with minimal impact on program beneficiaries.
In total there were 52 Australian Federal and State Earth observation programs considered for the baseline scenario. The majority of programs are highly dependent on Earth observation technology (46 per cent). 25 per cent of programs have a medium dependency on Earth observation technology, and 29 per cent a low dependency.
74
Economic study into an Australian continuous launch small satellite program for Earth observation
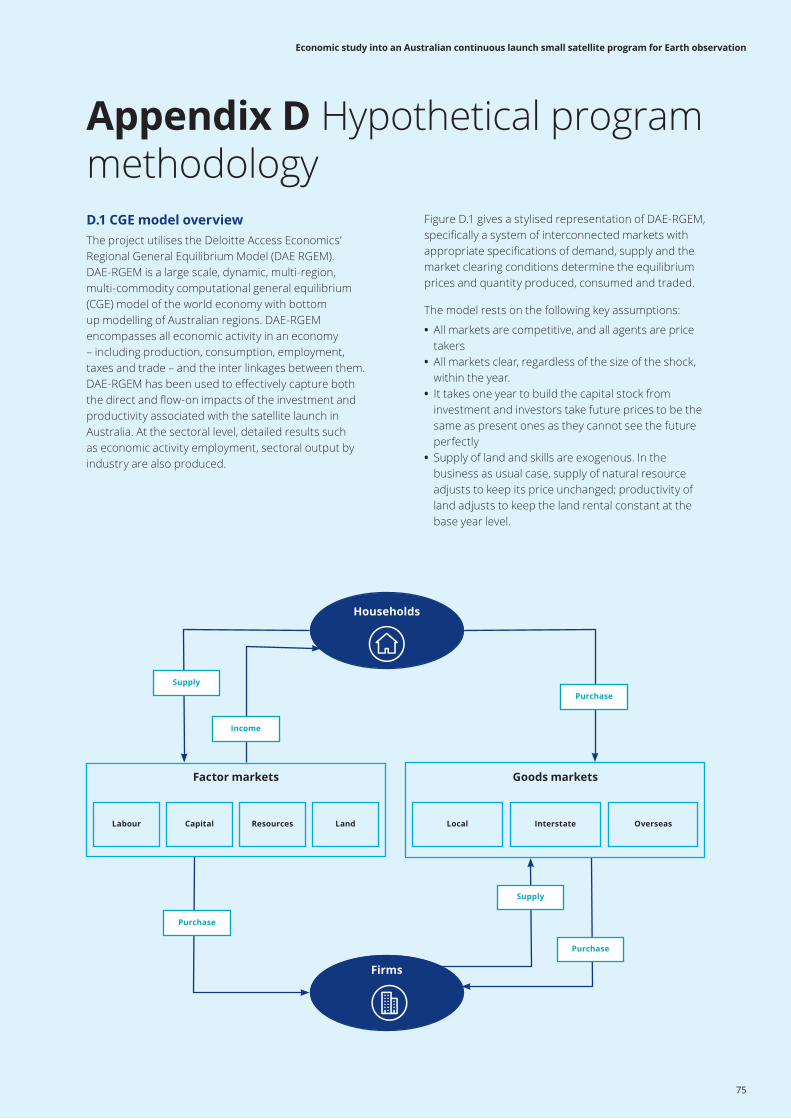
D.1 CGE model overviewThe project utilises the Deloitte Access Economics’ Regional General Equilibrium Model (DAE RGEM). DAE-RGEM is a large scale, dynamic, multi-region, multi-commodity computational general equilibrium (CGE) model of the world economy with bottom up modelling of Australian regions. DAE-RGEM encompasses all economic activity in an economy – including production, consumption, employment, taxes and trade – and the inter linkages between them. DAE-RGEM has been used to effectively capture both the direct and flow-on impacts of the investment and productivity associated with the satellite launch in Australia. At the sectoral level, detailed results such as economic activity employment, sectoral output by industry are also produced.
Appendix D Hypothetical program methodology
Figure D.1 gives a stylised representation of DAE-RGEM, specifically a system of interconnected markets with appropriate specifications of demand, supply and the market clearing conditions determine the equilibrium prices and quantity produced, consumed and traded.
The model rests on the following key assumptions:
• All markets are competitive, and all agents are price takers
• All markets clear, regardless of the size of the shock, within the year.
• It takes one year to build the capital stock from investment and investors take future prices to be the same as present ones as they cannot see the future perfectly
• Supply of land and skills are exogenous. In the business as usual case, supply of natural resource adjusts to keep its price unchanged; productivity of land adjusts to keep the land rental constant at the base year level.
Households
Firms
Factor markets
Labour Capital Resources Land
Goods markets
Local Interstate Overseas
Income
Supply
Supply
Purchase
Purchase
Purchase
75
Economic study into an Australian continuous launch small satellite program for Earth observation
over the sources of the commodity (using the Armington assumption).
• Government demand for source-generic composite goods, and goods from different sources (domestic, imported and interstate), is determined by maximising utility via Cobb-Douglas utility functions in two stages.
• All savings generated in each region are used to purchase bonds from the global market whose price movements reflect movements in the price of creating capital across all regions.
• Financial investments across the world follow higher rates of return with some allowance for country specific risk differences, captured by the differences in rates of return in the base year data. A conceptual global financial market (or a global bank) facilitates the sale of the bond and finance investments in all countries/regions. The global saving-investment market is cleared by a flexible interest rate.
• Once aggregate investment level is determined in each region, the demand for the capital good is met by a dedicated regional capital goods sector that constructs capital goods by combining intermediate inputs in fixed proportions, and minimises costs by choosing between domestic, imported and interstate sources for these intermediate inputs subject to a CRESH aggregation function.
• Producers supply goods by combining aggregate intermediate inputs and primary factors in fixed proportions (the Leontief assumption). Source-generic composite intermediate inputs are also combined in fixed proportions (or with a very small elasticity of substitution under a CES function), whereas individual primary factors are chosen to minimise the total primary factor input costs subject to a CES (production) aggregating function.
• All factors sluggishly move across sectors. Land moves within agricultural sectors; natural resource is specific to the resource using sector. Labour and capital move imperfectly across sectors in response to the differences in factor returns. Inter-sectoral factor movement is controlled by overall return maximizing behaviour subject to a CET function. By raising the size of the elasticity of transformation to a large number we can mimic the perfect mobility of a factor across sectors and by setting the number close to zero we can make the factor sector specific. This formulation allows the model to acknowledge the sector specificity of part of the capital stock used by each sector and also the sector specific skills acquired by labour while remaining in the industry for a long time. Any movement of such labour to another sector will mean a reduction in the efficiency of labour as a part of the skills embodied will not be used in the new industry of employment.
DAE-RGEM is based on a substantial body of accepted microeconomic theory. Key features of the model are:
• The model contains a ‘regional household’ that receives all income from factor ownerships (labour, capital, land and natural resources), tax revenues and net income from foreign asset holdings. In other words, the regional household receives the gross national income (GNI) as its income.
• The regional household allocates its income across private consumption, government consumption and savings so as to maximise a Cobb-Douglas utility function. This optimisation process determines national savings, private and government consumption expenditure levels.
• Given the budget levels, household demand for a source-generic composite goods are determined by minimising a CDE (Constant Differences of Elasticities) expenditure function. For most regions, households can source consumption goods only from domestic and foreign sources. In the Australian regions, however, households can also source goods from interstate. In all cases, the choice of sources of each commodity is determined by minimising the cost using a CRESH (Constant Ratios of Elasticities Substitution, Homothetic) utility function defined
76
Economic study into an Australian continuous launch small satellite program for Earth observation
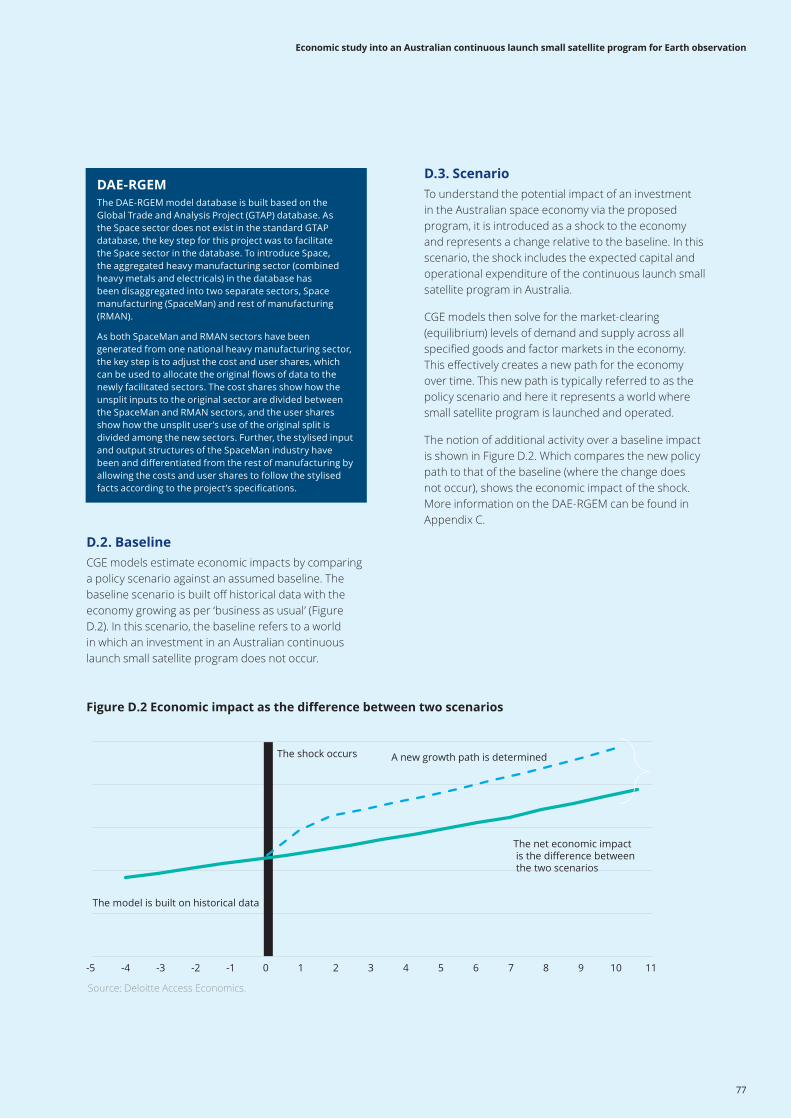
D.3. ScenarioTo understand the potential impact of an investment in the Australian space economy via the proposed program, it is introduced as a shock to the economy and represents a change relative to the baseline. In this scenario, the shock includes the expected capital and operational expenditure of the continuous launch small satellite program in Australia.
CGE models then solve for the market-clearing (equilibrium) levels of demand and supply across all specified goods and factor markets in the economy. This effectively creates a new path for the economy over time. This new path is typically referred to as the policy scenario and here it represents a world where small satellite program is launched and operated.
The notion of additional activity over a baseline impact is shown in Figure D.2. Which compares the new policy path to that of the baseline (where the change does not occur), shows the economic impact of the shock. More information on the DAE-RGEM can be found in Appendix C.
DAE-RGEMThe DAE-RGEM model database is built based on the Global Trade and Analysis Project (GTAP) database. As the Space sector does not exist in the standard GTAP database, the key step for this project was to facilitate the Space sector in the database. To introduce Space, the aggregated heavy manufacturing sector (combined heavy metals and electricals) in the database has been disaggregated into two separate sectors, Space manufacturing (SpaceMan) and rest of manufacturing (RMAN).
As both SpaceMan and RMAN sectors have been generated from one national heavy manufacturing sector, the key step is to adjust the cost and user shares, which can be used to allocate the original flows of data to the newly facilitated sectors. The cost shares show how the unsplit inputs to the original sector are divided between the SpaceMan and RMAN sectors, and the user shares show how the unsplit user’s use of the original split is divided among the new sectors. Further, the stylised input and output structures of the SpaceMan industry have been and differentiated from the rest of manufacturing by allowing the costs and user shares to follow the stylised facts according to the project’s specifications.
D.2. BaselineCGE models estimate economic impacts by comparing a policy scenario against an assumed baseline. The baseline scenario is built off historical data with the economy growing as per ‘business as usual’ (Figure D.2). In this scenario, the baseline refers to a world in which an investment in an Australian continuous launch small satellite program does not occur.
-5 -4 -3 -2 -1 0 1 2 3 4 5 6 7 8 9 10 11
The model is built on historical data
The shock occurs A new growth path is determined
The net economic impact is the difference between the two scenarios
Figure D.2 Economic impact as the difference between two scenarios
Source: Deloitte Access Economics.
77
Economic study into an Australian continuous launch small satellite program for Earth observation
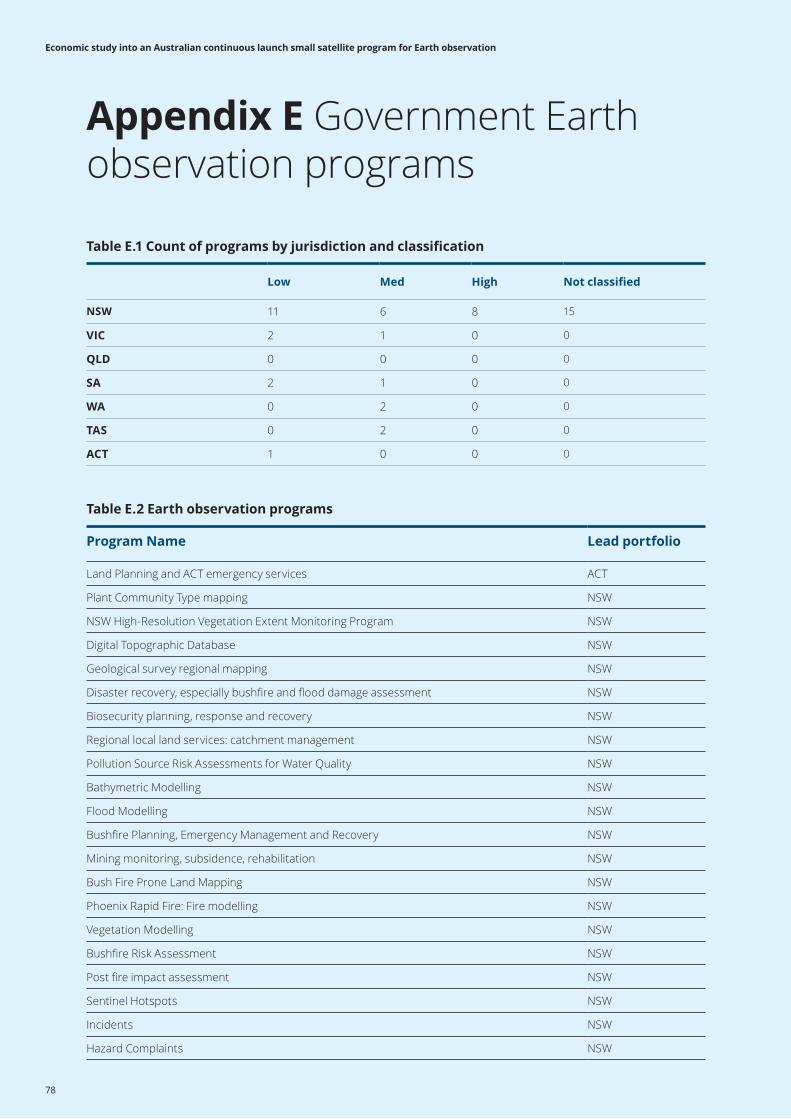
Table E.1 Count of programs by jurisdiction and classification
Table E.2 Earth observation programs
Appendix E Government Earth observation programs
Low Med High Not classified
NSW 11 6 8 15
VIC 2 1 0 0
QLD 0 0 0 0
SA 2 1 0 0
WA 0 2 0 0
TAS 0 2 0 0
ACT 1 0 0 0
Program Name Lead portfolio
Land Planning and ACT emergency services ACT
Plant Community Type mapping NSW
NSW High-Resolution Vegetation Extent Monitoring Program NSW
Digital Topographic Database NSW
Geological survey regional mapping NSW
Disaster recovery, especially bushfire and flood damage assessment NSW
Biosecurity planning, response and recovery NSW
Regional local land services: catchment management NSW
Pollution Source Risk Assessments for Water Quality NSW
Bathymetric Modelling NSW
Flood Modelling NSW
Bushfire Planning, Emergency Management and Recovery NSW
Mining monitoring, subsidence, rehabilitation NSW
Bush Fire Prone Land Mapping NSW
Phoenix Rapid Fire: Fire modelling NSW
Vegetation Modelling NSW
Bushfire Risk Assessment NSW
Post fire impact assessment NSW
Sentinel Hotspots NSW
Incidents NSW
Hazard Complaints NSW
78
Economic study into an Australian continuous launch small satellite program for Earth observation
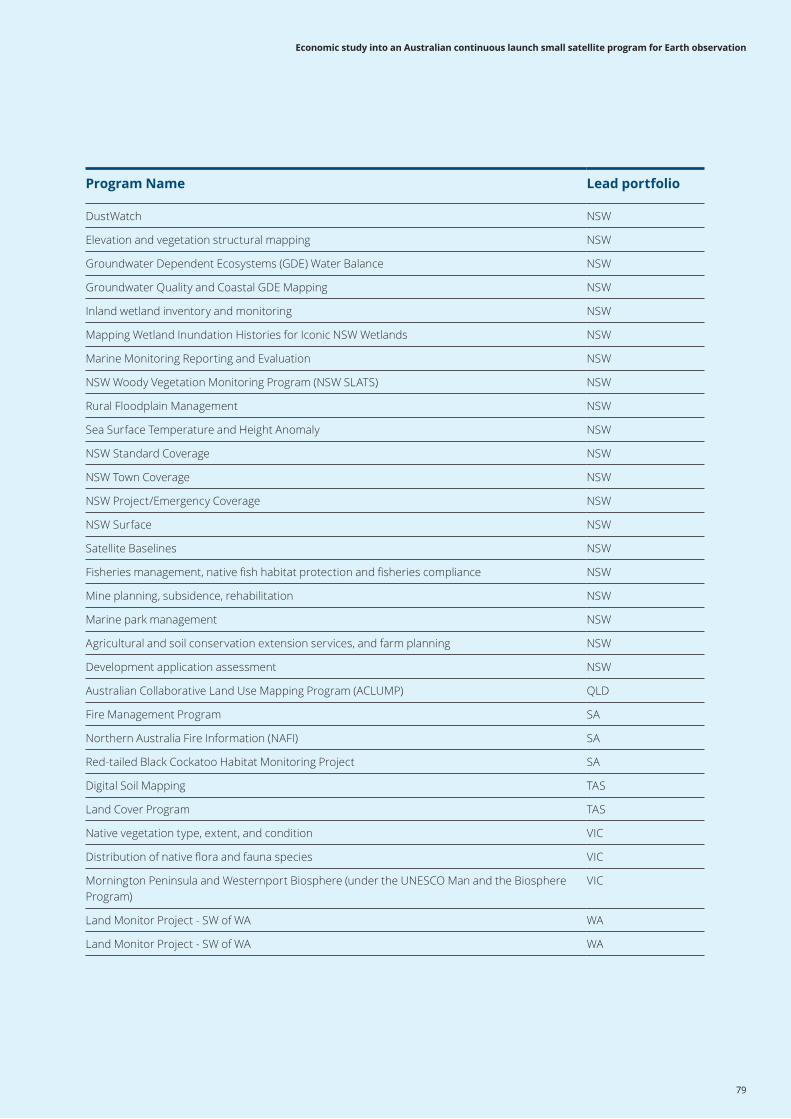
Program Name Lead portfolio
DustWatch NSW
Elevation and vegetation structural mapping NSW
Groundwater Dependent Ecosystems (GDE) Water Balance NSW
Groundwater Quality and Coastal GDE Mapping NSW
Inland wetland inventory and monitoring NSW
Mapping Wetland Inundation Histories for Iconic NSW Wetlands NSW
Marine Monitoring Reporting and Evaluation NSW
NSW Woody Vegetation Monitoring Program (NSW SLATS) NSW
Rural Floodplain Management NSW
Sea Surface Temperature and Height Anomaly NSW
NSW Standard Coverage NSW
NSW Town Coverage NSW
NSW Project/Emergency Coverage NSW
NSW Surface NSW
Satellite Baselines NSW
Fisheries management, native fish habitat protection and fisheries compliance NSW
Mine planning, subsidence, rehabilitation NSW
Marine park management NSW
Agricultural and soil conservation extension services, and farm planning NSW
Development application assessment NSW
Australian Collaborative Land Use Mapping Program (ACLUMP) QLD
Fire Management Program SA
Northern Australia Fire Information (NAFI) SA
Red-tailed Black Cockatoo Habitat Monitoring Project SA
Digital Soil Mapping TAS
Land Cover Program TAS
Native vegetation type, extent, and condition VIC
Distribution of native flora and fauna species VIC
Mornington Peninsula and Westernport Biosphere (under the UNESCO Man and the Biosphere Program)
VIC
Land Monitor Project - SW of WA WA
Land Monitor Project - SW of WA WA
79
Economic study into an Australian continuous launch small satellite program for Earth observation
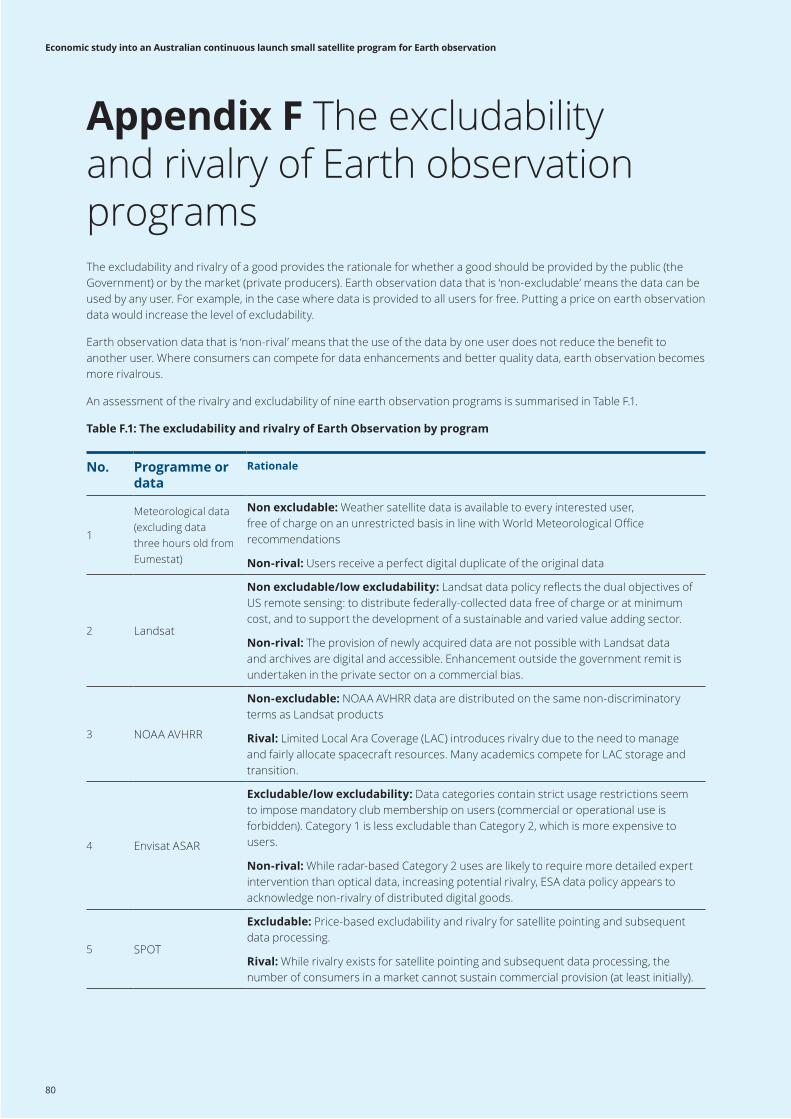
The excludability and rivalry of a good provides the rationale for whether a good should be provided by the public (the Government) or by the market (private producers). Earth observation data that is ‘non-excludable’ means the data can be used by any user. For example, in the case where data is provided to all users for free. Putting a price on earth observation data would increase the level of excludability.
Earth observation data that is ‘non-rival’ means that the use of the data by one user does not reduce the benefit to another user. Where consumers can compete for data enhancements and better quality data, earth observation becomes more rivalrous.
An assessment of the rivalry and excludability of nine earth observation programs is summarised in Table F.1.
Table F.1: The excludability and rivalry of Earth Observation by program
Appendix F The excludability and rivalry of Earth observation programs
No. Programme or data
Rationale
1
Meteorological data (excluding data three hours old from Eumestat)
Non excludable: Weather satellite data is available to every interested user, free of charge on an unrestricted basis in line with World Meteorological Office recommendations
Non-rival: Users receive a perfect digital duplicate of the original data
2 Landsat
Non excludable/low excludability: Landsat data policy reflects the dual objectives of US remote sensing: to distribute federally-collected data free of charge or at minimum cost, and to support the development of a sustainable and varied value adding sector.
Non-rival: The provision of newly acquired data are not possible with Landsat data and archives are digital and accessible. Enhancement outside the government remit is undertaken in the private sector on a commercial bias.
3 NOAA AVHRR
Non-excludable: NOAA AVHRR data are distributed on the same non-discriminatory terms as Landsat products
Rival: Limited Local Ara Coverage (LAC) introduces rivalry due to the need to manage and fairly allocate spacecraft resources. Many academics compete for LAC storage and transition.
4 Envisat ASAR
Excludable/low excludability: Data categories contain strict usage restrictions seem to impose mandatory club membership on users (commercial or operational use is forbidden). Category 1 is less excludable than Category 2, which is more expensive to users.
Non-rival: While radar-based Category 2 uses are likely to require more detailed expert intervention than optical data, increasing potential rivalry, ESA data policy appears to acknowledge non-rivalry of distributed digital goods.
5 SPOT
Excludable: Price-based excludability and rivalry for satellite pointing and subsequent data processing.
Rival: While rivalry exists for satellite pointing and subsequent data processing, the number of consumers in a market cannot sustain commercial provision (at least initially).
80
Economic study into an Australian continuous launch small satellite program for Earth observation
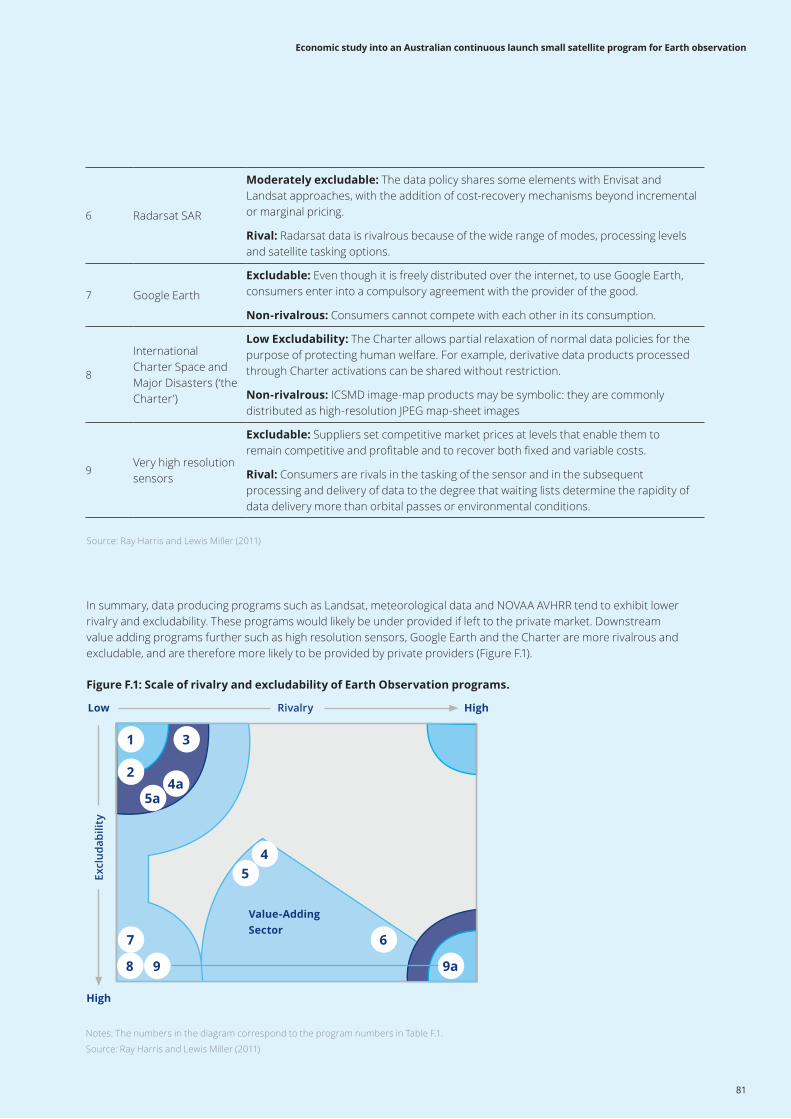
In summary, data producing programs such as Landsat, meteorological data and NOVAA AVHRR tend to exhibit lower rivalry and excludability. These programs would likely be under provided if left to the private market. Downstream value adding programs further such as high resolution sensors, Google Earth and the Charter are more rivalrous and excludable, and are therefore more likely to be provided by private providers (Figure F.1).
8 9
7
54
6
9a
Value-Adding Sector
High
High
Low Rivalry
Excl
udab
ility
1
2
5a4a
3
Notes: The numbers in the diagram correspond to the program numbers in Table F.1.
Source: Ray Harris and Lewis Miller (2011)
6 Radarsat SAR
Moderately excludable: The data policy shares some elements with Envisat and Landsat approaches, with the addition of cost-recovery mechanisms beyond incremental or marginal pricing.
Rival: Radarsat data is rivalrous because of the wide range of modes, processing levels and satellite tasking options.
7 Google Earth
Excludable: Even though it is freely distributed over the internet, to use Google Earth, consumers enter into a compulsory agreement with the provider of the good.
Non-rivalrous: Consumers cannot compete with each other in its consumption.
8
International Charter Space and Major Disasters (‘the Charter’)
Low Excludability: The Charter allows partial relaxation of normal data policies for the purpose of protecting human welfare. For example, derivative data products processed through Charter activations can be shared without restriction.
Non-rivalrous: ICSMD image-map products may be symbolic: they are commonly distributed as high-resolution JPEG map-sheet images
9Very high resolution sensors
Excludable: Suppliers set competitive market prices at levels that enable them to remain competitive and profitable and to recover both fixed and variable costs.
Rival: Consumers are rivals in the tasking of the sensor and in the subsequent processing and delivery of data to the degree that waiting lists determine the rapidity of data delivery more than orbital passes or environmental conditions.
Source: Ray Harris and Lewis Miller (2011)
Figure F.1: Scale of rivalry and excludability of Earth Observation programs.
81
Economic study into an Australian continuous launch small satellite program for Earth observation
Endnotes1. Terminology: Value added is gross output minus the cost of goods and services used in the production process.
2. Bureau of Meteorology, January 2021, Submission to the Standing Committee on Industry, Innovation, Science and Resources, Australian Government.
3. Australian Space Agency 2021, Economic snapshot of the Australian space sector: 2016-17 to 2018-19, Australian Government.
4. Also referred to as geospatial data, is a term used to describe any data related to or containing information about a specific location on the Earth’s surface.
5. https://www.weforum.org/agenda/2020/10/visualizing-earth-satellites-sapce-spacex.
6. Department of Industry, Science, Energy and Resources, 31 May 2020, Bushfire Earth Observation Taskforce: Report on the role of space based Earth observations to support planning, response and recovery for bushfires, Australian Government, available at < https://www.industry.gov.au/publications/bushfire-earth-observation-taskforce-report>
7. Earth Data, March 2021, What is Remote sensing? NASA, Available at: <https://earthdata.nasa.gov/learn/backgrounders/remote-sensing>
8. J. Estes, K. Kline, E. Collins, 2001, Remote Sensing, International Encyclopedia of the Social & Behavioral Sciences, Pergamon, Pages 13144-13150, https://doi.org/10.1016/B0-08-043076-7/02526-2, available at: <https://www.sciencedirect.com/science/article/pii/B0080430767025262>
9. N. Horning, 2008, Remote Sensing, Encyclopedia of Ecology, Academic Press, Pages 2986-2994, https://doi.org/10.1016/B978-008045405-4.00237-8, available at: <https://www.sciencedirect.com/science/article/pii/B9780080454054002378>
10. Bureau of Meteorology, ‘About environmental satellites’, available at < http://www.bom.gov.au/australia/satellite/about_satellites.shtml>
11. Earth observatory, 2009, Catalogue of Earth Satellite Orbits, EOS Project Science Office, NASA, available at <https://earthobservatory.nasa.gov/features/OrbitsCatalog>
12. Jones, G, 22 September 2020, An Introduction to Earth Observation, Joint Nature Conservation Committee, <https://www.youtube.com/watch?v=NuuuxDldiYw>
13. For example, NOAA’s GEO-XO constellation (United States) is likely to be around $12 billion for program cost of the program. Copernicus (European Union) was estimated at around 3.24 billion euros.
14. Its predecessor, the International Meteorological Organisation, a non-governmental organization of meteorological services, had demonstrated the power of meteorology and related geophysical sciences in serving human welfare and security.
15. World Meteorological Organisation, 2010, 60 years of service for your safety and well-being, available at <https://library.wmo.int/doc_num.php?explnum_id=4478>
16. The Copernicus Hub is a partnership between state and Commonwealth partners (NSW DPIE, QLD DES, WA Landgate, CSIRO and GA).
17. Media Release: Space Australia, ‘Indigenous Ground Station Goes Live’, 3 July 2020.
18. European Commission, July 2017, Big Data in Earth observation, Digital Transformation Monitor.
19. Gomes VC, Queiroz GR and Ferreira KR 2020, An overview of platforms for big earth observation data management and analysis, Remote Sensing, 12(8) 1253.
20. For additional detail on the framework that informed this approach, see Appendix A.
21. Australian Academy of Science and the Australian Academy of Technological Sciences and Engineering, July 2009, An Australian Strategic Plan for Earth Observations from Space. Available at <https://www.science.org.au/files/userfiles/support/reports-and-plans/2015/earth-observations-from-space.pdf>
22. Industries where their core activity (i.e. revenue deriving) is not related to space industry activity.
23. Industry consultation with the Australian Bureau of Meteorology.
24. Biosecurity is excluded when presenting the orders of magnitude as it applies to the cost of a biosecurity event rather than an annual cost.
25. McFarlane, Clayer and Bookless, 1997, ‘Psychiatric morbidity following a natural disaster: an Australian bushfire.’ Social psychiatry and psychiatric epidemiology, 32(5), pp.261-268.
26. Dixon, Shochet and Shakespeare-Finch, 2015, ‘Stress during the rebuilding phase influenced mental health following two Queensland flood disasters more than the event itself’, In Proceedings of the Australian and New Zealand Disaster and Emergency Management Conference (ANZDMC) Australian and New Zealand Mental Health Association, 21-33.
82
Economic study into an Australian continuous launch small satellite program for Earth observation
27. London Economics, ‘A study of the economic impact of the services provided by the Bureau of Meteorology’, 2017.
28. Australia’s dependence on Japanese satellites has increased since 2014, with Himawari 8 and 9 – geostationary weather satellites providing high temporal resolution (new images are recorded more frequently).
29. Data provided by Geoscience Australia.
30. Ray Harris and Lewis Miller, Earth observation and the public good, Space Policy 27.4 (2011), 194-201.
31. Australian Bureau of Meteorology, CSIRO and Geoscience Australia, Submission from the Australian Government Earth Observations Working Group to the Australian Space Industry, 2017.
32. Centre for International Economics, ‘Analysis of the benefits of improved seasonal climate forecasting for agriculture’, prepared for Managing Climate Variability Program, 2014.
33. London Economics, ‘A study of the economic impact of the services provided by the Bureau of Meteorology’, 2017.
34. A 7% discount rate has been used to calculate NPV.
35. Gabriel Popkin, ‘Us government considers charging for popular Earth-observing data’, Nature, 2018.
36. Yin, Gaohong, Y, Mariethoz, G and McCabe, M, ‘Gap-Filling of Landsat 7 Imagery Using the Direct Sampling Method’.
37. Mazzucato, M, September 2017, Mission-Oriented Innovation Policy, UCL Institute for Innovation and Public Purpose, Available at: <https://www.thersa.org/globalassets/pdfs/reports/mission-oriented-policy-innovation-report.pdf>
38. Geoscience Australia, March 16 2021, Report released - Technical Feasibility Study into Australian Development of a Satellite Cross-Calibration Radiometer (SCR), available at: <https://www.eoa.org.au/news/2021/3/16/report-released-technical-feasibility-study-into-australian-development-of-a-satellite-cross-calibration-radiometer-scr>
39. Space Angels, 2020, Space Investment Quarterly, Space Capital, available at: <https://spacecapital.docsend.com/view/6x3sub6i74sitwie>
40. OECD (2019), Reforming Public Procurement: Progress in Implementing the 2015 OECD Recommendation, OECD Public Governance Reviews, OECD Publishing, Paris, https://doi.org/10.1787/1de41738-en.
41. A 7% discount rate has been used to calculate NPV.
42. OECD (2021). Gross domestic product. Accessed via https://data.oecd.org/gdp/gross-domestic-product-gdp.htm
43. ABS, Labour Force, Australia, Detailed, Quarterly (February 2020), accessed 29 March 2021, <https://www.abs.gov.au/statistics/labour/employment-and-unemployment/labour-force-australia-detailed-quarterly/latest-release>.
44. ABS, Labour Force, Australia, Detailed, Quarterly (February 2020), accessed 29 March 2021, <https://www.abs.gov.au/statistics/labour/employment-and-unemployment/labour-force-australia-detailed-quarterly/latest-release>.
45. Australian Academy of Technological Science and Engineering, An Australian strategic plan for earth observations from space (2009), <https://www.science.org.au/files/userfiles/support/reports-and-plans/2015/earth-observations-from-space.pdf>.
46. ACIL Allen Consulting, ‘The value of Earth Observations from Space to Australia, Report to the CRC for Spatial Information December’ 2015.
47. London Economics, ‘A study of the economic impact of the services provided by the Bureau of Meteorology’, 2017.
48. APEC 2019, ‘Current and future value of earth and marine observing to the Asia – Pacific region’, 2019.
49. London Economics, ‘A study of the economic impact of the services provided by the Bureau of Meteorology’, 2017.
50. ACIL Allen Consulting, ‘The value of Earth Observations from Space to Australia, Report to the CRC for Spatial Information December’ 2015.
51. ACIL Allen Consulting, ‘The value of Earth Observations from Space to Australia, Report to the CRC for Spatial Information December’ 2015.
52. Australian Renewable Energy Agency 2018, Australian Energy update <https://www.energy.gov.au/sites/default/files/australian_energy_update_2018.pdf>
53. European Commission 2016, Copernicus market report, prepared by Price Waterhouse Cooper for the European Commission <https://www.pwc.com/jp/ja/industries/technology/tech-consulting/assets/pdf/copernicus-market-report.pdf>
54. Australian Bureau of Statistics, catalogue 3303 Causes of Death, Australia, 2019, released 23 October 2020.
55. Ibid. Years of potential life lost (YPLL) is a measure of premature mortality which weights age at death to gain an estimate of how many years a person would have lived had they not died prematurely.
56. This figure is calculated based on the following: Number of deaths reported in 2009 without the Bureau’s warning system (Victorian Auditor-General’s Office p.2) compared to the number of deaths in 2014 with the Bureau’s warning system (45% relative to 2009)
57. London Economics, ‘A study of the economic impact of the services provided by the Bureau of Meteorology’, 2017.
58. London Economics, ‘A study of the economic impact of the services provided by the Bureau of Meteorology’, 2017.
83
Economic study into an Australian continuous launch small satellite program for Earth observation

Contact us
Dr Pradeep PhillipPartnerDeloitte Access [email protected]
Liesda Marsdon Senior EconomistDeloitte Access [email protected]
Kelly HeatonDirectorDeloitte Access [email protected]
84
Economic study into an Australian continuous launch small satellite program for Earth observation

General use restrictionThis report is prepared solely for the use of Geoscience Australia. This report is not intended to and should not be used or relied upon by anyone else and we accept no duty of care to any other person or entity. The report has been prepared for the purpose to inform the development of the Australian Space Agency’s Earth Observations from Space Technology Roadmap as set out in the contract dated Friday, 5 February 2021. You should not refer to or use our name or the advice for any other purpose.
Limitation of our work
85
Economic study into an Australian continuous launch small satellite program for Earth observation

This publication contains general information only, and none of Deloitte Touche Tohmatsu Limited, its member firms, or their related entities (collectively the “Deloitte Network”) is, by means of this publication, rendering professional advice or services. Before making any decision or taking any action that may affect your finances or your business, you should consult a qualified professional adviser. No entity in the Deloitte Network shall be responsible for any loss whatsoever sustained by any person who relies on this publication.
Deloitte refers to one or more of Deloitte Touche Tohmatsu Limited (“DTTL”), its global network of member firms, and their related entities. DTTL (also referred to as “Deloitte Global”) and each of its member firms and their affiliated entities are legally separate and independent entities. DTTL does not provide services to clients. Please see www.deloitte.com/about to learn more.
About DeloitteDeloitte is a leading global provider of audit and assurance, consulting, financial advisory, risk advisory, tax and related services. Our network of member firms in more than 150 countries and territories serves four out of five Fortune Global 500®companies. Learn how Deloitte’s approximately 286,000 people make an impact that matters at www.deloitte.com.
About Deloitte Asia PacificDeloitte Asia Pacific Limited is a company limited by guarantee and a member firm of DTTL. Members of Deloitte Asia Pacific Limited and their related entities provide services in Australia, Brunei Darussalam, Cambodia, East Timor, Federated States of Micronesia, Guam, Indonesia, Japan, Laos, Malaysia, Mongolia, Myanmar, New Zealand, Palau, Papua New Guinea, Singapore, Thailand, The Marshall Islands, The Northern Mariana Islands, The People’s Republic of China (incl. Hong Kong SAR and Macau SAR), The Philippines and Vietnam, in each of which operations are conducted by separate and independent legal entities.
About Deloitte AustraliaIn Australia, the Deloitte Network member is the Australian partnership of Deloitte Touche Tohmatsu. As one of Australia’s leading professional services firms. Deloitte Touche Tohmatsu and its affiliates provide audit, tax, consulting, and financial advisory services through approximately 8,000 people across the country. Focused on the creation of value and growth, and known as an employer of choice for innovative human resources programs, we are dedicated to helping our clients and our people excel. For more information, please visit our web site at www.deloitte.com.au
Liability limited by a scheme approved under Professional Standards Legislation.
Member of Deloitte Asia Pacific Limited and the Deloitte Network.
© 2021 Deloitte Touche Tohmatsu.
Designed by CoRe Creative Services. RITM0706668