excessive speculation and oil price shock recessions acase of wall street
TRANSCRIPT

EXCESSIVE SPECULATION AND OIL PRICE SHOCK RECESSIONS
A CASE OF WALL STREET “DÉJÀ VU ALL OVER AGAIN”
Mark Cooper
Director of Research
October 2011

CONTENTS EXECUTIVE SUMMARY i I. INTRODUCTION 1
PURPOSE Outline
II. THE IMPACT OF OIL PRICE SPIKES ON HOUSEHOLDS AND THE ECONOMY 3
Increased Cost for Consumers and the Economy The Recessionary Impact of Oil Price Spikes
III. THE ROLE OF MARKET FUNDAMENTALS IN THE RECENT PRICE SPIKES 6 Cost Supply, Demand and Excess Capacity
IV. THE STRONG LINK BETWEEN SPECULATION AND PRICE SPIKES 11
Prices and Trading Covary Strongly How Bad Policy Caused Excessive Speculation
V. POLICY IMPLICATIONS 19
Causal Mechanisms that Link Excessive Speculation to Price and Economic Inefficiency
The Proper Function of Commodity Markets and Normal Speculation Policy Implications of the Analysis
List of Exhibits Exhibit II-1: Annual Household Expenditures on Gasoline (Real $2010) 3 Exhibit II-2: Oil Price Shocks and Economic Recessions 4 Exhibit III-1: What Does it Cost to Find a Barrel 6 Exhibit III-2: The Relationship between Cost and Price: 1986-2011 8 Exhibit III-3: Market Fundamentals and the Price of Crude 9 Exhibit IV-1: Open Interests in WTI, Crude Prices, and Finding Costs 11 Exhibit IV-2: Projecting Prices Based on Pre-bubble Trends 12 Exhibit IV-3: Public Policy and the Influx of Speculative Funds 13 Exhibit IV-4: Estimated 2011 Price of Crude Compared to Estimated 18
2011 Prices, without Excessive Speculation Exhibit V-1: Physical, Financial and Regulatory Factors in the 23 Energy Price Spiral

i
Executive Summary
PURPOSE
Since the oil price spikes of 2001 the Consumer Federation of America has been calling on federal regulators to protect consumers from the ravages of market power and excessive speculation that afflict a commodity that is vital to daily life and a huge factor in household budgets. The Commodity Futures Tradition Commission (CFTC) is poised to adopt a rule that could significantly reduce the blight of excessive speculation, if it places meaningful limits on the amount of oil that large speculators are allowed to hold under contract in commodity markets.
This paper examines the causes and consequences of the oil price spike of 2010-2011. It begins with an estimate of the burden that speculative bubbles in energy commodities place on American consumers and the economy. By building on analyses and testimony offered by the Consumer Federation of America during the rapid expansion of oil commodity market trading and the escalation of price in the mid-2000s, the paper shows that excessive speculation, not market fundamentals caused the spike in oil prices. The movement of trading and prices in the three years since the speculative bubble in oil burst in 2008 provides even stronger evidence that excessive speculation is a major problem that afflicts the oil market and the economy.
The deregulation of trading and the relaxation of rules on banks in the early 2000s that “financialized” commodities are identified as the policies that triggered excessive speculation. For decades, commodity markets had provided a mechanism to smooth the flow of commodities between those who produce them and those who consume them. The “financializtion” of commodities undermined the proper functioning of commodity markets,
Failing to provide effective oversight of speculation, policy makers allowed the enrichment of Wall Street speculators through financialization of commodities like oil, at the expense of the real economy on Main Street. Thus, the paper offers a powerful justification for the CFTC to establish strong position limit rule as a means of protecting consumers and the economy from the severe harm that oil price spike driven by excessive speculation cause.
The Impact of Excessive Speculation
Section II finds that excessive speculation in crude oil commodity markets will result in household gasoline expenditures that will set a record high in 2011, as shown in Exhibit ES-1. As a result speculation will add $600 to the average household expenditures on gasoline in 2011, resulting in the highest level of spending ever of almost $2900.
However, gasoline accounts for less than half of all oil products consumed in the U.S. When the cost of other petroleum products that ultimately end up in the goods and services that consumers purchase are included the burden will be more than twice as heavy. With excessive speculation adding about $30 per barrel to the cost of oil in 2011, the total drain on the economy from speculation driven excessive costs rises to more than $200 billion this year. That $200 billion price tag for excessive speculation is equal to over 1 percent of gross domestic product and 2 percent of consumer spending. Transferring that much purchasing power from consumers on Main Street to speculators on Wall Street puts a severe drag on the economy. As shown in Exhibit ES-2, the five previous oil price spikes since World War II have all resulted in recessions. Whether or not the current price spike sends the economy into recession, it is clear that rising oil prices have already dampened economic growth.

ii
$0.00
$500.00
$1,000.00
$1,500.00
$2,000.00
$2,500.00
$3,000.00
1999 2000 2001 2002 2003 2004 2005 2006 2007 2008 2009 2010 2011e
EXHIBIT ES-1: ANNUAL HOUSEHOLD EXPENDITURES ON GASOLINE (REAL $2010)
Sources: Bureau of Labor Statistics, Consumer Expenditure Survey, various issues; Energy Information Administration, Prices, Gasoline; Short Term Energy Outlook, September 7, 2011.
EXHIBIT ES-2: OIL PRICE SHOCKS AND ECONOMIC RECESSIONS
2011
Source: Jeff Rubin, “Oil Prices Caused the Current Recession,” The Oil Drum, November 5, 2008, 2012 price and recession added
by author
We use three approaches to estimate the size of the speculative premium consumers are paying – oil industry estimates of the cost of crude, the long term trend of costs and pre-Bubble trading. As shown in Exhibit ES-3, absent excessive speculation, the price of crude would be in the range of $60 to $75 per barrel. With crude prices likely to be in the range of $95-$100 per barrel in 2011, a speculative premium of $30/bbl is reasonable to use as a basis for estimating the effect of excessive speculation. Additional evidence from market analysts also support this estimate
Market Fundamentals are Not Good Predictors of Oil Prices in the 2000s
Section III examines trends in oil prices, cost and supply and demand factors to demonstrate that “market fundamentals” ceased to be good predictors of oil prices in the mid-

iii
0
20
40
60
80
100
120
140
160
1995 1996 1997 1998 1999 2000 2001 2002 2003 2004 2005 2006 2007 2008 2009 2010 2011e
Crude Price Real $2010 Global R/P ratio Global R/C Ration
OPEC Spare Capacity Days Supply Open Interests (10,000 contracts)
$0
$20
$40
$60
$80
$100
$120
Oil Exec Cost Trend Pre-bubble Trading Projected Price
Exhibit ES-3: Estimated 2011 Price of Crude Compared to Estimated 2011 Prices, without Excessive Speculation
Source: See Sections III and IV for the methods used to derive these estimates; hatched areas are high estimates.
2000s. As shown in Exhibit ES-4, not only did oil prices fail to track costs during the speculative bubbles of 2002-2008 and 2010-2011, but the other “market fundamentals” were generally constant over the decade of the 2000s. To the extent that there were changes in these fundamentals, they were either out of sync with the direction of change in price or moving in the wrong direction.
EXHIBIT ES-4: MARKET FUNDAMENTALS, TRADING VOLUMES AND THE PRICE OF CRUDE
Source: BP Statistical Review of World Energy, Full Report, June 2011, Richard Newell, Energy and Financial Market Overview: Crude Oil Price Formation, May 5, 2011, p. 29, EIA, Performance Profiles of Major energy Companies, Finding Costs; Commodity Futures Trading Commission, http://www.cftc.gov/MarketReports/CommitmentsOfTraders/Index.htm, Energy Information Administration, Cushing Crude Future, contract 1, http://www.eia.gov/dnav/pet/pet_pri_fut_s1_d.htm,
Over the course of the last decade, the global reserve to production and reserve to consumption ratios were almost flat. In fact, they were rising slightly over the decade. OPEC spare capacity, measured in terms of the number of days of spare capacity to meet global demand, shows some variation over the decade. However, the low levels of spare capacity in the early part of the

iv
decade occurred well before the major price run up began. On the other hand, in recent years spare capacity is relatively high, when prices are rising. This hardly seems to be a good candidate to explain rising prices. Even using OPEC spare capacity to predict prices, it does not suggest a price above $60.
Trading as a predictor of Price
Section IV examines the role of trading and speculation in triggering dramatic increases in the level and volatility of crude oil prices. Exhibit ES-4 includes the trading changes along with the market fundamentals. It is obvious to the naked eye that trading tracked prices and fundamentals well until the mid-2000s. When fundamentals lost touch with price, trading and prices continued to vary together. Clearly, the normal relationship between cost fundamentals and price was disrupted in the mid-2000s and increases in trading activity are a good candidate for the cause of the change. Statistical analysis confirms the obvious; trading is a better predictor of price than market fundamentals. In 2004 the number of contracts began to increase more quickly than the historical trend. Then in 2006 through mid-2008, trading increased dramatically. During the gyrations of crude prices in the past half-decade, price has tracked trading much more closely than cost.
The size of the increase in trading is quite remarkable, given that there had been a stable market for decades. From 2003 to the peak in 2008, the number of barrels of oil under contract increased three-fold. Moreover, since the value of oil was also increasing dramatically, the amount of money flowing into this market was even larger. From the end of 2003, when the total value of open interests was about $19 billion, until the peak in mid-2008, when the value of open interests was over $154 billion, there was an eight-fold increase in the size of the market. This is a classic bubble.
The bursting of the bubble was equally dramatic. In the third quarter of 2008, as pressure from congress and the public outcry over oil prices forced the Commodity Futures Trading Commission to begin investigating excessive speculation, speculative money fled the market. By mid-September, before Lehman Brothers went bankrupt precipitating the financial meltdown, the oil price bubble had burst. In just three months, the value of open interests had declined by about 50% and the price of oil had fallen over 50%. By the end of the year, the bubble had completely deflated. The price of WTI crude was down to $38/bbl and the value of open interests was down to $43 billion. The amount of money that had exited the commodity market in just six months was five times as large as the entire market five years earlier. This is a classic bubble bursting.
The policies necessary to prevent a recurrence of the bubble and burst cycle have not yet been adopted and the inaction has allowed the bubble to reflate. The value of open interests has been rising sharply for almost a year, and reached $150 billion at the peak, almost twice what it was in early 2010.
Bad Policy Opened the Door to Excessive Speculation
Section IV describes the policies that allowed the radical change in commodity markets. As shown in Exhibit ES-5, a series of policy decisions opened the door to excessive speculation and huge quantities of funds flowed into the oil futures market. The influx of funds was the result of the new types of traders who entered the market and the “financialization” of the commodities.

v
The rapid rise and fall of Enron should have been a loud warning that the “Enron Loophole” and its “asset-lite” business model were dangerous, but policy makers did not heed it. After the Enron bankruptcy and the recession of 2001-2002 had driven money out of commodity markets in what was ironically called “a flight to quality,” traders were ready to re-enter the energy markets. Instead of restoring sound regulation, policy makers relaxed rules that had restricted access to these markets to allow the big commercial banks and hedge funds to enter. Goldman Sachs and Morgan Stanley who were progressively deregulated throughout the 2000s led the charge. They generated huge profits and bonus pools that attracted the interest of a wide range of investors. When oil futures became an investment good, with skyrocketing prices driving huge Wall Street profits, index traders and pension fund money flowed in to further inflate the bubble.
EXHIBIT ES-5: PUBLIC POLICY AND THE INFLUX OF SPECULATIVE FUNDS
Source: The Failure of Federal Authorities to Protect American Energy Consumers From Market Power and Other Abusive Practices,” Loyola Consumer Law Review, 19:4 (2007).
Policies to Prevent Excessive Speculation
Section V explains the economic mechanisms that link the increase in the volume and volatility of trading to higher prices. It offers a brief discussion of policy recommendations. As noted above, because the problem was created by bad policy, it can and must be fixed by good policy. An essential first step is adoption of a strong position limit rule by the CFTC. This will reduce the amount of trading and prevent a few very large traders from putting upward pressure on prices.
1
I. INTRODUCTION
PURPOSE
Since the oil price spikes of 2001 the Consumer Federation of America1 has been calling on federal regulators to protect consumers from the harm of market power and excessive speculation that afflict a commodity that is vital to daily life and a huge factor in household budgets. This paper shows that the immense burden that speculative bubbles in energy commodities place on American consumers not only ravages household budgets, it dampens economic growth and destroys jobs.
The paper builds on and extends analyses and testimony offered by the Consumer Federation of America, during the rapid expansion of oil commodity market trading and the escalation of price in the mid-2000s. 2 The explanation offered at that time showed that excessive speculation was a major cause of the wild gyration of oil prices. The movement of trading and prices in the three years since the speculative bubble in oil burst in 2008 provides even stronger evidence that excessive speculation is a major problem that afflicts the oil market.
The Commodities Futures Tradition Commission (CFTC) is poised to adopt a rule that could significantly reduce the harm of excessive speculation,3 if it places meaningful limits on the amount of oil that large speculators are allowed to own (positions limits). This paper makes the case for strong rules to dampen excessive speculation. Position limits are one of several important tools to accomplish this goal.
1 CFA is an association of more than 300 consumer organizations, low income, and nonprofit groups, formed in 1968 to
advance the consumer interest through research, education, and advocacy. 2 The major pieces of testimony include: “Testimony of Mark Cooper, Oversight of Energy Markets and Oil Futures
Contract,” Joint Hearing of the Senate Appropriations Subcommittee on Financial Services and General Government and the Committee on Agriculture, Nutrition and Forestry United States Senate, June 17, 2008; “Testimony of Mark Cooper on Excessive Speculation In Energy Commodities,” Agriculture Committee, United States House of Representatives, July 10, 2008; “State Regulators, Commodity Markets, And The Collapse Of Market Fundamentalism,” Joint Session of the Consumer Affairs and Gas Committees on “Excessive Speculation in Natural Gas Markets: How To Safeguard Consumers,” National Association of Regulatory Utility Commissioners, February 17, 2009; “Statement of Mark Cooper on Excessive Speculation in Commodity Market and the Collapse of Market Fundamentalism,” Permanent Subcommittee on Investigations Committee on Homeland Security and Government Affairs, Hearing on Excessive Speculation in the Wheat Market, United States Senate, July 21, 2009.
Broader analyses of energy markets include: Mark Cooper, The Role of Supply, Demand and Financial Commodity Markets in the Natural Gas Price Spiral, (A Report Prepared for the Midwest Attorney General Natural Gas Working Group, Illinois, Iowa, Missouri, and Wisconsin, March, 2006); The Role of Supply, Demand, Industry Behavior and Financial Market in the Gasoline Price Spiral (for the Wisconsin Attorney General, August, 2006); The Failure of Federal Authorities to Protect American Energy Consumers From Market Power and Other Abusive Practices,” Loyola Consumer Law Review, 19:4 (2007).
Examination of the broader issue of excessive financialization and the collapse of market fundamentalism can be found in, “Testimony of Dr. Mark Cooper Too Big to Fail? The Role of Antitrust Law in Government-Funded Consolidation in the Banking Industry,” Subcommittee on Courts and Competition Policy, Committee on the Judiciary, United States House of Representatives, March 17, 2009; “Testimony of Barbara Roper before the Senate Banking Committee regarding Enhancing Investor Protection and the Regulation of Securities Markets,” March 26, 2009; Mark Cooper and Barbara Roper, Reform of Financial Markets: the Collapse Of Market Fundamentalism and the First Steps to Revitalize the Economy, (Consumer Federation of America, April 2009).
3 Keefe, Bruyette & Woods, Exchange Order Execution, North American Equity Research, September 6, 2011.

2
Outline
The paper is organized as follows. Section II uses an estimate of the size of the price spike of 2010-2011 caused by excessive speculation to measure the burden that it places on household budgets and the harm that it does to the economy. This establishes the fact that excessive speculation is an important problem that deserves careful attention and vigorous efforts from policy makers to reduce or eliminate the problem.
Section III examines the role of market fundamentals in the recent price spikes. It shows that trends in oil production costs, supply, demand and spare capacity do not provide good explanations for the recent gyrations in price.
Section IV shows that trading behavior tracks more closely to the recent changes in prices than market fundamentals. The discussion moves beyond correlation to identify the policy decisions that triggered the explosion of trading.
Section V explains the economic mechanisms that link the increase in the volume and volatility of trading to higher prices. It concludes with a brief discussion of policy recommendations.

3
$0.00
$500.00
$1,000.00
$1,500.00
$2,000.00
$2,500.00
$3,000.00
1999 2000 2001 2002 2003 2004 2005 2006 2007 2008 2009 2010 2011e
II. THE IMPACT OF OIL PRICE SPIKES ON HOUSEHOLDS AND THE ECONOMY
Increased Cost for Consumers and the Economy
Using the latest estimates for gasoline prices from the Energy Information Administration and for gasoline consumption from the Bureau of Labor Statistics, we estimate that American households will spend more on gasoline in 2011 than ever – almost $2,900.4 Even adjusted for inflation, as shown in Exhibit II-1, this is more than households spent in 2008, which was the last time excessive speculation gripped the oil market. Based on the estimates of excessive crude prices provided in the next section, gasoline prices will be too high by 70 cents per gallon this year. That means that the average household will spend almost $600 more on gasoline than it would have if prices had not been distorted by excessive speculation.
EXHIBIT II-1: ANNUAL HOUSEHOLD EXPENDITURES ON GASOLINE (REAL $2010)
Sources: Bureau of Labor Statistics, Consumer Expenditure Survey, various issues; Energy Information
Administration, Prices, Gasoline; Short Term Energy Outlook, September 7, 2011.
Since gasoline represents less than half of all petroleum product supplied, and the cost of other petroleum products ultimately ends up in the prices of goods and services that consumers purchase, the total burden on households will be more than twice as high. Using an estimate of $30/bbl as the increase in crude prices caused by excessive speculation, the oil price bubble will rob consumers of over $200 billion this year.
The Recessionary Impact of Oil Price Spikes
When speculation induced price spikes enrich Wall Street commodity traders, oil companies and OPEC by draining purchasing power out of the economy, the ultimate effect is to lower economic growth and reduce employment. In fact, as shown in Exhibit II-2,
4 This estimate of consumption is adjusted downward to account for the price elasticity of demand.

4
every major oil price spike since World War II has been followed by an economic recession and four of the past five recessions have been preceded by a major oil price increase. It would appear that the price increase of late-2010/early-2011 may make it six out of seven.5
EXHIBIT II-2: OIL PRICE SHOCKS AND ECONOMIC RECESSIONS 2011
Source: Jeff Rubin, “Oil Prices Caused the Current Recession,” The Oil Drum, November 5, 2008, 2012
price and recession added by author
In the current environment, where household budgets are already under extreme strain because of the bursting of the housing bubble and high levels of unemployment, the economy is even more fragile that before the last speculation induced recession. Thus, high oil prices are more likely to impose hardship on consumers and do damage to the economy. Even if we do not fall into a recession, there is no doubt that economic growth and employment will suffer as a result of the oil price shock.6
The speculation driven oil price spike of 2007-2008 resulted in the largest price spike in absolute terms ever, even larger than the OPEC oil embargo and the fall of the Shah of Iran. The following recession that followed the 2007-2008 oil price spike, was the worst recession since the great depression. Of course, the financial meltdown played a big part in the severity of the recession. However, as discussed below, the speculative bubble in oil
5 Vivienne Walt, “Is the Fed to Blame for Soaring Global Oil Prices?”, Time, January 7. 2011. Here we go again: the spike in
global oil prices that preceded the Great Recession is being repeated. Just three years ago, the price of oil futures on the New York Mercantile Exchange hit $100 per bbl. for the first time, bringing dire warnings about looming economic hardship. Sure enough, the world economy entered its worst downturn since the Depression just months after oil prices peaked at a record $147 per bbl. in July 2008. Now the doomsayers are back, as oil futures crept above $92 per bbl. this week — their highest level since 2008….Fatih Birol, chief economist at the Paris-based International Energy Agency, which represents the world's industrialized oil-consuming countries, warned on Monday, Jan. 3, that oil prices are expected to reach $100 per bbl. again soon, threatening the economic recovery by hugely increasing the energy bills of countries, factories, cities and drivers.
6 Gregory White, “Barclays on How the Oil Price Spike Could Crash the HousingMarket Again,” Business Insider, March 6, 2011; Robert Rapier, “The vicious Circle of Oil Price Induced Recessions,” OilPrice.com,” April 12, 2011; “The 2011 Oil shock: More of a Threat to the World Economy Than Investors Seem to Think,” The Economist, March 3, 2011; James Cook, “When Oil Prices Double: Recession Often Follows,” The Fiscal Times, April 25, 2011; Alex Koalski, “Consumer Spending in the U.S. Unexpectedly Stagnated in May as Prices Climbed,” Bloomberg, June 27, 2011, “consumer spending unexpectedly stagnated in May as employment prospects dimmed and rising inflation caused Americans to cut back…Economic growth slowed in the first quarter after surging energy costs strained consumer finances.”

5
burst before the financial meltdown and the onset of the recession. Moreover, both the speculative bubble and the financial meltdown teach the same lesson – excessive financialization poses a serious threat to the real economy.
One of the primary manifestations of the economic slowdown caused by oil price spikes is a reduction in employment. Estimating job impacts has become a national pastime in which we choose not to engage. The multipliers of spending depend on many factors, but rising gasoline prices are particularly burdensome. They not only reduce household budgets, but much of the money leaves the economy to pay for imported oil. Increasing profitability of oil companies and the earning of speculators are likely to have much smaller multiplier effects that consumer spending. This is a primary reason that past oil price spikes have invariably caused recession and that the 2008-2009 recession was so severe. We believe that any reasonable consumer spending multiplier will show that there are hundreds of thousands of jobs at risk.
Early in the spring, an analyst from Barclays, summed up the potential harm of rising oil prices and made it particularly relevant by drawing a link between oil prices and the housing crisis, which was still ongoing, drawing together the key themes of reduced consumption expenditure, the outflow of resources from oil importing nations, and the severe impact that the 2008 price spike had on the economy.
The main effect is on consumption via gasoline and energy prices. As consumption in general accounts for 60% of GDP, the effect is large. In oil exporters this effect will be offset by windfall revenues from the higher oil prices, so the overall effect is unclear. In our view, the oil price increase in 2008 significantly contributed to the recession and the financial crisis in the U.S., which then spread globally. By raising CPI inflation, it reduced real disposable income and, hence, the purchasing power of the average households, leading to a contraction in real consumer spending and lowering the ability to repay mortgages. 7
The inability to afford the oil price increase plays an important part in James Hamilton’s8 explanation of why the oil price increase of 2007-2008 caused a recession. Hamilton charts the impact of oil price increases on key consumer durables like autos and housing, both of which were devastated by the great recession. With households and the economy still vulnerable as a result of the “great recession” it is reasonable to suggest that the effect of the 2010-2011 price spike will be swifter and larger than the historical pattern.
7 Gregory White, “Barclays on How the Oil Price Spike Could Crash the Housing Market Again,” Business Insider, March 6,
2011. 8 Causes and Consequences of the Oil Price Shock of 2007-08,”Brookings Papers on Economic Activity, spring, 2009, p. 38)

6
III. THE ROLE OF MARKET FUNDAMENTALS IN THE RECENT PRICE SPIKES
This section examines the role of market fundamentals in the recent price gyrations. It begins with the cost of production, and then examines other market factors.
Cost
Exhibit III-1 presents the trend of crude oil costs presented in Congressional testimony by an independent oil industry analyst in 2008, at the height of the previous oil price spike. This analysis was included in our 2008 testimony because it provides an independent estimate of the cost of crude. 9 The underlying data is from the Energy Information Administration. The most recent data available at the time was for 2006. The EIA data is presented in three year moving averages.
Exhibit III-1:
Testimony of Adam Sieminski, Subcommittee on Oversight and Investigations, Committee on Energy and Commerce, U.S. House of Representatives, June 23, 2008, p. 7.
The point of Sieminski’s analysis was to respond to a Goldman Sachs projection of $200 dollar oil in the 2012-2013 time frames that was getting a lot of attention at the time.10 The author projected a continuation of increases through 2015 and concluded that a cost of “$80/bbl in the 2012-2013 time frame is very consistent with this data” and that the figure of $200/bbl “seems like a stretch.” Looking at the data available for the most recent period (2006-2008) a price of about $60/bbl was consistent with the historical trend.
9 The implied price of crude of $75 per barrel is consistent with the direct estimate of the relationship between finding
and development costs of $25 dollars per barrel, in the Sieminski Analysis presented to the Subcommittee on Oversight and Investigations.
10 Goldman Sachs engaged in a series of releases hyping high prices over the spring of 2008, ending with the prediction of $200 oil. As discussed below, Goldman Sachs was the key speculator during the spike, as discussed in section IV. Global: Energy: Oil, $100 Oil Reality, part 2: Has the Super-Spike End Game Begun?, May 5, 2008; Morgan Stanley, Commodity Shipping: Current Crude Oil Shipping Patterns Suggest $150/bbl WTI by July 4th, June 5, 2008; Javier Blas and Chris Flood, “Analyst warns of oil at $200 a barrel,” FT.Com, May 6 2008
7
Sieminski’s analysis, based on EIA data, was supported by an analysis prepared by the Japanese Ministry of Economy Trade and Industry (METI). The oil, free of the distortion of excessive speculation, was in the range of $50-$60 per barrel.
According to the METI paper, during the second half of 2007, when the physical price of West Texas Intermediate crude averaged $US90 a barrel, market speculation, geopolitical risk and currency factors were responsible for $US30-$US40 of the price.
The average WTI “fundamental price,” consistent with the underlying supply/demand situation, was around $US60/barrel during the December half-year, according to the paper, citing research for the Institute of Energy Economics in Japan.
Last week the benchmark WTI futures contract touched $US135/bbl, more than double the level of a year previously.
“We cannot say exactly what the fundamental price is at the moment,” a METI official said yesterday. “But we believe the increases this year in the market price have much to do with the influx of speculative money.11
Oil industry executives, testifying in April 2008 said that the price should be in the range of $35 to $90, with a mean of less than $60.12
Sieminski assumed that crude oil finding costs would continue to increase. In fact, contrary to the expectation at the time, in 2009 the EIA found that “average worldwide
finding costs for the FRS companies decreased $5.79 per boe (barrel of oil equivalent) of
reserves added in the 2007- 2009 period compared to the 2006-2008 period.” Interestingly, North
American supplies of oil exhibited large cost reductions. “The U.S. Offshore, fell the most in
2007-2009, $23.02, and lost its position as the highest cost region. Canada displayed a large
decline in part likely because of the inclusion of oil sands in 2009.” Although data for 2010 and 2011 are not yet available from the EIA, other sources indicate that, while finding costs rose in 2010, they had not reached the level that obtained in 2006-2008.13
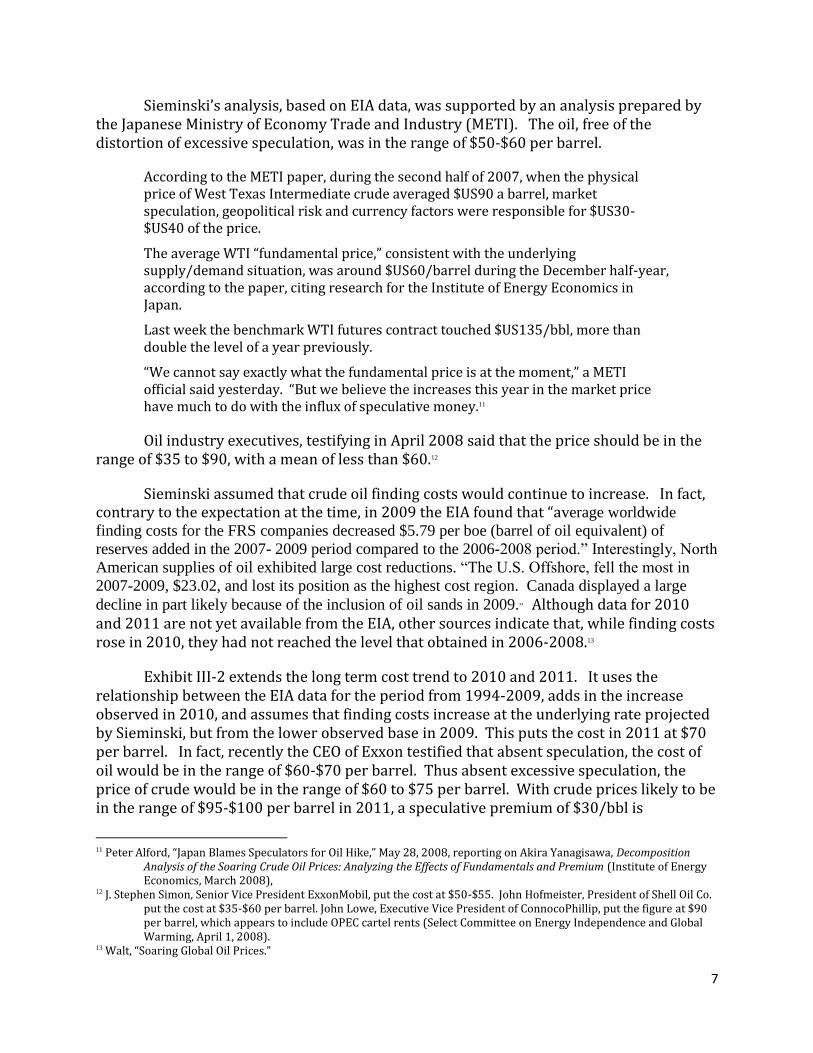
Exhibit III-2 extends the long term cost trend to 2010 and 2011. It uses the relationship between the EIA data for the period from 1994-2009, adds in the increase observed in 2010, and assumes that finding costs increase at the underlying rate projected by Sieminski, but from the lower observed base in 2009. This puts the cost in 2011 at $70 per barrel. In fact, recently the CEO of Exxon testified that absent speculation, the cost of oil would be in the range of $60-$70 per barrel. Thus absent excessive speculation, the price of crude would be in the range of $60 to $75 per barrel. With crude prices likely to be in the range of $95-$100 per barrel in 2011, a speculative premium of $30/bbl is
11 Peter Alford, “Japan Blames Speculators for Oil Hike,” May 28, 2008, reporting on Akira Yanagisawa, Decomposition
Analysis of the Soaring Crude Oil Prices: Analyzing the Effects of Fundamentals and Premium (Institute of Energy Economics, March 2008),
12 J. Stephen Simon, Senior Vice President ExxonMobil, put the cost at $50-$55. John Hofmeister, President of Shell Oil Co. put the cost at $35-$60 per barrel. John Lowe, Executive Vice President of ConnocoPhillip, put the figure at $90 per barrel, which appears to include OPEC cartel rents (Select Committee on Energy Independence and Global Warming, April 1, 2008).
13 Walt, “Soaring Global Oil Prices.”
8
$0
$20
$40
$60
$80
$100
$120
Actual Est. Based on Cost
reasonable to use as a basis for estimating the effect of excessive speculation. Additional evidence from market analysts also supports this estimate. Thus, using $30/bbl as the size of the speculative bubble is conservative.
Exhibit III-2: The Relationship between Cost and Price: 1986-2011
Source: EIA, Performance Profiles of Major energy Companies, Finding Costs; Energy Information Administration, Cushing Crude Future, contract 1, http://www.eia.gov/dnav/pet/pet_pri_fut_s1_d.htm
The bottom line take away from this cost analysis is that for a couple of decades, from the mid-1980s until the mid-2000s, there was a very close relationship between the cost fundamentals and the price of crude. Clearly, the normal relationship between cost fundamentals and price was disrupted in the mid-2000s. In the next section we show that increases and wild gyrations of commodity trading are much better candidates to explain the radical shift in prices.
Supply, Demand and Excess Capacity
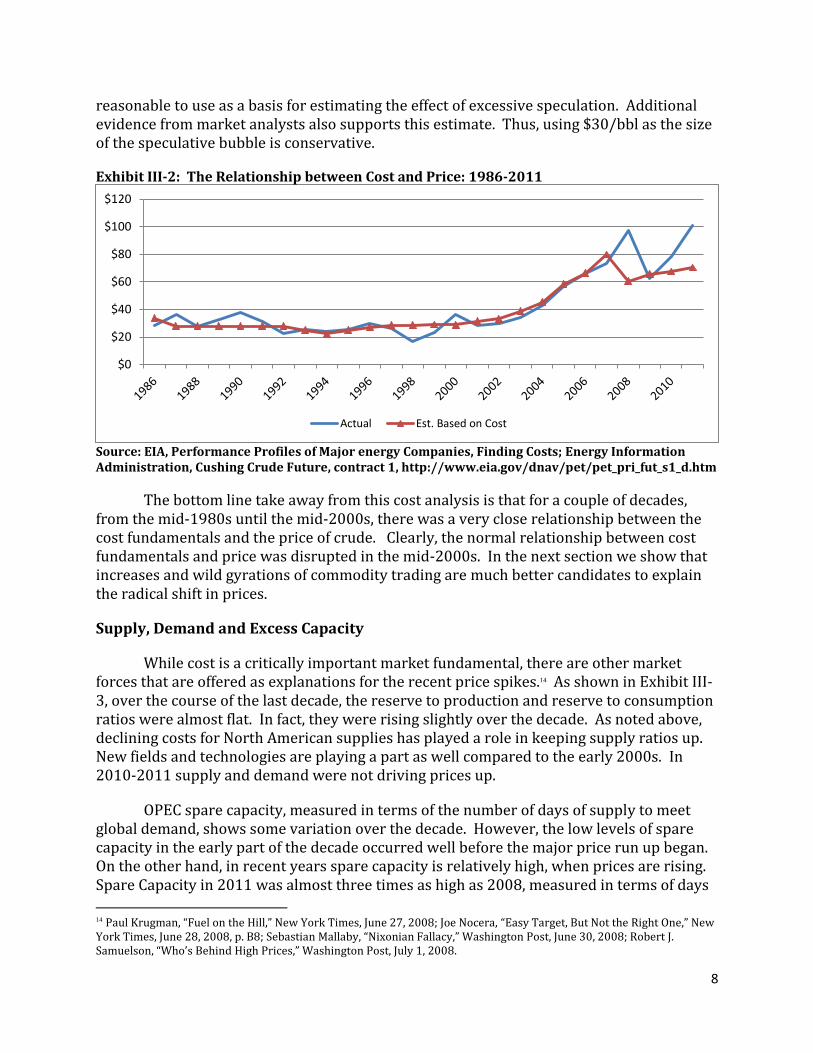
While cost is a critically important market fundamental, there are other market forces that are offered as explanations for the recent price spikes.14 As shown in Exhibit III-3, over the course of the last decade, the reserve to production and reserve to consumption ratios were almost flat. In fact, they were rising slightly over the decade. As noted above, declining costs for North American supplies has played a role in keeping supply ratios up. New fields and technologies are playing a part as well compared to the early 2000s. In 2010-2011 supply and demand were not driving prices up.
OPEC spare capacity, measured in terms of the number of days of supply to meet global demand, shows some variation over the decade. However, the low levels of spare capacity in the early part of the decade occurred well before the major price run up began. On the other hand, in recent years spare capacity is relatively high, when prices are rising. Spare Capacity in 2011 was almost three times as high as 2008, measured in terms of days
14 Paul Krugman, “Fuel on the Hill,” New York Times, June 27, 2008; Joe Nocera, “Easy Target, But Not the Right One,” New York Times, June 28, 2008, p. B8; Sebastian Mallaby, “Nixonian Fallacy,” Washington Post, June 30, 2008; Robert J. Samuelson, “Who’s Behind High Prices,” Washington Post, July 1, 2008.

9
0
10
20
30
40
50
60
70
80
90
100
2001 2002 2003 2004 2005 2006 2007 2008 2009 2010 2011
Crude real $2010 Global R/P ratio years Global R/C Ratio years OPEC Spare Capacity Days Supply
of supply. 15 This hardly seems to be a good candidate to explain rising prices. In fact, some observers of the market have noted that supplies and spare capacity are plentiful.
EXHIBIT III-3: MARKET FUNDAMENTALS AND THE PRICE OF CRUDE
Sources: Energy Information Administration, Cushing Crude Future, contract 1, http://www.eia.gov/dnav/pet/pet_pri_fut_s1_d.htm, Richard Newell, Energy and Financial Market Overview: Crude Oil Price Formation, May 5, 2011, p. 29.
Today, however, there is enough spare oil warehoused, and demand remains relatively weak after two years of recession. Even if supplies tighten, some specialists believe that more oil could be brought to the surface fairly quickly. Saudi Arabia, the world's biggest producer and the powerhouse of OPEC, which produces about 40% of the world's oil, is pumping well below its capacity. And as international oil companies revamp Iraq's giant fields after years of stagnation, growth in that country's output in the next few years will boost global supplies. "There is spare capacity in OPEC," says Olivier Jakob, managing director of PetroMatrix, an energy-analysis firm in Switzerland. "The financial picture is very different from 2008."
The current spike in oil futures, say Birol and Jakob, is a product of excess supply — of speculative dollars, billions of which are flowing into U.S. commodities markets.16
In fact, the correlation between OPEC spare capacity and prices is much weaker than the correlation we observe for speculation in the next section. Moreover, even if we use the best-fit relationship between OPEC spare capacity and the price of oil, we would project the price for crude in 2011 at considerably less than $60, given the level of spare capacity, which is almost three times as high as it was in 2008.
This critique of market fundamental as an explanation for recent price spikes should not be misinterpreted as a claim that market fundamentals do not matter. They do, but not as explanatory factors for recent price spikes. Market fundamentals are important in two
15 National Bank financial Group, Oil Price: OPEC Spare Capacity Greatly contrasts with 2008, March 9, 2011. 16 Walt, “Soaring Global Oil Prices.”

10
respects. First they influence the long term trend of prices. Second, as discussed in Section V, they create the conditions for excessive speculation. The basic conditions make the market vulnerable to manipulation and excessive speculation, which requires special vigilance from policy makers, vigilance they have failed to exercise.

11
0
20
40
60
80
100
120
140
160
19
86
19
87
19
88
19
89
19
90
19
91
19
92
19
93
19
94
19
95
19
96
19
97
19
98
19
99
20
00
20
01
20
02
20
03
20
04
20
05
20
06
20
07
20
08
20
09
20
10
20
11
e
Finding Cost $/bbl Crude Price $/bbl Open Interest (10,000 Contracts
IV. THE STRONG LINK BETWEEN SPECULATION AND PRICE SPIKES
Prices and Trading Covary Strongly
The alternative explanation for the wild gyrations of prices in the 2000s offered by CFA and supported by an increasing number of studies is that the growth of speculation increased the volume, volatility and level of oil (and commodity) prices. Exhibit IV-1 adds the number of open interest contracts for West Texas Intermediate crude oil to the earlier graph that showed price and global finding costs. Open interest is the standard measure of trading. Each contract represents 1,000 barrels of oil. West Texas Intermediate is the benchmark crude for U.S. oil prices.
EXHIBIT IV-1: OPEN INTERESTS IN WTI, CRUDE PRICES, AND FINDING COSTS
Source: Refiner Acquisition Cost, see Exhibit 2; Richard Newell, Energy and Financial Market Overview: Crude Oil Price Formation, May 5, 2011, p. 29.
Trading, costs and prices moved closely together until early in the 2000s. In 2004 the number of contracts began to increase more quickly than the historical trend. The deviation of trading in 2004 above the underlying trend was the largest such deviation to date. Then in 2006 through mid-2008, trading increased dramatically. During the gyrations of crude prices in the past half-decade, price has tracked trading much more closely than cost.
The size of the increase in trading is quite remarkable, given that there had been a stable market for two decades. From 2003 to the peak in 2008, the number of barrels of oil under contract increased three-fold. Moreover, since the value of oil was also increasing dramatically, the amount of money flowing into this market was even larger. From the end of 2003, when the total value of open interests was about $19 billion, until the peak in mid-2008, when the value of open interests was over $154 billion, there was an eight-fold increase in the size of the market.

12
0
20
40
60
80
100
120
140
160
19
86
19
87
19
88
19
89
19
90
19
91
19
92
19
93
19
94
19
95
19
96
19
97
19
98
19
99
20
00
20
01
20
02
20
03
20
04
20
05
20
06
20
07
20
08
20
09
20
10
20
11
e
Finding Cost $/bbl Crude Price $/bbl
Open Interest (10,000 Contracts Pre-bubble Trading Trend
The bursting of the bubble was equally dramatic. In the third quarter of 2008, as pressure from congress and the public outcry over oil prices forced the Commodity Futures Trading Commission to begin investigating excessive speculation, speculative money fled the market. By mid-September, before Lehman Brothers went bankrupt precipitating the financial meltdown, the oil price bubble had burst. In just three months, the value of open interests had declined by about 50% and the price of oil had fallen over 50%. By the end of the year, the bubble had completely deflated. The price of WTI crude was down to $38/bbl and the amount value of open interests was down to $43 billion. The amount of money that had exited the commodity market in last six months of 2008 was five times as large as the entire market five years earlier. This is a classic bubble.
Based on the observation that the change in trading began in 2004, Exhibit IV-2 projects oil prices on the basis of the pre-bubble trend in 1986-2003. The price projected is quite close to the underlying cost trend. Once again, this analysis supports the conclusion that a substantial speculative premium is being extracted from consumers.
Exhibit IV-2: Projecting Prices Based on Pre-bubble Trends
Source: Refiner Acquisition Cost, see Exhibit 2; Richard Newell, Energy and Financial Market Overview: Crude Oil Price Formation, May 5, 2011, p. 29.
How Bad Policy Caused Excessive Speculation
This analysis shows that speculation is a very good candidate for the factor that is driving up oil prices and the radical change in trading patterns on the basis of the covariation of prices and trading activity. In our earlier testimony and analysis we have provided evidence to support interpreting this correlation as causation.
First, there was a set of policy decisions that opened the door to excessive speculation and huge quantities of funds flowed into the oil futures market through the openings provided by policy (See Exhibit IV-3). The influx into the oil trading market after 2005 was important not only because of the amount of money that poured into the market,

13
but also because of the new types of traders who entered the market, which brought about the “financialization” of the market as discussed below.
EXHIBIT IV-3: PUBLIC POLICY AND THE INFLUX OF SPECULATIVE FUNDS
Source: “Statement of Mark Cooper on Excessive Speculation in Commodity Market and the Collapse of Market Fundamentalism,” Permanent Subcommittee on Investigations Committee on Homeland Security and Government Affairs, Hearing on Excessive Speculation in the Wheat Market, United States Senate, July 21, 2009.
The first major policy change was the passage of the Commodity Futures Modernization Act (CFMA). The CFMA made it more difficult to detect excessive speculation and market manipulation, and it opened the door to many other types of transactions that raise concerns.
Before passage of the bill in December 2000, the government retained authority over fraud and manipulation in the over-the-counter derivatives markets. In addition, market participants were restricted under Rule 35 from conducting over-the-counter markets like an exchange.
The CFMA was a major bill that drastically reduced the level of prudential regulation of derivatives markets. It reduced transparency and the government’s surveillance abilities over exchange-traded derivatives, and it completely eliminated or

14
“excluded” federal derivatives regulation of the over-the-counter market. Enron operated in that completely deregulated environment.17
The prospects for manipulation increased substantially with the passage of the Commodity Futures Modernization Act of 2000 (Act). The Act authorized trading in single-stock futures and narrow-based index instruments, and the Act specifically permitted cash settlements. These new instruments will not necessarily have liquid underlying securities. Further, all else equal, fewer numbers of securities will be easier to manipulate than larger numbers.18
The rapid rise and fall of Enron should have been a loud warning alarm that the “Enron Loophole” and its “asset-lite” business model were dangerous, but policy makers did not hear it. After the Enron bankruptcy and the recession of 2010-2011 had driven money out of commodity markets in what was ironically called “a flight to quality,”19 traders were ready to re-enter the markets and policy makers invited them in. Policy makers obliged by relaxing rules that had restricted access to these markets.
In the post-Enron period the rules of entry were relaxed to let more entities into these lightly regulated or unregulated markets.
Some lawmakers and consultants argue the government has done little to shore up the energy markets most susceptible to manipulation. The Federal Reserve relaxed rules in 2003 so that Commercial banks like Citigroup would take possession of physical commodities like oil in storage tanks… The move allowed the banks to serve as dealers in commodity derivatives…
“It is an effort by banks to move into the terrain that Enron abandoned in their bankruptcy…
As early as October 2002, less than a year after Enron declared bankruptcy, the Commodity Futures Trading Commission started to write rules exempting commodity hedge funds from regulatory oversight.20
By late 2003 the big banks and large speculators began to enter and accelerate trading to deliver the consumer from the doldrums of low, stable prices.
Wall Street banks are notoriously fickle about their commitment to commodities trading. But the eye-popping profits earned by the market leaders, Goldman Sachs and Morgan Stanley, have spurred other banks to get into the game. In 2004, Goldman Sachs and Morgan Stanley earned about $2.6 billion combined from commodities trading, most of that from energy.
The new hedge funds are sucking scarce talent away from the banks. At least 450 hedge funds with an estimated $60 billion in assets are focused on energy and the environment, including 200 devoted exclusively to various energy strategies.21
17 Dodd, Randall, “Untangling Enron: The Reforms We Need,” Challenge, March-April, 2002, pp. 72-73. 18 Hans R. Dutt and Lawrence E. Harris, “Position Limits for Cash-Settled Derivative Contracts,” Journal of Futures Markets,
25: 2005, p. 948. 19 Peter Fusaro, “Hedge Funds: The Next Wave in Energy Trading,” PRMIA: Members Update, July 2004, #7, p. 4. 20Alexei Barrionuevo, “Energy Trading, Without a Certain ‘E’,” New York Times, January 15, 2005, p. 3-3.

15
By mid-2004 a front page Wall Street Journal article entitled, “Oil Brings Surge in Speculators Betting on Prices” drew the connection between increasing trading activity and rising prices. It noted that oil had become an investment commodity.
Oil has become a speculator’s paradise. Surging energy prices have attracted a horde of investors – and their feverish betting on rising prices has itself contributed to the climb.
These investors have driven up volume on commodities’ exchanges and prompted a large push among Wall Street banks and brokerage firms to beef up energy trading capabilities. As the action picked up in the past year, those profiting include large, well-known hedge funds, an emerging group of high-rollers, as well as descendants of once-high flying energy-trading shops such as Enron Corp…22
The process of the continual influx of money results in too much money chasing too few goods. When risk capital seeking higher returns starts to chase a commodity that is relatively fixed in supply and demand in the short and midterms, it is hard to imagine that it will not have an impact on prices. In the same article from 2004, Alan Greenspan offered precisely this view of what had begun to happen in the financial markets.
“The marked rise in the net long positions of noncommercial investors in oil futures and options since May 2003 has increased net claims on an already diminished global level of commercial crude and produce inventories,” said Federal Reserve Chairman Alan Greenspan in June of this year. Oil prices accordingly have surged.”23
Most attention was focused on oil because that was a more mature market, but the effect was seen as spreading to natural gas and other energy commodities.
More than 200 hedge funds already play or are set to play in energy commodities markets, and they are primed to bring more risk capital to bear in those markets. Evidence of their trading activities is already speculated to account for the much higher crude oil prices seen in recent months, and some analysts suggest that hedge fund activity may account for up to $8 per barrel of total price. Additional evidence of their influence has been the 55% growth in open interest on NYMEX crude, heating oil, and gasoline contracts over the past year and the more violent and volatile intraday trading during recent months. What happened in oil has spread to gas, power, and coal. 24
The figure of $8 per barrel as a “hedge fund activity premium” in oil is a stunning number for mid-2004. It represents approximately 20 percent of the refinery acquisition cost in 2004 and two-thirds of the $12 increase in refinery acquisition costs between 2002 and 2004.
21 Barrionuevo, “Energy Trading,” 22 “Oil Brings Surge in Speculators Betting on Prices: Large Investors Playing Ongoing Rise is Increasing Demand and Price
Itself,” August 24, 2004, p. A-1. 23 Id., p. A-2. 24 Fusaro, Peter, “The Rise of Financial Energy Trading Markets: Enter the Hedge Funds,” Insight, October 2004, p. 3.

16
Six months later the New York Times, in an article entitled “Energy Trading, Without a Certain E,” described the activities of energy hedge funds against the backdrop of the impending Enron trials, noting that “some industry officials question whether the funds are contributing to higher energy prices, or at least stoking more price volatility.”25 While the “E” in the New York Times headline was intended to refer to Enron, it actually could stand for the huge sums of energy futures contracts that are traded without being backed by the underlying assets or equity.
By April 2006 the surge in trading had become frenzy, according to a front-page New York Times article – “Trading Frenzy Adds to Jump in Price of Oil.”26 The central anomaly was just as striking to the CEO of a major oil company in 2006 as it was to the CEO of ExxonMobil earlier this year. He made the same point – physical market conditions cannot explain financial market behaviors – “It is the case,” according to BP’s chief executive, Lord Browne, “that the price of oil has gone up while nothing has changed physically.”
The asset-lite model of Enron was proliferating across the commodity markets. Because there are few requirements for backing, entry is extremely easy and trading can escalate rapidly. “The hedge funds are borrowing as much as 10 times what they invest in some trades, analysts and traders say, contributing to short term volatility that has complicated the energy purchases of many large energy users.”27 There were doubts about the ability of the firms to withstand the risk, at least for a time.
But with the revival comes questions from some financial market analysts about whether energy trading will be better able to withstand another potential meltdown… The latest ramp-up in trading has also been marked by an air of secrecy underscored by the proliferation of hundreds of hedge funds that are speculating on everything from crude oil to electricity in both regulated and unregulated markets. Many funds are being aided by investment from banks, which are also buying up distressed power plants and other remnants of the collapsed sector… 28
As volatility and price rise, it becomes more difficult for the commercial traders, the firms that need the underlying physical commodity, to stay in the markets. They do not have the resources to play in the market. The big bankers and large traders thrive through speculation while physical traders are strangled.
Hedge funds bring increased sophistication, liquidity, and the risk culture and trading acumen to bear on energy commodities markets. Seeking new opportunities to obtain greater returns, hedge funds see energy markets as providing that opportunity. Likewise, the investment banks have a risk trading culture, deep pockets, and access to both physical and financial traders. Even the energy companies with surviving trading arms are now partnering with investment banks to sustain and improve trading operations while obtaining access to increased expertise, more sophisticated tools, and risk capital. Moreover, we have the
25 Alexei Barrionuevo, “Energy Trading, Without a Certain ‘E’,” New York Times, January 15, 2005, p. 3-3. 26 Jad Mouawad and Heather Timmons, “Trading Frenzy Adds to Jump I Price of Oil,” New York Times, April 29, 2006, A-1. 27 Id., p. 3-3. 28 Id. P. 3-3.

17
multinational oil and gas companies with the balance sheet to put their capital at risk. It is no accident that BP is the No. 1 gas trader and in the top five in power trading. BP has the balance sheet and supply to play in this new financial market.29
Developments since 2008 confirm this view of excessive speculation. Over the course of the summer of 2008, Congressional scrutiny30 and the public outcry over high gasoline prices pushed the CFTC to take measures to address some of the most egregious mistakes that had been made in adopting public policies that led to excessive speculation.31 Poorly regulated foreign commodity exchanges were challenged; the misclassification of commodity traders was corrected; and information was demanded from traders.32 Speculative money was driven out of the commodity market.
From the peak price of oil of over $145/barrel on Thursday July 3, 2008, to the Friday before the Lehman Brothers bankruptcy triggered the market meltdown, the price of oil had fallen by $44/barrel. The bubble had begun to deflate. By the time the first of the Wall Street bail out money had been spent in early October, the price of oil had come down by another $13 per barrel and was at levels that had not been seen in a year. When liquidity was further drained from the market by the recession and the financial meltdown, the bursting of the speculative bubble was complete. Excessive liquidity had pushed oil prices to outrageous levels; when the liquidity was driven out of the market, the prices plummeted. The amount of money that flowed out of the open positions in the third quarter of 2008 was three times as large as the value of the entire market in 2004, just four years earlier.
The repeated bubble and burst pattern has sensitized some analysts to the fact that the financial markets have lost touch with physical markets. Thus a CNN report from march 2011 quotes one analyst who concludes that the “speculators now own nearly six times as many barrels of oil… as can be stored at the WTI trading hub in Cushing Oklahoma,” a level that another analyst called “extraordinary.” 33
The role of speculation is so pronounced in the 2010-2011 spike, that even firms that play heavily in the market, like Goldman Sachs, recognized that speculation was playing a role. In mid-April it “caused a stir in the commodities trading world when it named “excessive speculation” the culprit for inflating oil prices.34 “Specifically, Goldman Sachs warned clients on Monday to lock-in trading profits before oil and other markets
29 Fusaro, Enter the Hedge Funds, p.3 30 Yanagisawa, Siemiski, “Testimony of Roger Diwan Regarding Energy Speculation: Is greater Regulation Necessary to
Stop Price Manipulation,” Subcommittee on Oversight and Investigations, Committee on Energy and Commerce, U.S. House of Representatives, June 23, 2008; Testimony of Michael Masters, Managing Member/Portfolio Manager, Masters Capital Management, LLC, Committee on Homeland Security and Governmental Affairs, United States Senate, May 20, 2008; “Testimony of Fadel Gheit,” Subcommittee on Oversight and Investigations, Committee on Energy and Commerce, U.S. House of Representatives, June 23, 2008; Thomas Evans, Citi Futures Perspectives, July 3, 2008; Lehman Brothers, Oil Cot-com, May 29, 2008.
31 Fusaro, Peter, “The Rise of Financial Energy Trading Markets: Enter the Hedge Funds,” Insight, October 2004, p. 3. 32 Maria Herbst, “Under Pressure from Congress – and Runaway Oil Prices – U.S. Regulators are Moving to Exert Greater Oversight, June 20098; Robert Campbell, “Big CFTC Data Revision Raises Oil Traders’ Eyebrows,” Reuters, August 5, 2008; Gregory Mocek and Athena Velie, “A New Era of Regulation Has Already Begun, Commodities Now, March 2009. 33 Colin Barr, “Speculators Double down on Oil,” CNNMoney, March 7, 2011. 34 Daniel J. Weis and Valeri Vasquez, “Oil Roulette,” Climate Progress, April 29, 2011.

18
$0
$20
$40
$60
$80
$100
$120
Oil Exec Cost Trend Pre-bubble Trading Projected Price
reverse, with the bank’s estimates suggesting speculators are boosting crude prices as much as $27 a barrel.“35
The foregoing analyses provide solid evidence that the price of crude oil would be in the range of $60-$70 per barrel absent the distorting effect of excessive speculation. With the average price of crude oil in the U.S. likely to be in the range of $95 to $100 per barrel this year, as summarized in Exhibit IV-4. Thus, a reasonable estimate of the burden of excessive speculation for this year is a $30 per barrel.
Exhibit IV-4: Estimated 2011 Price Crude Compared to Estimated 2011 Prices,
without Excessive Speculation
35 Stuart Burns, “Goldman Sachs Calls the Top in Oil and Metals: Clients Advised to Close Positions, Oilprice.com, April 14,
2011.

19
V. POLICY IMPLICATIONS
Causal Mechanisms that Link Excessive Speculation to Price and Economic Inefficiency
Markets afflicted by excessive speculation are inefficient, allowing supranormal trading profits,36 increase volatility that leads to higher risk premiums and lower production as producers exercise their option to hold assets in the ground.37 The impact falls heaviest on commercial traders.
Even when the settlements of cash-settled contracts are not purposefully manipulated, the settlement mechanism may increase underlying volatility when hedgers unwind their hedges if they have no incentive to control their trading costs. This generally is the case when hedgers trade out of their positions at the same prices that determine the final cash settlement price. The resulting price uncertainty reduces trading by risk-averse producers and thus produces deadweight losses.38
Thus, four key factors serve to drive the price spiral higher: volume, volatility, risk and transaction costs. The structure and availability of markets plays a role in allowing the volumes to increase.
Changes in the way oil is traded have contributed their part as well. On NYMEX, oil contracts held mostly by hedge funds – essentially private investment vehicles for the wealthy and institutions, run by traders who share risk and reward with their partners – rose above one billion barrels this month, twice the amount held five years ago.
Beyond that, trading has also increased outside official exchanges, including swaps or over-the-counter trades conducted directly between, say, a bank and an airline…
Such trading is a 24-hour business. And more sophisticated electronic technology allows more money to pour into oil, quicker than ever before, from anywhere in the world. 39
The influx of new money is sustained by movements of different institutions and individuals into the market.
Everybody is jumping into commodities and there is a log of cash chasing oil,” said Philip K. Verleger Jr., a consultant and former senior advisor on energy policy at the Treasury Department.40
36 Shambora, William E. and Rosemary Rossier, “Are There Exploitable Inefficiencies in the Futures Market for Oil,” Energy
Economics, January, 2007. 37 Litzenberger, Robert H. and Nir Rabinowitz, “Backwardation in Oil Futures Markets: theory and Empirical Evidence,”
Journal of Finance, 5: 1995. 38 Dutt, Hans R. and Lawrence E. Harris, “Position Limits for Cash-Settled Derivative Contracts,” The Journal of Futures
Markets, 2005, p. 497. 39 Mouawad and Timmons, “Trading Frenzy,” A-1. 40 Mouawad and Timmons, “Trading Frenzy,” A-1.

20
The hedge funds have come roaring into the commodities market, and they are willing to take risks,” said Brad Hintz, an analyst with Sanford Burnstein & Company, an investment firm in New York…
Pension funds have been particularly active in the last year, said Frederic Lasserre, the head of commodity research at Societe Generale in Paris. These investors, seeking to diversify their portfolios have added to the buying pressure on limited commodity markets.41
There are a variety of structural and behavioral ways that financial commodity markets can push prices up. Volatility and churn can be costly. Brokers take fees and traders take a spread on every transaction. Volatility increases risk, which then demands rewards. Producers, in turn, want volatility insurance. If each of these factors creates a small increase in price, it adds up to substantial increases given the amount of money involved. Volatility also raises the cost by building in a premium.
Increased volatility increases the value of producers’ operating options, options to produce now (at an “exercise price” equal to marginal production cost and with a “payoff” equal to the spot price), rather than waiting for possible increases or decreases in price. These options add an opportunity cost to current production: namely, the costs of exercising the options rather than preserving them. This and increase in volatility increases the opportunity cost of current production.43
As prices and volatility rise in a market, it gets harder and harder to convince people who have the physical commodity in the ground to part with it. They have to be bribed with higher prices to lift the oil not only because they can expect a higher price in the future, but also because they demand a higher risk premium to insure against the chance that they are selling at the bottom of volatile price swings. This basic fact has been clear in the academic literature for quite some time42 and it is finally penetrating to the popular press.
41 Mouawad and Timmons, “Trading Frenzy,” A-1. 42 Hans R. Dutt and Lawrence E. Harris, “Position Limits for Cash-Settled Derivative Contracts, The Journal of Futures
Markets,” 25 (2005), p. 497, “Even when thee settlement of cash-settled contracts are not purposefully manipulated, the settlement mechanisms may increase underlying volatility when hedgers unwind their hedges if hey have no incentive to control their trading costs. This generally is the case when hedgers trade out of their positions at the same price that determine the final cash settlement price.” Robert J. Pyndyck, “The Dynamics of Commodity Sport and Futures Markets: A Primer,” The Energy Journal, 22(2001), p. 12, emphasis in original, “Increased volatility increases the value of producers’ operating options, options to produce now (as an “exercise price” equal to the marginal production cost and with a “pay-off” equal to the spot prices), rather than waiting for possible increases or decreases in rice. These options add an opportunity cost to current production: namely the cost of exercising the option rather than preserving them. This increase in volatility increases the opportunity cost of current production.” Although Stephen Craig Pirrong, The Economics, Law and Public Policy of Market Power Manipulation (Boston, Kluwer, 1996), focuses on market manipulation, the conditions that facilitate manipulation also facilitate excessive speculation, particularly with the influx of new money, “[B]y demanding excessive deliveries a long induces distortion in the spatial and temporal distribution of consumption, transportation and storage. Shorts must pay current owners of the commodity increasingly higher prices in order to compensate current owners of the commodity for the surplus foregone. pp. 24-25). “[A} trader who does not possess any informational advantage is able to acquire market power as long as the flow of orders from other traders to the futures market is sufficiently volatile and large relative to the size of deliverable supply… Put another way, the existence of “nose traders” makes fraud possible.” (p. 12)

21
Another financial factor behind the price rise that hasn’t been talked about much on Capitol Hill or elsewhere is reduced hedging by oil companies on futures markets, says Larry Goldstein, a longtime energy analyst. In the past, crude producers would offer buyers a portion of their energy output in future years in order to protect themselves if prices pulled back. But energy companies got burned as prices kept rising during the past two years and have since cut back on selling untapped production – forcing prices for energy futures even higher. 43
Traders can profit from a rising price in a variety of ways. As long as there is more new money coming in that is willing to bid the price up, the old money in the market benefits by staying long. Given the entry of a series of new pots of money – first banks, then hedge funds, then pension funds, then index funds – this upward spiral is sustainable and profitable. Further, it is easier to ensure the inflow of funds when you are “advising” the new money what to do. It is easier to sustain the upward spiral of prices when you are hyping the market with reports about how high the prices will go.44 Traders can engage in wash trades to push the price up. As account values rise, excess margins and special miscellaneous accounts allow the trader to take money out or leverage more trading, to keep the upward spiral going. Traders and exchanges benefit from transaction fees that grow with value.
With hundreds of billions of dollars at stake and a vital commodity gyrating wildly in price around a dramatic upward trend, one would think that policymakers would examine these markets closely, but that was not the case.
Historically, most hedge fund managers have not been required to register with the U.S. Securities and Exchange Commission (SEC) and, therefore, have not been subject to regular SEC oversight…
Further, hedge funds are not subject to the numerous regulations that apply to mutual funds for the protection of investors, such as those requiring a certain degree of liquidity, the ability to redeem mutual fund shares at any time, the protection against conflicts of interests, assurance of fairness in the pricing of fund shares, disclosure regulation, the limitation in the use of leverage, etc…. The recent SEC financial disclosure requirements are really light-handed regulations used to assuage public concerns over financial markets and have had little impact on hedge fund investment.45
The fundamental transformation of the commodity market and the change in the nature of trading have led to a disconnect between the analysis of micro movements of trading (hours and days) and the long term movements.
The CFTC found that such extreme changes in price volatility were not evident in the data. However, the volatility of time-series data need not exhibit any clustering or
43 Nelson C. Schwartz, “Asleep as the Spigot,” New York Times, July 6, 2008, Business Section, p. 7. 44 Goldman Sachs, Global: Energy: Oil, $100 Oil Reality, part 2: Has the Super-Spike End Game Begun?, May 5, 2008;
Morgan Stanley, Commodity Shipping: Current Crude Oil Shipping Patterns Suggest $150/bbl WTI by July 4th, June 5, 2008.
45 Peter Fusaro and Gary Vasey, “Hedge funds Change Energy Trading,” International Research Center for Energy and Economic Development, Occasional Paper No. 39, 2005.

22
significant changes for the market to be influenced by the trading behaviors of a large group of participants. Shifting aggregate expectations due to relatively tight short-term fundamentals and changing composition of market participants are not aspects the CFTC normally examines, and these factors are indeed essential to the proper analysis of the question of the role of speculators in price formation. Thus, it can be argued that the models employed were not adequate to answer the types of questions being asked.46
However, knowing whether price changes lead or lag positions changes over short horizons, (a few days) is of limited value for assessing the price pressure effects of flows into commodity derivatives markets. Of more relevance is whether flows affect returns and risk premiums over weeks or months. The imputed flows of funds into index positions… suggest that such intermediate-terms price-pressures effects may well have been present. 47
The Proper Function of Commodity Markets and Normal Speculation
Thus, it is important to understand the purpose of commodity markets and the difference between normal speculation and excessive speculation caused by the “financialization” of commodity markets. The original purpose of commodity market was to smooth the operation of physical commodity markets. For decades the commodity markets allowed the buyers and seller to hedge risk and plan their business operations by contracting for the delivery of future supplies of the goods on which they depend for their living. Financilization of commodity markets turned these commodities into asset classes that were not traded for physical delivery. They were bought (and frequently held) for pure financial gain. A barrel of oil might be traded 10, 20 or even 30 times before it was delivered, and it never was delivered to the speculators, who came to hold three-quarters or more of the contracts.
As the risk and volatility increased with financializtion, the markets became severed from their underlying function. When this relationship is disrupted because of inadequate regulation, excessive speculation undermines the ability of the market to provide its vital functions for the real economy – driving prices too high, but simultaneously reducing, not increasing supply, creating volatility that makes it more difficult, not easier, to plan production. Risk and volatility became so great that many physical traders were forced out of the market.
The financialization of energy commodities wreaks havoc on household budgets and the economy because of the interaction between basic conditions in energy markets and the powerful and perverse effects of financialization. Exhibit V-1 summarizes an
46 Kenneth B. Medlock and Amy Myers Jaffee, “Who is in the Oil
Futures Market and How Has it Changed?” (James A Baker III Institute for Public Policy, Rice University, August 26, 2009), p. 14.
47 Kenneth J. Singleton, Investor Flow and the 2008 Boom/Bust in Oil Prices, March 23, 2011.

23
EXHIBIT V-1: PHYSICAL, FINANCIAL AND REGULATORY FACTORS IN THE ENERGY PRICE SPIRAL
Source: Mark Cooper, “The Failure of Federal Authorities to Protect American Energy Consumers from Market Power and Other Abusive Practices,” Loyola Consumer Law Review, 19:4 (2007), p. 318.

24
explanation of the interconnected role of speculation in commodity markets and market fundamentals in the price spiral.48
At the bottom of the spiral are the physical market characteristics that define the basic nature of the commodity. At the right side of the spiral are the structural conditions that affect price in the long term. On the left side of the spiral are the policy decisions and behaviors that affect price in the short term. The key role of the financial and commodity markets and the escalation of volume, volatility and price are clear. Demand and supply are relatively inelastic in the short and mid-term, while transportation of these commodities is difficult and costly, making them vulnerable to manipulation and excessive speculation.
Financializaiton allows banks and hedge funds with deep pockets and market leverage to exploit these underlying market conditions. The market participants benefit by exploiting asymmetric information. They have perverse incentives to drive prices up by straddling positions in different markets, hyping high prices in public and attracting more money into the market in private. They have strong conflicts of interest in straddling positions and playing different roles in many markets. When regulators relaxed the prudential regulation that restrained the exploitive behavior of speculators and invited new institutions to enter with different purposes and goals, the function of the commodity markets was undermined. Exemptions from oversight and repeal of restrictions allowed money to flow in and excessive speculation quickly took hold.
The role of the big, deregulated banks is pervasive in the process of financialization as described above. They led the charge into the markets, posted-eye popping profits, backed hedge funds, straddled asset classes and hyped up price increases. The opportunity to straddle a variety of markets can also be exploited by the new players. They can take positions in lightly regulated exchanges and unregulated over-the-counter markets, directly hold physical assets, and participate as large players in equity markets.49 Chasing high profits in the energy sector in markets that lack transparency increases risk, which demands higher returns. “What is readily apparent from all of this activity is that the fund community now sees the energy complex fundamentals trending to higher prices and that it offers them an attractive sector in which to inflate sagging returns for investors.”50
48 The role of speculation has been recognized by academic analysts looking at the 2008 bubble, although there remain
uncertainties about the precise size of its role. Marco Lombardi and Ine Van Rovays, Destabilizing Speculation in the Oil Market, (January 11, 2011), find the role of speculation in the price decline to be three times as large as in the increase. Across the entire cycle, it accounted for about a quarter of the price movement. Hamilton (2009) argues that oil price increases have their effect, regardless of the cause of the price increase, and concedes that “speculative investing in oil futures contracts may have contributed (p.39).” Hamilton notes that the underlying factors that create the conditions for speculation as a cause of the price spike are the same conditions as those necessary for supply and demand as causes. He notes (pp. 22-23) that the price pattern could have induced the owners of oil to keep it in the ground and they readily admit as much and act in this way. Thus, speculation becomes a cause of the supply demand balance. We believe that the movement of prices and trading since 2008 strengthen the case for a larger role of speculation in contemporary oil price setting and weaken the case for movements in fundamentals as the cause of the wild price gyrations.
49 Fusaro, Peter, and Gary Vasey, “A Major Structural Shift in Energy – But Where are the Majors?,” p. 2. 50 Fusaro, and Vasey, “Why Have They Appeared Now?,” p. 2.

25
This prediction of increasing profits made in October 2004 proved quite correct. The bonus pool at Goldman Sachs, one of the key members of the “triangle of trading,” has raised some eyebrows.
The bonus pool, as we’ve heard ad nauseam, is overflowing with some $11 billion. Mr. Paulson, the chairman and chief executive, alone took home 437 million, or about 800 times the median household income in the United States. Well done. The question is whether all of this is sustainable – and, of course, whether the bank hasn’t turned into a huge hedge fund.51
Goldman Sachs was in the thick of the extremely lucrative speculation once again in 2010-2011. When its own model concluded that speculation had increased the price of crude by as much as $27/bbl, they advised their clients who they had brought into the market to push the price up a few month earlier to get out with a 25% return in a mere five months.
Specifically, Goldman Sachs warned clients on Monday to lock-in trading profits before oil and other markets reverse, with the bank’s estimates suggesting speculators are boosting crude prices as much as $27 a barrel. Oil prices promptly dropped 3 percent as speculators anticipated Goldman’s clients would liquidate positions. Goldman’s advice came after US oil futures have risen some 20 percent this year and the bank was advising clients they should close their CCCP basket positions, taking profits on a trade that has returned 25 percent since first recommended in December.52
OPEC
Having made the case for a complex relationship between market fundamentals and excessive speculation in which trading is the primary factor in the bubble and burst cycle, we would be remise if we did not also note that OPEC plays a role in the overall process. Whenever the bubble inflates, OPEC ministers insist that it is not their fault and blame speculators.53 At one level, our analysis exonerates them from blame. At another level, they bear a great deal of responsibility.
OPEC is a rent seeking cartel that attempts to manage the price by setting supply quotas among its members. There is a great debate about how effective they are at this, but the more important point is that OPEC members, who possess the lowest cost sources of crude oil, have systematically underinvested in development of supplies.54 They distort the supply curve, driving the world to develop more expensive resources long before they would have to if the market were not distorted by the cartel behavior. With nearly 50-year reserve to consumption ratio, in spite of the withholding of supply by OPEC, it is reasonable to assume that the escalation in the price path would be much less steep absent the cartel
51 Sorkin, Andrew Ross, “Cheer to Deals that Fizzed (or Fizzled),” New York Times, January 1, 2006. 52 Stuart Burns, Goldman Sachs Calls the Top in Oil and Metals: Clients Advised to Close Their Positions, April 14, 2011; 53 Michael Greenberger, “The Relationship of Unregulated Excessive Speculation to Oil Market Volatility,” International
Energy Forum, January 5, 2010. 54 Bureau of Economics, Gasoline Price Changes and the Petroleum Industry: An Update, FTC
Staff Study, September 2011, p. 14.

26
behavior. It is also entirely possible that an orderly market would produce a much less erratic path of supply development and be less vulnerable to manipulation and excessive speculation.
POLICY IMPLICATIONS OF THE ANALYSIS
Ironically, when it is clear that the market fundamentals argument cannot explain price movements, some of its adherents invoke the problem of market psychology as the explanation. The reality of the market no long matters; it is only the perception of the participants that matters.
Everyone in the oil market is attuned to every little twitch that has the potential to damp supply or increase demand. That’s why, for instance, when Libya announced on Thursday that it might cut oil production, oil jumped more than $5. Meanwhile, when Brazil discovers a huge new oil field, the market shrugs. That is not speculation at work – its market psychology. There’s a big difference. If there is a bubble, that’s what is causing it.55
Our July 2009 testimony to the Senate Permanent Subcommittee on Investigations Committee on Homeland Security and Government Affairs concluded with the following advice and irrational psychology.
In the end, if it is just psychology, we would urge policy makers to ask themselves whether they are obligated to let the psychos run wild in a market as vital as oil. We submit that you are not. If the traders in this market have become irrationally attuned to “every little twitch” that might increase prices, but disregard facts that might lower prices, it is hard to conclude that the market is functioning properly. The psychos need a little sedation to restore balance to their perspective. Prudential regulation has the benefit of both preventing excessive speculation and sedating the psychos, not to mention allowing the physical traders to reenter the market and use its price discovery and risk management functions.56
The need to restore effective prudential regulation in commodity markets is just as great today, if not greater given the demonstration that the bubble and burst cycle has repeated itself and the vulnerable state of the economy.
Recognizing that excessive speculation exists and imposes huge costs on consumers and the economy is the first step in solving the problem. It creates the predicate for vigorous new policies to reduce excessive speculation.
It was foolish to believe that self-regulation would prevent excessive speculation and two speculative bubbles in less than half a decade make it clear that self-regulation has not and will not work.
55 Joe Nocera, “Easy Target, But Not the Right One,” New York Times, June 28, 2008, p. B8. 56 “Statement of Mark Cooper on Excessive Speculation in Commodity Market and the Collapse of Market
Fundamentalism,” Permanent Subcommittee on Investigations Committee on Homeland Security and Government Affairs, Hearing on Excessive Speculation in the Wheat Market, United States Senate, July 21, 2009. P. 12.

27
Coordination across agencies both domestically and internationally is critically important to driving excessive speculation out of national and international markets, but the U.S. cannot wait for others to act. The U.S. is the largest single market for many of these commodities. The U.S. accounts for one quarter of the daily global oil consumption. If we do not lead, there will be no one to follow.
In 2008 we suggested a lengthy set of policies that are needed to address the severe problem of excessive speculation. These policies address all of the problems listed in the financial side of the price spiral analysis in Exhibit V-1`.
Chase out bad actors: All traders must register and be certified (for honesty and competence, like bankers and brokers). All trading must be reported across all transactions
Eliminate the funny money: Raise margin requirements. Increase capital reserve requirements,
Reduce the ability to push prices up: Lower position limits and tie limits and margin policies to needs of physical, traders. Lengthen settlement windows. Ban conflicts of interest (analyst's reports that enrich analyst's portfolios)
Restore the proper functioning of commodity markets and their regulators: Enforce meaningful speculative limits, Do honest analysis (classify traders correctly). Close the loopholes (foreign boards of Trade exemptions, the Enron and swaps). Create minimum criminal penalties for violation of commodity laws
Redirect investment to productive long-term uses: Put a tax on short-term capital gains. Move pension funds out of speculation, Ban institutional index funds.
Position limits, which are at the head of the list of policies the CFTC is now working on, are one of the tools in the arsenal, but they have to be meaningful and they alone will not be enough.
Interestingly, in evaluating the position limits proposal circulated by the CFTC in the summer,57 a financial services consulting firm estimated that the CFTC proposal would reduce open positions by between zero and eight percent. Based on the relationship between trading and price, it would take a 25 percent reduction of open interests to eliminate the speculative excess from the price. At the high end of the estimate, eight percent would be an important step forward. Obviously, zero would be unacceptable. Position limits are not the only policy instrument to deal with excessive speculation, but they are an important instrument to control excessive speculation. The CFTC has yet to adopt the rules and any weakening of this modest first step would be a mistake.
57 Keefe, Bruyette & Woods, Exchange Order Execution, September 6, 2011.