excess funds and agency problems: an empirical study of ... · excess funds and agency problems: an...
TRANSCRIPT

Excess Funds and Agency Problems:An Empirical Study of IncrementalCash Disbursements
Erik LieCollege of William & Mary
This study investigates the excess funds hypothesis using samples of specialdividends, regular dividend increases, and self-tender offers. All three types offirms tend to have funds in excess of industry norms before the events. The excessfunds are largely nonrecurring for special dividend and self-tender offer firms andrecurring for regular dividend increase firms. The analysis of the stock pricereaction suggests that large incremental disbursements mitigate the agency prob-lem associated with excess funds. In particular, the stock price reaction is positivelyrelated to excess funds for self-tender offers and large special dividends, but not
Ž .for regular dividend increases which tend to be smaller or small special dividends.
Several studies document significant positive returns around announce-� Ž . Ž .ments of cash disbursements Pettit 1972 , Aharony and Swary 1980 ,
Ž . Ž . Ž .Masulis 1980 , Dann 1981 , Vermaelen 1981 , Asquith and MullinsŽ . Ž .�1983 , and Brickley 1983 . At least two potential sources of thesepositive returns have been offered in the literature. First, the signalinghypothesis suggests that disbursements signal favorable information
� Ž .about the firm’s future cash flows Bhattacharya 1979 , John andŽ . Ž .�Williams 1985 , and Miller and Rock 1985 . This hypothesis assumes
that managers possess valuable information about future cash flows thatis not available to the public. Several studies provide support for the
� Ž .�signaling hypothesis in the context of special dividends Brickley 1983 ,� Ž .regular dividend increases Ofer and Siegel 1987 and Healy and
Ž .� � Ž .Palepu 1988 , and self-tender offers Vermaelen 1981 and Dann,Ž .�Masulis, and Mayers 1991 . Second, the excess funds hypothesis as-
serts that disbursements may mitigate agency problems between man-� Ž . Ž .agers and shareholders Easterbrook 1984 , Jensen 1986 , and Lang
Ž .�and Litzenberger 1989 . Specifically, a cash disbursement reducesfunds available to managers, thereby preventing managers from invest-
Ž .ing in negative net present value NPV projects.The evidence in favor of the excess funds hypothesis is scant. Lang
Ž .and Litzenberger 1989 find that the abnormal returns around an-nouncements of regular dividend increases are positively related to a
I would like to thank Dave Denis, Randy Heron, Dave Ikenberry, Heidi Lie, John McConnell,Ž .Renee Price, Sheridan Titman the editor , two anonymous referees, and participants at the´
University of Texas�SFS Corporate Finance Conference for helpful comments. Address corre-spondence to Erik Lie, College of William & Mary, School of Business Administration, P.O.Box 8795, Williamsburg, VA 23187, or e-mail: [email protected].
The Re� iew of Financial Studies Spring 2000 Vol. 13, No. 1, pp. 219�248� 2000 The Society for Financial Studies

The Re� iew of Financial Studies�� 13 n 1 2000
firm’s potential to overinvest, as measured by Tobin’s Q, and interpretthis as evidence in support of the excess funds hypothesis. However,
Ž . Ž .Denis, Denis, and Sarin 1994 and Yoon and Starks 1995 questionthis interpretation. Since equity values equal the present value of futuredividends, investors expect low dividend yield firms to increase theirdividends at a faster rate than high dividend yield firms. Thereforedividend increases by high dividend yield firms, which generally alsohave a low Tobin’s Q, are more surprising and are thus associated withstronger stock price reactions. Indeed, neither Denis, Denis, and SarinŽ . Ž .1994 nor Yoon and Starks 1995 find any relation between abnormalreturns around dividend increase announcements and Tobin’s Q aftercontrolling for the size of the dividend change and dividend yield.
The mixed evidence on the excess funds hypothesis in the context ofregular dividend changes appears to be attributable to the confoundingeffects of dividend increase expectations and investment opportunities.In contrast, there is no obvious link between Tobin’s Q and expecta-tions about either special dividends or share repurchases. Thereforestudies of special dividends and share repurchases may offer cleanertests of the excess funds hypothesis. However, Howe, He, and KaoŽ .1992 find no evidence in support of the excess funds hypothesis in astudy of special dividends and self-tender offers.
This study reexamines the excess funds hypothesis in the context ofspecial dividends, regular dividend increases, and self-tender offers.While special dividends and self-tender offers are largely one-time cashdisbursements, regular dividend increases typically lead to a perma-
� Ž .�nently higher dividend level Brickley 1983 . This difference has impor-tant implications. Firms that have experienced a nonrecurring accumu-lation of excess cash, for example, due to asset sales, should pay out thisexcess cash through a special dividend or a self-tender offer rather thanthrough an increase in the regular dividend, since the latter would also‘‘commit’’ the firm to pay higher future dividends. Conversely, firms thatgenerate excess cash flow from normal operations can more effectivelycurb current and future overinvestment by increasing the regular divi-dend than by paying a one-time special dividend or conducting aself-tender offer. Despite these two dimensions of excess funds, both
Ž .Howe, He, and Kao’s 1992 study of special dividends and self-tenderŽ .offers and Denis, Denis, and Sarin’s 1994 study of regular dividend
changes employ the firm’s cash flow as the only measure of excessfunds.
The sample used in this study consists of 570 special dividends, 7,417regular dividend increases, and 207 self-tender offers. Consistent withprior studies, I find a significant positive market reaction around theannouncements of these incremental cash disbursements. The meanannouncement period returns are 3.5%, 1.3%, and 8.0% for special
220

Excess Funds and Agency Problems
dividends, regular dividend increases, and self-tender offers, respec-tively.
Next, I examine the cash flows and cash levels in the years aroundthe announcements to determine the need for the sample firms todisburse funds. Firms that announce special dividends, regular dividendincreases, and self-tender offers all tend to have higher levels ofundistributed cash flow prior to the events than their respective industrymedians. However, the industry-adjusted cash flow is higher both beforeand after the event for firms that increase regular dividends than forfirms that pay special dividends or conduct self-tender offers. Further-more, all types of firms tend to increase their cash levels during theyears before the event, and have cash levels above the industry levelsimmediately prior to the event, although these tendencies are weakerfor firms that increase regular dividends. In short, while firms that
Žemploy one-time cash disbursements special dividends and self-tender.offers have accumulated more cash prior to the event than firms that
increase regular dividends, they typically generate less cash flow bothbefore and after the event.
Finally, I relate the announcement period returns to cash level andcash flow measures. The announcement period returns around specialdividends are unrelated to cash flows, consistent with Howe, He, and
Ž .Kao 1992 . However, the returns are positively related to cash levels,and this relation is stronger for firms with poor investment opportuni-ties, as indicated by a Tobin’s Q of less than one. Of interest, thepositive relation between announcement period returns and cash levelsis statistically significant only for large special dividends.1 The an-nouncement period returns around regular dividend increases, whichgenerally constitute much smaller disbursements than special dividends,are not related to either cash flows or cash levels. Finally, the an-nouncement period returns around self-tender offers are unrelated tocash flows, but related to cash levels. In particular, the returns and cashlevels are significantly more positively related for firms with a lowTobin’s Q than for firms with a high Tobin’s Q. Overall, I interpretthese findings to suggest that large incremental disbursements, that is,self-tender offers and large special dividends, effectively curb overin-vestment, while the evidence for small incremental disbursements isinconclusive.
There is at least one other interpretation of the stock price evidencefor self-tender offers. Managers may view a share repurchase as analternative to real investments. If so, they are likely to repurchaseshares when they perceive them to be undervalued by the market.
1 Large special dividends are defined as those dividends scaled by the market value of equity thatexceed the sample median.
221

The Re� iew of Financial Studies�� 13 n 1 2000
Hence the positive stock price reaction may simply reflect a signalregarding the current share price. Of course, the signaling and agencyexplanations are not mutually exclusive. Further, while the evidencedoes not refute this signaling notion, the observed link between thestock price reaction, investment opportunities as proxied by Tobin’s Q,and cash levels seems more consistent with agency theory. Agencytheory predicts a positive relation between the stock price reaction andcash levels for low Q firms, and no relation for high Q firms, and thesepredictions are supported by the data. In contrast, the signaling hypoth-esis offers no clear prediction regarding the relation between the stockprice reaction and cash levels. I also conclude that defensive self-tenderoffers do not explain the findings, since the results are similar ifdefensive self-tender offers are excluded from the analysis.
The remainder of the article proceeds as follows. The next sectiongives an overview of related literature. Section 2 describes the sample.Section 3 presents the empirical results. Section 4 summarizes andconcludes.
1. Related Literature
1.1 Excess funds and agency theoryThe interests of the claimholders and the managers of a corporation
Ž .often do not coincide. For instance, Jensen 1986 argues that managershave incentives to expand the corporation beyond its optimal size
Ž .because 1 this increases the resources under managerial control andŽ .2 executive compensation is positively related to firm size. Conse-quently, if the corporation has substantial excess funds, managers willoften invest in negative-NPV projects. This overinvestment problem can
Ž .be mitigated by reducing excess funds. Easterbrook 1984, pp. 657�658suggests that ‘‘dividends may keep firms in the capital market, wheremonitoring of managers is available at a lower cost, and may be usefulin adjusting the level of risk taken by managers and the different classesof investors.’’
Using a sample of 429 regular dividend changes between 1979 andŽ .1984, Lang and Litzenberger 1989 find evidence in support of the
excess funds theory. They report that announcement period returns aresignificantly higher for firms with less favorable investment opportuni-ties, as indicated by a low Tobin’s Q. In contrast, Howe, He, and KaoŽ .1992 report that the market’s reaction to 55 self-tender offers and 60special dividends announced between 1979 and 1989 is unrelated toTobin’s Q. They also develop more refined tests in which they regressthe announcement period returns against the firms’ preevent cash flowand an interaction term between Tobin’s Q and cash flow. Such tests
222

Excess Funds and Agency Problems
may better capture the extent to which managers in the sample firmsare likely to waste excess funds. However, even the refined tests fail touncover a relation between announcement period returns and the firm’s
Ž .potential to overinvest. Furthermore, Denis, Denis, and Sarin 1994argue that the negative relation between Tobin’s Q and the stock pricereaction to regular dividend changes may be due to a negative relationbetween dividend yield and Tobin’s Q. Using a sample of 6,777 dividendchanges between 1962 and 1988, they find support for this argument.
Ž .Yoon and Starks 1995 report similar results using a sample of 4,179dividend changes between 1969 and 1988. Following Howe, He, and
Ž .Kao 1992 , Denis, Denis, and Sarin also study the relation betweenannouncement period returns and cash flow, but again they find nosupport for the excess funds hypothesis. Finally, both Denis, Denis, andSarin, and Yoon and Starks find that capital expenditures increasefollowing dividend increases and decrease following dividend decreasesregardless of the level of Tobin’s Q.2 In sum, the literature offers littleevidence that cash disbursements effectively deter managerial overin-vestment.
1.2 Special dividends versus regular dividend increasesŽ .Brickley 1983 examines a sample of 165 special dividends and 100
regular dividend increases between 1969 and 1979, where special divi-dends are defined as dividends that are labeled by management as‘‘extra,’’ ‘‘special,’’ or ‘‘year-end’’ and are not preceded by other specialdividends in the prior 2 years. He finds that, ceteris paribus, the marketreaction to special dividend announcements is smaller than that toregular dividend increase announcements, suggesting that regular divi-dend increases convey more positive information than do special divi-dends. Further, the dividend yield following regular dividend increasesis larger than that following special dividends. Finally, while both firmsthat increase regular dividends and those that pay special dividendsexperience increases in earnings during the fiscal year of the event, onlyfirms that increase regular dividends experience an increase during theyear following the event. These results are all consistent with the ideathat regular dividend increases convey a stronger signal about futureprospects than do special dividends. In addition, the results suggest thatregular dividends are more ‘‘sticky’’ than are special dividends.
Like special dividends, self-tender offers are one-time disbursementsof cash. Consequently, special dividends and self-tender offers should
2 Although capital expenditures increase following dividend increases, this does not necessarilymean that dividend increases fail to curtail investments. Investments may take other forms, suchas business acquisitions, that are not included in capital expenditures. More importantly, we donot know what the investment levels would have been in the absence of dividend increases, andthus we cannot assess the true impact of dividend increases.
223

The Re� iew of Financial Studies�� 13 n 1 2000
be used to disburse nonrecurring accumulations of excess funds, whileregular dividend increases should be used to disburse recurring accumu-
Ž .lations of excess funds i.e., excess current and future cash flow .
2. Sample
2.1 Sample constructionThe samples of special dividends and increases of regular quarterlydividends are constructed by first identifying all such events on theCRSP tapes between 1978 and 1993. For the special dividends, I requirethat the firms did not pay any other special dividends in the 2-year
� Ž .period prior to the declaration date following Brickley 1983 andŽ .�Howe, He, and Kao 1992 . For the regular dividend increases, I
require that the increase in consecutive quarterly dividends exceeds10% and that no other type of distribution was made between the two
� Ž .�quarterly dividends following Denis, Denis, and Sarin 1994 . Theinitial sample of self-tender offers covers the period between September
Ž .1981 and December 1994 and is taken from Lie and McConnell 1998 .Ž .For all types of incremental disbursements, I require that 1 the firm is
Ž .not a financial company, 2 CRSP provides sufficient return data toŽ .estimate abnormal returns, and 3 Compustat provides information on
cash and cash flow for the firm. These requirements leave final samplesof 570 special dividends, 7,417 regular dividend increases, and 207self-tender offers.
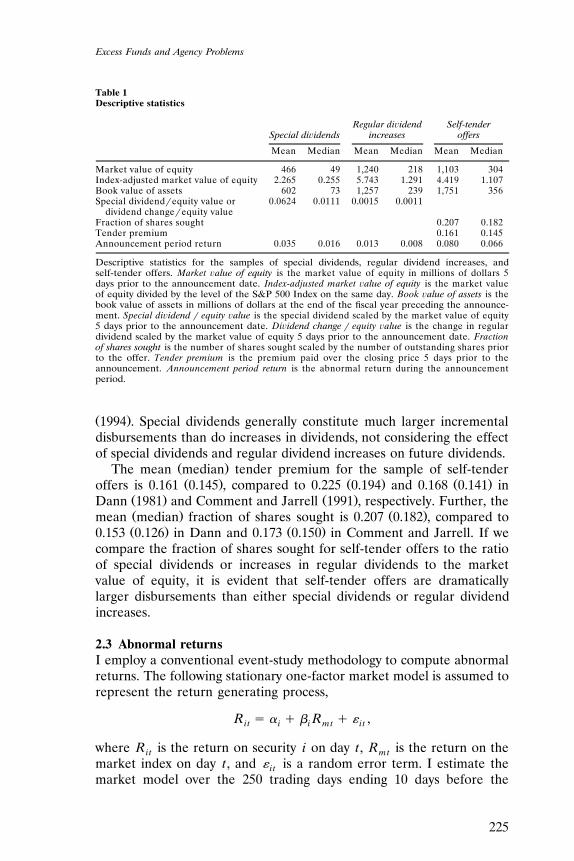
2.2 Sample descriptionTable 1 provides descriptive statistics for the samples. The meanŽ . Ž .median market value of equity is $466 million $49 million for firms
Ž .that pay special dividends, $1,240 million $218 million for firms thatŽ .increase regular dividends, and $1,103 million $304 million for firms
that conduct self-tender offers. To make the market values comparableover time, the market value of the firm’s equity is divided by the level ofthe S&P 500 Index at the time of the announcement. The index-adjusted market value of equity also indicates that firms that pay specialdividends are considerably smaller than those that increase regulardividends or conduct self-tender offers. As yet another measure of firmsize, the book value of assets confirms that firms that pay specialdividends typically are smaller than the other sample firms.
Ž .The mean median ratio of special dividends to the market value ofŽ .equity is 0.062 0.011 . The corresponding figure in Howe, He, and Kao
Ž . Ž . Ž .1992 is 0.023 0.014 . Moreover, the mean median ratio of regularŽ .dividend increases to the market value of equity is 0.0015 0.0011 . The
mean change is identical to that reported in Denis, Denis, and Sarin
224
Excess Funds and Agency Problems
Table 1Descriptive statistics
Regular di� idend Self-tenderSpecial di� idends increases offers
Mean Median Mean Median Mean Median
Market value of equity 466 49 1,240 218 1,103 304Index-adjusted market value of equity 2.265 0.255 5.743 1.291 4.419 1.107Book value of assets 602 73 1,257 239 1,751 356Special dividend�equity value or 0.0624 0.0111 0.0015 0.0011
dividend change�equity valueFraction of shares sought 0.207 0.182Tender premium 0.161 0.145Announcement period return 0.035 0.016 0.013 0.008 0.080 0.066
Descriptive statistics for the samples of special dividends, regular dividend increases, andself-tender offers. Market �alue of equity is the market value of equity in millions of dollars 5days prior to the announcement date. Index-adjusted market �alue of equity is the market valueof equity divided by the level of the S&P 500 Index on the same day. Book �alue of assets is thebook value of assets in millions of dollars at the end of the fiscal year preceding the announce-ment. Special di� idend � equity �alue is the special dividend scaled by the market value of equity5 days prior to the announcement date. Di� idend change � equity �alue is the change in regulardividend scaled by the market value of equity 5 days prior to the announcement date. Fractionof shares sought is the number of shares sought scaled by the number of outstanding shares priorto the offer. Tender premium is the premium paid over the closing price 5 days prior to theannouncement. Announcement period return is the abnormal return during the announcementperiod.
Ž .1994 . Special dividends generally constitute much larger incrementaldisbursements than do increases in dividends, not considering the effectof special dividends and regular dividend increases on future dividends.
Ž .The mean median tender premium for the sample of self-tenderŽ . Ž . Ž .offers is 0.161 0.145 , compared to 0.225 0.194 and 0.168 0.141 in
Ž . Ž .Dann 1981 and Comment and Jarrell 1991 , respectively. Further, theŽ . Ž .mean median fraction of shares sought is 0.207 0.182 , compared toŽ . Ž .0.153 0.126 in Dann and 0.173 0.150 in Comment and Jarrell. If we
compare the fraction of shares sought for self-tender offers to the ratioof special dividends or increases in regular dividends to the marketvalue of equity, it is evident that self-tender offers are dramaticallylarger disbursements than either special dividends or regular dividendincreases.
2.3 Abnormal returnsI employ a conventional event-study methodology to compute abnormalreturns. The following stationary one-factor market model is assumed torepresent the return generating process,
R � � � � R � � ,i t i i mt i t
where R is the return on security i on day t, R is the return on thei t mtmarket index on day t, and � is a random error term. I estimate thei tmarket model over the 250 trading days ending 10 days before the
225

The Re� iew of Financial Studies�� 13 n 1 2000
announcement, using the CRSP daily equally weighted index as a proxyfor the market index. The abnormal stock return for security i on day tis defined as
ˆAR � R � � � � R ,ˆŽ .i t i t i i mt
ˆwhere � and � are the ordinary least squares estimates of security i’sˆmarket model parameters.
For special dividends and regular dividend increases, the announce-ment date is defined as the declaration date provided by CRSP, and theannouncement period is defined as the period from the day before theannouncement date through the second day after the announcementdate. I include the one day before and two days after the announcementdate in the announcement period because the abnormal returns onthese days are significantly different from zero, suggesting that theycontain valuable information. For self-tender offers, the announcementdate is identified in the Wall Street Journal or the Dow Jones NewsRetrie�al Ser�ice, and the announcement period return is defined as theperiod from three days before the announcement date through the thirdday after the announcement date, following Comment and JarrellŽ . 31991 .
Ž .For the special dividends, the mean median abnormal return overŽ .the announcement period is 3.5% 1.6% . In comparison, Brickley
Ž . Ž .1983 and Howe, He, and Kao 1992 report mean announcementperiod returns of 2.1% and 3.4%, respectively. For the regular dividend
Ž .increases, the mean median announcement period return is 1.3%Ž .0.8% , compared to a mean of 1.25% reported by Denis, Denis, and
Ž . Ž .Sarin 1994 . Finally, for the self-tender offers, the mean medianŽ .announcement period return is 8.0% 6.6% , compared to 7.5% in
Ž . Ž .Howe, He, and Kao 1992 and 8.4% in Comment and Jarrell 1991 .
3. Results
3.1 Cash flows around the eventsI first investigate the cash flows around the announcements of incre-mental cash disbursements and compare these to industry benchmarks.Table 2 presents the undistributed cash flow scaled by assets around
Ž .special dividend announcements panel A , regular dividend increasesŽ . Ž .panel B , and self-tender offers panel C . Following Lehn and Poulsen
3 I also experimented with different announcement periods for the three samples, but the generaltenor of the results is the same. For example, using a shorter announcement period for theself-tender offers yields lower explanatory power in the cross-sectional regressions of theannouncement period returns, but the coefficients of interest remain statistically significant.
226

Excess Funds and Agency Problems
Table 2Undistributed cash flow
Levels Changes
Year �3 �2 �1 0 1 2 3 �3 to �1 �1 to 1 1 to 3
Panel A: Special di� idendsUnadjusted
a a a a a a b bMean 0.062 0.062 0.064 0.009 0.056 0.046 0.049 0.002 �0.008 �0.008a a a a a a a b aMedian 0.062 0.061 0.065 0.055 0.060 0.054 0.052 0.005 �0.007 �0.003
Industry adjusteda a a a aMean 0.020 0.016 0.018 �0.040 0.011 0.003 0.008 �0.004 �0.009 �0.003a a a a a bMedian 0.008 0.009 0.013 0.001 0.007 0.008 0.003 0.004 �0.004 �0.004
No. of sample firms 532 555 570 543 515 492 445 532 515 444
Panel B: Regular di� idend increasesUnadjusted
a a a a a a a a a aMean 0.084 0.087 0.091 0.090 0.082 0.075 0.072 0.007 �0.009 �0.010a a a a a a a a a aMedian 0.083 0.086 0.089 0.090 0.084 0.078 0.075 0.004 �0.004 �0.006
Industry adjusteda a a a a a a a a aMean 0.030 0.031 0.033 0.033 0.029 0.026 0.024 0.007 �0.004 �0.005
Median 0.023a 0.024a 0.027a 0.028a 0.024a 0.022a 0.019a 0.005a �0.001a �0.004a
No. of sample firms 5,426 6,465 7,417 7,252 6,960 6,681 6,261 5,426 6,960 6,246
Panel C: Self-tender offersUnadjusted
a a a a a a aMean 0.060 0.067 0.069 0.069 0.067 0.041 0.062 0.009 �0.003 �0.007a a a a a a aMedian 0.072 0.069 0.073 0.073 0.069 0.062 0.070 0.003 �0.006 �0.004
Industry adjusteda a a b bMean 0.013 0.021 0.024 0.021 0.021 �0.003 0.013 0.011 �0.003 �0.011
a a a a a aMedian 0.018 0.019 0.021 0.022 0.022 0.009 0.018 0.003 �0.003 �0.006No. of sample firms 200 205 207 197 179 169 156 200 179 153
Mean and median levels and changes of undistributed cash flow scaled by total assets in the years aroundannouncements of special dividends, regular dividend increases, and self-tender offers. Year 0 is defined as thefiscal year of the announcement. T-tests and Wilcoxon signed-rank tests are used to test the hypotheses thatthe means and medians are equal to zero, respectively. Industry-adjusted figures are the paired differencesbetween the sample firms and their industry medians. a and b denote significance at the 1% and 5% levels,respectively.
Ž . Ž . Ž .1989 , Howe, He, and Kao 1992 , and Denis, Denis, and Sarin 1994 ,undistributed cash flow is defined as operating income before deprecia-tion minus interest expenses, taxes, and dividends. The special dividendfirms typically generate cash flow of 6% to 7% of assets in the yearsbefore the announcement, and this is 1% to 2% higher than themedians for their respective industries. In the following years, cash flowdecreases slightly, such that it is barely above the industry norm. Theregular dividend increase firms typically generate cash flow scaled byassets of 9% before the announcement, and this is 3% higher than themedians for their respective industries. Despite the increase in regulardividends, and a corresponding decrease in undistributed cash flow overthe next years, cash flow continues to be between 2% and 3% above theindustry medians in the years following the announcement. Lastly, theself-tender offer firms generate a preannouncement cash flow of 7% ofassets, which is roughly 2% higher than the industry peers. Cash flowseems fairly stable over the next couple of years, before it drops tolevels closer to the industry norm.
A potential weakness associated with the undistributed cash flowŽ .measure developed by Lehn and Poulsen 1989 is that it ignores cash
227

The Re� iew of Financial Studies�� 13 n 1 2000
disbursements through share repurchases. To alleviate this, I developeda cash flow measure that incorporates the value of shares repurchasedby the firm. Using this measure yields somewhat lower industry-adjustedcash flows than those reported in Table 2 for all three samples,suggesting that the sample firms typically repurchase more shares than
Ž .their industry peers. For example, the revised mean median industry-Ž .adjusted cash flow in year �1 is 0.013 0.012 for special dividends,
Ž . Ž .0.029 0.026 for regular dividend increases, and 0.015 0.016 forself-tender offers. More importantly, the cash flow in years 0 and 1 forfirms that conduct self-tender offers is considerably lower than thatreported in Table 2, reflecting the value of the self-tender offers. In
Ž .particular, the revised mean median industry-adjusted cash flow forŽ . Ž .self-tender offer firms is �0.142 �0.105 in year 0 and �0.019 0.005
in year 1.In sum, the evidence presented thus far suggests that firms that
disburse cash typically generate more cash flow than their industrynorms before the disbursement year. Further, firms that increase regu-lar dividends generate more cash flow prior to the event than do firmsthat pay special dividends or conduct self-tender offers. In addition,regular dividend firms continue to generate more cash flow than theother sample firms for at least 3 years after the event.
3.2 Cash levels around the eventsPrevious empirical studies of the excess funds hypothesis in the contextof incremental cash disbursements focus on undistributed cash flow asthe indicator of excess funds. However, firms may have accumulatedsubstantial cash levels despite low cash flows from normal operations.These cash accumulations may arise from strong operating cash flows inthe past or recent extraordinary cash flows, for example, liquidation ofassets.
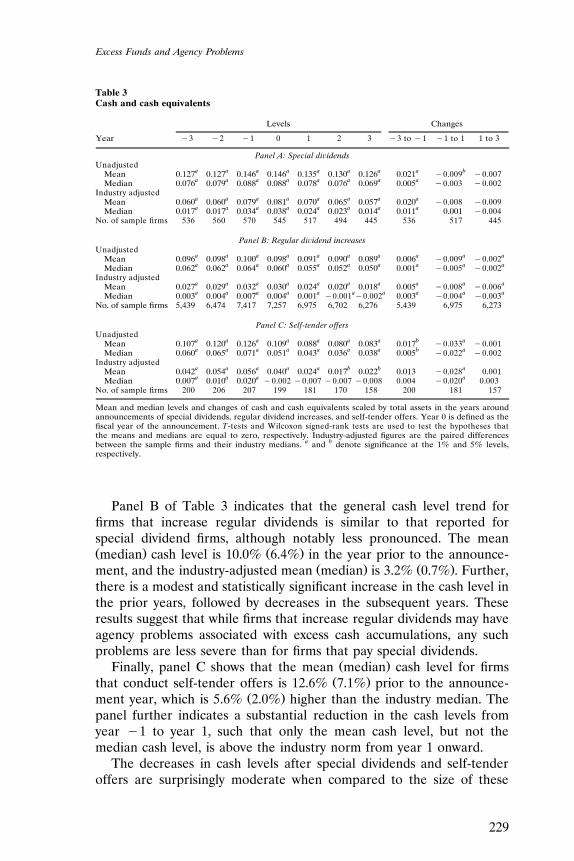
Table 3 presents the cash and cash equivalents scaled by assetsŽ .around special dividend announcements panel A , regular dividend
Ž . Ž .increases panel B , and self-tender offers panel C . In the yearŽ .preceding special dividends, firms have a mean median cash level of
Ž . Ž .14.6% 8.8% while the industry-adjusted mean median , that is, thedifference between the cash levels of the sample firms and the median
Ž .cash levels of their respective industries, is 7.9% 3.4% . The numbersfurther indicate a significant increase in cash levels prior to the eventyear, followed by a decline after the event year. Overall the cash levelsof special dividend firms appear to reach a peak immediately prior tothe event, at which point the cash levels are substantially above theindustry norm. These accumulations of cash may host agency problems.Alternatively, because special dividend firms tend to be small, they mayrequire above average cash levels to conduct their ordinary business.
228
Excess Funds and Agency Problems
Table 3Cash and cash equivalents
Levels Changes
Year �3 �2 �1 0 1 2 3 �3 to �1 �1 to 1 1 to 3
Panel A: Special di� idendsUnadjusted
a a a a a a a a bMean 0.127 0.127 0.146 0.146 0.135 0.130 0.126 0.021 �0.009 �0.007a a a a a a a aMedian 0.076 0.079 0.088 0.088 0.078 0.076 0.069 0.005 �0.003 �0.002
Industry adjusteda a a a a a a aMean 0.060 0.060 0.079 0.081 0.070 0.065 0.057 0.020 �0.008 �0.009a a a a a a a aMedian 0.017 0.017 0.034 0.038 0.024 0.023 0.014 0.011 0.001 �0.004
No. of sample firms 536 560 570 545 517 494 445 536 517 445
Panel B: Regular di� idend increasesUnadjusted
a a a a a a a a a aMean 0.096 0.098 0.100 0.098 0.091 0.090 0.089 0.006 �0.009 �0.002a a a a a a a a a aMedian 0.062 0.062 0.064 0.060 0.055 0.052 0.050 0.001 �0.005 �0.002
Industry adjusteda a a a a a a a a aMean 0.027 0.029 0.032 0.030 0.024 0.020 0.018 0.005 �0.008 �0.006
Median 0.003a 0.004a 0.007a 0.004a 0.001a �0.001a�0.002a 0.003a �0.004a �0.003a
No. of sample firms 5,439 6,474 7,417 7,257 6,975 6,702 6,276 5,439 6,975 6,273
Panel C: Self-tender offersUnadjusted
a a a a a a a b aMean 0.107 0.120 0.126 0.109 0.088 0.080 0.083 0.017 �0.033 �0.001a a a a a a a b aMedian 0.060 0.065 0.071 0.051 0.043 0.036 0.038 0.005 �0.022 �0.002
Industry adjusteda a a a a b b aMean 0.042 0.054 0.056 0.040 0.024 0.017 0.022 0.013 �0.028 0.001a a a aMedian 0.007 0.010 0.020 �0.002 �0.007 �0.007 �0.008 0.004 �0.020 0.003
No. of sample firms 200 206 207 199 181 170 158 200 181 157
Mean and median levels and changes of cash and cash equivalents scaled by total assets in the years aroundannouncements of special dividends, regular dividend increases, and self-tender offers. Year 0 is defined as thefiscal year of the announcement. T-tests and Wilcoxon signed-rank tests are used to test the hypotheses thatthe means and medians are equal to zero, respectively. Industry-adjusted figures are the paired differencesbetween the sample firms and their industry medians. a and b denote significance at the 1% and 5% levels,respectively.
Panel B of Table 3 indicates that the general cash level trend forfirms that increase regular dividends is similar to that reported forspecial dividend firms, although notably less pronounced. The meanŽ . Ž .median cash level is 10.0% 6.4% in the year prior to the announce-
Ž . Ž .ment, and the industry-adjusted mean median is 3.2% 0.7% . Further,there is a modest and statistically significant increase in the cash level inthe prior years, followed by decreases in the subsequent years. Theseresults suggest that while firms that increase regular dividends may haveagency problems associated with excess cash accumulations, any suchproblems are less severe than for firms that pay special dividends.
Ž .Finally, panel C shows that the mean median cash level for firmsŽ .that conduct self-tender offers is 12.6% 7.1% prior to the announce-
Ž .ment year, which is 5.6% 2.0% higher than the industry median. Thepanel further indicates a substantial reduction in the cash levels fromyear �1 to year 1, such that only the mean cash level, but not themedian cash level, is above the industry norm from year 1 onward.
The decreases in cash levels after special dividends and self-tenderoffers are surprisingly moderate when compared to the size of these
229

The Re� iew of Financial Studies�� 13 n 1 2000
Figure 1Mean levels of extraordinary cash flowsExtraordinary cash flow is defined as sales of property, plant, and equipment minus businessacquisitions scaled by total assets. Year 0 is the fiscal year of the announcement. The mediansare zero for all three types and for all years.
Ž .disbursements. The mean median decrease between years �1 and 1 isŽ . Ž .only �0.009 �0.003 for special dividend firms and �0.033 �0.022
for self-tender offer firms. The decreases during the announcement yearare even smaller, but are not necessarily representative since the actualpayout often takes place after the fiscal year of the announcement. Theobserved decreases may, however, underestimate the true effect of thedisbursements on excess funds for at least two reasons. First, the effecton cash levels may be partially disguised. In particular, the effect maybe contaminated by an opposite effect from either ordinary cash flowsŽ .as suggested by the results in Table 2 or extraordinary cash flowsimmediately before the event. Figure 1 shows the mean extraordinarycash flows for the sample firms, where extraordinary cash flows aredefined as sales of plant, property, and equipment minus business
Žacquisitions, scaled by total assets capital expenditures are not included.in this measure . The extraordinary cash flows tend to peak during the
announcement years for firms that pay special dividends, but their levelsare rather modest. Further, they are only positive during the announce-
Žment year for special dividend firms. The medians are zero for all three.types and for all 7 years. In comparison, the mean of the industry
medians hovers between 0.004 and 0.006 for all years and for all threesamples, and the median hovers between 0.001 and 0.002.4 The second
4 I identified 37 announcements of asset sales in the days around the special dividend announce-ments. Most of these announcements refer to sales of assets that commenced at an earlier pointin time, and many of them are completed by the time of the special dividend announcement.Excluding these observations has no material impact on the regression results reported later.
230

Excess Funds and Agency Problems
Figure 2Mean debt ratiosThe debt ratio is defined as total liabilities scaled by total assets less cash and cash equivalents.Year 0 is the fiscal year of the announcement. Median ratios exhibit a similar pattern.
reason why the effect on excess funds may be underestimated is thatdisbursements may be partially financed with new debt. Figure 2 showsthat the mean debt ratios indeed tend to increase around disburse-ments. The debt ratio is defined as total liabilities scaled by total assetsless cash and cash equivalents. I subtract the cash level from total assetsto exclude the effect of cash reductions associated with the dividendsand self-tender offers on the debt ratios. Although the increase is mostpronounced for firms that conduct self-tender offers, all three samplesexhibit a statistically significant increase at the 0.01 level from year �1to year 1. The median ratios exhibit a similar pattern and are notpresented here. As a comparison, the mean of the industry medians isbetween 0.60 and 0.63 for all years and for all samples, while themedian is between 0.59 and 0.63.5
Taken together, the evidence indicates that firms that pay specialdividends, increase regular dividends, or conduct self-tender offers all
5 ŽI also adjusted total assets for net sales sales of property, plant, and equipment minus. Ž .acquisitions , but the debt ratio patterns not reported here remain similar. Finally, I examined
the ratio of the change in liabilities from year �1 to year 0 to the value of the cashdisbursement to get a sense of the portion of the disbursement that was financed with debt. Ofcourse, total debt may change for other reasons during the relevant period. The ratio istherefore noisy, especially for small disbursements, for which the numerator can be much largerthan the denominator. The median ratio equals 0.54 for self-tender offers, indicating that a littlemore than 50% of the typical self-tender offer is financed with debt. Further, the median ratio is4.01 for special dividends, indicating that it contains too much noise to be interpreted as thefraction of the disbursement that is debt financed. I did not calculate this ratio for regulardividend increases, since the increases only represent a small portion of the dividends paidduring the period.
231

The Re� iew of Financial Studies�� 13 n 1 2000
tend to have funds in excess of their industry norms. However, thesource of the excess funds appears to differ among the types of firms.The excess funds are mostly nonrecurring for firms that pay specialdividends or conduct self-tender offers, transactions that can be viewedas one-time cash disbursements. Conversely, the excess funds are mostlyrecurring for firms that increase regular dividends.
3.3 Determinants of the abnormal returnsAs noted earlier, the mean announcement period returns for specialdividends, regular dividend increases, and self-tender offers are 3.5%,1.3%, and 8.0%, respectively, suggesting that the capital market per-ceives such announcements as favorable news. In this section I examinewhether firms with potentially large agency problems associated withexcess funds before the announcement also experience larger an-nouncement period returns than do firms with small agency problems.
3.3.1 Special dividends. Table 4 presents cross-sectional regressionsof the announcement period returns around special dividends. Theregression specifications include three control variables: the specialdividend as a fraction of market value of equity, the index-adjustedmarket value of equity, and the dividend yield. The size of the dividendis included in the regression models because Denis, Denis, and SarinŽ . Ž .1994 and Yoon and Starks 1995 document that the magnitude ofdividend changes is positively related to announcement period returns.Adjusted market value of equity is included because Yoon and Starksfind that firm size is negatively related to announcement period returnsfor dividend changes. Finally, dividend yield is included to control forpotential tax effects and the surprise content of dividend announce-
Ž .ments Yoon and Starks and Denis, Denis, and Sarin . Only the coeffi-cient on the fraction of special dividend is statistically significant atconventional levels. This coefficient is approximately 0.17, with p-valuesbelow .01.
The excess funds hypothesis posits that shareholders of firms withboth low investment opportunities and considerable excess funds shouldbenefit the most from special dividends. Regression model 4a includes avariable for cash flow and an interaction variable between cash flow andan indicator variable that equals one if Tobin’s Q, as measured in
Ž . Ž . 6McConnell and Servaes 1990 , is less than one Low Q . I use Tobin’sQ as a proxy for the firm’s investment opportunities and Low Q as anindicator of firms with poor investment opportunities. Consistent with
6 Ž . Ž .Following McConnell and Servaes 1990 and Servaes 1991 , the measure of Tobin’s Q isŽ .computed using the Lindenberg and Ross 1981 algorithm and the specific assumptions of Hall,
Ž .et al. 1988 .
232

Excess Funds and Agency Problems
Table 4Regression of announcement period returns for all disbursements
Special dividends Dividend increases Self-tender offers
4a 4b 4c 4d 4e 4f
Intercept 0.032 0.009 �0.001 0.000 �0.004 �0.001Ž . Ž . Ž . Ž . Ž . Ž .0.000 0.134 0.561 0.732 0.797 0.941
Special dividend�equity 0.176 0.163 2.904 2.880Ž . Ž . Ž . Ž .value or dividend 0.000 0.000 0.000 0.000
change�equity valueIndex-adjusted market �0.186 �0.129 �0.107 �0.102 �0.872 �0.658
Ž . Ž . Ž . Ž . Ž . Ž .value of equity 0.342 0.499 0.002 0.004 0.175 0.296Dividend yield �0.127 �0.081 0.353 0.330
Ž . Ž . Ž . Ž .0.363 0.543 0.000 0.000Dutch auction 0.026 0.027
Ž . Ž .0.013 0.009Fraction of shares sought �0.061 �0.077
Ž . Ž .0.122 0.046Tender premium 0.540 0.543
Ž . Ž .0.000 0.000Cash flow �0.083 0.011 �0.013
Ž . Ž . Ž .0.121 0.419 0.882Low Q � cash flow 0.019 �0.016 0.124
Ž . Ž . Ž .0.806 0.240 0.272Cash 0.070 0.003 �0.082
Ž . Ž . Ž .0.006 0.655 0.062Low Q � cash 0.113 0.006 0.188
Ž . Ž . Ž .0.001 0.531 0.0002Adjusted R 0.084 0.134 0.040 0.040 0.410 0.443
Number of observations 570 570 7,417 7,417 207 207
Cross-sectional regression of the abnormal announcement period returns for special dividends,regular dividend increases, and self-tender offers. Special di� idend � equity �alue is the specialdividend scaled by the market value of equity 5 days prior to the announcement date. Di� idendchange � equity �alue is the change in regular dividend scaled by the market value of equity 5days prior to the announcement date. Index-adjusted market �alue of equity is defined as the
Ž .market value of equity in billions divided by the level of the S&P 500 Index 5 days prior to theannouncement. Di� idend yield is the total dividend payments during the year prior to theannouncement divided by the market value of equity 5 days prior to the announcement. Dutchauction is an indicator variable that equals one if the self-tender offer is a Dutch auction.Fraction of shares sought is the number of shares sought scaled by the number of outstandingshares prior to the offer. Tender premium is the premium paid over the closing price 5 days priorto the announcement. Cash flow is the operating income before depreciation minus interestexpenses, taxes, preferred dividends, and common dividends, all scaled by total assets. Cash iscash and cash equivalents scaled by total assets. Low Q is an indicator variable that equals oneif Tobin’s Q is less than one, where Tobin’s Q is estimated using the procedure in McConnell
Ž . Ž .and Servaes 1990 . p-values are given in parentheses.
Ž .the results reported in Howe, He, and Kao 1992 , the coefficients onthese variables are statistically insignificant. Consequently, the relativelysmall sample size of 60 special dividends does not appear to explain thelack of statistical significance in Howe, He, and Kao.7
The evidence discussed in Sections 3.1 and 3.2, however, suggeststhat the major source of excess funds in special dividend firms is the
7 To test for robustness, I also included the Low Q indicator variable in the regression specifica-tions. The coefficient on this variable is statistically insignificant, and the inclusion of thisvariable has a trivial impact on the other coefficients.
233

The Re� iew of Financial Studies�� 13 n 1 2000
cash level rather than the cash flow. Therefore model 4b replaces cashflow with cash level as a proxy for excess funds. The results show thatannouncement period returns are higher when the cash level prior tothe event is high, as indicated by the positive coefficient associated with
Ž .the cash variable p � .01 . Furthermore, the coefficient on the interac-tion variable between the cash level and Low Q is positive and statisti-cally significant at the .01 level, suggesting that the positive relationbetween preannouncement cash levels and announcement period re-turns is stronger when the firm’s investment opportunities are low.These relations are also robust to the inclusion of the Low Q indicator
Ž .variable not reported , although the statistical significance drops some-what due to multicollinearity among the independent variables. In otherwords, the market responds particularly favorably to special dividendannouncements when the announcing firm has potentially large agencyproblems, as indicated by substantial cash levels but poor investmentopportunities, that may be mitigated by a reduction of the cash level.
3.3.2 Regular dividend increases. Models 4c and 4d for regular divi-dend increases are analogous to models 4a and 4b. The coefficient onthe dividend change scaled by equity value is statistically significantŽ .p � .01 , and it is more than 15 times larger than the correspondingcoefficient for special dividends, perhaps reflecting the permanent na-ture of regular dividend increases relative to special dividends. Further,the coefficient on dividend yield is positive and statistically significant at
Ž .the .01 level, consistent with Bajaj and Vijh 1990 and Denis, Denis,Ž .and Sarin 1994 . The fact that the dividend yield is statistically signifi-
cant only for regular dividend increases and not for special dividends isconsistent with the notion that dividend yield is a proxy for the surprisecontent in a regular dividend increase announcement, but not in aspecial dividend announcement. In particular, while low dividend yieldfirms are more likely to increase their regular dividends than highdividend yield firms, it is not clear that low dividend yield firms aremore or less likely to pay a special dividend than high dividend yieldfirms. In contrast, the results seem inconsistent with Bajaj and Vijh’sargument that the positive relation between dividend yield and the stockprice reaction to announcements of regular dividend changes is at-tributable to the existence of dividend clienteles, as this argumentwould predict a similar relation between dividend yield and the stockprice reaction to special dividend announcements.
The coefficients on cash flow and the interaction variable betweencash flow and Low Q in model 4c are statistically insignificant. Whilethe coefficient on the indicator variable is marginally significant with a
Ž .p-value of .06 not reported when Low Q is included in the regressionspecification, the negative sign of the coefficient is contrary to the
234

Excess Funds and Agency Problems
excess funds hypothesis. Although these results are consistent with theŽ .results of Denis, Denis, and Sarin 1994 , they are still surprising. The
cash flows generated by these firms suggest that managers have thepotential to invest in unprofitable projects. The evidence suggests thatthe market does not perceive the regular dividend increases to effec-tively reduce overinvestment, perhaps because the incremental dis-bursements are too small relative to the excess funds or because thefirms that increase regular dividends already distribute cash to mitigateoverinvestment.
The coefficients on the cash level and the interaction variable be-tween the cash level and Low Q are also statistically insignificantŽ .model 4d . These results are in stark contrast to the correspondingcoefficients for the special dividend firms. This difference in results maybe attributable to the low cash levels carried by regular dividendincrease firms relative to those carried by special dividend firms or thesmall incremental disbursements associated with regular dividend in-creases relative to special dividends.
3.3.3 Self-tender offers. Lastly, models 4e and 4f show cross-sectionalregressions of the announcement period returns for the self-tenderoffer sample. The control variables include the fraction of sharessought, the tender premium, the index-adjusted market value of equity,and a dummy that equals one if the self-tender offer takes the form of a
Ž .Dutch auction. Consistent with Comment and Jarrell 1991 , the mostsignificant control variable is the tender premium. The coefficient onthis variable is roughly 0.54 with a p-value of less than .001.
Similar to the results for special dividends and regular dividendincreases, the coefficients on cash flow and the interaction variablebetween cash flow and Low Q are statistically insignificant for self-tender offers. Most importantly, the coefficient on the interactionvariable between the cash level and Low Q is positive and statisticallysignificant. Model 4f indicates that this coefficient equals 0.19 with ap-value less than .001. Consequently, the abnormal returns aroundself-tender offer announcements and cash levels are more positivelyrelated for firms with poor investment opportunities than for firms withgood investment opportunities.8
Overall, the evidence suggests that special dividends and self-tenderoffers are perceived by the stock market to reduce agency problemsassociated with excess cash. In particular, the stock market reaction is
8 If the Low Q variable is included in model 4e, the coefficient on this variable is positive andstatistically significant at the .01 level, and the coefficients on the cash flow and the interaction
Ž . Ž .variable between cash flow and Low Q change to 0.183 p � .07 and �0.275 p � .09 ,respectively. In contrast, if the Low Q variable is included in model 4f, the coefficient on thisvariable is statistically insignificant, and the other coefficients change only marginally.
235

The Re� iew of Financial Studies�� 13 n 1 2000
most favorable if firms announcing special dividends or self-tenderoffers have large cash levels coupled with poor investment opportuni-ties. In contrast, there is no evidence to indicate that the stock marketperceives increases in regular dividends to mitigate the same agencyproblems.
3.4 Small versus large incremental disbursementsŽ .As noted earlier in Section 2.2, the means medians of special divi-
dends and increases in regular dividends as fractions of the marketŽ . Ž .value of equity are 6.24% 1.11% and 0.15% 0.11% , respectively,
Ž .while the mean median fraction of shares sought in self-tender offersŽ .is 20.7% 18.2% . Some of these incremental disbursements seem too
small relative to the levels of excess funds documented in Sections 3.1and 3.2 to have a consequential effect on future investments, raising thepossibility that there are alternate motives behind these events. Forexample, managers may employ small incremental cash disbursementsto call attention to the firm rather than to mitigate agency problems� Ž .see Grinblatt, Masulis, and Titman 1984 for a discussion of this
�argument in the context of stock splits and stock dividends . Moreattention may increase the stock price because it induces investors to
�reassess the future cash flows of the company Grinblatt, Masulis, andŽ .� �Titman 1984 , because the stock’s liquidity increases Amihud and
Ž .� �Mendelson 1986 , or because of higher ‘‘investor recognition’’ MertonŽ .�1987 . To investigate the possibility that only large incremental dis-bursements effectively mitigate agency problems, I partition each of thesamples of special dividends, regular dividend increases, and self-tenderoffers into halves according to their size, and replicate the aboveanalyses.
Ž .3.4.1 Special dividends. The mean median ratio of small specialŽ .dividends to the market value of equity is 0.006 0.005 , while the mean
Ž .median ratio of large special dividends to the market value of equity isŽ .0.120 0.036 . Consequently, even large special dividends typically repre-
Ž .sent smaller payouts than do self-tender offers see Table 1 . The meanŽ . Ž .median announcement period returns are 1.18% 0.56% and 5.86%Ž .3.27% , for small and large special dividends, respectively. The cashflows reveal a similar trend for small and large special dividends, whilethe trend for cash levels is stronger for large ones. For example, the
Ž . Ž .mean median industry-adjusted cash level in year �1 is 0.056 0.021Ž .and 0.103 0.049 for small and large dividends, respectively, while the
Ž .mean median change in cash levels from year �1 to year 1 is 0.008Ž . Ž .0.000 and �0.026 �0.005 for small and large dividends, respectively.
In the cross-sectional regressions of announcement period returnsŽ .Table 5 , the coefficient on the size of the special dividend is statisti-
236

Excess Funds and Agency Problems
Table 5Regression of announcement period returns for special dividends
Small special dividends Large special dividends
5a 5b 5c 5d
Intercept �0.008 �0.009 0.055 0.020Ž . Ž . Ž . Ž .0.296 0.222 0.000 0.059
Special dividend�equity value 3.680 3.810 0.151 0.130Ž . Ž . Ž . Ž .0.000 0.000 0.000 0.000
Index-adjusted market value of equity �0.070 �0.080 �2.673 �1.859Ž . Ž . Ž . Ž .0.548 0.495 0.032 0.121
Dividend yield 0.033 0.031 �0.175 �0.090Ž . Ž . Ž . Ž .0.811 0.822 0.427 0.665
Cash flow 0.029 �0.237Ž . Ž .0.474 0.039
Low Q � Cash flow �0.091 0.232Ž . Ž .0.162 0.117
Cash 0.070 0.076Ž . Ž .0.676 0.053
Low Q � Cash 0.113 0.162Ž . Ž .0.132 0.001
2Adjusted R 0.042 0.043 0.069 0.135Number of observations 287 287 283 283
Cross-sectional regression of the abnormal returns from the day before to 2 days afterannouncements of special dividends. A special dividend is defined as large if the specialdividend scaled by market value of equity exceeds the sample median; otherwise it is defined assmall. Special di� idend � equity �alue is the special dividend scaled by the market value of equity5 days prior to the announcement date. Index-adjusted market �alue of equity is defined as the
Ž .market value of equity in billions divided by the level of the S&P 500 Index 5 days prior to theannouncement. Di� idend yield is the total dividend payments during the year prior to theannouncement divided by the market value of equity 5 days prior to the announcement. Cashflow is the operating income before depreciation minus interest expenses, taxes, preferreddividends, and common dividends, all scaled by total assets. Cash is cash and cash equivalentsscaled by total assets. Low Q is an indicator variable that equals one if Tobin’s Q is less than
Ž .one, where Tobin’s Q is estimated using the procedure in McConnell and Servaes 1990 .Ž .p-values are given in parentheses.
Ž .cally significant for both subsamples p � .01 , but it is roughly 3.75 forsmall dividends and only 0.14 for large dividends. More interesting forthe purposes of this study, the coefficients on the cash level and theinteraction variable between the cash level and Low Q are positive andof roughly similar magnitude for small and large special dividends, butthey are statistically significant only for the large special dividends. Thissuggests that the market perceives large special dividends to mitigateagency problems associated with excess cash levels, while the evidenceon small special dividends is inconclusive.
Ž .3.4.2 Regular dividend increases. The mean median announcementŽ . Ž .period returns are 0.65% 0.31% and 1.92% 1.29% , respectively, for
small and large increases in regular dividends. Both the industry-ad-justed cash level and cash flow reveal few differences between the twosamples. Of interest, Table 6 indicates that the coefficients on dividendyield and dividend change are statistically insignificant for the small
237

The Re� iew of Financial Studies�� 13 n 1 2000
Table 6Regression of announcement period returns for regular dividend increases
Small dividend changes Large dividend changes
6a 6b 6c 6d
Intercept �0.001 0.001 0.001 0.000Ž . Ž . Ž . Ž .0.680 0.593 0.618 0.561
Dividend change�equity value 5.673 5.139 2.758 2.765Ž . Ž . Ž . Ž .0.169 0.213 0.000 0.000
Index-adjusted market value of equity �0.097 �0.089 �0.105 �0.103Ž . Ž . Ž . Ž .0.063 0.085 0.029 0.032
Dividend yield 0.137 0.103 0.348 0.345Ž . Ž . Ž . Ž .0.271 0.400 0.000 0.000
Cash flow 0.021 0.001Ž . Ž .0.232 0.976
Low Q � Cash flow �0.010 �0.024Ž . Ž .0.633 0.207
Cash 0.001 0.005Ž . Ž .0.881 0.556
Low Q � Cash 0.009 0.001Ž . Ž .0.600 0.935
2Adjusted R 0.002 0.002 0.043 0.043Number of observations 3,730 3,730 3,687 3,687
Cross-sectional regression of the abnormal returns from the day before to 2 days afterannouncements of regular dividend increases. A dividend increase is defined as large if thedividend increase scaled by market value of equity exceeds the sample median; otherwise it isdefined as small. Di� idend change � equity �alue is the change in regular dividend scaled by themarket value of equity 5 days prior to the announcement date. Index-adjusted market �alue of
Ž .equity is defined as the market value of equity divided in billions by the level of the S&P 500Index 5 days prior to the announcement. Di� idend yield is the total dividend payments duringthe year prior to the announcement divided by the market value of equity 5 days prior to theannouncement. Cash flow is the operating income before depreciation minus interest expenses,taxes, preferred dividends, and common dividends, all scaled by total assets. Cash is cash andcash equivalents scaled by total assets. Low Q is an indicator variable that equals one if Tobin’sQ is less than one, where Tobin’s Q is estimated using the procedure in McConnell and ServaesŽ . Ž .1990 . p-values are given in parentheses.
dividend change sample, but highly significant for the large dividendchange sample. In fact, the adjusted R2 is roughly 4.3% for the sampleof large dividend changes, but only 0.2% for the sample of smallerdividend changes. These results question further the hypothesis of Bajaj
Ž .and Vijh 1990 that the negative relation between dividend yield andthe stock price reaction to dividend changes is attributable to the
Ž .existence of dividend clienteles see also Section 3.3.2 . In particular,the dividend clientele hypothesis does not explain why such a relationonly exists for large dividend changes. Lastly, the coefficients on cashlevels and cash flows are statistically insignificant for both subsamples.9
9 As noted earlier, the ratio of regular dividend increases to equity value tends to be considerablyless than the ratio of special dividends to equity value and the fraction of shares sought inself-tender offers. In fact, the 99th percentile for the ratio of regular dividend increases toequity value is smaller than the median ratio of special dividends to equity value. Therefore Ialso partitioned the sample of regular dividend increases into two samples using the 90thpercentile as the cutoff. However, the relation between the stock price reaction and excessfunds measures are still similar for the two subsamples.
238

Excess Funds and Agency Problems
Ž .3.4.3 Self-tender offers. The mean median announcement periodŽ . Ž .returns are 7.8% 6.1% and 8.1% 7.3% , respectively, for small and
large self-tender offers. The preevent industry-adjusted cash levels areŽhigher for large than for small self-tender offers means are 5.9% and
.2.3% in year �1 for large and small self-tender offers, respectively ,while the preevent industry-adjusted cash flows are slightly larger for
Žsmall offers means are 1.9% and 2.9% in year �1 for large and small.self-tender offers, respectively . The cross-sectional regressions of the
announcement period returns reveal fairly similar results for the twoŽ .samples Table 7 . Most importantly, both samples indicate that the
coefficient on the interaction variable between the cash level and LowQ is positive and statistically significant at the .01 level. Of interest, thecoefficient on the interaction variable between cash flow and Low Q ispositive with a p-value of .01 for the sample of small self-tender offers,although this coefficient is statistically insignificant for both the sampleof large self-tender offers and the overall sample.
Table 7Regression of announcement period returns for self-tender offers
Small self-tender offers Large self-tender offers
7a 7b 7c 7d
Intercept �0.021 �0.035 �0.055 �0.050Ž . Ž . Ž . Ž .0.225 0.061 0.092 0.105
Dutch auction 0.000 0.000 0.055 0.064Ž . Ž . Ž . Ž .0.995 0.972 0.006 0.001
Fraction of shares sought 0.264 0.243 0.015 0.169Ž . Ž . Ž . Ž .0.028 0.043 0.838 0.809
Tender premium 0.578 0.575 0.562 0.567Ž . Ž . Ž . Ž .0.000 0.000 0.000 0.000
Index-adjusted market value of equity �0.420 �0.260 �1.027 �0.315Ž . Ž . Ž . Ž .0.397 0.600 0.175 0.843
Cash flow �0.159 0.186Ž . Ž .0.024 0.299
Low Q � Cash flow 0.248 0.014Ž . Ž .0.010 0.951
Cash 0.009 �0.152Ž . Ž .0.842 0.032
Low Q � Cash 0.208 0.250Ž . Ž .0.003 0.002
2Adjusted R 0.574 0.580 0.391 0.443Number of observations 104 104 103 103
Cross-sectional regression of the abnormal returns from 3 days before to 3 days after announce-ments of self-tender offers. A self-tender offer is defined as large if the fraction of shares soughtexceeds the sample median; otherwise it is defined as small. Dutch auction is an indicatorvariable that equals one if the self-tender offer is a Dutch auction. Fraction of shares sought isthe number of shares sought scaled by the number of outstanding shares prior to the offer.Tender premium is the premium paid over the closing price 5 days prior to the announcement.
Ž .Index-adjusted market �alue of equity is defined as the market value of equity in billions dividedby the level of the S&P 500 Index 5 days prior to the announcement. Cash flow is the operatingincome before depreciation minus interest expenses, taxes, preferred dividends, and commondividends, all scaled by total assets. Cash is cash and cash equivalents scaled by total assets. LowQ is an indicator variable that equals one if Tobin’s Q is less than one, where Tobin’s Q is
Ž . Žestimated using the procedure in McConnell and Servaes 1990 . p-values are given in.parentheses.
239
The Re� iew of Financial Studies�� 13 n 1 2000
3.5 Alternative agency control mechanismsWhile disbursing excess cash may reduce the agency problem betweenmanagers and shareholders, there may be alternative means of control-
Ž .ling this problem. Jensen and Meckling 1976 argue that the agencyproblem is less severe when managers hold a large fraction of theoutstanding shares in the company. If managers hold a small fraction,they work less vigorously or consume excessive perquisites because theybear a relatively small portion of the resulting costs. However, as
Ž . Ž .suggested by Morck, Schleifer, and Vishny 1988 and Stulz 1988 ,there is also a potential downside to high managerial holdings. Inparticular, high managerial holdings can entrench management fromthe discipline of the market for corporate control, thereby enablingmanagers to better act in their own interest. Moreover, an effectiveboard may induce managers to behave in the shareholders’ interests.
Ž . Ž .The empirical results of Weisbach 1988 , Rosenstein and Wyatt 1990 ,Ž . Ž .Byrd and Hickman 1992 , Lee et al. 1992 , and Brickley, Coles, and
Ž .Terry 1994 indicate that the presence of outsiders on the boardŽ .improves the board’s effectiveness. Lastly, Schleifer and Vishny 1986
argue that outside blockholders may provide an additional monitoringŽ .mechanism. Denis, Denis, and Sarin 1997b report evidence in favor of
this argument.If effective control mechanisms prevent managers from wasting ex-
cess funds on poor projects, the relation between the stock pricereaction to announcements of incremental cash disbursements and theinteraction variable between cash levels and the Low Q indicatorshould be stronger for firms with poor control mechanisms. I test thishypothesis for the subsamples of self-tender offers and large specialdividends. I use four indicators of poor control mechanisms. My firsttwo indicators are Insider holdings � 5% and Insider holdings � 25%,which equal one if the holdings by officers and directors are less than5% and more than 25%, respectively. If the fraction of the firm’s shares
�held by officers and directors is less than 5% or more than 25% as usedŽ .by, for example, Morck, Schleifer, and Vishny 1988 and Denis, Denis,
Ž .�and Sarin 1997b , the interests of the managers may not be sufficientlyaligned with those of the shareholders or the managers may be en-trenched from external threats. My last two indicators, Outsiders onboard � 50% and No outside blockholder, equal one if the fraction ofoutside directors on the board is less than 50% and if there are noholders of at least 5% of the firm’s shares who are unrelated tomanagement, respectively.10
10 I define outside directors as directors who are not employed by the company or otherwiseŽ .affiliated with the company such as lawyers, investment bankers, and consultants . I also used
cutoffs other than 50% for outside directors, including 40% and 60%, but the results aresimilar.
240

Excess Funds and Agency Problems
Table 8Regression of announcement period returns for large special dividends and self-tender offers
Large special dividends Self-tender offers
8a 8b 8c 8d
Intercept 0.016 0.012 �0.003 �0.004Ž . Ž . Ž . Ž .0.153 0.591 0.866 0.818
Special dividend�equity value 0.128 0.134Ž . Ž .0.000 0.000
Index-adjusted market value of equity �0.159 �0.130 �0.715 �0.095Ž . Ž . Ž . Ž .0.200 0.345 0.262 0.894
Dutch auction 0.029 0.031Ž . Ž .0.006 0.003
Fraction of shares sought �0.078 �0.067Ž . Ž .0.055 0.106
Tender premium 0.537 0.529Ž . Ž .0.000 0.000
Cash 0.087 0.090 �0.076 �0.090Ž . Ž . Ž . Ž .0.049 0.047 0.093 0.051
Low Q � Cash 0.087 0.105 0.294 0.298Ž . Ž . Ž . Ž .0.580 0.547 0.006 0.009
Low Q � Cash � Insider holdings � 5% �0.018 �0.011 �0.072 0.108Ž . Ž . Ž . Ž .0.924 0.961 0.615 0.523
Low Q � Cash � Insider holdings � 25% 0.165 0.116 0.035 0.065Ž . Ž . Ž . Ž .0.269 0.504 0.688 0.500
Low Q � Cash � Outsiders on board � 50% �0.063 �0.055 �0.161 �0.197Ž . Ž . Ž . Ž .0.495 0.614 0.172 0.131
Low Q � Cash � No outside blockholder �0.085 �0.046 0.054 0.048Ž . Ž . Ž . Ž .0.401 0.701 0.547 0.647
Insider holdings � 5% �0.004 �0.028Ž . Ž .0.878 0.062
Insider holdings � 25% 0.014 �0.007Ž . Ž .0.516 0.653
Outsiders on board � 50% �0.003 0.013Ž . Ž .0.884 0.326
No outside blockholder �0.013 0.002Ž . Ž .0.516 0.895
2Adjusted R 0.143 0.131 0.437 0.442Number of observations 229 229 204 204
Cross-sectional regression of the abnormal announcement period returns for large specialdividends and self-tender offers. Special di� idend � equity �alue is the special dividend scaled bythe market value of equity 5 days prior to the announcement date. Index-adjusted market �alue
Ž .of equity is defined as the market value of equity in billions divided by the level of the S&P 500Index 5 days prior to the announcement. Dutch auction is an indicator variable that equals oneif the self-tender offer is a Dutch auction. Fraction of shares sought is the number of sharessought scaled by the number of outstanding shares prior to the offer. Tender premium is thepremium paid over the closing price 5 days prior to the announcement. Cash is cash and cashequivalents scaled by total assets. Low Q is an indicator variable that equals one if Tobin’s Q isless than one, where Tobin’s Q is estimated using the procedure in McConnell and ServaesŽ .1990 . Insider holdings � 5% and Insider Holdings � 25% are indicator variables that equal oneif the holdings by officers and directors are less than 5% and more than 25%, respectively.Outsiders on board � 50% is an indicator variable that equals one if the fraction of independentoutside directors on the board is less than 50%. No outside blockholder is an indicator variablethat equals one if there are no holders of at least 5% of the firm’s shares who are unrelated to
Ž .management. p-values are given in parentheses.
Table 8 presents the regression results when I include the indicatorsfor poor control mechanisms. All models include three-way interactionterms between the Low Q indicator, cash level, and each of the fourindicators to test whether the relation between the stock price reactionand the interaction of Low Q and Cash is stronger for firms with poor
241

The Re� iew of Financial Studies�� 13 n 1 2000
control mechanisms. If so, the coefficients on the three-way interactionterms should be positive. Models 8b and 8d also include the fourindicators by themselves to allow for shifts in the intercepts and to testfor robustness. The signs of the coefficients are mixed, and none of thecoefficients are statistically significant. Consequently, there is no evi-dence to indicate that the market is less concerned about excess cashlevels if the firm has effective control mechanisms in place. I find theseresults to be puzzling. Perhaps the samples are too small or too noisy tocapture the underlying effects, or perhaps there is some offsetting effectyet to be identified.
3.6 Long-term stock returnsThe excess funds hypothesis suggests that disbursements of funds mayimprove current and future investment decisions. In an efficient market,these improvements will be capitalized in the stock price immediatelyupon the announcement of the disbursement. However, recent empiri-cal studies indicate that the stock price continues to drift upward for
�several years after announcements of self-tender offers LakonishokŽ .� �and Vermaelen 1990 , open market repurchases Ikenberry, Lakon-
Ž .� �ishok, and Vermaelen 1995 , and regular dividend increases Michaely,Ž . Ž .�Thaler, and Womack 1995 and Benartzi, Michaely, and Thaler 1997 .
This raises the possibility that the stock price does not immediatelycapture the full value of the improvement in investment decisions.
I estimate the abnormal stock returns over the period starting 10days after and ending 3 years after the announcement. The abnormalstock return is estimated as the difference between the buy-and-holdreturn for the sample firm and the buy-and-hold return for a controlfirm. The control firm is a firm with similar market value of equity andbook-to-market ratio as the sample firm. In particular, I first identify allfirms with a market value of equity between 70% and 130% of themarket value of equity of the sample firm prior to the announcement.From this set of firms, I choose the firm with the book-to-market ratio
Ž .closest to that of the sample firm. According to Barber and Lyon 1997 ,this procedure for estimating abnormal long-term stock returns yieldswell-specified test statistics.
Ž .The mean 3-year abnormal stock returns are 6.5% p � .47 , 7.6%Ž . Ž .p � .01 , and 10.3% p � .25 following special dividends, regulardividend increases, and self-tender offers, respectively. In comparison,
Ž .Benartzi, Michaely, and Thaler 1997 find a 3-year abnormal stockreturn of 8.0% for a sample of regular dividend increases, while Lakon-
Ž .ishok and Vermaelen 1990 find a 2-year abnormal stock return ofroughly 9% for a sample of self-tender offers. Next, I estimate theregressions in Tables 4�7 using the long-term stock returns as thedependent variable. For the special dividend sample, the only variablethat is statistically significant at the .10 level is the cash level. The
242
Excess Funds and Agency Problems
coefficient on this variable is positive and has a p-value of roughly .04.For the regular dividend increases, the coefficient on dividend yield isroughly 3 with a p-value less than .01, and the coefficient on index-ad-justed market value of equity is roughly �2.5 with a p-value of .05. Theother coefficients are statistically insignificant. Finally, for the self-tenderoffers, none of the independent variables explain a significant portion ofthe cross-sectional variation in long-term returns. In sum, there isscarce evidence that any improvement in investment decisions thatresults from the incremental disbursement is not completely capitalizedat the time of announcement.
3.7 Robustness of the results
3.7.1 Excess cash measure. The use of cash levels as a measure ofexcess cash is somewhat naıve, since all firms need a certain level of¨cash. The required or ‘‘appropriate’’ cash level may vary greatly acrossfirms, depending on, for example, investment opportunities, access to
�other sources of funds, competition, and bankruptcy costs HarfordŽ . Ž .�1997 and Opler et al. 1997 . To determine the excess cash level forthe sample firms, I regress individual firms’ cash levels against their cashflow, market-to-book ratio, market value of equity, and the standarddeviation of cash flows for the firms in the same two-digit industry.Next, I predict the appropriate cash level for individual firms using theestimated coefficients. Finally, I estimate the excess cash levels asthe difference between the actual levels and the appropriate levels.11
The correlation between the raw cash levels and the measure of excesscash exceeds 0.9. In light of this high correlation, it is not surprising thatusing the excess cash levels in the regression specification in place ofthe actual cash levels yields similar results for all types of incrementalcash disbursements as those results reported earlier.
3.7.2 Defensive self-tender offers. Several studies suggest that self-tender offers can be used as a defense against takeover attempts� Ž . Ž .Bagnoli, Gordon, and Lipman 1989 , Harris and Raviv 1988 , StulzŽ . Ž .�1988 , and Bagwell 1991 . It is conceivable that defensive self-tenderoffers are driving some of the earlier results. However, the conclusionswould not necessarily be weakened, as the market for corporate control
�may simply identify and reduce potential agency problems Denis,Ž .�Denis, and Sarin 1997a .
I define a self-tender offer to be defensive if the announcementstated that the motivation for the transaction was to deter a takeover, or
11 This measure of excess cash suffers from several potential weaknesses. The procedure toestimate the excess cash levels implicitly assumes that firms, on average, hold optimal levels ofcash. If, for example, managers systematically hold excessive amounts of cash as an insuranceagainst financial distress, the excess cash measure may be biased. Further, because the proce-dure requires several steps to implement and depends on many exogenous variables, the excesscash measure is exposed to numerous sources of noise.
243

The Re� iew of Financial Studies�� 13 n 1 2000
if there were takeover rumors in the Wall Street Journal or the DowJones News Retrie�al Ser�ice during the 3 months prior to the announce-ment. Using this definition, 33 self-tender offers are classified as defen-sive. Next, I run regression models 4e and 4f from Table 4 separately fordefensive and nondefensive self-tender offers. The results are similarfor the two types. The coefficients on cash flow and the interactionbetween Low Q and cash flow are statistically insignificant for bothsubsamples. More importantly, the coefficient on the interaction be-tween Low Q and the cash level is roughly 0.18 for both subsamples,but due to different sample sizes it is statistically significant only for thenondefensive subsample.
I also reestimate the regressions in Tables 7 and 8 without thedefensive self-tender offers. The results are similar to those reported.The only difference of interest is that the coefficient on Insider holdings� 5% is not statistically different from zero at the .10 significance levelwhen defensive self-tender offers are excluded. Overall there is noevidence to indicate that the earlier results are primarily attributable todefensive self-tender offers.
3.7.3 Changes in earnings and signaling. Several authors have devel-oped signaling models that may explain the abnormal announcement
� Ž .returns around incremental cash disbursements Bhattacharya 1979 ,Ž . Ž .�John and Williams 1985 , and Miller and Rock 1985 . These models
all imply that incremental cash disbursements convey favorable infor-mation about the expected cash flows of the firm. Several studies find
� Ž .empirical support for these signaling models Vermaelen 1981 , OferŽ . Ž .and Siegel 1987 , Healy and Palepu 1988 , and Dann, Masulis, and
Ž .�Mayers 1991 . To control for any signaling effects, I first estimate theimpact of the incremental cash disbursements on changes in futureoperating performance. Second, I include the changes in future operat-ing performance in the cross-sectional regressions of the announcementperiod returns.
I measure operating performance as operating income scaled byŽ .operating assets henceforth ROA , where operating assets are esti-
mated as the book value of assets minus cash and marketable securities.I compare the operating performance of the sample firms to that of asample of control firms. The control firms are required to have a similarSIC code and ROA in the fiscal year prior to the event as the originalsample firms.12 The results indicate that all sets of firms improve their
12 For each sample firm, I identify firms with the same two-digit SIC code and ROA within 90% to110% of the sample firm’s ROA. Of the firms that meet these initial criteria, the firm with theROA closest to that of the sample firm is chosen as the control firm. If no firms meet the initialcriteria, I replicate the procedure using first a one-digit SIC code and the ROA filter, then just
Ž .the ROA filter, and finally I disregard the initial criteria. See Barber and Lyon 1996 for adetailed discussion of this procedure.
244

Excess Funds and Agency Problems
operating performance during the fiscal year of the announcementrelative to the control firms, and no change in performance-adjustedROA occurs during the years after the announcements. Next, I includethe changes in ROA over the periods from year �1 to year 1 and fromyear �1 to year 2 in the regression specifications in Table 4. The resultsindicate weak relations between the stock price reaction to incrementalcash disbursement announcements and changes in ROA. Of particularinterest for this study, the inclusion of the changes in ROA in theregression specifications has little impact on the other coefficients.
4. Conclusion
This study examines the excess funds hypothesis using large samples ofspecial dividends, regular dividend increases, and self-tender offers.First, I assess the potential of the sample firms to overinvest byinvestigating the firms’ levels of excess funds around the events. Theresults indicate that all three types of firms tend to have funds in excessof industry norms before the announcement. Such excess funds aremostly nonrecurring for firms that pay special dividends or conductself-tender offers, and recurring for firms that increase the regulardividend. Next, I relate the stock price reaction to announcements ofincremental cash disbursements to the firms’ excess funds and the firms’investment opportunities, as measured by Tobin’s Q. Cross-sectionalregressions reveal that the stock price reaction is significantly related toexcess funds and investment opportunities for self-tender offers andlarge special dividends.
There are two major implications of this study. First, my results areconsistent with the notion that disbursements of funds can enhanceshareholder value by curbing potential overinvestment by managers.Consequently, conflicts of interest between managers and shareholdersmay partially explain why firms disburse funds. Second, small and largedisbursements may be fundamentally different. There is no evidence tosuggest that small special dividends and regular dividend increasesŽ .which typically are very small relative to special dividends affect theoverinvestment problem. It is possible that small dividends, regardlessof their label, are used for reasons unrelated to agency issues, forexample, to call attention to the firm. Hence researchers should controlfor the size of the cash disbursement as they further explore themotivation for and wealth consequences of such transactions.
ReferencesAharony, J., and I. Swary, 1980, ‘‘Quarterly Dividends and Earnings Announcements andStockholders’ Returns: An Empirical Analysis,’’ Journal of Finance, 35, 1�12.
245

The Re� iew of Financial Studies�� 13 n 1 2000
Amihud, Y., and H. Mendelson, 1986, ‘‘Asset Pricing and the Bid-Ask Spread,’’ Journal ofFinancial Economics, 17, 223�249.
Asquith, P., and D. Mullins, Jr., 1983, ‘‘The Impact of Initiating Dividend Payments onShareholder’s Wealth,’’ Journal of Business, 56, 77�96.
Bagnoli, M., R. Gordon, and B. L. Lipman, 1989, ‘‘Stock Repurchase as a Takeover Defense,’’Re� iew of Financial Studies, 2, 423�443.
Bagwell, L. S., 1991, ‘‘Share Repurchase and Takeover Deterrence,’’ Rand Journal of Economics,22, 72�88.
Bajaj, M., and A. M. Vijh, 1990, ‘‘Dividend Clienteles and the Information Content of DividendChanges,’’ Journal of Financial Economics, 26, 193�219.
Barber, B. M., and J. D. Lyon, 1996, ‘‘Detecting Abnormal Operating Performance: TheEmpirical Power and Specification of Test-Statistics,’’ Journal of Financial Economics, 41,359�399.
Barber, B. M., and J. D. Lyon, 1997, ‘‘Detecting Long-Run Abnormal Stock Returns: TheEmpirical Power and Specification of Test-Statistics,’’ Journal of Financial Economics, 43,341�372.
Benartzi, S., R. Michaely, and R. Thaler, 1997, ‘‘Do Changes in Dividends Signal the Future orthe Past?,’’ Journal of Finance, 52, 1007�1034.
Bhattacharya, S., 1979, ‘‘Imperfect Information, Dividend Policy, and the ‘Bird in the Hand’Fallacy,’’ Bell Journal of Economics, 10, 259�270.
Brickley, J., 1983, ‘‘Shareholder Wealth, Information Signaling and the Specially DesignatedDividend,’’ Journal of Financial Economics, 12, 187�209.
Brickley, J. A., J. L. Coles, and R. L. Terry, 1994, ‘‘Outside Directors and the Adoption ofPoison Pills,’’ Journal of Financial Economics, 35, 371�390.
Byrd, J. W., and K. A. Hickman, 1992, ‘‘Do Outside Directors Monitor Managers? Evidencefrom Tender Offer Bids,’’ Journal of Financial Economics, 32, 195�221.
Comment, R., and G. A. Jarrell, 1991, ‘‘The Relative Signaling Power of Dutch-Auction andFixed-Price Self-Tender Offers and Open-Market Share Repurchases,’’ Journal of Finance, 46,1243�1271.
Dann, L. Y., 1981, ‘‘Common Stock Repurchases: An Analysis of Returns to Bondholders andStockholders,’’ Journal of Financial Economics, 9, 113�138.
Dann, L. Y., R. W. Masulis, and D. Mayers, 1991, ‘‘Repurchase Tender Offers and EarningsInformation,’’ Journal of Accounting and Economics, 14, 217�251.
Denis, D. J., D. K. Denis, and A. Sarin, 1994, ‘‘The Information Content of Dividend Changes:Cash Flow Signaling, Overinvestment, and Dividend Clienteles,’’ Journal of Financial andQuantitati�e Analysis, 29, 567�587.
Denis, D. J., D. K. Denis, and A. Sarin, 1997a, ‘‘Agency Problems, Equity Ownership, andCorporate Diversification,’’ Journal of Finance, 52, 135�160.
Denis, D. J., D. K. Denis, and A. Sarin, 1997b, ‘‘Ownership Structure and Top ExecutiveTurnover,’’ Journal of Financial Economics, 45, 193�221.
Easterbrook, F. H., 1984, ‘‘Two Agency-Cost Explanations of Dividends,’’ American EconomicRe� iew, 74, 650�659.
Grinblatt, M. S., R. W. Masulis, and S. Titman, 1984, ‘‘The Valuations Effects of Stock Splitsand Stock Dividends,’’ Journal of Financial Economics, 13, 46l�490.
Hall, B. H., C. Cummins, E. S. Laderman, and J. Mundy, 1988, ‘‘The R & D Master FileDocumentation,’’ working paper, National Bureau of Economic Research.
246

Excess Funds and Agency Problems
Harford, J., 1997, ‘‘The Corporate Cash Management Problem,’’ working paper, University ofRochester.
Harris, M., and A. Raviv, 1988, ‘‘Corporate Control Contests and Capital Structure,’’ Journal ofFinancial Economics, 20, 55�86.
Healy, P., and K. Palepu, 1988, ‘‘Earnings Information Conveyed by Dividend Initiations,’’Journal of Financial Economics, 21, 149�175.
Howe, K. M., J. He, and G. W. Kao, 1992, ‘‘One-Time Cash Flow Announcements and FreeCash-Flow Theory: Share Repurchases and Special Dividends,’’ Journal of Finance, 47,1963�1975.
Ikenberry, D., J. Lakonishok, and T. Vermaelen, 1995, ‘‘Market Underreaction to Open MarketRepurchases,’’ Journal of Financial Economics, 39, 181�208.
Jensen, M., 1986, ‘‘Agency Costs of Free Cash Flow, Corporate Finance, and Takeovers,’’American Economic Re� iew, 76, 323�329.
Jensen, M. C., and W. H. Meckling, 1976, ‘‘Theory of the Firm: Managerial Behavior, AgencyCosts, and Ownership Structure,’’ Journal of Financial Economics, 3, 305�360.
John, K., and J. Williams, 1985, ‘‘Dividends, Dilution, and Taxes: A Signalling Equilibrium,’’Journal of Finance, 40, 1053�1070.
Lakonishok, J., and T. Vermaelen, 1990, ‘‘Anomalous Price Behavior around RepurchaseTender Offers,’’ Journal of Finance, 45, 455�475.
Lang, L., and R. Litzenberger, 1989, ‘‘Dividend Announcements: Cash-Flow Signalling vs. FreeCash Flow Hypothesis?,’’ Journal of Financial Economics, 24, 181�191.
Lee, C. I., S. Rosenstein, N. Rangan, and W. N. Davidson III, 1992, ‘‘Board Composition andShareholder Wealth: The Case of Management Buyouts,’’ Financial Management, 21, 58�72.
Lehn, K., and A. Poulsen, 1989, ‘‘Free Cashflow and Stockholder Gains in Going PrivateTransactions,’’ Journal of Finance, 44, 771�789.
Lie, E., and J. J. McConnell, 1998, ‘‘Earnings Signals in Fixed Price and Dutch AuctionSelf-Tender Offers,’’ Journal of Financial Economics, 49, 161�186.
Lindenberg, E., and S. Ross, 1981, ‘‘Tobin’s Q Ratio and Industrial Organization,’’ Journal ofBusiness, 54, 1�32.
Masulis, R. W., 1980, ‘‘Stock Repurchase by Tender Offer: An Analysis of the Causes ofCommon Stock Price Changes,’’ Journal of Finance, 35, 305�319.
McConnell, J. J., and H. Servaes, 1990, ‘‘Additional Evidence on Equity Ownership andCorporate Value,’’ Journal of Financial Economics, 27, 595�612.
Merton, R. C., 1987, ‘‘A Simple Model of Capital Market Equilibrium with IncompleteInformation,’’ Journal of Finance, 42, 483�510.
Michaely, R., R. H. Thaler, and K. L. Womack, 1995, ‘‘Price Reactions to Dividend Initiationsand Omissions: Overreaction or Drift?,’’ Journal of Finance, 50, 573�608.
Miller, M. H., and K. Rock, 1985, ‘‘Dividend Policy under Asymmetric Information,’’ Journal ofFinance, 40, 1031�1051.
Morck, R., A. Schleifer, and R. W. Vishny, 1988, ‘‘Management Ownership and MarketValuation: An Empirical Analysis,’’ Journal of Financial Economics, 20, 293�315.
Ofer, A. R., and D. Siegel, 1987, ‘‘Corporate Financial Policy, Information, and MarketExpectations: An Empirical Investigation of Dividends,’’ Journal of Finance, 42, 889�911.
Opler, T., L. Pinkowitz, R. Stulz, and R. Williamson, 1997, ‘‘The Determinants and Implicationsof Corporate Cash Holdings,’’ forthcoming in Journal of Financial Economics.
247

The Re� iew of Financial Studies�� 13 n 1 2000
Pettit, R. R., 1972, ‘‘Dividend Announcements, Security Performance, and Capital MarketEfficiency,’’ Journal of Financial Economics, 27, 993�1007.
Rosenstein, S., and J. G. Wyatt, 1990, ‘‘Outside Directors, Board Independence, and ShareholderWealth,’’ Journal of Financial Economics, 26, 175�192.
Schleifer, A., and R. W. Vishny, 1986, ‘‘Large Shareholders and Corporate Control,’’ Journal ofPolitical Economy, 95, 461�488.
Servaes, H., 1991, ‘‘Tobin’s Q and the Gains From Takeovers,’’ Journal of Finance, 46, 409�420.
Stulz, R. M., 1988, ‘‘Managerial Control of Voting Rights: Financing Policies and the Market forCorporate Control,’’ Journal of Financial Economics, 20, 25�54.
Vermaelen, T., 1981, ‘‘Common Stock Repurchases and Market Signaling: An Empirical Study,’’Journal of Financial Economics, 9, 139�183.
Weisbach, M. S., 1988, ‘‘Outside Directors and CEO Turnover,’’ Journal of Financial Economics,20, 431�460.
Yoon, P. S., and L. T. Starks, 1995, ‘‘Signaling, Investment Opportunities, and DividendAnnouncements,’’ Re� iew of Financial Studies, 8, 995�1018.
248