1 hedge funds, cdos and the financial crisis: an empirical investigation of the
TRANSCRIPT

1
Hedge funds, CDOs and the financial crisis: An empirical investigation of the “Mag-netar trade”
Thomas Mählmann
Chair of Banking and Finance, Catholic University of Eichstaett-Ingolstadt, Auf der Schanz 49, 85049 Ingolstadt, Germany
This version: July 2011
Abstract
The so called Magnetar trade (a kind of capital structure arbitrage on the US housing market, using CDS and synthetic CDOs, and exploiting rating-dependent mispricing of risk) has gained a high publicity due to a Pulitzer Prize awarded media story from two journalists of ProPublica (an online news outlet). The story essentially claimed that the mortgage invest-ment strategy of the hedge fund Magnetar during the period between 2006 and mid 2007 was based on a desire to construct CDO deals with riskier assets so that they could place bets that portions of their own deals would fail. This paper provides several pieces of evidence in line with the argument that tranches from Magnetar-sponsored CDOs present overly risky invest-ments. However, investors and rating agencies appear to have adjusted their required spread levels and ratings to reflect this higher riskiness, at least to some extent.
JEL classification: G21, G28 Keywords: Conflict of interest, Credit Rating, Collateralized Debt Obligation, Credit Default
Swap
Tel.: +49 841 937 1883; fax: +49 841 937 2881. E-mail address: [email protected]

2
1. Introduction
Structured finance products like collateralized debt obligations backed by asset-backed securi-
ties (i.e., ABS-CDOs) have been heavily criticized for being, at least partly, responsible for
the origin and intensification of the financial crisis 2007-2009.1 ABS-CDOs from the 2006-
2007 vintage showed particularly high collateral default rates and are commonly named toxic
assets (Mählmann, 2010). Indeed, the ABS-CDO market experienced a fundamental change
during the year 2005, characterized by the introduction of standardized forms for credit de-
fault swap (CDS) contracts on ABS (ABCDS) and for CDS on CDOs later in June 2006.2
This change boosted the origination of synthetic deals which could be executed much more
quickly than cash deals and could be much bigger.3 However, the advent of synthetic CDOs
produced potential conflicts for CDO collateral asset managers in trying to serve the interests
of one type of customers (long investors) who were betting mortgage borrowers would con-
tinue to make their payments and of other customers (short investors) who were betting the
housing market would collapse. Even the incentives of long investors could become con-
flicted. Synthetic CDOs enabled sophisticated investors to place bets against the housing mar-
ket or pursue more complex trading strategies, like capital structure arbitrage. In this type of
strategy, investors, usually hedge funds, often used CDS to take offsetting positions in differ-
ent tranches of the same CDO security (i.e., going long the equity tranche and shorting mez-
zanine and senior tranches). That way, they could make some money as long as the CDOs
performed, but they stood to make more money if the entire market crashed. Synthetic ABS-
CDOs were a particular promising vehicle for capital structure arbitrage, due to a general
mispricing of risk observed in the CDO market, with equity tranches being undervalued and
1 For instance, Brunnermeier (2009) argues that securitized products ultimately led to a flood of cheap credit, and a lowering of lending standards. Keys et al. (2010) provide empirical evidence suggesting that securitization practices did adversely affect the screening incentives of lenders. Titman and Tsyplakov (2010) examine conduit mortgages, which are originated with the intention of placing them into commercial mortgage-backed securities (CMBS). They find that mortgages that are originated by institutions with large negative stock returns prior to origination tend to have higher credit spreads and default rates, consistent with poorly performing originators having less incentive to carefully evaluate prospective borrowers. 2 A CDS is a bilateral agreement that shifts credit risk related to a reference entity or reference obligation from one party (the protection buyer) to another (the protection seller). The reference entity may be a corporation, a country or a specific debt obligation (e.g., a mortgage-backed security or a specific corporate bond). Single-name subprime CDS created the market’s first mechanism for directly shorting mortgage-backed securities. To in-crease market liquidity, the International Swaps and Derivatives Association (ISDA) introduced in June 2005 a specific pay-as-you-go template in order to replicate ABS cashflows more closely during the life of the CDS contract. In June 2006 an ISDA template for CDS on CDOs was introduced, which provided a standardized framework for parties to hedge or to speculate on CDO tranches (whether the tranches were cash or synthetic). 3 Synthetic ABS-CDOs are similar to cash ABS-CDOs except that their underlying assets are ABCDS or indices of ABCDS rather than cash bonds. Hybrid ABS-CDOs are backed by a mixture of cash and synthetic assets. Hybrid and synthetic ABS-CDO issuance grew from $10 billion in 2004 to $35 billion in 2005 and $117 billion in 2006, and then dropped to $99 billion in 2007. These numbers represent 17% of the overall ABS-CDO market in 2004 but 33% in 2005, 54% in 2006 and 61% in 2007 (FCIC, 2010).

3
more senior tranches being overvalued.4 This mispricing leads to equity tranches providing
relatively high expected returns that, in turn, could be used to finance cheap credit protection
on mezzanine and senior tranches.
The prevalence of this arbitrage strategy is evidenced by the numbers shown in Figure 1.
Based on data from a survey of more than 170 hedge funds encompassing over $1.1 trillion in
assets as of early 2010, conducted by the Financial Crisis Inquiry Commission (FCIC), the
figure shows that by December 2006, an average medium-size hedge fund (with AUM of
around $6 billion) held $400 million in equity and lower-rated tranches from ABS-CDOs.
These long positions, however, were more than offset by almost $1 billion in short positions.
Obviously, equity investors holding larger short positions in the same deals do not have a
great incentive to monitor the credit risk of the underlying portfolio. In particular, a common
argument is that hedge funds, by financing the equity tranche, helped creating deals that are
designed to fail. This argument is widely connected with the name of the hedge fund Mag-
netar. Magnetar or the “Magnetar Trade” gained high public attention due to two prominent
media articles. In particular, motivated by an earlier story in the Wall Street Journal (see Ng
and Mollenkamp, 2008), in April 2010 reporters Jesse Eisinger and Jake Bernstein from Pro-
Publica (an independent non-profit newsroom that produces investigative journalism) wrote a
story regarding Magnetar’s mortgage CDO investment strategy that was active from 2006
through 2007.5 The story essentially claimed that Magnetar “sponsored” mortgage-backed
CDOs by agreeing to buy/finance the equity tranche, and then shorted (bet against) mezzanine
tranches of those (and similar) CDOs by buying CDS that insured the CDO tranches.
ProPublica raises two main points for criticism. First, by helping to create new mortgage
ABS-CDOs just at a time (2006) when the US housing market started to level off and to sub-
sequently decline, Magnetar expanded the exposure to losses when the housing market finally
4 The underlying reason is that many investors rely on the ratings for CDO pricing. However, traditional bond ratings cannot adequately assess the risk characteristics of securitized products. In particular, as shown by Coval et al. (2009a), Hamerle et al. (2009), and Krahnen and Wilde (2009), among others, CDO tranches become much riskier investments than equally rated corporate bonds due to an increased sensitivity to systematic risks, not captured by traditional ratings. This considerably increased systematic risk of CDO tranches needs to be com-pensated for by a significantly higher spread than is usually paid for corporate bonds of the same rating. Hence, investors who solely rely on the rating generally pay a too high price for the CDO tranches (Coval et al., 2009b; Brennan et al., 2009), or investors selling credit protection on these tranches receive a too low CDS spread. This type of mispricing is strongest for ABS-CDOs, which have the highest systematic risk exposure (Hamerle et al., 2009). In addition, expected returns for equity tranches of synthetic CDOs were higher than for cash CDOs (around 21% vs. 13%, according to Goodman et al., 2008) because ABCDS tended to have higher yields than cash bonds, and the unfunded super-senior tranche of synthetic deals was paid less than the AAA counterpart from a cash deal. So this amount could instead be distributed to the highly leveraged equity tranche. For exam-ple, if 0.10% was “saved” in annual funding cost on 80% of a structure, that amount would translate into 0.40% available to allocate to the other 20%. 5 See Eisinger and Bernstein (2010). In April 2011, Eisinger and Bernstein won the Pulitzer Prize for their series of Magnetar articles that made the intricacies of the story accessible to just about any reader, according to the Prize committee.

4
collapsed and exacerbated the impact of the collapse on the financial system and the econ-
omy. According to data from ProPublica (see Bernstein et al., 2010), between May and De-
cember 2006 Magnetar sponsored mezzanine ABS-CDOs (i.e., CDOs backed by RMBS col-
lateral rated BBB on average) with a total deal balance of $26.1 billion, and of $8.8 billion
between January and July 2007. These numbers represent 39.0% of the overall mezzanine
ABS-CDO market in the former period and 18.6% in the later. Second, the ProPublica article
asserted that Magnetar in effect acted as the collateral selection agent in the CDOs it helped
creating, and pushed the collateral manager to include the riskiest assets.6 This last point is
also the subject of two lawsuits concerning Magnetar CDOs. In the first one, the Dutch bank
Rabobank sued Merrill Lynch in 2009 over a deal called Norma CDO I, a $1.5 billion CDO
that went bust within a year of its creation in 2007 and in which Magnetar was the equity in-
vestor. According to FCIC (2011, p. 192): “Court documents indicate that Magnetar was
involved in selecting collateral, and that NIR [the collateral manager] abdicated its asset se-
lection duties to Magnetar with Merrill’s knowledge.” The case eventually settled for an un-
disclosed amount in August 2010. In a related case, the SEC charged JP Morgan over another
Magnetar CDO, Squared CDO 2007-1 (see SEC, 2011). The SEC alleges that JP Morgan
structured and marketed this CDO without informing investors that Magnetar helped select
the assets in the CDO portfolio and had a short position in more than half of those assets. The
SEC also separately charged Edward S. Steffelin, who headed the team at the deal’s CDO
manager, GSC Partners, responsible for the deal. On June 21, 2011, the SEC announced that
JP Morgan will pay $153.6 million in order to settle the charges.7 To date, however, Magnetar
itself does not stand accused of any wrongdoing. Moreover, the SEC staff even issued a
closing letter (see www.magnetar.com) to Magnetar stating that it does “not intend to recom-
mend any enforcement action” against Magnetar, any of its funds or any current or former
Magnetar personnel with respect to the Squared investigation.
This paper provides a first empirical investigation of the Magnetar trade. Based on a sample
of 275 ABS-CDOs, originated between 2006 and mid 2007, of which 14 were sponsored by
Magnetar, the paper tests for the existence of systematic differences between Magnetar and
non-Magnetar sponsored deals and whether important deal participants like investors and rat-
6 As anecdotal evidence in this regard, the article includes an e-mail from Magnetar’s official James Prusko to a CDO manager, Ischus Capital Management, where Magnetar not only pushed for higher spread (meaning riskier) CDS on subprime bonds to be included, but also provided a spreadsheet with a “target portfolio”. 7 A related non-Magnetar case that gained much public attention involved the hedge fund Paulson & Co. (“Paul-son”). In April 2010, the SEC charged Goldman Sachs with fraud for telling investors that an independent CDO manager, ACA Management, had picked the underlying assets in a CDO when in fact a short investor, Paulson, had played a “significant role” in the selection. The SEC alleged that those misrepresentations were in Gold-man’s marketing materials for Abacus 2007-AC1, one of Goldman’s Abacus synthetic CDO deals. In July 2010, Goldman settled the case, paying a record $550 million fine.

5
ing agencies were aware of the detected differences. The main findings are as follows. First,
controlling for deal characteristics, issue quarter, trustee and underwriter fixed effects, collat-
eral pools of Magnetar deals show a significantly higher overall default rate than the pools of
their non-Magnetar peers. For example, conditional average collateral default rates are about
17.3-20.5% higher for Magnetar deals, and average collateral ratings are 1.8 notches closer to
default. Second, these risk differences also exist within the five distinct collateral asset classes
considered. Hence, the higher riskiness of Magnetar deals is not due to asset specialization.
Third, I find (weak) evidence that investors demand a (price) discount on debt tranches sold
by Magnetar deals. Fourth, tranches from Magnetar CDOs receive on average higher (i.e.,
closer to default) ratings at origination. And finally, examining the time to an event of default
for all of Magnetar’s 28 sponsored deals and the control sample, I find that Magnetar deals
have significantly higher default hazards, estimated using a Cox proportional hazard specifi-
cation. In sum, this is strong evidence for Magnetar deals being indeed riskier than their peers
from the same vintage, in line with ProPublica’s claim. Even if this certainly does not prove
that Magnetar selected the collateral assets for its deals, it points to an (unknown) mechanism
making Magnetar deals high risk investments for “long only” investors.
The rest of the paper is organized as follows. Section 2 presents background information on
the Magnetar trade. Section 3 describes the data and provides summary statistics for important
deal characteristics. Section 4 presents the main empirical results concerning risk differences
between Magnetar and non-Magnetar deals. It also focuses on pricing and rating of issued
(non-equity) tranches and shows several robustness checks. Section 5 concludes.
2. The Magnetar trade
In a letter to its investors (Magnetar, 2010a, p. 2), Magnetar describes its mortgage CDO strat-
egy as follows: “… Magnetar’s strategy was in essence a capital structure arbitrage. This
type of strategy is broadly employed in corporate credit markets, and is based on the relative
value between differing components of a company’s capital structure (in our case the different
tranches or classes of a CDO), and on the supply-demand imbalances which can be exhibited
in the pricing of rated and non-rated tranches. From early 2006 to late 2007, there was a
systematic relative value mispricing between the equity tranches of mortgage CDO structures,
which offered approximately 20% target yields, and mezzanine debt tranches of mortgage
CDO structures, on which credit protection could be bought for between 1% and 4% (depend-
ing upon which tranche and CDO).” The economic rationale behind this type of arbitrage
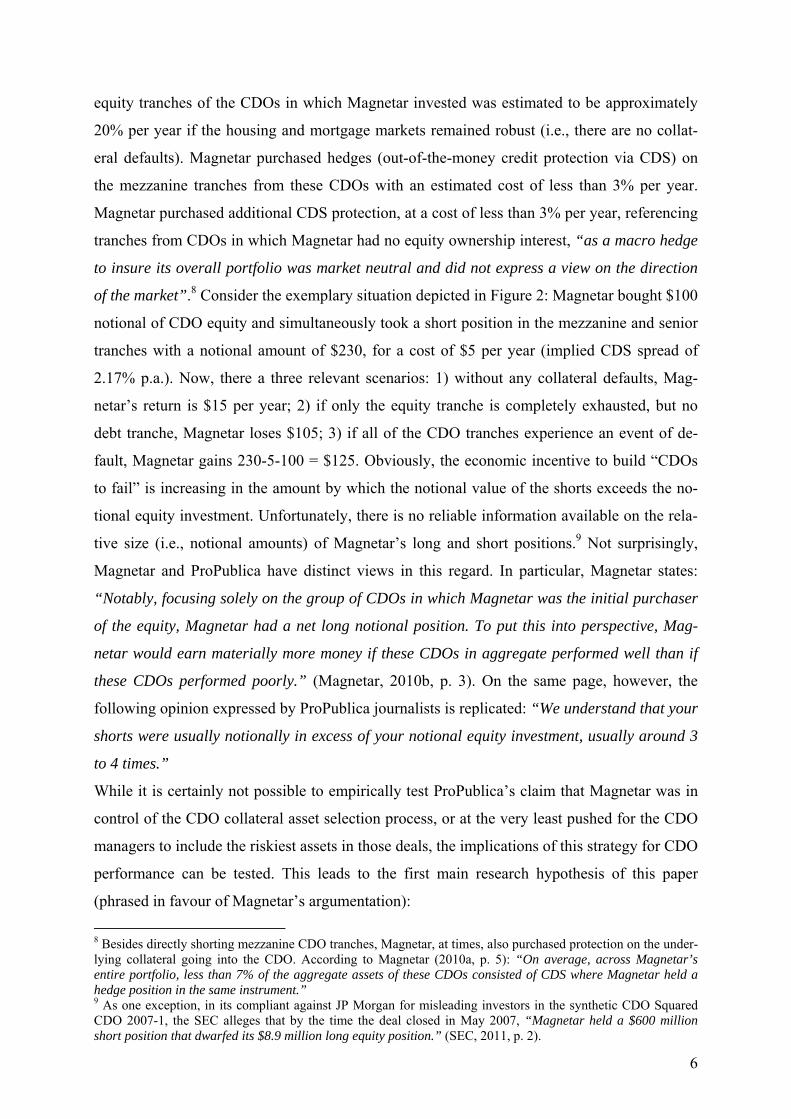
strategy is illustrated in Figure 2. According to Magnetar (2010a), the expected return on the
6
equity tranches of the CDOs in which Magnetar invested was estimated to be approximately
20% per year if the housing and mortgage markets remained robust (i.e., there are no collat-
eral defaults). Magnetar purchased hedges (out-of-the-money credit protection via CDS) on
the mezzanine tranches from these CDOs with an estimated cost of less than 3% per year.
Magnetar purchased additional CDS protection, at a cost of less than 3% per year, referencing
tranches from CDOs in which Magnetar had no equity ownership interest, “as a macro hedge
to insure its overall portfolio was market neutral and did not express a view on the direction
of the market”.8 Consider the exemplary situation depicted in Figure 2: Magnetar bought $100
notional of CDO equity and simultaneously took a short position in the mezzanine and senior
tranches with a notional amount of $230, for a cost of $5 per year (implied CDS spread of
2.17% p.a.). Now, there a three relevant scenarios: 1) without any collateral defaults, Mag-
netar’s return is $15 per year; 2) if only the equity tranche is completely exhausted, but no
debt tranche, Magnetar loses $105; 3) if all of the CDO tranches experience an event of de-
fault, Magnetar gains 230-5-100 = $125. Obviously, the economic incentive to build “CDOs
to fail” is increasing in the amount by which the notional value of the shorts exceeds the no-
tional equity investment. Unfortunately, there is no reliable information available on the rela-
tive size (i.e., notional amounts) of Magnetar’s long and short positions.9 Not surprisingly,
Magnetar and ProPublica have distinct views in this regard. In particular, Magnetar states:
“Notably, focusing solely on the group of CDOs in which Magnetar was the initial purchaser
of the equity, Magnetar had a net long notional position. To put this into perspective, Mag-
netar would earn materially more money if these CDOs in aggregate performed well than if
these CDOs performed poorly.” (Magnetar, 2010b, p. 3). On the same page, however, the
following opinion expressed by ProPublica journalists is replicated: “We understand that your
shorts were usually notionally in excess of your notional equity investment, usually around 3
to 4 times.”
While it is certainly not possible to empirically test ProPublica’s claim that Magnetar was in
control of the CDO collateral asset selection process, or at the very least pushed for the CDO
managers to include the riskiest assets in those deals, the implications of this strategy for CDO
performance can be tested. This leads to the first main research hypothesis of this paper
(phrased in favour of Magnetar’s argumentation):
8 Besides directly shorting mezzanine CDO tranches, Magnetar, at times, also purchased protection on the under-lying collateral going into the CDO. According to Magnetar (2010a, p. 5): “On average, across Magnetar’s entire portfolio, less than 7% of the aggregate assets of these CDOs consisted of CDS where Magnetar held a hedge position in the same instrument.” 9 As one exception, in its compliant against JP Morgan for misleading investors in the synthetic CDO Squared CDO 2007-1, the SEC alleges that by the time the deal closed in May 2007, “Magnetar held a $600 million short position that dwarfed its $8.9 million long equity position.” (SEC, 2011, p. 2).

7
Hypothesis (H1). Magnetar-sponsored deals do not have higher collateral pool default rates
than comparable deals from the same vintage. A rejection of H1 (i.e., finding that Magnetar deals are riskier) stands in contrast to Mag-
netar’s claim that it had a net long notional position in the CDOs it helped creating. It is
somewhat hard to believe that Magnetar was systematically fooled, building a net long posi-
tion in deals that subsequently underperformed (and shorting deals via macro hedges that per-
formed better than the overall market). Furthermore, since the offering documents provided to
possible investors and to rating agencies describe each individual asset backing the CDO se-
curities, investors and rating agencies should be aware of possible risk differences between
deals and prize/access these differences accordingly when they determine tranche yield
spreads (at origination) and ratings. This leads to the second hypothesis (phrased in favour of
Magnetar’s argumentation): Hypothesis (H2). There are no differences in initial yield spreads and ratings between simi-
lar tranches from Magnetar and non-Magnetar CDOs.
3. Data and descriptive statistics
The data used in this study comes from BARCLAYS CAPITAL LIVE (BCL), a web-based
platform that provides access to Barclays (formerly Lehman Brother’s) research and fixed
income, credit, and equities markets analytics. This database contains detailed surveillance
information on virtually the entire population of US ABS-CDOs issued from January 1, 1999
through December 31, 2007. At the end of July, 2010, BCL contains information about 653
ABS-CDO deals that have not been liquidated as of that date. I focus on deals originated be-
tween the beginning of 2006 and mid 2007, the period in which Magnetar was actively in-
volved in the CDO market according to Eisinger and Bernstein (2010). This gives a basic
sample of 275 deals for with at least some elementary information is available in BCL. To
identify the “Magnetar deals”, I rely on the publications from ProPublica and the finance blog
Naked Capitalism (2010). Bernstein et al. (2010) have identified 26 deals which were alleg-
edly sponsored by Magnetar. Table 1 lists these deals in chronological order together with
three deals (Dorado CDO Ltd., Octonion I CDO Ltd., Corona Borealis CDO Ltd.) added by
Naked Capitalism. For one of these three additional deals, Dorado CDO Ltd., there is no in-
formation available, neither in BCL nor in Bloomberg. So, this deal is excluded in all analyses
that will follow. Furthermore, only the 14 deals in the grey-shaded rows are included in the

8
BCL database and thus can be extensively studied in this paper. However, in robustness
checks I will also present some results for the full set of 28 Magnetar deals.
As can be calculated from Table 1, the notional balance of all rated tranches of an average
(median) Magnetar deal is high, $1.290 ($1.477) billion. There are also some notable patters
in the underwriter/manager structure. For example, whereas the 29 deals are spread over 17
different managers, with most managers only accounting for one deal, two of them (Harding
Advisory and GSC Partners) alone are responsible for 12 deals. In addition, the deals are
structured and distributed by 9 different underwriters with Calyon, Citigroup and Merrill
Lynch being the largest with five or six deals each. Most importantly, all 28 deals (excluding
Dorado) experienced an Event of Default (EOD) relatively soon, on average 464.9 days after
closing. EODs are triggered by a breach of an overcollateralization (O/C) ratio test or when
the CDO misses interest payments on debt tranches. This high default experience stands in
contrast to the default behaviour of the 261 non-Magnetar deals in the sample, among which
only 164 (i.e., 63%) defaulted until the end of 2010, with an average time gap of 628.8 days
between issue date and EOD date. These differences in average default times between Mag-
netar and non-Magnetar deals are significant at the 1% level. Hence, Magnetar deals appear to
default earlier and at a higher rate.10
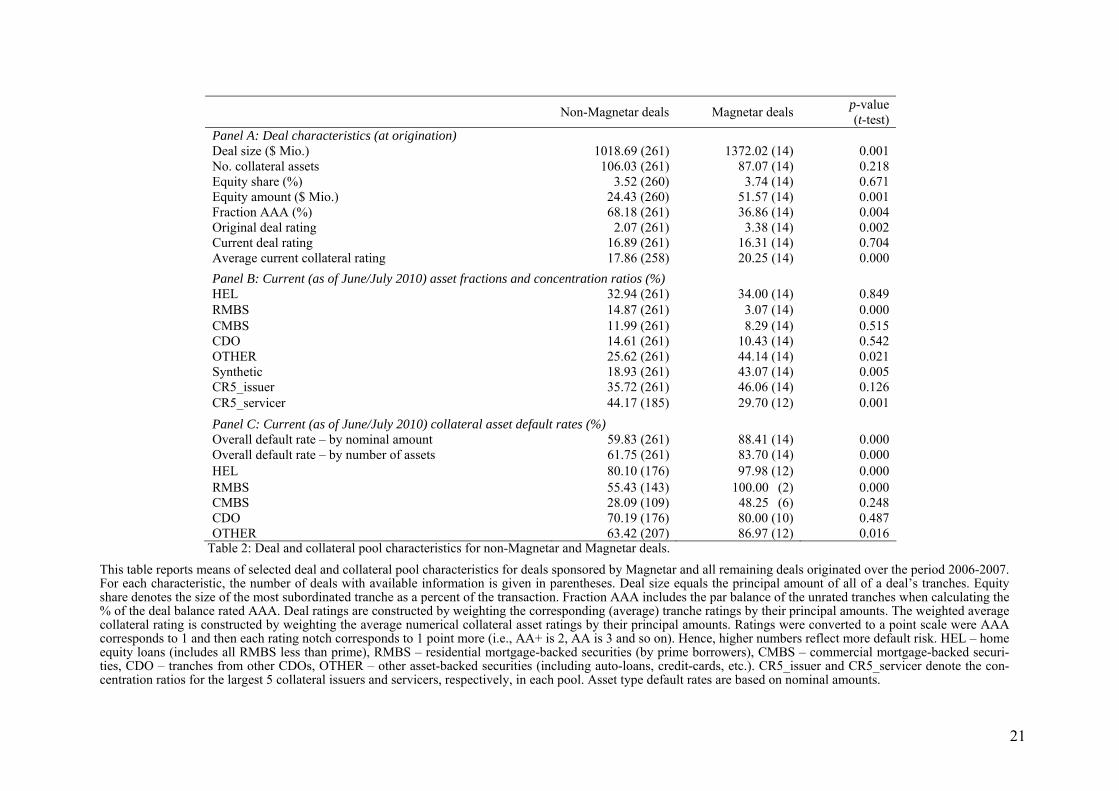
To further investigate these different default behaviours, Table 2 compares the means of vari-
ous deal and collateral pool characteristics between non-Magnetar and Magnetar-sponsored
deals. The two groups are remarkably different along various dimensions. First, as shown in
Panel A, Magnetar deals are larger, have a significantly higher amount (but not share) of eq-
uity backing the senior tranches, less of the deal balance rated AAA, and a lower (i.e., closer
to default) deal rating at origination.11 The weighted average collateral rating as of June/July
2010 is also on average 2.5 notches closer to default compared to non-Magnetar deals. How-
ever, tranches from both deal types have experienced massive downgrades, producing deal
ratings that are currently on average 13-15 notches closer to default than at origination.
Panels B and C analyze the current (as of June/July 2010) asset type composition of deal col-
lateral pools and asset type default rates (i.e., the nominal asset fraction in default). I differen-
10 The median default times are 564.5 days for non-Magnetar and 374.5 days for Magnetar deals, a significant difference with a p-value of 0.024. 11 Here, deal ratings are constructed by weighting the corresponding (average) tranche ratings by their principal amounts. Tranche ratings were converted to a point scale were AAA corresponds to 1 and then each rating notch corresponds to 1 point more (i.e., AA+ is 2, AA is 3 and so on). Hence, higher numbers reflect more default risk. I use the correspondence of the Moody’s scale with that of S&P and Fitch that is common in the literature (AA of S&P/Fitch corresponds to Aa in Moody’s, BBB of S&P/Fitch equals Baa, etc.). As a summary variable for the ratings, I choose to average the ratings in the point scale. For example, one AA rating (3 in the point scale) from one agency and one AA- from another agency (4 in the point scale) corresponds to 3.5. In cases where there are three ratings and only one disagrees I approximate the rating to the closest half point.

9
tiate between five asset classes: HEL – home equity loans (includes all RMBS less than
prime)12, RMBS – residential mortgage-backed securities (by prime borrowers), CMBS –
commercial mortgage-backed securities, CDO – tranches from other CDOs, OTHER – other
asset-backed securities (including auto-loans, credit-cards, etc.).
Panel B reveals some marked differences in the collateral structure. Whereas Magnetar deals
have lower prime RMBS exposure (only 3% vs. 15% for non-Magnetar deals), they include
significantly more “other ABS” assets (44% vs. 26%). As expected, Magnetar deals generate
more exposure synthetically through CDS which account on average for 43% of the collateral
balance. However, most revealing are the findings in Panel C. For all asset types and the
overall portfolio, the corresponding default rates are much higher among Magnetar deals, and
these differences are significant in five out of seven cases. Hence, managers of Magnetar
deals appear to have selected the riskiest part from each asset class. For example, whereas the
HEL fractions (33% vs. 34%) are similar between both deal types, the average Magnetar HEL
default rate is nearly 100%, compared to 80% for non-Magnetar deals. Furthermore, Magnetar
deals have a high other ABS exposure (44% on average), but around 87% of this exposure is
in default as of June/July 2010. This explains why the overall collateral pool default rate (ei-
ther measured on a nominal amount or number of assets basis) is more than 20% higher for
Magnetar deals. In sum, some of this ex post higher riskiness of Magnetar deals was already
reflected in their structure and ratings ex ante (at origination), as evidenced by lower AAA
shares, more equity and closer to default deal ratings.
4. Empirical results
4.1 Deal performance
In a first set of tests I investigate whether the observed differences in deal performance also
hold in a multivariate context. My main independent variable of interest, Magnetar, takes on
the value one for Magnetar-sponsored deals, and zero otherwise. I build a number of control
variables (measured at origination) to capture structural features of a deal and initial underly-
ing collateral characteristics that may be correlated with deal performance.
Obviously, the quality of a CDO’s collateral manager is of central importance to the perform-
ance of the deal. To incorporate the argument that high-quality managers likely have more
assets under management, I construct the variable Market share, calculated for each manager
as the collateral par amount of deals managed in a given year over the total collateral par
12 Home equity loan securities are residential mortgage-backed securities whose cash flows are backed by a pool of home equity loans. Home equity loans, in turn, are second lien mortgages in which borrowers use the equity in their homes as collateral.

10
amount of all deals originated in that year, according to data from BCL. This variable is
lagged by one year. In a recent paper, also focusing on ABS-CDOs and using the same market
share variable, Mählmann (2011) finds that higher market share manager deals significantly
underperform their lower market share peers. This could be explained by a conflicts of inter-
est argument: the desire to increase overall compensation by creating and managing more new
deals makes managers prone to the interests of the deal/equity sponsors. The proliferation of
synthetic or hybrid CDOs since 2005 further worsens this incentive conflict of CDO manag-
ers. Once short investors are involved, the CDO has two types of investors with opposing in-
terests: those who would benefit if the assets performed, and those who would benefit if the
mortgage borrowers stopped making payments and the assets failed to perform. To control for
synthetic/hybrid CDOs enabling sophisticated investors to place bets against the housing mar-
ket, making more money if CDS were written on low quality reference assets (e.g., mezzanine
tranches of subprime RMBS), I include the variable Synthetic fraction, denoting the collateral
par percentage of synthetic (i.e., CDS) assets.
I also include the number of tranches since asymmetric information theories of tranching sug-
gest that tranching should be particularly beneficial for better quality collateral assets. For
example, in a model with asymmetric information about collateral asset quality, Boot and
Thakor (1993) show that with 3 types of security issuers, those with the highest quality of
collateral might split securities into 3 tranches ranked by seniority, if the gain in price appre-
ciation is greater than the loss due to reduction in total informed demand. Hence, No. tranches
should be negatively associated with collateral default rates. As a crude measure for risk di-
versification I consider the number of collateral assets, with more assets indicating a higher
diversification level. To further capture the initial riskiness of the collateral pool I construct
the variable Original deal rating in a two step procedure. First, numerical tranche ratings are
formed based on the average of the ratings a tranche received at issuance: I set AAA=1,
AA+=2, AA=3, and so on; hence a higher score implies a worse rating. Then average tranche
ratings are weighted by their principal amounts to construct the deal rating.13
As dependent variables in the ex post deal performance regressions I focus on the collateral
default rate (by number and amount), and the weighted average collateral rating, constructed
by weighting the average numerical collateral asset ratings by their principal amounts. Both
13 I considered a number of other deal characteristics, like the log of the principal amount of all of a deal’s tranches (Deal size) and Equity share, denoting the size of the most subordinated tranche as a percent of the transaction. In most regressions, these variables turned out to be insignificant, probably due to their high correla-tion with other included regressors. In particular, Deal size is strongly correlated with Market share (ρ=0.397), No. assets (ρ=0.525), and Equity share (ρ=-0.429), and Equity share is additionally correlated with Original deal rating (ρ=0.527) and No. assets (ρ=-0.352). In any case, including Deal size and Equity share does not materially affect the coefficients of the remaining regressors.
11
variables are measured as of June 2010. Results from these regressions are presented in Table
3, with standard errors clustered at the underwriter-issue quarter level. Most importantly, the
univariate performance differences between both deal types do not disappear after including
control variables. The coefficients for Magnetar (in the columns labelled II) suggest that the
collateral default rate (the average rating) would be about 17.3-20.5% (1.8 notches) higher for
Magnetar deals. Since the average sample default rate is 65.7-67.4% and the average collat-
eral rating is 18.3 (close to CCC/Caa2), this effect is economically and statistically significant.
Note that the coefficient on Magnetar is likely biased towards zero because the group of non-
Magnetar deals probably also includes deals sponsored by hedge fund equity investors that
performed capital structure arbitrage strategies similar to Magnetar. This makes it more diffi-
cult to disentangle a Magnetar effect.
The coefficients on the control variables are broadly as expected: larger deals with more col-
lateral assets and tranches and with less synthetic exposure have lower default rates and
higher (i.e., closer to AAA) collateral ratings. Deals managed by low market share managers
and initially more risky deals (as indicated by closer to default deal ratings) do perform better.
The first effect is consistent with the findings in Mählmann (2011) and the latter effect is
likely due to the fact that deals containing more risky and lower rated assets as collateral at
origination also probably have tighter investment guidelines restricting the asset replacement
and investing decisions of the manager. Since it is possible that the Magnetar dummy proxies
for quality differences between trustees (e.g., Magnetar deals are overseen by low-quality
trustees), I include trustee fixed effects. In addition, to capture cross-sectional variation in the
relation between deal performance and underwriter characteristics (e.g., reputation, experi-
ence, changes in structuring standards, etc.), underwriter dummies are included. However, the
coefficient for Magnetar remains materially unchanged.
The results so far are consistent with the claim that Magnetar has pressed CDO managers to
select more risky collateral. Alternatively, the findings are also consistent with the argument
that Magnetar sponsored deals whose managers specialized in some sectors, particularly
HEL/subprime RMBS, which are (not only ex post) more risky than the others. Hence, this
could just be a story of different risks managed by different market participants. However, the
numbers in Table 2 do not support this story. First, whereas the evidence in Panel B suggests
that Magnetar deals are somewhat specialized in the “other ABS” asset class (their average
collateral share is 44.1%, compared to 25.6% for non-Magnetar deals), these assets appear not
to be particularly risky in general. For example, the sample mean default rate for this asset
class (64.7%) compares well to the mean overall default rate of 61.3%. Second, as already
12
discussed above, for each of the five asset classes considered, managers of Magnetar-
sponsored deals selected the riskiest part, producing significantly higher asset-specific default
rates (see Panel C of Table 2). This does not speak in favour of asset specialization being re-
sponsible for high overall collateral defaults, but supports the view that Magnetar deals are
riskier among all asset categories.
To further investigate the alternative specialization story, I estimate OLS regressions similar
to the ones shown in Table 3 but now with current asset type default rates as dependent vari-
ables. Asset-specific default rates are only calculated for deals that contain the asset type in
question as collateral. Further, to make the estimation of the coefficient for the Magnetar
dummy more reliable, regressions are run only if there are at least 10 Magnetar deals. Due to
this restriction, (prime) RMBS and CMBS asset categories were excluded, for which there are
only two and six Magnetar deals, respectively. The coefficients for Magnetar, shown in Table
4, suggest that the collateral default rate would be about 18.1% higher for HEL/subprime col-
lateral, 14.7% higher for CDO assets and 27.7% higher for non-mortgage (other ABS) collat-
eral when the deal is sponsored by Magnetar. These effects are statistically significant (at the
5% level) in two out of three cases. The size and sign of the coefficients for the control vari-
ables are broadly consistent with the ones presented in Table 3 but the significance levels are
generally lower due to the smaller sample size. The finding that Magnetar-sponsored deals
have higher default rates across different asset types is consistent with the notion that these
deals invest in the most risky parts within each asset class.
4.2 Did investors and rating agencies recognize the higher riskiness of Magnetar deals?
4.2.1 Yield spreads at origination
I next examine whether investors and the rating agencies recognize the lower collateral qual-
ity of Magnetar CDOs when they try to assess and prize these deals’ riskiness.14 I first exam-
ine whether the market differentiates ex ante the credit quality of tranches from Magnetar vs.
non-Magnetar deals by comparing their initial yields (at issuance, over a benchmark). Since
the number of fixed rate tranches is too low to justify the introduction of yield spread meas-
urement error through a combined analysis of fixed and floating rate securities, and also too
low for a separate analysis of fixed rate tranches, I focus on floating rate tranches in what fol-
14 Note that this paper does not focus on a general mispricing/misrating of CDO tranches, as indicated by the work of Coval et al. (2009b) or Brennan et al. (2009), but, instead, on relative pricing/rating differences between Magnetar and non-Magnetar CDO tranches.

13
lows.15 I define the yield spread as the spread over the index rate (the 3- (or 1-)month LIBOR
for 69% (or 30%) of the tranches). The dependent variable in Table 5 equals the natural log of
the yield spread calculated at issuance date. In all regressions, I control for the same set of
deal variables as before (in Tables 3 and 4), and for three additional tranche characteristics,
the log of the tranche’s nominal balance, the log of contractual maturity and the effective sub-
ordination percentage (i.e., the percentage of the total collateral principal which is subordinate
to the tranche in question). I also report results for data splits focusing separately on all AAA
tranches and all non-AAA tranches.
For the pooled sample and the two data splits, the positive coefficient found for the Magnetar
dummy in five out of six cases indicates that the yield spread on tranches from Magnetar deals
is on average higher than that on tranches from non-Magnetar deals. But the coefficient is
only significant (at the 5% level) for AAA tranches when underwriter*issue quarter fixed ef-
fects (105 categories) are included. To assess economic significance, the coefficient from the
pooled model, for example, suggests that the yield would be around 9% higher for a Magnetar
tranche. Since the average spread is 180 bp, a 9% increase equals about 16 bp. In sum, there is
some (weak) evidence implying that the market has priced in, to some extent, the lower qual-
ity of Magnetar collateral pools. However, the results for the Magnetar dummy have to be
interpreted with caution since there are only 91 (26 AAA and 62 non-AAA) Magnetar
tranches among the 1470 tranches.
I also obtain a number of interesting results on how the market has priced certain characteris-
tics of CDO tranches in the months leading up to the financial crisis. For example, larger
tranches pay lower spreads, as do more senior tranches with a higher subordination level and
tranches with a shorter remaining time to contractual maturity. The first result could indicate a
liquidity premium contained in credit spreads which decreases with tranche size (Firla-
Cuchra, 2005). In line with the theoretical result that more diversified asset pools benefit sen-
ior tranche investors but have no clear impact on mezzanine tranches (e.g., Duffie and Gâr-
leanu, 2001), I find a negative and significant coefficient for No. assets. The number implies
that 10 more collateral assets decrease the average tranche spread by 1% (or 0.4 bp).16 How-
ever, putting in more synthetic assets has an offsetting effect, as shown by the positive coeffi-
cients found for Synthetic fraction. That is, 10% more of the nominal exposure through CDS
increases the spread by 3% (or 1.2 bp). Finally, the negative coefficient found for No.
15 There are just 98 fixed rate tranches in the sample with information on ratings and initial coupon. This number is further reduced due to missing information on control variables. On the contrary, for 1470 floating rate tranches from 223 deals, all required information is available. 16 The mean (median) spread amounts to 41.3 (40.0) for the AAA sample and to 269.7 (175.0) for the non-AAA sample.

14
tranches in the non-AAA sample indicates that greater market sophistication, asymmetric in-
formation and market incompleteness, all factors which are theoretically associated with more
tranching (see Firla-Cuchra and Jenkinson, 2005, for a discussion), would have a positive effect
on price. Note that the results are robust to various fixed effect, including underwriter*issue
quarter fixed effects (106 categories). Further, the fit of the models is quite high, reaching an
R2 of over 90% for non-AAA tranches. However, most of this fit steams from the rating class
fixed effects. For example, estimating the pooled model with rating fixed effects only yields
an R2 of already 0.833. This is consistent with and extends previous results (e.g., Firla-
Cuchra, 2005; Fabozzi and Vink, 2011) showing that (European) securitization markets are
essentially “rated” markets, characterized by credit ratings as the key indicators of primary
market spreads.
4.2.2 Tranche ratings
In this set of tests I ask whether rating agencies were aware of the lower collateral quality of
Magnetar-sponsored deals. Hence, did tranches from Magnetar CDOs receive significantly
lower (i.e., closer to default) ratings than comparable tranches from non-Magnetar CDOs?
Among the 1521 rated tranches, 1.7% are rated by one agency, 79.8% are rated by two and
18.6% obtained a rating from all three agencies, so I choose to average the ratings in the point
scale. For example, one AA rating (3 in the point scale) from one agency and one AA- from
another agency (4 in the point scale) corresponds to 3.5. In cases where there are three ratings
and only one disagrees I approximate the rating to the closest half point.
Table 6 reports results from rating level regressions, the first three columns for OLS and the
last two for ordered probit specifications, taking into account that ratings are not linear but
ordinal measures of credit quality.17 The controls are the same as in the yield spread regres-
sions. The positive and significant coefficients found for Magnetar suggest that tranches from
Magnetar CDOs receive on average higher (i.e., closer to default) ratings, indicating a lower
credit quality. For example, the coefficient from model (III) indicates that Magnetar tranches
are rated on average 1.1 notches (a notch is, for example, the difference between AA+/Aa1
and AA/Aa2) closer to default than similar non-Magnetar tranches. Since the average numeri-
cal tranche rating in the sample is 4.6 (lying between AA-/Aa3 and A+/A1), this effect is also
economically significant. The results for the control variables are broadly as expected: larger
tranches with a higher subordination level, from better-diversified deals with less synthetic
exposure receive lower (i.e., closer to AAA) ratings. However, the coefficients for No. 17 All results are qualitatively similar if instead of the composite average rating Moody’s or Standard & Poor’s tranche ratings are used separately as dependent variables.

15
tranches and Ln(Maturity) stand somewhat in contrast to the findings for initial yield spreads
presented in Table 5: longer maturity tranches have (albeit only weakly significant) better
ratings as do tranches from CDOs with a lower number of tranched liabilities. These differ-
ences are due to the fact that the regressions in Table 5 estimate the marginal effects of each
variable after ratings are controlled for. In sum, Table 6 provides strong evidence indicating
that the weak collateral quality of Magnetar CDOs was indeed reflected in tranche ratings.
4.3 Robustness
In this section, I report results from several robustness checks. First, the default rate regres-
sions in Tables 3 and 4 include a proportion as dependent variable and the number of bound-
ary values (i.e., either 0 or 1) could be quite high. Since OLS might not be appropriate for a
proportion as a dependent variable, I employ fractional logit regressions (see Papke and
Wooldridge, 1996) that can handle proportions with a high fraction of observations at the
boundary. For example, among the 236 deals in the default rate regressions of Table 3 there
are 9 without any defaults and 22 that have all of their collateral assets in default. However,
the results from these alternative fractional logit specifications are qualitatively unchanged.
A more fundamental concern relates to the reduced sample which contains information for
only 14 of the 28 Magnetar deals. Hence, it could be argued that the 14 deals analysed here
are not representative for the typical Magnetar deal but are exceptionally risky. Fortunately,
while I have no information available about the performance (in terms of collateral defaults or
ratings) or collateral pool compositions for the missing deals, Table 1 lists their EOD dates,
collected from Standard & Poor’s (2011). A first quick look reveals no significant differences
in mean or median default times between the 14 included (i.e., grey-shaded) Magnetar deals
and the 14 deals without information in BCL. The means (medians) are 493.6 (368.5) and
436.1 (397.5) days, respectively.
To more directly test for differences in the default behavior of available and missing Magnetar
deals I estimate Cox proportional hazard models. The dependent variable in these regressions
is the time from deal closing to the EOD date or the end of the sample period (December 31,
2010), whichever comes first. Columns (I) and (III) in Table 7 present the results (estimated
hazard ratios) from these regressions, separately for the full sample of all 28 Magnetar deals
and 239 non-Magnetar deals and the reduced sample with the 14 deals contained in BCL.
Note that the full sample includes 261 non-Magnetar CDOs. However, due to missing infor-
mation on deal underwriters (the cluster variable for standard errors) and other control vari-
ables this number is reduced to 239 in Column (I) and to 222 in Column (III). The large and
16
significant hazard ratios found for Magnetar reinforce the previous findings: Magnetar deals
have a higher default hazard, irrespective of whether the estimation is based on the complete
or the reduced set of deals. In particular, depending of the specification and sample, the de-
fault hazard is between 3.5 and 6.8 times higher for Magnetar-sponsored CDOs.
The results for the control variables broadly agree with the ones in Table 3: hazard ratios for
Market share and Synthetic fraction are larger than one (but only weakly significant in case of
Market share) and smaller than one for the remaining three variables indicating decreasing
hazards for higher values of these variables. The estimations so far have assumed that the per-
formance of deals with the same manager is conditionally independent. In the next exercise,
however, I refine the analysis by alternatively modeling a likely within-manager correlation
by assuming that the correlation is the result of a latent manager-level effect or frailty. Results
from a Cox model with gamma-distributed frailty are contained in Columns (II) and (IV),
respectively. The found hazard ratios are similar to the previous estimates. The significant
values obtained for the frailty variance further support the shared frailty models, meaning that
the correlation within manager clusters cannot be ignored.
5. Conclusion
The results presented here are in line with the general claim that the introduction of single-
name credit derivatives (i.e., CDS on ABS and CDS on CDO tranches) changed the nature of
the CDO market by creating possibilities for conflicting interests. For example, it could be
argued that since the beginning of 2006 synthetic CDOs were mainly initiated by investors
who wanted to short the US residential mortgage market on a large scale (like Paulson in Aba-
cus 2007-AC1). Hence, the presence of short investors (i.e., CDS collateral) should have an
adverse impact on deal performance. Consistent with this reasoning, I find that deals with
more exposure generated synthetically have higher collateral default rates and lower (i.e.,
closer to default) average collateral ratings. However, the finding that debt tranches from
these deals are also priced at a discount and receive closer to default ratings at origination
suggests that important market participants like investors and rating agencies were aware of
the potential for incentive conflicts introduced by short investors. Furthermore, a combination
of two forces, rating-driven underestimation of mezzanine and senior CDO risk and the avail-
ability of short positions, made CDOs an ideal vehicle for capital structure arbitrage strate-
gies. This, in turn, tightened the incentive conflicts of major equity tranche investors like
hedge funds and ultimately led to the collapse of the whole CDO market.

17
References Bernstein, J./Eisinger, J./Kjellman Schmidt, K. (2010): The timeline of Magnetar’s deals. ProPublica, April 9, 2010. Boot, A. W. A./Thakor, A. (1993): Security design. In: Journal of Finance 48, 1349-1378. Brennan, M. J./Hein, J./Poon, S.-H. (2009): Tranching and rating. In: European Financial Management 15, 891-922. Brunnermeier, M. (2009): Deciphering the liquidity and credit crunch 2007-2008. In: Journal of Economic Perspectives 23, 77–100. Coval, J./Jurek, J./Stafford, E. (2009a): The economics of structured finance. In: Journal of Economic Perspectives 23, 3-25. Coval, J./Jurek, J./Stafford, E. (2009b): Economic catastrophe bonds. In: American Economic Review 99, 628-666. Duffie, D./Gârleanu, N. (2001): Risk and valuation of collateralized debt obligations. In: Fi-nancial Analysts Journal 57 (January/February), 41-59. Eisinger, J./Bernstein, J. (2010): The Magnetar trade: How one hedge fund helped keep the bubble going. ProPublica, April 9, 2010. Fabozzi, F. J./Vink, D. (2011): Looking beyond credit ratings: Factors investors consider in pricing European asset-backed securities. Forthcoming European Financial Management. FCIC (2010): Credit derivatives and mortgage-related credit derivatives. Staff report, Finan-cial Crisis Inquiry Commission, June 29, 2010. FCIC (2011): The financial crisis inquiry report. Financial Crisis Inquiry Commission, Janu-ary 2011. Firla-Cuchra, M. (2005): Explaining launch spreads on structured bonds. Working paper, Ox-ford. Firla-Cuchra, M./Jenkinson, T. (2005): Why are securitization issues tranched? Working pa-per. Oxford 2005. Goodman, L./Li, S./Lucas, D./Zimmerman, T./Fabozzi, F. (2008): Subprime Mortgage Credit Derivatives, John Wiley & Sons, New Jersey 2008. Hamerle, A./Liebig, T./Schropp, H.-J. (2009): Systematic risk of CDOs and CDO arbitrage. Deutsche Bundesbank Discussion Paper No. 13. Frankfurt 2009. Keys, B. J./Mukherjee, T./Seru, A./Vig, V. (2010): Did securitization lead to lax screening? Evidence from subprime loans. In: Quarterly Journal of Economics 125, 307–362. Krahnen, J. P./Wilde, C. (2009): CDOs and systematic risk: Why bond ratings are inadequate. Working paper. Frankfurt 2009.
18
Mählmann, T. (2010): The pricing of ABS-CDOs: More than just ratings? Working paper. Ingolstadt 2010. Mählmann, T. (2011): Equity friendly or noteholder friendly? The role of collateral asset managers in the collapse of the market for ABS-CDOs. Working paper. Ingolstadt 2011. Magnetar (2010a): Magnetar investor letter, April 19, 2010. Available at http://www.propublica.org/documents/item/magnetar-letter-to-investors-about-propublica-article Magnetar (2010b): Magnetar’s responses to our questions, April 6, 2010. Available at http://www.propublica.org/documents/item/magnetars-responses-to-our-questions Naked Capitalism (2010): Magnetar deal list by banker. Available at http://www.scribd.com/doc/30165229/Magnetar-Deal-List-By-Banker. Ng, S./Mollenkamp, C. (2008): A fund behind astronomical losses. The Wall Street Journal, January 14, 2008. Papke, L. E./Wooldridge, J. M. (1996): Econometric methods for fractional response variables with an application to 401(k) plan participation rates. In: Journal of Applied Econometrics 11, 619–632. SEC (2011): J.P. Morgan to pay $153.6 million to settle SEC charges of misleading investors in CDO tied to U.S. housing market. U.S. Securities and Exchange Commission press release, June 21, 2011. Available at http://www.sec.gov/news/press/2011/2011-131.htm Standard & Poor’s (2011): Cash flow and hybrid CDO event of default notices received as of Feb. 22, 2011. Available at http://www.standardandpoors.com/ratings/articles/en/us/?assetID=1245294151293. Titman, S./Tsyplakov, S. (2010): Originator performance, CMBS structures, and the risk of commercial mortgages. In: Review of Financial Studies 23, 3558-3594.

19
-1200
-1000
-800
-600
-400
-200
0
200
400
600
12/31/2005 6/30/2006 12/21/2006 6/30/2007 12/31/2007
$ M
illio
ns
Long Equity Short Mezzanine
Figure 1: Second quartile hedge funds’ average long/short positions in CDO tranches. Many of the long/short positions described in this graph occurred within the same hedge fund, often as part of trading strategies such as capital structure arbitrage. “Second quartile” refers to the quartile of hedge funds with the second highest amount of assets under management (AUM). “Mezzanine” refers to lower-rated tranches still considered investment-grade. Note that because the FCIC was able to survey only hedge funds still in existence, the figures are subject to survivorship bias. That is, funds that fully liquidated or closed may have purchased substantial “long only” positions in mortgage-related securities. Source: FCIC survey of hedge funds
Buying $100 ofequity tranche:
Return 20% p.a.
Buying $230 ofCDS protection:
Costs $5 p.a.Senior
Mezzanine
Equity
A: no default
20 – 5 = $15 p.a.
C: default of equity anddebt tranches
230 – 5 – 100 = $125
B: default of equitytranche
–100 – 5 = $ –105
3 possible scenarios
RMBS-CDO Magnetar Trade
Figure 2: Illustrative presentation of the Magnetar trade.

20
Deal legalname Closing date Rated liability
balance ($ Mio.) Lead underwriter Collateral manager EOD date
1 Orion 2006-1 Ltd. 26/05/2006 1300.00 Calyon NIB Capital 15/06/2010 2 Dorado CDO Ltd.* 01/06/2006 - Merrill Lynch Harding Advisory - 3 Cetus ABS CDO 2006-1 Ltd. 21/07/2006 1000.00 Citigroup GSC Partners 10/04/2008 4 ACA Aquarius 2006-1 Ltd. 12/09/2006 2000.00 UBS ACA Management 13/05/2008 5 Octans CDO I Ltd. 26/09/2006 1504.00 Merrill Lynch Harding Advisory 03/04/2008 6 Cetus ABS CDO 2006-2 Ltd. 27/09/2006 300.00 Citigroup GSC Partners 12/03/2008 7 Pyxis ABS CDO 2006-1 Ltd. 03/10/2006 1500.00 Calyon Putnam Advisory 04/12/2008 8 Octans II CDO Ltd. 12/10/2006 1575.00 Wachovia Harding Advisory 08/05/2008 9 Libra CDO Ltd. 17/10/2006 1565.40 Lehman Brothers Lehman Brothers Asset Mgmt. 30/04/2008
10 Scorpius CDO Ltd. 26/10/2006 1484.50 Merill Lynch Strategos Capital Management 12/02/2008 11 Vertical Virgo 2006-1 Ltd. 31/10/2006 2095.00 UBS Vertical Capital 08/09/2008 12 Carina CDO Ltd. 01/11/2006 1490.68 Deutsche Bank State Street Global Advisors 26/10/2007 13 Cetus ABS CDO 2006-4 Ltd. 15/11/2006 1470.00 Citigroup GSC Partners 05/11/2007 14 MKP Vela CBO Ltd. 16/11/2006 1500.00 Lehman Brothers MKP Capital Management 01/05/2008 15 Cetus ABS CDO 2006-3 Ltd. 28/11/2006 1232.50 Calyon GSC Partners 07/12/2007 16 Lacerta ABS CDO 2006-1 Ltd. 29/11/2006 600.00 Citigroup Harding Advisory 07/02/2008 17 Octans III CDO Ltd. 06/12/2006 280.00 Citigroup Harding Advisory 04/12/2007 18 Orion 2006-2 Ltd. 07/12/2006 1485.00 Calyon NIB Capital 06/11/2007 19 Auriga CDO Ltd. 20/12/2006 1510.45 Merrill Lynch 250 Capital/Merrill Lynch 13/02/2008 20 Draco 2007-1 Ltd. 22/02/2007 2000.00 UBS Declaration Mgmt. & Research 13/02/2008 21 Norma CDO I Ltd. 01/03/2007 1500.00 Merrill Lynch NIR Capital Management 10/03/2008 22 Pyxis ABS CDO 2007-1 Ltd. 06/03/2007 1489.00 Lehman Brothers Putnam Advisory 01/02/2008 23 Octonion I CDO Ltd.* 06/03/2007 990.25 Citigroup Harding Advisory 08/02/2008 24 Volans Funding 2007-1 Ltd. 14/03/2007 1062.00 Calyon Vero Capital Management 08/01/2008 25 Sagittarius CDO I Ltd. 15/03/2007 957.00 Wachovia Structured Asset Investors 06/11/2007 26 Tigris CDO 2007-1 Ltd. 15/03/2007 741.00 Mizuho Harding Advisory 25/01/2008 27 Corona Borealis CDO Ltd.* 24/04/2007 1455.50 Lehman Brothers New York Life Investment Mgmt. 01/02/2008 28 Squared CDO 2007-1 Ltd. 11/05/2007 1088.00 JP Morgan GSC Partners 18/01/2008 29 Delphinus CDO 2007-1 Ltd. 19/07/2007 947.00 Mizuho Delaware Asset Management 04/01/2008
Table 1: Magnetar-sponsored deals.
This table presents basic information for the 29 Magnetar-sponsored deals as identified by Bernstein et al. (2010) and Naked Capitalism (2010). The grey-shaded rows correspond to the 14 deals for which information is available in BCL (as of August 2010). Information on the nominal balances of rated li-abilities (excluding unrated tranches) at origination and on Event of Default (EOD) dates is obtained from Standard & Poor’s (2011). A deal suffers an EOD whenever it misses interest payments on a non-payment-in-kind tranche or there is a breach of an overcollateralization (OC) test trigger. * denotes the three deals that are mentioned only by the finance blog Naked Capitalism and not by ProPublica/Bernstein et al.
21
Non-Magnetar deals Magnetar deals
p-value (t-test)
Panel A: Deal characteristics (at origination) Deal size ($ Mio.) 1018.69 (261) 1372.02 (14) 0.001 No. collateral assets 106.03 (261) 87.07 (14) 0.218 Equity share (%) 3.52 (260) 3.74 (14) 0.671 Equity amount ($ Mio.) 24.43 (260) 51.57 (14) 0.001 Fraction AAA (%) 68.18 (261) 36.86 (14) 0.004 Original deal rating 2.07 (261) 3.38 (14) 0.002 Current deal rating 16.89 (261) 16.31 (14) 0.704 Average current collateral rating 17.86 (258) 20.25 (14) 0.000
Panel B: Current (as of June/July 2010) asset fractions and concentration ratios (%) HEL 32.94 (261) 34.00 (14) 0.849 RMBS 14.87 (261) 3.07 (14) 0.000 CMBS 11.99 (261) 8.29 (14) 0.515 CDO 14.61 (261) 10.43 (14) 0.542 OTHER 25.62 (261) 44.14 (14) 0.021 Synthetic 18.93 (261) 43.07 (14) 0.005 CR5_issuer 35.72 (261) 46.06 (14) 0.126 CR5_servicer 44.17 (185) 29.70 (12) 0.001
Panel C: Current (as of June/July 2010) collateral asset default rates (%) Overall default rate – by nominal amount 59.83 (261) 88.41 (14) 0.000 Overall default rate – by number of assets 61.75 (261) 83.70 (14) 0.000 HEL 80.10 (176) 97.98 (12) 0.000 RMBS 55.43 (143) 100.00 (2) 0.000 CMBS 28.09 (109) 48.25 (6) 0.248 CDO 70.19 (176) 80.00 (10) 0.487 OTHER 63.42 (207) 86.97 (12) 0.016
Table 2: Deal and collateral pool characteristics for non-Magnetar and Magnetar deals.
This table reports means of selected deal and collateral pool characteristics for deals sponsored by Magnetar and all remaining deals originated over the period 2006-2007. For each characteristic, the number of deals with available information is given in parentheses. Deal size equals the principal amount of all of a deal’s tranches. Equity share denotes the size of the most subordinated tranche as a percent of the transaction. Fraction AAA includes the par balance of the unrated tranches when calculating the % of the deal balance rated AAA. Deal ratings are constructed by weighting the corresponding (average) tranche ratings by their principal amounts. The weighted average collateral rating is constructed by weighting the average numerical collateral asset ratings by their principal amounts. Ratings were converted to a point scale were AAA corresponds to 1 and then each rating notch corresponds to 1 point more (i.e., AA+ is 2, AA is 3 and so on). Hence, higher numbers reflect more default risk. HEL – home equity loans (includes all RMBS less than prime), RMBS – residential mortgage-backed securities (by prime borrowers), CMBS – commercial mortgage-backed securi-ties, CDO – tranches from other CDOs, OTHER – other asset-backed securities (including auto-loans, credit-cards, etc.). CR5_issuer and CR5_servicer denote the con-centration ratios for the largest 5 collateral issuers and servicers, respectively, in each pool. Asset type default rates are based on nominal amounts.

22
Default rate - amount Default rate - assets Average collateral rating Dependent variable
I II I II I II
Magnetar 24.406*** (6.733)
20.548*** (6.357)
18.669** (7.312)
17.260** (6.907)
1.882*** (0.446)
1.827*** (0.526)
Market share 2.609*** (0.681)
1.931*** (0.674)
2.800*** (0.700)
1.957*** (0.727)
0.197*** (0.056)
0.146*** (0.054)
Synthetic fraction 0.303*** (0.089)
0.332*** (0.106)
0.235*** (0.087)
0.281*** (0.101)
0.025*** (0.007)
0.032*** (0.007)
Original deal rating -10.144*** (2.469)
-9.574*** (3.279)
-10.137*** (2.597)
-10.564*** (3.191)
-0.626*** (0.238)
-0.844*** (0.286)
No. tranches -3.148*** (0.873)
-3.891*** (0.797)
-2.954*** (0.921)
-4.073*** (0.826)
-0.243*** (0.087)
-0.326*** (0.102)
No. assets -0.147*** (0.026)
-0.159*** (0.030)
-0.135*** (0.028)
-0.153*** (0.032)
-0.013*** (0.002)
-0.016*** (0.002)
Issue quarter FE Yes Yes Yes Yes Yes Yes Trustee FE Yes Yes Yes Underwriter FE Yes Yes Yes R2 0.380 0.501 0.362 0.487 0.327 0.508 N 236 236 236 236 234 234
Table 3: Deal performance. This table reports coefficients from OLS regressions. The sample is based on all ABS-CDOs originated between 2006 and mid 2007 for which the required information is in the BCL database. The dependent variable is the collateral default rate (by amount and by asset number), and the weighted average collateral rating, constructed by weighting the average numerical collateral asset ratings by their principal amounts, in the remaining columns. Ratings were converted to a point scale were AAA corresponds to 1 and then each rating notch corresponds to 1 point more (i.e., AA+ is 2, AA is 3 and so on). Hence, higher numbers reflect more default risk. The dummy Magnetar takes on the value 1 for deals sponsored by the hedge fund Magnetar. Market share is calculated for each manager as the collateral par amount of deals managed in a given year over the total collateral par amount of all deals originated in that year. This variable is lagged by one year. Synthetic denotes the collateral par percentage of synthetic (i.e. CDS) assets, and no. assets/tranches gives the number of collateral assets and tranches issued, respectively. Deal ratings are constructed by weighting the corresponding (average) tranche ratings by their principal amounts. Clustered standard errors (in parentheses) are robust standard er-rors adjusted for clustering at the underwriter-issue quarter level. ***, **, and * denote significance at the 1%, 5%, and 10% levels, respectively.

23
Dependent variable: collateral asset default rate (in %)
Asset type HEL CDO OTHER
Magnetar 18.144** (7.833)
14.675 (22.091)
27.708** (10.833)
Market share 1.195* (0.706)
3.183*** (1.086)
1.175 (1.081)
Synthetic fraction 0.262** (0.105)
0.256 (0.212)
0.586*** (0.117)
Original deal rating -5.320 (3.220)
-13.474** (6.682)
-15.756*** (3.560)
No. tranches -0.394 (2.008)
-4.977*** (1.491)
-3.096** (1.488)
No. assets -0.074** (0.030)
-0.089 (0.067)
-0.056 (0.043)
Issue quarter FE Yes Yes Yes Trustee FE Yes Yes Yes Underwriter FE Yes Yes Yes R2 0.345 0.252 0.422 N Magnetar 12 10 12 N 171 172 194 Table 4: Collateral pool asset type default rates. This table reports coefficients from OLS regressions of asset type-specific collateral default rates, measured as of June/July 2010. For definitions of asset types see Table 2, and Table 3 for defini-tions of independent variables. Asset-specific default rates are only calculated for deals that con-tain the asset in question as collateral and regressions are run only if there are at least 10 Magnetar deals. Clustered standard errors (in parentheses) are robust standard errors adjusted for clustering at the underwriter-issue quarter level. ***, **, and * denote significance at the 1%, 5%, and 10% levels, respectively.

24
Dependent variable: ln(Spread) Pooled AAA Non-AAA I II I II I II
Magnetar 0.088 (0.069)
0.090 (0.090)
0.037 (0.065)
0.207** (0.085)
0.052 (0.086)
-0.046 (0.125)
Market share 0.009 (0.007)
0.008 (0.009)
0.004 (0.007)
-0.003 (0.009)
0.013 (0.009)
0.013 (0.010)
Ln(Tranche balance) -0.126*** (0.017)
-0.133*** (0.018)
-0.159*** (0.025)
-0.156*** (0.027)
-0.010 (0.026)
-0.025 (0.023)
% Subordination -0.006*** (0.001)
-0.006*** (0.001)
-0.006*** (0.001)
-0.007*** (0.001)
-0.005** (0.002)
-0.004 (0.002)
No. assets -0.001*** (<0.001)
-0.001*** (<0.001)
-0.001** (<0.001)
-0.001** (<0.001)
-0.001** (<0.001)
-0.001*** (<0.001)
No. tranches -0.026** (0.012)
-0.024* (0.013)
-0.001 (0.009)
0.010 (0.013)
-0.046*** (0.017)
-0.043** (0.018)
Synthetic fraction 0.003*** (0.001)
0.003*** (0.001)
0.003*** (0.001)
0.002*** (0.001)
0.001 (0.001)
0.002** (0.001)
Ln(Maturity) 0.257* (0.152)
0.290** (0.139)
0.319** (0.143)
0.315** (0.143)
0.088 (0.179)
0.247 (0.153)
Issue quarter FE Yes Yes Yes Rating FE Yes Yes Yes Yes Trustee FE Yes Yes Yes Yes Yes Yes Underwriter FE Yes Yes Yes Underwriter*quarter FE Yes Yes Yes R2 0.909 0.921 0.508 0.543 0.890 0.913 N 1470 1470 578 578 892 892 Table 5: Tranche spread at issuance. This table reports coefficients from OLS regressions of tranche yield spreads, i.e. the spread over the index rate (the 3- (or 1-)month LIBOR for 69% (or 30%) of the tranches). The effective subordination percentage of a security is the percentage of the total collateral principal which is subordinate to the security in question. For definitions of the other independent variables see Table 3. Clustered standard errors (in parentheses) are robust standard errors adjusted for clustering at the deal level. ***, **, and * denote significance at the 1%, 5%, and 10% levels, respectively.

25
Dependent variable: Tranche rating
Specification OLS (I) OLS (II) OLS (III) Ordered Probit (IV)
Ordered Probit (V)
Magnetar 0.725** (0.359)
0.870*** (0.340)
1.069*** (0.397)
0.508*** (0.192)
0.573*** (0.204)
Market share -0.045 (0.028)
-0.016 (0.030)
0.022 (0.025)
-0.034* (0.018)
-0.015 (0.022)
Ln(Tranche balance) -1.450*** (0.084)
-1.471*** (0.082)
-1.438*** (0.086)
-0.892*** (0.084)
-0.998*** (0.092)
% Subordination -0.056*** (0.007)
-0.057*** (0.006)
-0.067*** (0.008)
-0.036*** (0.007)
-0.042*** (0.007)
No. assets -0.004*** (0.001)
-0.002* (0.001)
-0.003** (0.001)
-0.003*** (0.001)
-0.003*** (0.001)
No. tranches 0.147*** (0.045)
0.151*** (0.046)
0.140*** (0.052)
0.056** (0.026)
0.062** (0.030)
Synthetic fraction 0.017*** (0.003)
0.019*** (0.004)
0.015*** (0.004)
0.011*** (0.002)
0.014*** (0.003)
Ln(Maturity) -0.711* (0.415)
-0.306 (0.247)
-0.203 (0.309)
-0.567** (0.275)
-0.311 (0.205)
Issue quarter FE Yes Yes Yes Yes Trustee FE Yes Yes Yes Underwriter FE Yes Yes Underwriter*quarter FE Yes
R2/Pseudo R2 0.534 0.545 0.555 0.240 0.267 N 1526 1521 1521 1526 1521
Table 6: Initial tranche ratings.
This table reports coefficients from OLS and ordered probit regressions of tranche ratings. Average tranche ratings are coded on a point scale with higher numbers denoting greater default risk. For definitions of independent variables see Table 3 and 5. Clustered standard errors (in parentheses) are robust standard errors adjusted for clustering at the deal level. ***, **, and * denote significance at the 1%, 5%, and 10% levels, respectively.

26
Dependent variable: time to EOD date
All Magnetar deals Reduced sample
Regression model (I) (II) (III) (IV)
Magnetar 4.028*** (0.754)
3.510*** (0.988)
6.219*** (1.931)
6.847*** (3.290)
Market share 1.059* (0.036)
1.016 (0.058)
Synthetic fraction 1.004 (0.004)
1.000 (0.005)
Original deal rating 0.676*** (0.098)
0.675*** (0.092)
No. tranches 0.896** (0.048)
0.827*** (0.040)
No. assets 0.996** (0.001)
0.996** (0.002)
Manager-level shared frailty
No Yes No Yes
Frailty variance 0.693*** (0.208)
0.568*** (0.194)
Issue quarter FE Yes Yes Yes Yes
Trustee FE No No Yes Yes
N 267 263 236 236 Table 7: Event of Default analysis.
This table reports Event of Default (EOD) hazard ratios from Cox proportional hazard models. EOD dates are ob-tained from Standard & Poor’s (2011). A deal suffers an EOD whenever it misses interest payments on a non-payment-in-kind tranche or whenever there is a breach of an overcollateralization (OC) test trigger. All deals with-out an EOD until December 2010 are (right) censored. The sample for the first two columns includes all 28 Mag-netar deals, and the sample for the remaining two is restricted to the 14 deals with full information in BCL (see Ta-ble 1). Models (2) and (4) include a gamma distributed manager-level frailty to account for unobserved within-manager correlation. For definition of independent variables see Table 3. In models (1) and (3), standard errors (in parentheses) are robust standard errors adjusted for clustering at the underwriter level. ***, **, and * denote signifi-cance at the 1%, 5%, and 10% levels, respectively.