examining the effect feature election on …aircconline.com/ijdkp/v5n6/5615ijdkp02.pdf · identify...
TRANSCRIPT

International Journal of Data Mining & Knowledge Management Process (IJDKP) Vol.5, No.6, November 2015
DOI : 10.5121/ijdkp.2015.5602 13
EXAMINING THE EFFECT OF FEATURE
SELECTION ON IMPROVING PATIENT
DETERIORATION PREDICTION
Noura AlNuaimi, Mohammad M Masud and Farhan Mohammed
College of Information Technology, United Arab Emirates University, Al-Ain, UAE
ABSTRACT
Large amount of heterogeneous medical data is generated every day in various healthcare organizations.
Those data could derive insights for improving monitoring and care delivery in the Intensive Care Unit.
Conversely, these data presents a challenge in reducing this amount of data without information loss.
Dimension reduction is considered the most popular approach for reducing data size and also to reduce
noise and redundancies in data. In this paper, we are investigate the effect of the average laboratory test
value and number of total laboratory in predicting patient deterioration in the Intensive Care Unit, where
we consider laboratory tests as features. Choosing a subset of features would mean choosing the most
important lab tests to perform. Thus, our approach uses state-of-the-art feature selection to identify the
most discriminative attributes, where we would have a better understanding of patient deterioration
problem. If the number of tests can be reduced by identifying the most important tests, then we could also
identify the redundant tests. By omitting the redundant tests, observation time could be reduced and early
treatment could be provided to avoid the risk. Additionally, unnecessary monetary cost would be avoided.
We apply our technique on the publicly available MIMIC-II database and show the effectiveness of the
feature selection. We also provide a detailed analysis of the best features identified by our approach.
KEYWORDS
Data mining; patient deterioration; ICU; lab test; feature selection; learning algorithm
1. INTRODUCTION
The last decade has seen huge advances in the amount of data that is generated and collected in
the modern intensive care units (ICUs), as well as the technologies used to analyse and
understand it. ICUs are specialist hospital wards, where they provide intensive care (treatment
and monitoring) for patients in seriously ill and their condition changes often. ICUs are
considered a critical environment where the decision needs to be carefully taken. These data
could be used with the help of intelligent systems, such as data analytics and decision support
systems, to determine which patients are at an increased risk of death. Making such decision
could allow healthcare professionals to take action at an early stages. For instance, patients in the
ICUs have a wide variety of medical laboratory tests on different body fluids (E.g. blood and
urine). The natures of medical lab tests and how often these tests are performed depend on why
the patient is in ICU and how stable the patient is.
Medical professionals may order laboratory tests to confirm a diagnosis or monitor patients’
health. However, deciding which test is likely to contribute information gain is a challenge.

International Journal of Data Mining & Knowledge Management Process (IJDKP) Vol.5, No.6, November 2015
14
Recent studies have demonstrated that frequent laboratory testing does not necessarily relate to
better outcomes [1].
Dimension reduction would be the first solution to eliminate duplicate, useless and irrelevant
features. This is typical alternative done while solving machine learning problems to select the
most discriminative attributes. In this paper, our goal is to propose an efficient mining technique
to reduce the observation time in ICUs by predicting patient deterioration in its early stages
through data analytics. Our proposed technique has several contributions. First, we use the lab
test results to predict patient deterioration. To the best of our knowledge, this is the first work that
primarily uses medical lab tests to predict patient deterioration. Lab test results have a crucial role
in medical decision making. Second, we identify most important medical lab tests using state-of-
the-art feature-selection techniques without using any informed domain knowledge. Finally, our
approach helps reduce redundant medical lab tests. Thus, healthcare professionals could focus on
the most important lab tests to assist them, which would save not only costs but also valuable
time in recovering the patient from a critical condition.
The paper is organised as follows. Section 2 presents the related work of predicting ICU death,
Section 3 gives background on data mining, Section 4 illustrates our proposed approach, Section
5 summarises the MIMIC II dataset, Section 6 illustrates the experiment’s work, Section 7
discusses the findings, and finally, the conclusion of this research is presented in Section 8.
2. LITERATURE REVIEW
This section reviews related works for predicting ICU death or the deterioration of ICU patients,
where ICUs workflow is filled with large quantities of data that need more analysis. Most of
efforts here are indented to identify redundancy or overlapping between medical laboratory tests.
ICUs like any other domain, need regular improvement at their processes and frequent requested
medical laboratory tests. In this section, we highlight some similarities and differences between
some of the related works and the proposed work.
In [2], the authors developed an integrated data-mining approach to give early deterioration
warnings for patients under real-time monitoring in the ICU and real-time data sensing (RDS).
They synthesised a large feature set that included first- and second-order time-series features,
detrended fluctuation analysis (DFA), spectral analysis, approximative entropy and cross-signal
features. Then, they systematically applied and evaluated a series of established data-mining
methods, including forward feature selection, linear and nonlinear classification algorithms, and
exploratory under sampling for class imbalance. In our work, we are using the same dataset.
However, we are using only the medical lab tests. Also, in our approach, we depend on feature
selection to reduce the size of the dataset.
A health-data search engine was developed in [3] that supported predictions based on the
summarised clusters patient types which claimed that it was better than predictions based on the
non-summarised original data. In our work, we use only the medical lab tests, and we attempt to
highlight the most important medical labs.
Liu et al. [4] investigated the minimum number of features that was required for a given learning
machine to achieve "satisfactory" performance. In their work, an ad hoc heuristic method based
on feature-ranking algorithms was used to perform the experiment on six datasets. They found

International Journal of Data Mining & Knowledge Management Process (IJDKP) Vol.5, No.6, November 2015
15
that the heuristic method is useful in finding the critical feature dimension for large datasets. In
our work, we also use the ranking to rank the most useful features. However, we attempt to
investigate the percentage of selected features that would be enough to have moderate model
accuracy.
Cismondi et al. [1] proposed reducing unnecessary lab testing in the ICU. Their approach
designed on predicting when a proposed future laboratory test may likely to contribute
information gain and thereby influence clinical management in patients with gastrointestinal
bleeding. At their experiment, there were 11 input variables in total. Ten of these were derived
from bedside monitor trends heart rate, oxygen saturation, respiratory rate, temperature, blood
pressure, and urine collections, as well as infusion products and transfusions. The final input
variable was a previous value from one of the eight laboratory tests being predicted: calcium,
PTT, hematocrit, fibrinogen, lactate, platelets, INR and hemoglobin. The outcome for each
laboratory test was a binary framework defining whether a laboratory test result contributed
information gain or not. Predictive modelling was applied to recognize unnecessary laboratory
tests in a real world ICU database extract comprising 746 patients with gastrointestinal bleeding.
This work is the closest one to our research; they have the same objective of reducing
unnecessary laboratory tests. However, they only focus on gastrointestinal bleeding. In our work,
we are targeting all cases in the ICUs. Besides that, they had constraints on the medical
laboratory tests, where they specify eight laboratory tests to be predicted.
Similarly Joon Lee and David M. Maslove [5] used information theory to identify the
unnecessary laboratory testing and bloodwork. They investigated the information content of 11
laboratory test results from 29,149 adult ICU admissions in the MIMIC II database. They used
Information theory to count the expected amount of redundant information both between
laboratory values from the same ICU day, and between consecutive ICU days. They found out
that most laboratory values showed a decreasing trend over time in the expected amount of novel
information they contained. Platelet, blood urea nitrogen (BUN), and creatinine measurements
exhibited the most amount of redundant information on days 2 and 3 compared to the previous
day. The creatinine-BUN and sodium-chloride pairs had the most redundancy. In our work, we
are not investigating any specific laboratory values, but we aim to identify the most critical
laboratory tests that need more attention. Also, in our case we are not depending on any domain
knowledge and without any intervention from medical experts.
Likewise the previous works, Hsieh et al. [6] worked on reducing unnecessary laboratory tests in
the ICUs. They proposed a computational-intelligence-based model to predict the survival rate of
critically ill patients who were admitted to an intensive care unit (ICU). At their research, the
prediction input variables were based on the first 24 hours admission physiological data of ICU
patients to forecast whether the final outcome was survival or not. Their prediction model was
based on a particle swarm optimization (PSO)-based Fuzzy Hyper-Rectangular Composite
Neural Network (PFHRCNN) that integrated three computational intelligence tools including
hyper-rectangular composite neural networks, fuzzy systems and PSO. In our work, we design
our experiment on state-of-the-art feature-selection techniques, where no constraint in the input
variables.

International Journal of Data Mining & Knowledge Management Process (IJDKP) Vol.5, No.6, November 2015
16
3. DATA MINING BACKGROUND
ICUs, like other healthcare sectors, is facing the need for analysing large amounts of data. Data
mining represents great potential benefits for the ICUs to enable systematically use data and
analytics to identify best practices that improve care and reduce costs. Clinical data mining is the
application of data mining techniques using clinical data. Data mining with clinical data has three
objectives: understanding the clinical data, assist healthcare professionals, and develop a data
analysis methodology suitable for medical data [7].
Data mining is the analysis step of knowledge discovery. It is about the ‘extraction of interesting
(non-trivial, implicit, previously unknown, and potentially useful) patterns or knowledge from
huge amount of data [10]’. When mining massive datasets, two of the most common, important
and immediate problems are sampling and feature selection. Appropriate sampling and feature
selection contribute to reducing the size of the dataset while obtaining satisfactory results in
model building [4].
3.1. Feature Selection
In machine learning, feature selection or attribute selection is the process of selecting a subset of
relevant features (variables, predictors) for use in model construction. Feature selection
techniques are used (a) to avoid overfitting and improve model performance, i.e. predict
performance in the case of supervised classification and better cluster detection in the case of
clustering, (b) to provide faster and more cost-effective models and (c) to gain deeper insight into
the underlying processes that generated the data. In the context of classification, feature selection
techniques can be organized into three categories, depending on how they perform the feature
selection search to build the classification model: filter methods, wrapper methods and embedded
methods, presented in table 1 [8] [9]:
1) Filter Methods are based on applying a statistical measure to assign a scoring to each feature.
Then, features are ranked by score and either selected or removed from the dataset. The
methods are often univariate and consider the feature independently or with regard to the
dependent variable.
2) Wrapper Methods are based on the selection of a set of features as a search problem, where
different combinations are prepared, evaluated and compared to other combinations. A
predictive model is used to evaluate a combination of features and assign a score based on
model accuracy.
3) Embedded Methods are based on learning which features most contribute to the accuracy of
the model while the model is being created.
Table 1: Feature selection categories
Model Search Advantages Disadvantages
Filter Fast
Scalable
Independent of the classifier
Ignores feature dependencies
Ignores interaction with the classifier
Wrapper Simple
Interacts with the classifier
Models feature decencies
Less computational
Risk for overfitting
More prone than randomized algorithms
Classifier-dependent selection

International Journal of Data Mining & Knowledge Management Process (IJDKP) Vol.5, No.6, November 2015
17
Embedded Interacts with the classifier
More computational
Models feature dependencies
Classifier-dependent selection
3.2. Data Classification Techniques
Classification is a pattern-recognition task that has applications in a broad range of fields. It
requires the construction of a model that approximates the relationship between input features
and output categories [10]. Some of the most popular techniques are discussed here in brief, all of
which are used in our work.
1) The Naïve Bayes classifier is based on applying Bayes’ theorem with strong independence
assumptions between the features. As one of its main features, the Naïve Bayes classifier is
easy to implement because it requires a small amount of training data in order to estimate the
parameters, and good results can be found in most cases. However, it has class conditional
independence, meaning it causes losses of accuracy and dependency [11].
2) Sequential minimal optimization (SMO) is an algorithm for efficiently solving the
optimization problem which arises during the training of support vector machines [12]. The
amount of memory required for SMO is linear in the training set size, which allows SMO to
handle very large training sets [13].
3) The ZeroR classifier simply predicts the majority category, which relies on the target and
ignores all predictors. Although there is no predictability power in ZeroR, it is useful for
determining a baseline performance as a benchmark for other classification methods [12].
4) A decision tree (J48) is a fast algorithm to train and generally gives good results. Its output is
human readable, therefore one can see if it makes sense. It has tree visualizers to aid
understanding. It is among the most used data mining algorithms. The decision tree partitions
the input space of a data set into mutually exclusive regions, each of which is assigned a
label, a value or an action to characterize its data points [12].
5) A RandomForest is a combination of tree predictors such that each tree depends on the values
of a random vector sampled independently and with the same distribution for all trees in the
forest [14].
4. PROPOSED APPROACH
In this section we introduce our approach for the data mining technique for predicting ICU
patient deterioration. Figure 1 shows the architecture of the proposed technique.
Figure 1: Architecture of the proposed approach.

International Journal of Data Mining & Knowledge Management Process (IJDKP) Vol.5, No.6, November 2015
18
The data are collected from the database of ICU patients (step 1). Then the data are integrated,
cleaned and relevant features are extracted (step 2). After that, feature selection or dimensionality
reduction techniques are applied to obtain the best set of features and reduce the data dimension
(step 3). Then the prediction model is learned using a machine learning approach (step 4). When
a new patient is admitted to the CPU, the patient’s data are collected incrementally (step 5). The
patient data are evaluated by the prediction model (step 6) to predict the possibility of
deterioration of the patient, and warnings are generated accordingly. Each of these steps is
summarized here, and more details of the dataset are given in Section 5.
1. ICU Patient Data: The details of the data and the collection process are discussed in
Section 5.
2. Preprocessing: At the preprocessing stage, we used two different datasets. These datasets
were generated from a Labevents table. The first dataset contained the average value of
applied medical tests, and the second contained the total number of times for each test
was applied.
3. Feature Selection / Dimension Reduction: attribute selection is the process of selecting a
subset of relevant features (variables, predictors) for use in model construction. The goal
here is to reduce the attributes so medical professional can identify the most important
medical lab tests used by reducing the redundant tests. In our work, we select filter
methods because they are moderately robust against the overfitting problem, as follows:
a. Attribute evaluator: InfoGrainAttributeEval
b. Search method: Ranker
c. Attribute selection mode: use full training set
4. Learning: In our experiment we use a classification technique and five of the most
popular classifier techniques: Naïve Bayes classifier, Support vector machine (SVM),
ZeroR classifier, decision tree (J48) and RandomForest. We use different types of
machine learning order to avoid random results.
5. Model: The developed model aims to predict ICU patient deterioration by mining lab test
results. Thus, observation time can be reduced in the ICUs and more actions can be taken
in the early stages.
6. Prediction: After each new test result, medication event, etc., the patient data are
preprocessed and features are extracted to supply to the prediction model. The model
predicts the probability of deterioration for the patient. This probability may change
when new data (e.g. more test results) are accumulated and applied to the model. When
the deterioration probability reaches a certain threshold specified by the healthcare
providers, a warning is generated. This would help the healthcare providers to take
proactive measures to save the patient from getting into a critical or fatal condition.
7. New patient data: When a new patient is admitted to the ICU, all his information is stored
in the database. Some of these are incremental, such as vital sign readings, lab test
results, medication events etc. The data of the patient again go through the preprocessing
and feature extraction phases before they can be applied to the model.
5. MIMIC II DATABASE
The MIMIC-II database is part of the Multiparameter Intelligent Monitoring in Intensive Care
project funded by the National Institute of Biomedical Imaging and Bioengineering at the
Laboratory of Computational Physiology at MIT, which was collected from 2001 to 2008 and
represents 26,870 adult hospital admissions. In our work, we use MIMIC-II version 2.6 because
is more stable than the newer version 3, which is still in the beta phase and needs further work of

International Journal of Data Mining & Knowledge Management Process (IJDKP) Vol.5, No.6, November 2015
19
cleaning, optimizing and testing. MIMIC-II consists of two major components: clinical data and
physiological waveforms.
The MIMIC dataset has three main features: (1) it is public; (2) it has a diverse and very large
population of ICU patients; and (3) it contains high temporal resolution data, including lab
results, electronic documentation, and bedside monitor trends and waveforms[15]. Several works
have used the MIMIC dataset, such as [16], [17] and [18].
In our work, we focus on the clinical data, the LABEVENTS and LABITEMS tables. The
Labevents table contains data of each patient’s ICU stay, as presented in table 2, and table 3
contains descriptions of the lab events. Considering medical lab choice was done because we
wanted to investigate the relationship between medical lab tests and patient deterioration so we
could identify which medical tests have a major effect on clinical decision making. For example,
the following information is about a patient who was staying at the ICU and was given a medical
test. The following information was recorded at that time:
• Subject_ID: 2
• Hadm_ID: 25967
• IcuStay_ID: 3
• ItemID: 50468
• Charttime: 6/15/2806 21:48
• Value: 0.1
• ValueNum: 0.1
• Flag: abnormal
• ValueUOM: K/uL
Table 2: Labevents Table Description
Name Type Null Comment
SUBJECT_ID NUMBER(7) N Foreign key, referring to a unique patient
identifier
HADM_ID NUMBER(7) Y Foreign key, referring to the hospital
admission ID of the patient
ICUSTAY_ID NUMBER(7) Y ICU stay ID
ITEMID NUMBER(7) N Foreign key, referring to an identifier for the
laboratory test name
CHARTTIME TIMESTAMP(6) WITH
TIME ZONE
N The date and time of the test
VALUE VARCHAR2(100) Y The result value of the laboratory test
VALUENUM NUMBER(38) Y The numeric representation of the laboratory
test if the result was numeric
FLAG VARCHAR2(10) Y Flag or annotation on the lab result to
compare the lab result with the previous
or next result
VALUEUOM VARCHAR2(10) Y The units of measurement for the lab result
value

International Journal of Data Mining & Knowledge Management Process (IJDKP) Vol.5, No.6, November 2015
20
Table 3: Labitems Table
Name Type Null Comment
ITEMID NUMBER(7) N Table record unique identifier, the lab item ID
TEST_NAME VARCHAR2(50) N The name of the lab test performed
FLUID VARCHAR2(50) N The fluid on which the test was performed
CATEGORY VARCHAR2(50) N Item category
LOINC_CODE VARCHAR2(7) Y LOINC code for lab item
LOINC_DESCR
IPTION
VARCHAR2(100) Y LOINC description for lab item
5.1. Medical Lab Tests Average Dataset
The dataset was constructed by taking the average test result of each patient for each kind of test
and make it one attribute. Thus one patient would be represented as one instance having 700
attributes, one for each test. If a test was not done, then the value of that attribute would be 0.
For example, the first patient record in the dataset would look like this:
P_ID Avg1 Avg2 ..... Avg700 Dead/Alive
1 5.3 10 0 D
5.2. Total Number of Medical Lab Tests Dataset
The dataset was built by taking the total number of tests taken for each patient for each type of
test and make it one attribute. Then one patient would be represented as one instance having 700
attributes, one for each test. If a test was not done, then the value of that attribute would be 0.
For example, the dataset would look like this:
P_ID Count1 Count2 … Count700 Dead/Alive
1 5 0 1 D
6. EXPERIMENTS
In the experiment section we investigate the effect of feature selection in improving the
prediction of patient deterioration in the ICUs. We consider the lab tests as features. Thus,
choosing a subset of features would mean choosing the most important lab tests to perform. If
the number of tests can be reduced by identifying the most important tests, then we would also
identify the redundant tests.
6.1. Experiment 1: Building a Baseline of the Medical Lab Tests Average
1) Experiment Goal: The goal of this experiment was to investigate the effect of lab testing on
predicting patient deterioration. Usually, medical professionals compare the result of the lab
test with a reference range [19]. If the value is not within this range, the patient may face fatal
consequences. Thus, the patient is kept under observation and the test is repeated again
during a specific period. In our experiment, we investigated the average value of the same
repeated test and, more precisely, how the average value of lab results could assist medical
professionals in evaluating patient status.
Since we dealt with real cases, the only way to assess the quality and characteristics of a data
mining model was through the final status of the patient, i.e. whether the patient survived or

International Journal of Data Mining & Knowledge Management Process (IJDKP) Vol.5, No.6, November 2015
21
not. Thus, our evaluation criterion was how accurately our approach could predict whether
the patient died or not.
2) Building the Dataset: The dataset was constructed by taking the average test result of each
patient for each kind of test and make it one attribute. Thus one patient would be represented
as one instance having 700 attributes, one for each test. If a test was not done, then the value
of that attribute would be 0.
For example, the first patient record in the dataset would look like this:
P_ID Avg1 Avg2 ..... Avg700 Dead/Alive
1 5.3 10 0 D
3) Pre-processing: After building the dataset, some values could not be reported because they
were in text format. We used default values for these types of data. The total number of
attributes was 619 with 2900 instances.
4) Base learners: In our experiment we used five classification algorithms to construct the
model, namely NaiveBayes, SMO, ZeroR, J48 and RandomForest.
5) Evaluation: For a performance measurement, we did a 10-fold cross-validation of the dataset,
and the confusion matrix was obtained to estimate four measures: accuracy, sensitivity,
specificity and F-measure. As a result, RandomForest had the highest accuracy of 77.58%,
followed by SMO with 76.86%, J48 with 75.27%, ZeroR with 70.24% and NavieBayes with
42.96%, as shown in Table 4, Figure 2 and Figure 3. RandomForest and SMO have the same
F-measures. The reason for the best performance by RandomForest is that it works relatively
well when used with high-dimensional data with a redundant/noisy set of features [14].
Table 4: Experiment 1confusion matrix results.
Algorithm Learning Machine
Detailed Accuracy
Acc
ura
cy
Pre
cisi
on
Rec
all
F-M
easu
re
Bayes NavieBayes 42.96% 0.672 0.430 0.404
Functions SMO 76.86 % 0.759 0.769 0.762
Rule ZeroR 70.24 % 0.493 0.702 0.580
Tree J48 75.27% 0.749 0.753 0.751
Tree RandomForest 77.58 % 0.765 0.776 0.762
Figure 2: Experiment 1 accuracy result.

International Journal of Data Mining & Knowledge Management Process (IJDKP) Vol.5, No.6, November 2015
22
Figure 3: Experiment 1 detailed accuracy result.
6.2. Experiment 2: Average Medical Lab Tests Discriminative Attributes
1) Experiment Goal: The goal of this experiment was to select the most discriminative attributes
that can almost describe the model with less number of attributes. In this experiment we were
working to get the most out of the average medical lab tests data, so we would have a better
understanding to patient deterioration problem.
2) Building the Dataset: In this experiment we used the same dataset that we used in experiment
1.
3) Pre-processing: In this stage, we used feature selection to select the most discriminative
attributes. For feature selection, we used weka.attributeSelection.CfsSubsetEval from WEKA
[20].
• Attribute Subset Evaluator: CfsSubsetEval
• Search Method: BestFirst.
• Evaluation mode: evaluate all training data
4) Base learner: Applying CfsSubsetEval reduced the attributes to 26 selected attributes. Now
the goal was to compare the reduced dataset with the baseline experiment result. We used the
same five classification algorithms to construct the model, namely NaiveBayes, SMO,
ZeroR, J48 and RandomForest. Please refer to Table 5.
Table 5: Experiment 2 confusion matrix result.
Algorithm Learning Machine
Detailed Accuracy
Acc
ura
cy
Pre
cisi
on
Rec
all
F-M
easu
re
Bayes NavieBayes 56.24 % 0.774 0.562 0.564
Functions SMO 74.82 % 0.732 0.748 0.717
Rule ZeroR 70.24 % 0.493 0.702 0.580
Tree J48 76.75 % 0.765 0.768 0.766
Tree RandomForest 79.75 % 0.790 0.798 0.789
International Journal of Data Mining & Knowledge Management Process (IJDKP) Vol.5, No.6, November 2015
23
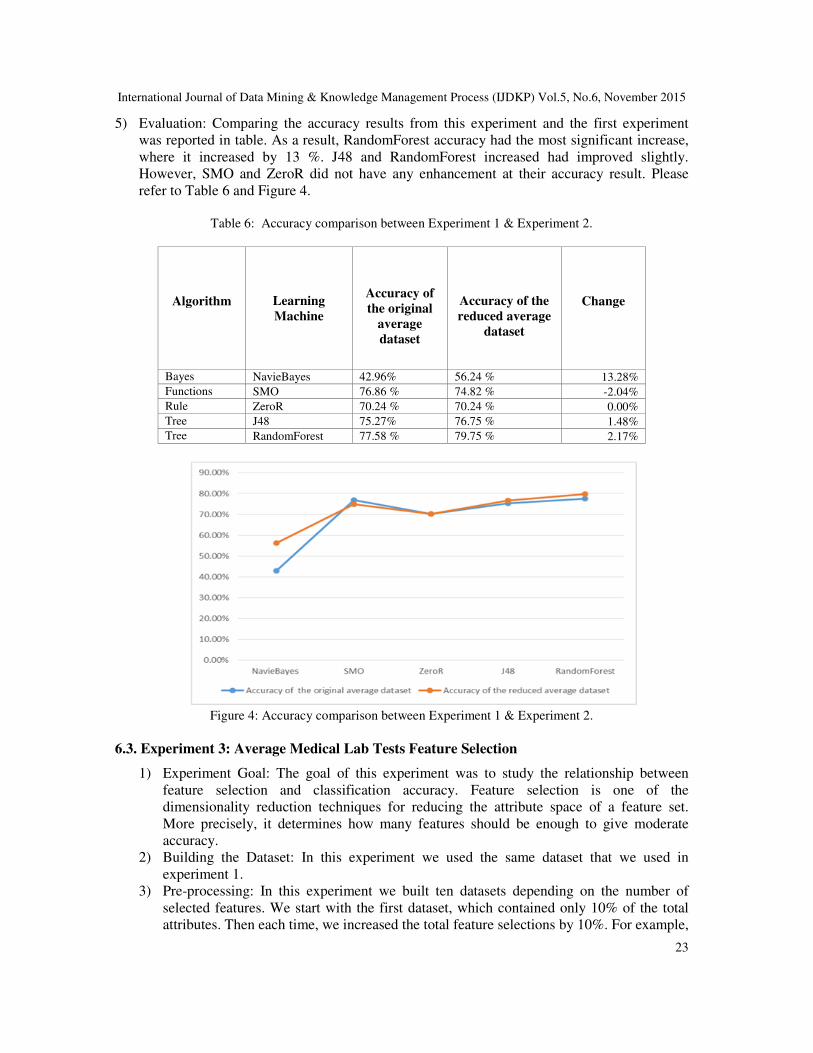
5) Evaluation: Comparing the accuracy results from this experiment and the first experiment
was reported in table. As a result, RandomForest accuracy had the most significant increase,
where it increased by 13 %. J48 and RandomForest increased had improved slightly.
However, SMO and ZeroR did not have any enhancement at their accuracy result. Please
refer to Table 6 and Figure 4.
Table 6: Accuracy comparison between Experiment 1 & Experiment 2.
Algorithm Learning
Machine
Accuracy of
the original
average
dataset
Accuracy of the
reduced average
dataset
Change
Bayes NavieBayes 42.96% 56.24 % 13.28%
Functions SMO 76.86 % 74.82 % -2.04%
Rule ZeroR 70.24 % 70.24 % 0.00%
Tree J48 75.27% 76.75 % 1.48%
Tree RandomForest 77.58 % 79.75 % 2.17%
Figure 4: Accuracy comparison between Experiment 1 & Experiment 2.
6.3. Experiment 3: Average Medical Lab Tests Feature Selection
1) Experiment Goal: The goal of this experiment was to study the relationship between
feature selection and classification accuracy. Feature selection is one of the
dimensionality reduction techniques for reducing the attribute space of a feature set.
More precisely, it determines how many features should be enough to give moderate
accuracy.
2) Building the Dataset: In this experiment we used the same dataset that we used in
experiment 1.
3) Pre-processing: In this experiment we built ten datasets depending on the number of
selected features. We start with the first dataset, which contained only 10% of the total
attributes. Then each time, we increased the total feature selections by 10%. For example,

International Journal of Data Mining & Knowledge Management Process (IJDKP) Vol.5, No.6, November 2015
24
dataset 1 contains 10% of the total attributes, dataset 2 contains 20% of the total
attributes, dataset 3 contains 30% of the total attributes and so on till dataset 10 contains
all 100% of the total attributes.
For feature selection, we use supervised.attribute. InfoGainAttributeEval from WEKA.
This filter is a wrapper for the Weka class that computes the information gain on a class
[20].
• Attribute Subset Evaluator: InfoGainAttributeEval
• Search Method: Ranker.
• Evaluation mode: evaluate all training data
4) Base learner: After generating all of the reduced datasets, we used the J48 algorithm to
construct a model.
5) Evaluation: For each reduced dataset, we applied 10-fold cross-validation for evaluating
the accuracy. Table V shows the results in numbers, and Figure 2 shows them as a chart.
The results indicate that taking only the most related 10% of the total features can give a
75.10% accurate result, which is comparable to the accuracy of the full feature set. This
indicates that not all of the features are required to get the highest accuracy. However,
there are some fluctuations, such as at 20%, the accuracy drops a little. We conclude that
selecting 50 to 80% of the attributes should give moderately satisfying accuracy.
Table 7: Experiment 3 feature selection result.
% of Features Selected # of Features Selected
J48 Detailed Accuracy
Acc
ura
cy
Nu
mb
er
of
lea
ves
Siz
e of
the
Tre
e
10% 62 75.10% 200 399
20% 124 73.59% 201 401
30% 186 75.10% 185 369
40% 248 74.93% 179 357
50% 310 75.17% 189 377
60% 371 74.79% 187 373
70% 433 75.00% 189 377
80% 495 75.31% 184 367
90% 557 74.97% 183 365
100% 619 74.86% 184 367
Figure 5: Average datasets accuracy.
International Journal of Data Mining & Knowledge Management Process (IJDKP) Vol.5, No.6, November 2015
25
6.4. Experiment 4: Building a Baseline for the Total Number of Medical Lab Tests
1) Experiment Goal: The goal of this experiment was to investigate the effect of the total
number of lab tests conducted on predicting patient deterioration. Usually, medical
professionals keep requesting the same medical test over a brief period to compare the result
with a reference range [19]. If the value is not within the range, it means the patient may be in
danger, so the test is repeated again and again. Our goal was to predict at what total number a
medical professional should start immediate action and, more precisely, how the total number
of medical lab tests could assist the medical professional in evaluating the patient’s status.
2) Building the Dataset: The dataset was built by taking the total number of tests taken for each
patient for each type of test and make it one attribute. Then one patient would be represented
as one instance having 700 attributes, one for each test. If a test was not done, then the value
of that attribute would be 0.
For example, the dataset would look like this:
P_ID Count1 Count2 … Count700 Dead/Alive
1 5 0 1 D
3) Pre-processing: The dataset was randomized first, then two datasets were generated,
Count_Training_Validation_Dataset and Count_testing_Dataset. This step was repeated ten
times because we used randomization to distribute the instances between the two datasets.
4) Base learners: Five learning algorithms were used to build the model, namely NaiveBayes,
SMO, ZeroR, J48 and RandomForest.
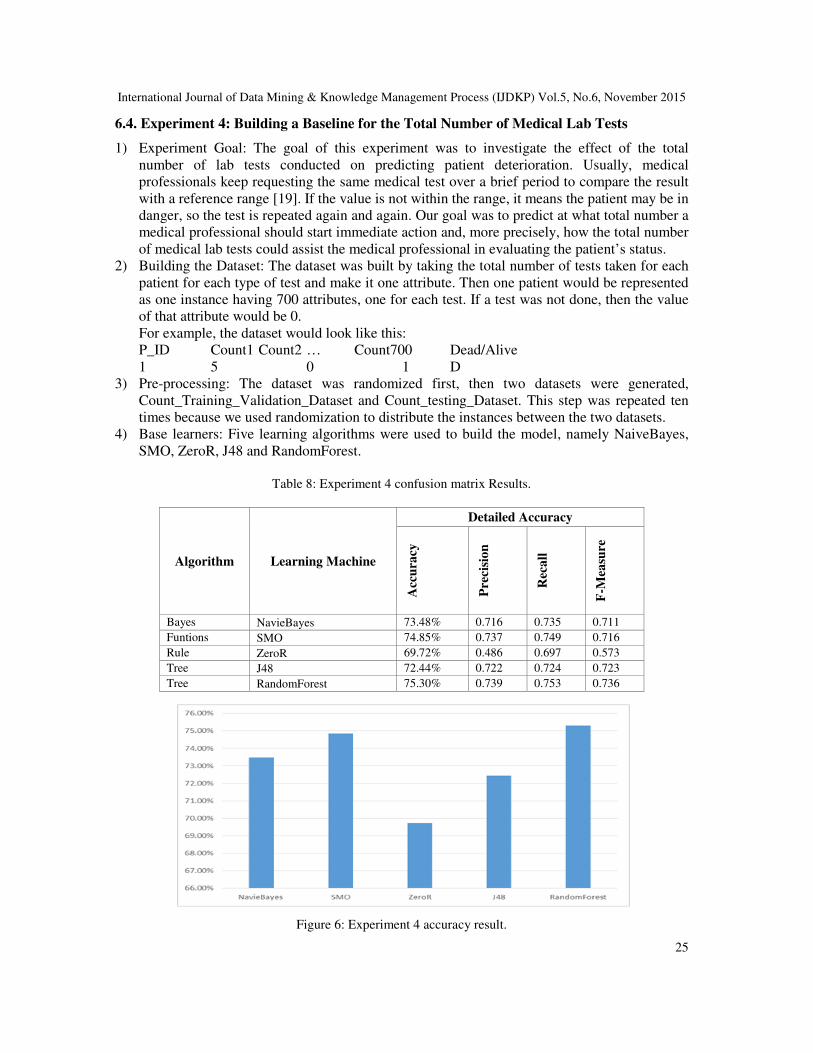
Table 8: Experiment 4 confusion matrix Results.
Algorithm Learning Machine
Detailed Accuracy
Acc
ura
cy
Pre
cisi
on
Rec
all
F-M
easu
re
Bayes NavieBayes 73.48% 0.716 0.735 0.711
Funtions SMO 74.85% 0.737 0.749 0.716
Rule ZeroR 69.72% 0.486 0.697 0.573
Tree J48 72.44% 0.722 0.724 0.723
Tree RandomForest 75.30% 0.739 0.753 0.736
Figure 6: Experiment 4 accuracy result.

International Journal of Data Mining & Knowledge Management Process (IJDKP) Vol.5, No.6, November 2015
26
Figure 6: Experiment 4 detailed accuracy result.
5) Evaluation: The training data were first used to build the model and then evaluated using a
percentage split via test data. For a performance measurement, the confusion matrix was
obtained to estimate four measures: accuracy, sensitivity, specificity and F-measure. Table 6
shows that SMO and RandomForest have almost equal levels of accuracy, around 75%. Even
after testing the model with the test datasets, SMO and RandomForest still have the highest
accuracy among the other techniques. The reason for this higher accuracy is that the amount
of memory required for SMO is linear in the training set size, which allows SMO to handle
very large training sets [13].
6.5. Experiment 5: Total Number of Medical Lab Tests Discriminative Attributes
1) Experiment Goal: The goal of this experiment was to select the most discriminative
attributes that can almost describe the model with less number of attributes. In this
experiment we were working to get the most out of the total number of medical lab tests
data, so we would have a better understanding to patient deterioration problem.
2) Building the Dataset: In this experiment we used the same dataset that we used in
experiment 4.
3) Pre-processing: In this stage, we used feature selection to select the most discriminative
attributes. For feature selection, we used weka.attributeSelection.CfsSubsetEval from
WEKA [20].
• Attribute Subset Evaluator: CfsSubsetEval
• Search Method: BestFirst.
• Evaluation mode: evaluate all training data
4) Base learner: Applying CfsSubsetEval reduced the attributes to 26 selected attributes.
Now the goal was to compare the reduced dataset with the baseline experiment result.
We used the same five classification algorithms to construct the model, namely
NaiveBayes, SMO, ZeroR, J48 and RandomForest.
5) Evaluation: Comparing the accuracy results from this experiment and the fourth
experiment was reported in Table 9 and Table 10. As a result, there was no enhancement
in general. Only J48 1.38%.

International Journal of Data Mining & Knowledge Management Process (IJDKP) Vol.5, No.6, November 2015
27
Table 9: Experiment 5 confusion matrix results.
Algorithm Learning Machine
Detailed Accuracy
Acc
ura
cy
Pre
cisi
on
Rec
all
F-M
easu
re
Bayes NavieBayes 73.17 % 0.709 0.732 0.702
Functions SMO 73.68 % 0.726 0.737 0.684
Rule ZeroR 70.24 % 0.493 0.702 0.580
Tree J48 73.82 % 0.726 0.738 0.730
Tree RandomForest 74.65 % 0.731 0.747 0.733
Table 10: Accuracy comparison between Experiment 4 & Experiment 5.
Algorithm Learning
Machine
Accuracy of
the original
total number
of tests
dataset
Accuracy of the
reduced total
number of tests
dataset
Change
Bayes NavieBayes 73.48% 73.17 % -0.31%
Functions SMO 74.85% 73.68 % -1.17%
Rule ZeroR 69.72% 70.24 % 0.52%
Tree J48 72.44% 73.82 % 1.38%
Tree RandomForest 75.30% 74.65 % -0.65%
Figure 8: Accuracy comparison between Experiment 4 & Experiment 5.
6.6. Experiment 6: Feature Selection for Total Number of Medical Lab Tests
1) Experiment Goal: The goal of this experiment was to study the relationship between feature
selection and classification accuracy. Feature selection is one of the dimensionality reduction

International Journal of Data Mining & Knowledge Management Process (IJDKP) Vol.5, No.6, November 2015
28
techniques for reducing the attribute space of a feature set. More precisely, it measures how
many features should be enough to give moderate accuracy.
2) Building the Dataset: In this experiment we used a count dataset.
3) Pre-processing: In the pre-processing step, we built ten datasets depending on the number of
selected features. The first dataset contained only 10% of the total attributes. Then we
increased the total feature selections by 10% with each new dataset. For example, dataset 1
contained 10% of the total attributes, dataset 2 contained 20% of the total attributes, dataset 3
contained 30% of the total attributes and so on till dataset 10 contained all 100% of the total
attributes.
4) For feature selection, we used supervised.attribute. InfoGainAttributeEval from WEKA. This
filter is a wrapper for the Weka class that computes the information gain on a class [20].
• Attribute Subset Evaluator: InfoGainAttributeEval
• Search Method: Ranker.
• Evaluation mode: evaluate on all training data
5) Base learner: After generating all reduced datasets, we used the J48 algorithm as a base
learner. Table 11: Experiment 4 Results.
% of Features Selection # of Features Selection
Detailed Accuracy
Acc
ura
cy
Nu
mb
er
of
lea
ves
Siz
e o
f th
e
Tre
e
10% 62 71.45% 237 473
20% 124 73.90% 250 499
30% 186 73.55% 247 493
40% 248 72.79% 252 503
50% 310 73.41% 252 503
60% 371 73.66% 254 507
70% 433 74.24% 254 507
80% 495 74.10% 254 507
90% 557 74.14% 265 529
100% 619 73.59% 259 517
Figure 7: Count Dataset accuracy.

International Journal of Data Mining & Knowledge Management Process (IJDKP) Vol.5, No.6, November 2015
29
6) Evaluation: Each feature-reduced dataset went through a 10-fold cross-validation for
evaluation. Figure 9 shows the accuracy of all count datasets. The detail values are also
reported in Table 9. From the results we observe that selecting 60 to 70% of the attributes
gives the highest accuracy. This also concludes that all features (i.e., lab tests) may not be
necessary to attain a highly accurate prediction of patient deterioration.
7. DISCUSSION
In the experiment we investigated the effect of feature selection in improving the prediction of
patient deterioration in the ICUs. We considered the lab tests as features. Thus, choosing a subset
of features would mean choosing the most important lab tests to perform. If the number of tests
could be reduced by identifying the most important tests, then we would also identify the
redundant tests. It should be noted that the feature selections were done without any domain
knowledge and without any intervention from medical experts. However, in the analysis we
would like to emphasize the merit of feature selection in choosing the best tests, which could be
further verified and confirmed by a medical expert.
First we compare the selected features selected from the two datasets, namely the average dataset
and the count dataset. Table 12 shows the 10 best features chosen by the two approaches and
highlights the common lab tests between the two approaches (i.e. using the average of tests and
count of tests). Table 13 shows more details about the common tests.
Table 11: Final Results.
Average Dataset
Count Dataset
Best ranked 10 from the 10% of selected features
50177
50090
50060
50399
50386
50440
50408
50439
50112
50383
50148
50112
50140
50399
50177
50439
50090
50440
50079
50068
International Journal of Data Mining & Knowledge Management Process (IJDKP) Vol.5, No.6, November 2015
30
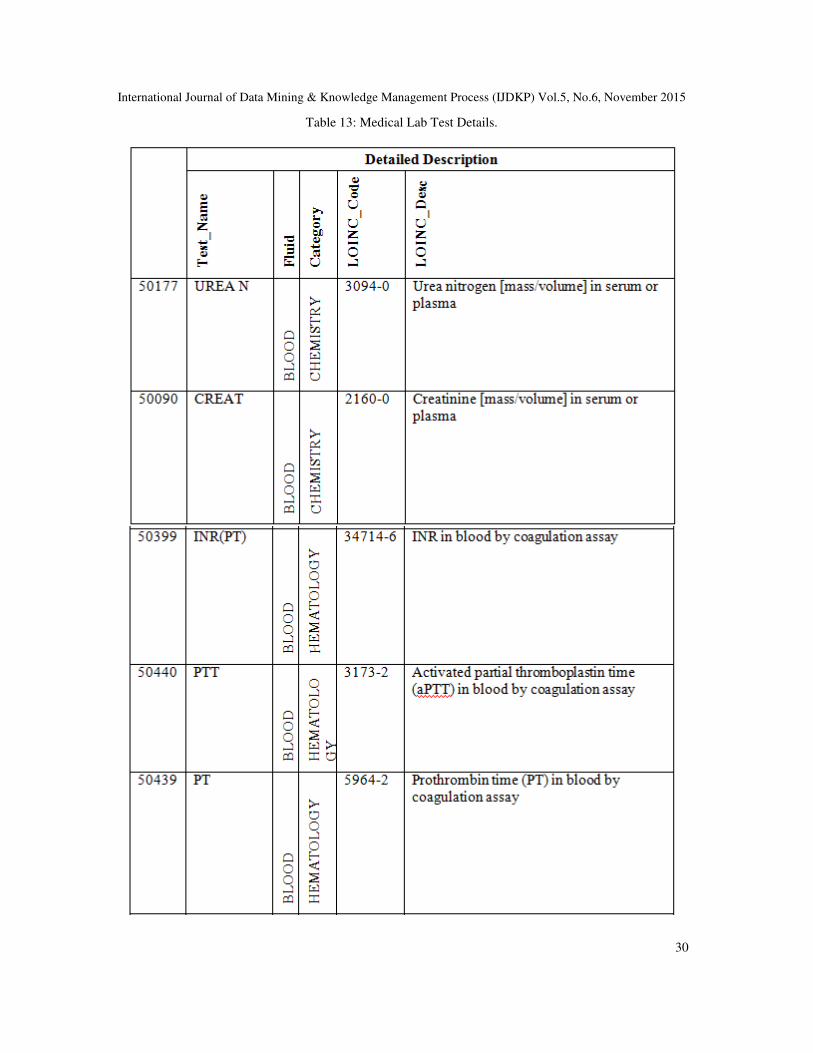
Table 13: Medical Lab Test Details.

International Journal of Data Mining & Knowledge Management Process (IJDKP) Vol.5, No.6, November 2015
31
LOINC is an abbreviation for logical observation identifiers names and codes. LOINC is clinical
terminology important for laboratory test orders and results [21]. ARUP Laboratories [22] is a
national clinical and anatomic pathology reference laboratory and a worldwide leader in
innovative laboratory research and development. We used their web page and others to clarify
more about the medical lab tests in table 10 as follows:
• UREAN (50177): This test is conducted using the patient’s blood. This test is
recommended to screen for kidney dysfunction in patients with known risk factors (e.g.
hypertension, diabetes, obesity, family history of kidney disease). The panel includes
albumin, calcium, carbon dioxide, creatinine, chloride, glucose, phosphorous, potassium,
sodium and BUN and a calculated anion gap value. Usually, the result is reported within
24 hours [22].
• CREAT (50090): This test is conducted using the patient’s blood. It is a screening test to
evaluate kidney function [22].
• INR(PT) (50399): This test is conducted using the patient’s blood by coagulation assay
[15].
• PTT (50440): This test is carried out to answer two main questions: does the patient have
antiphospholipid syndrome (APLS), and does the patient have von Willebrand disease? If
so, which type? It is carried out by mechanical clot detection [23].
• PT (50439): This test is conducted using the patient’s blood by coagulation assay [15].
• GLUCOSE (50112): This test is used to check glucose, which is a common medical
analytic measured in blood samples. Eating or fasting prior to taking a blood sample has
an effect on the result. Higher than usual glucose levels may be a sign of prediabetes or
diabetes mellitus [24].
• The result of the top 10 selected features from the average dataset allows us to build a
model using decision tree J48. This model would allow a medical professional to predict
the status of a patient in the ICU as follows:

International Journal of Data Mining & Knowledge Management Process (IJDKP) Vol.5, No.6, November 2015
32
For example, if the lab test (name: PTT, ID 50440, LOINC: 3173-2) result value is <=
20.757143, then the probability is very high (772.0/22.0~ 97.2%) that the patient is going to die
(class:1). This model has 78.6897% overall accuracy.
8. CONCLUSION AND FUTURE WORK
The increasing amount of medical laboratory data represents a significant information resource
that can provide a foundation for improved understanding of patients’ critical. Data mining
supports this goal by providing a set of techniques designed to discover similarities and
relationships between data elements in large data sets.
Reducing frequent laboratory testing and the potential care and financial implications are critical
issues in the intensive care units. In this paper, we presented our proposed approach to reduce the
observation time in the ICU by predicting patient deterioration in its early stages. In our work, we
presented six experiments to investigate the effect of the average laboratory test value and
number of total laboratory in predicting patient deterioration in the Intensive Care Unit. In our
work, we considered laboratory tests as features. Choosing a subset of features would mean
choosing the most important lab tests to perform.
For future work, the authors are planning to carry out more experiments using bigger data. Big
data analytics would bring potential benefits to support taking the right decision to enhance the
efficiency, accuracy and timeliness of clinical decision making in the ICU.
REFERENCES [1] Federico Cismondi, Leo A. Celi, André S. Fialho, Susana M. Vieira, Shane R. Reti, Joao MC Sousa, and Stan N.
Finkelstein, “Reducing unnecessary lab testing in the ICU with artificial intelligence,” Int. J. Med. Inf., vol. 82,
no. 5, pp. 345–358, 2013.
[2] Yi Mao, Wenlin Chen, Yixin Chen, Chenyang Lu, Marin Kollef, and Thomas Bailey, “An integrated data mining
approach to real-time clinical monitoring and deterioration warning,” in Knowledge discovery and data mining,
2012, pp. 1140–1148.
[3] Masha Rouzbahman and Mark Chignell, “Predicting ICU Death with Summarized Data: The Emerging Health
Data Search Engine.,” KMD, 2014.
[4] Q. Liu, Sung, Andrew H, Ribeiro, Bernardete, and Suryakumar, Divya, “Mining the Big Data: The Critical
Feature Dimension Problem,” Adv. Appl. Inform. IIAIAAI 2014 IIAI 3rd Int. Conf. On, pp. 499–504, 2014.
[5] Joon Lee and David M. Maslove, “Using information theory to identify redundancy in common laboratory tests
in the intensive care unit,” BMC Med. Inform. Decis. Mak., vol. 15, no. 1, 2015.
[6] Yi-Zeng Hsieha, Mu-Chun Sua, Chen-Hsu Wangb, and Pa-Chun Wangc, “Prediction of survival of ICU patients
using computational intelligence,” Comput. Biol. Med., vol. 47, pp. 13–19, 2014.
[7] J. Iavindrasana, G. Cohen, A. Depeursinge, H. Müller, R. Meyer, and A. Geissbuhler, “Clinical data mining: a
review,” Yearb Med Inf., pp. 121–133, 2009.
[8] Yvan Saeys, Iñaki Inza, and Pedro Larrañaga, “A review of feature selection techniques in bioinformatics,”
bioinformatics, vol. 23, no. 19, pp. 2507–2517, 2007.
[9] “An Introduction to Feature Selection - Machine Learning Mastery.” [Online]. Available:
http://machinelearningmastery.com/an-introduction-to-feature-selection/. [Accessed: 06-Sep-2015].
International Journal of Data Mining & Knowledge Management Process (IJDKP) Vol.5, No.6, November 2015
33
[10] S. Bouktif et al, “Ant Colony Optimization Algorithm for Interpretable Bayesian Classifiers Combination:
Application to Medical Predictions,” PLoS ONE, vol. 9, no. 2, 2014.
[11] X. Wu et al., “Top 10 algorithms in data mining,” Knowl. Inf. Syst., vol. 14, no. 1, pp. 1–37, 2008.
[12] Chitra Nasa and Suman, “Evaluation of Different Classification Techniques for WEB Data,” Int. J. Comput.
Appl., vol. 52, no. 9, 2012.
[13] John C. Platt, “Sequential Minimal Optimization: A Fast Algorithm for Training Support Vector Machines,”
Adv. Kernel Methods—support Vector Learn., vol. 3, 1999.
[14] Leo Breiman, “Random Forests,” Mach. Learn., vol. 45, no. 1, pp. 5–32, 2001.
[15] “MIMIC II Database.” [Online]. Available: https://mimic.physionet.org/database.html. [Accessed: 20-Aug-
2015].
[16] Lee J, Govindan S, Celi L, Khabbaz K, and Subramaniam B, “Customized prediction of short length of stay
following elective cardiac surgery in elderly patients using a genetic algorithm,” World J Cardiovasc Surg, vol.
3, no. 5, pp. 163–170, Sep. 2013.
[17] Lehman LH, Saeed M, Talmor D, Mark R, and Malhotra A, “Methods of blood pressure measurement in the
ICU,” Crit Care Med, vol. 41, no. 1, pp. 34–40, 2013.
[18] Lehman L, Long W, Saeed M, and Mark R, “Latent topic discovery of clinical concepts from hospital discharge
summaries of a heterogeneous patient cohort,” in Proceedings of the 36th International Conference of the IEEE
Engineering in Medicine and Biology Society, 2014.
[19] “Laboratory Test Reference Ranges | Calgary Laboratory Services.” [Online]. Available:
https://www.calgarylabservices.com/lab-services-guide/lab-reference-ranges/. [Accessed: 03-Sep-2015].
[20] “Feature Selection Package Documentation.” [Online]. Available:
http://featureselection.asu.edu/documentation/infogain.htm. [Accessed: 04-Sep-2015].
[21] “LOINC Codes - Mayo Medical Laboratories.” [Online]. Available:
http://www.mayomedicallaboratories.com/test-catalog/appendix/loinc-codes.html. [Accessed: 10-Sep-2015].
[22] “ARUP Laboratories: A National Reference Laboratory.” [Online]. Available: http://www.aruplab.com/.
[Accessed: 10-Sep-2015].
[23] “UCSF Departments of Pathology and Laboratory Medicine | Lab Manual | Laboratory Test Database | Activated
Partial Thromboplastin Time.”
[Online]. Available: http://labmed.ucsf.edu/labmanual/db/data/tests/802.html. [Accessed: 10-Sep-2015].
[24] “2345-7.” [Online]. Available: http://s.details.loinc.org/LOINC/2345-7.html?sections=Comprehensive.
[Accessed: 10-Sep-2015].
AUTHORS
Noura Al Nuaimi is pursuing a PhD in Information Technology with Dr Mohammad Mehedy Masud at United Arab
Emirates University (UAEU). She holds an MSc in Business Administration from Abu Dhabi University and a BSc in
Software Engineering from UAEU. Her research interests focus on data mining and knowledge discovery, cloud
computing, health information systems, search engines and natural language processing. She has published research
papers in IEEE Computer Society and IEEE Xplore.
Dr Mohammad Mehedy Masud is currently an Assistant Professor at the United Arab Emirates University (UAEU). He
joined the College of Information Technology at UAEU in spring 2012. He received his PhD from University of Texas
at Dallas (UTD) in December 2009. His research interests are in data mining, especially data stream mining and big
data mining. He has published more than 30 research papers in journals including IEEE Transactions on Knowledge
and Data Engineering (TKDE), Journal of Knowledge and Information Systems (KAIS), ACM Transactions on
Management Information Systems (ACM TMIS) and peer-reviewed conferences including IEEE International
Conference on Data Mining (ICDM), European Conference on Machine Learning (ECML/PKDD) and Pacific Asia
Conference on KDD. He is the principal inventor of a US patent application and lead author of the book “Data Mining
Tools for Malware Detection”. Dr Masud has served as a program committee member of several prestigious
conferences and has been serving as the official reviewer of several journals, including IEEE TKDE, IEEE TNNLS and
DMKD. During his service at the UAEU he has secured several internal and external grants as PI and co-PI.
Farhan Mohammed is a graduate from the College of Information Technology in United Arab Emirates University
specializing in Information Technology Management. He obtained his Bachelor’s in Management Information Systems
from United Arab Emirates University, Al Ain, UAE. He has worked under several professors and published four
conference papers and a journal paper for IEEE sponsored conferences. Currently he is working as a research assistant
in data mining in the health industry to develop models on health deterioration prediction. His area of interests lies in
smart cities, UAVs, data mining, and image and pattern recognition.