evolving an accelerated school model through student ... · evolving an accelerated school model...
TRANSCRIPT

Journal of Educational Issues ISSN 2377-2263
2016, Vol. 2, No. 2
www.macrothink.org/jei 385
Evolving an Accelerated School Model through Student
Perceptions and Student Outcome Data
Donna L. Braun (Corresponding author)
Center for Leadership and Educational Equity
304 Pearl Street, Suite 100, Providence, RI 02907, USA
E-mail: [email protected]
Robert K. Gable
Educational Leadership Doctoral Program, Johnson & Wales University
8 Abbott Park Place, Providence, RI 02903, USA
E-mail: [email protected]
Felice D. Billups
Educational Leadership Doctoral Program, Johnson & Wales University
8 Abbott Park Place, Providence, RI 02903, USA
E-mail: [email protected]
Mary Vieira
Center for Leadership and Educational Equity
304 Pearl Street, Suite 100, Providence, RI 02907, USA
E-mail: [email protected]
Danielle Blasczak
Center for Leadership and Educational Equity
304 Pearl Street, Suite 100, Providence, RI 02907, USA
E-mail: [email protected]

Journal of Educational Issues ISSN 2377-2263
2016, Vol. 2, No. 2
www.macrothink.org/jei 386
Received: November 13, 2016 Accepted: December 20, 2016 Published: December 22, 2016
doi:10.5296/jei.v2i2.10290 URL: http://dx.doi.org/10.5296/jei.v2i2.10290
Abstract
A mixed methods convergent evaluation informed the redesign of an innovative public school that uses an accelerated model to serve grades 7-9 students who have been retained in grade level and are at risk for dropping out of school. After over 25 years in operation, a shift of practices/policies away from grade retention and toward social promotion required the school to adapt their model to best served students with high risk factors for dropping out of school who have been socially promoted, rather than retained in grade level. This study provided the qualitative (perspectives of former students (N = 8) and quantitative (demographic and outcome variables for students (N = 164) who completed the program between 2007-2009) data to ground the evolution of the school model. Five critical aspects of the school model emerged from the former students: teacher as warm demander, diverse and creative practices, being one community, student self-efficacy, and upholding diversity and equity. Quantitative analyses revealed the key finding that the number of times a student accelerated to the next grade in their courses was a positive predictor of all the high school outcomes studied. Data mixed during interpretation generated recommendations to continue strong practices and strengthen the following: have students set, monitor, and share progress; increase clear and high expectations; engage the adult community in setting, tracking and assessing goals; and increase culturally competent practices. These findings can also be used by schools serving students who may be at risk for dropping out of school.
Keywords: Accelerated learning model, Culturally responsive practices, Dropout prevention, Mixed methods
1. Background and Purpose
The Urban Collaborative Accelerated Program (UCAP) is an alternative, independent, public middle school established in 1989. The school serves 140 students each year in grades 7, 8, and 9 who have been retained in grade and who are at high risk for dropping out of school (see Table 1). The UCAP mission is to intervene in the lives of young adolescents having serious difficulty in school and placed at risk of dropping out, to help each of them obtain the academic and social skills necessary for success in high school and in life. The school strives to create a supportive community that will motivate students with a coherent, relevant, and challenging academic program. The students are encouraged to take responsibility, work hard, achieve at high a level, set goals, take risks, and have fun (UCAP, 2015).
There are 23 staff members, 10 are teachers and the remaining are support staff and administrators. The school director, director of curriculum and instruction and lead counselor have been at the school since its founding year (over 25 years ago). Further, half of the staff members have worked at the school for over a decade. Approximately half of the staff

Journal of Educational Issues ISSN 2377-2263
2016, Vol. 2, No. 2
www.macrothink.org/jei 387
members are male and half are female, and 26% of the staff are people of color. The staff are recruited and selected for their commitment to and skill in working with the specific student population served. The teaching staff is divided into two teams with a social studies, English, science, math and special education teacher on each team. Teams meet for 6 hours during the week to prepare for classes and analyze student growth, and the staff convenes for professional learning for 1 hour a week lead by the director of curriculum and instruction. Study Groups meet occasionally after school.
Table 1. Demographics from students enrolled in 2014/15 (N = 140)
Demographics Percent
Gender
Male
Female
50
50
Special Education Status
No
Yes
83
17
Race/Ethnicity
African American
Asian
Hispanic
Multiracial
Native American
White
17
1
71
6
1
3
Free/Reduced Lunch
Yes
No
73
27
UCAP is both a non-profit organization and a public school. A pioneer of the small, public school movement, UCAP was established as a multi-district collaborative in 1989 through Rhode Island legislation. The students from the urban district that sends the majority of students to UCAP are included in the study. Established as a schooling alternative to increase high school graduation, UCAP has enrolled only students who have high risk factors for dropping out. Research has identified many societal inequities that influence a student’s schooling experience negatively and contribute to the likelihood that students drop out of school. Some of these include students experiencing low-engagement in classes, high absences, low pass rates, high discipline referrals, and attending high poverty schools (Balfanz, Herzog, & Mac Iver, 2007; Bridgeland, 2010). In addition, one of the most powerful predictors of dropping out of school is student retention in grade. Students who have been retained are two to eleven times more likely than their peers to drop out of high

Journal of Educational Issues ISSN 2377-2263
2016, Vol. 2, No. 2
www.macrothink.org/jei 388
school (Jimerson, Whipple, Anderson, & Dalton, 2002; Stearns, Moller, Blau, & Potochnick, 2007).
The UCAP model was designed to serve students who had been previously retained in grade and who also had demonstrated other risk factors. A key and unique characteristic of the school model is that students are given the opportunity to make up a grade level through an accelerated model. Students ‘accelerate’ from one grade level to the next in their core academic classes (i.e. English, math, science, and social studies) when they have demonstrated proficiency in the standards. In this model, students can take more time with certain standards and move quickly through others. A common example of the UCAP acceleration model can be exemplified in students who had been retained in grade level prior to entering UCAP and who then started UCAP in 7th grade. These students are given the opportunity over the two years they attend UCAP to earn three grade levels worth of credit in their core academic classes. This means that that in two years students complete the 7th, 8th and 9th grade, thereby making up a whole year of school and putting them back on track to graduate. The distinguishing features of the UCAP model are described in Table 2. Past program evaluations indicate that the model is successful at lowering the rate of dropping out and increasing the rate of graduation for students who attend the school (Braun, Mojkowski, & VanHorne, 2007).
Table 2. UCAP school model
Distinguishing Practices from Theory of Action
Serve students who have repeated a grade and are at risk of dropping out
Offer standards-based curriculum that leads to acceleration in grade
Use best practice instruction
Employ mixed grouping and flexible scheduling
Provide academic and enrichment programs
Personalize student support
Offer family engagement with an emphasis on post-secondary planning
Provide job-embedded professional development
Conduct evaluations of the organization’s performance
Maintain independent and autonomous school structure
Seek community partnerships and resources
Employ positive public recognition of student achievement
Offer multiple opportunities and pathways to success
Promote belief in effort-based intelligence and achievement
Since UCAP’s inception, retention rates have declined nationally (Warren, Hoffman, & Andrew, 2014) and the practice of retaining students has been largely discontinued in the
Journal of Educational Issues ISSN 2377-2263
2016, Vol. 2, No. 2
www.macrothink.org/jei 389
school’s three sending districts. Since retaining in grade is linked to dropping out of school, this is a positive trend. However, students who are promoted without the needed mastery of skills and knowledge to succeed at the next grade level can experience similar negative academic and social implications as students who are retained in grade (Lynch, 2014). Though UCAP’s sending districts are discontinuing the negative practice of retaining students, many students who would have been retained in the past are being promoted to the next grade level without the preparation they need to succeed. These students still need the intervention-based schooling UCAP offers, but are no longer easily identified by their characteristic of being retained in the past. This trend makes identification and recruitment difficult, and prompted the redesign of the school.
The UCAP staff has experimented with some program changes; however, to ground the evolution of the school model in data, this program evaluation was designed to give the school stakeholders perspectives of the key program components. An understanding of these key attributes will allow the school to leverage the most impactful practices in redesigning the program to meet future students’ needs.
2. Methodology
The rationale for a mixed methods convergent evaluation design was to converge and triangulate the contrasting data sources to enrich the results and provide a holistic perspective on the phenomenon. In this design, quantitative and qualitative data were collected and analyzed independently, followed by mixing data in the interpretation phase. The quantitative phase focused on the relationship among demographic variables, UCAP outcomes, and high school outcomes for a group of students who completed UCAP. The quantitative research question that guided the inquiry was, What are the relationships among students’ demographic variables, UCAP outcomes (number of accelerations, rate of acceleration) and high school outcomes (attendance, GPA, credits earned, and graduation)? The qualitative phase focused on the perceptions of students who had completed UCAP and the research question that guided the inquiry was, How do students perceive UCAP practices?
2.1 Data Collection
Demographic and UCAP outcome data from UCAP were compiled with high school outcome data from the school’s largest district partner for students who completed UCAP between 2007-2009 to allow for an analysis of their high school outcome. All the data were uploaded into SPSS for analysis. Purposeful sampling was used whereby all students who completed UCAP between 2007-2009 were invited to participate in a focus group. Due to the high mobility of the population and their families, multiple means were used to reach the group, including mail, email, phone and social media. All participants who responded and expressed interest were included in the focus group (N = 8). The moderator guide was reviewed by (N = 3) experts to ensure the group interview responses could inform the qualitative research question.
2.2 Data Analysis
Data analysis was accomplished separately for the quantitative and qualitative data sets,
Journal of Educational Issues ISSN 2377-2263
2016, Vol. 2, No. 2
www.macrothink.org/jei 390
followed by connecting the data sets at the interpretation stage through three strategies (Onwuegbzie & Teddlie, 2003). Each separate data set was then compared (by using the quantitative results to aid the qualitative interpretation) and displayed in tables.
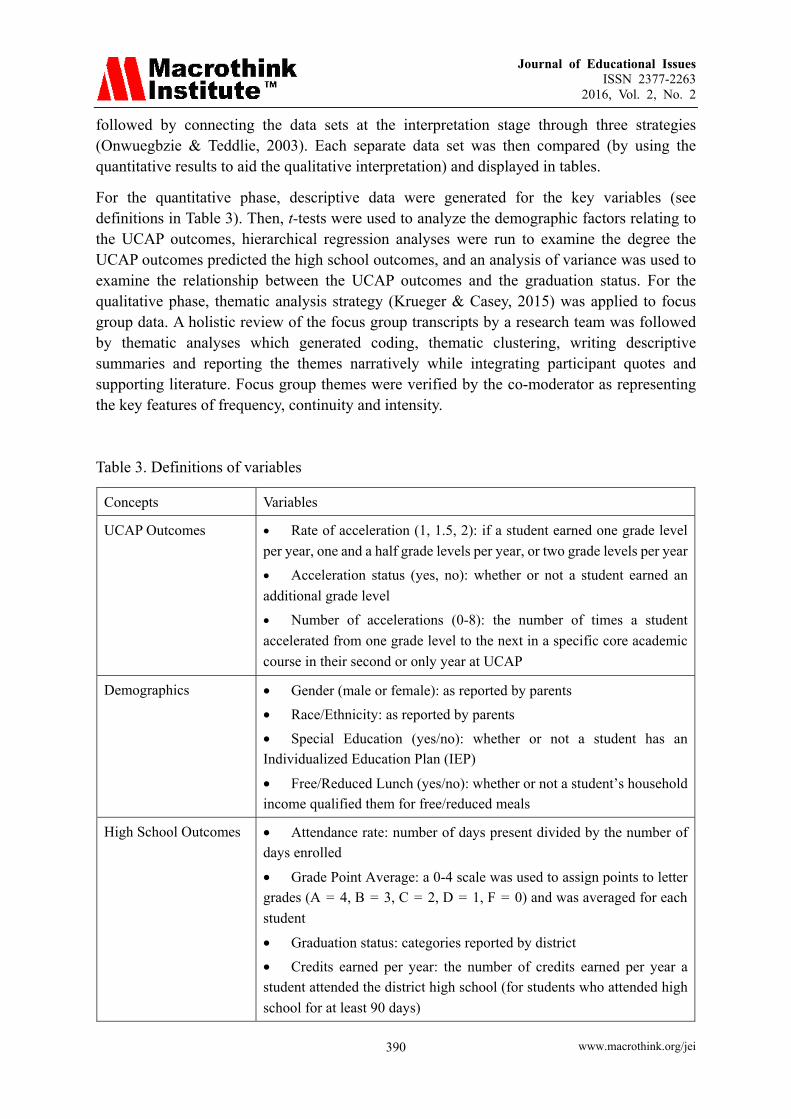
For the quantitative phase, descriptive data were generated for the key variables (see definitions in Table 3). Then, t-tests were used to analyze the demographic factors relating to the UCAP outcomes, hierarchical regression analyses were run to examine the degree the UCAP outcomes predicted the high school outcomes, and an analysis of variance was used to examine the relationship between the UCAP outcomes and the graduation status. For the qualitative phase, thematic analysis strategy (Krueger & Casey, 2015) was applied to focus group data. A holistic review of the focus group transcripts by a research team was followed by thematic analyses which generated coding, thematic clustering, writing descriptive summaries and reporting the themes narratively while integrating participant quotes and supporting literature. Focus group themes were verified by the co-moderator as representing the key features of frequency, continuity and intensity.
Table 3. Definitions of variables
Concepts Variables
UCAP Outcomes Rate of acceleration (1, 1.5, 2): if a student earned one grade level
per year, one and a half grade levels per year, or two grade levels per year
Acceleration status (yes, no): whether or not a student earned an
additional grade level
Number of accelerations (0-8): the number of times a student
accelerated from one grade level to the next in a specific core academic
course in their second or only year at UCAP
Demographics Gender (male or female): as reported by parents
Race/Ethnicity: as reported by parents
Special Education (yes/no): whether or not a student has an
Individualized Education Plan (IEP)
Free/Reduced Lunch (yes/no): whether or not a student’s household
income qualified them for free/reduced meals
High School Outcomes Attendance rate: number of days present divided by the number of days enrolled
Grade Point Average: a 0-4 scale was used to assign points to letter
grades (A = 4, B = 3, C = 2, D = 1, F = 0) and was averaged for each
student
Graduation status: categories reported by district
Credits earned per year: the number of credits earned per year a
student attended the district high school (for students who attended high
school for at least 90 days)

Journal of Educational Issues ISSN 2377-2263
2016, Vol. 2, No. 2
www.macrothink.org/jei 391
3. Results
First, the qualitative results are explained in the discussion of the five themes that emerged. Quantitative results are then represented by descriptive statistics and analyses that explored the relationships among demographics, UCAP outcomes and high school outcomes. Finally, the quantitative and qualitative results are compared.
3.1 Qualitative Themes
Five themes emerged from the analysis of focus group data, represented by participant quotes and supported by literature.
3.1.1 Theme 1: “They’ll Never Give up on You”: Teacher as ‘Warm Demander’
Participants described the educators in their school as adults who cared about them and conveyed an unrelenting belief that they could learn, despite previous setbacks. These assurances enabled students to experience personal transformation. One participant noted “They treated us more like family than like students” and another remarked, “it was more like they knew [you] personally. They knew what you were doing, where you were going after school, where you live.” Participants also commented that teachers believed in their students’ potential to grow. One participant shared, “… even when you want to give up the teachers, well, they’ll always start to find a way to like help you out...they’ll never give up on you.” Several participants detailed strategies that teachers used to communicate the expectation of academic growth: “He forced us to read everything … He would just stare at me until I opened up a book … when I started reading … then he was smiling.”
Perhaps most intense were the participants’ descriptions of how these student-teacher relationships led to their transformation. One participant described a change in his relationship to reading: “Before I would hate reading, I would try everything for me not to read … but now I love reading … now … I’m home and I’ll pick up a book to read.” Another participant stated that one of his teachers: “... kind of changed my life around”. A participant described his personal changeover while at the school:
Before I even came to UCAP I was just on the bad road … My, my mom … told me you need to change … if not you’re going to end like some of your friends who are dead or in jail. So when I came here, it was hard … changing from a bad kid and letting go of the bad things to try to do good for yourself. But … when I started talking to … all the teachers and then my friends changed … and I focused more on school than hanging out in the streets. So, if it wasn’t for this school … I wouldn’t be in school.
Participants’ descriptions of teacher practices aligned with the profile of a “warm demander”, a teacher who develops strong interpersonal relationships while also demanding high levels of academic work (Bondy & Ross, 2008; Hammond, 2015; Kleinfeld, 1975; Ware, 2006). When a learner engages in challenge, or productive struggle, the brain increases its ability to process complex information. In order for students to take such academic risks, learning must happen within the context of a safe (warm) relationship so that learning is not prohibited by a threat response to social interactions the brain perceives as perilous. The interpersonal
Journal of Educational Issues ISSN 2377-2263
2016, Vol. 2, No. 2
www.macrothink.org/jei 392
relationships characteristic of a warm demander approach enable teachers to set high expectations for academic risk-taking that results in productive struggle to increase the student’s intellective capacity for high level academic work. If a teacher creates strong personal relationships with students, but does not adequately demand productive struggle, he/she will not effectively increase the student’s intellective capacity (Hammond, 2015).
Focus group participants discussed the ‘warm’ aspects, like the strong interpersonal relationships with teachers, more than the ‘demander’ aspects, like high expectations and engagement in academically challenging work and performance. This suggests that the school should further cultivate the “demanding” components of the warm demander pedagogy, especially for boys and students receiving Special Education services who had significantly lower outcomes at UCAP.
3.1.2 Theme 2: “They Find Different Ways …”: Employing Diverse and Creative Practices
Participants discussed the diverse and creative practices the school and teachers used to engage, motivate, and support students in their growth in four areas: curriculum and pedagogy, personalized support, discipline, and extended learning opportunities. Diverse practices in curriculum and pedagogy included relevant curricular material and engaging instructional practices. For example, one student described her English teacher’s creative response when social media and cellphones began to disrupt learning. The teacher created a writing assignment related to cell phone use, which lessened the extent to which cell-phone use disrupted learning and allowed students to refocus. Participants also noted that the diversity of teaching styles at the school emphasized multiple learning approaches. One participant stated, “One science teacher did it one way, another science teacher did it the other … They help you to see that, like, you’re not limited to learn this way.” Another noted that the school’s approach was, “We’re going to teach you everything from a variety of different ways.”
Personalized practices such as intensive one-on-one support that enabled students to overcome learning challenges, and teacher strategies to restructure physical spaces allowed students to focus. Another area that reflected the importance of diverse practices included disciplinary methods, where participants described a wide range of practices that impacted them. While punitive practices (e.g. time out rooms) were noted, a larger focus was on restorative justice-oriented practices (e.g. community service), instructional responses (e.g. more one-on-one instructional support in a class in which the student struggled behaviorally) and rewards/incentives-based responses (e.g. special field trips). Finally, participants expressed that the variety of extended learning opportunities (the Beyond School program) was critical to their sustained engagement and growth.
Research supports participants’ positive perceptions of diverse teacher and school practices (Reilly, Lilly, Bramwell, & Kronish, 2011). The personalized instructional support discussed by students has been shown to decrease likelihood of dropping out by increasing course success (Pinkus, 2008) and increase higher levels of academic achievement (McClure, Yonezawa, & Jones, 2010). Further, the range of disciplinary practices noted by participants represent alternatives to punitive, exclusionary practices (suspension, expulsion) and rather

Journal of Educational Issues ISSN 2377-2263
2016, Vol. 2, No. 2
www.macrothink.org/jei 393
increase school connectedness (McNeely, Nonnemaker, & Blum, 2002), avoid removing students from the classroom (Yolanda et al., 2014), and disrupt disparities in discipline practices along lines of race, gender and sexual orientation (Gregory, Bell, & Pollock, 2014; Losen, 2015). Finally, participation in afterschool programs has been found to increase high school graduation (Afterschool Alliance, 2009), academic performance, consistent attendance, and positive attachment to school (McNeely et al., 2002), especially for diverse learners (Banks et al., 2001).
The robust conversation around the importance of diverse and personalized practices suggests the practices in this theme are strong and should be continued at the school. To further strengthen these practices, investing in the school-based professional learning community could further build the capacity of educators to employ diverse practices. Schools that cultivate “collective autonomy, or teachers’ ability to act on their professional best judgment as they work with students in their classrooms” (McClaughlin & Talbert, 2006, p. 8) and “risk-taking behavior” (Thompson, Gregg, & Niska, 2004, p. 10) are critical to increasing the instructional creativity needed to effectively serve diverse learners.
3.1.3 Theme 3: “We’re All One”: Being One Community
The value of membership within a small, tight-knit community in which they “knew” and were “known” by every community member was another key theme. One participant poignantly noted “we’re all one”, and another, “we’re like a big ol’ family.’ Many expressed the value of personalized relationships with teachers. As one participant shared, “[At this school there are] teachers who actually get into your personal life and get you to do things rather than just have another kid in the class …” Participants also valued being served by a team of educators that took collective responsibility for every student’s success. Of this, one participant stated, “It doesn’t matter which teacher [you ask for help], because they all will help you with anything.” Another participant described her experience getting after-school help: “Even if I didn’t have that one teacher there, there was always another teacher whose door is open.”
Finally, some participants noted that including parents in the community of adults who collectively supported student success initiated a positive turning point during times of struggle. One participant recalled, “there was one point when I thought I wasn’t going to graduate because of English. And then Joe had a talk with my parents and then that’s when I decided taking school a little bit more serious.”
The value of a school community defined by personalized adult relationships, adults taking collective responsibility for student success, and parental involvement, is thoroughly supported by research (Chen & Gregory, 2010; Lisi, 2003; McClure et al., 2010; McLaughlin & Talbert, 2006; Wang & Khalil, 2013). The brain perceives social needs with the same intensity as survival needs (Rock, 2009) and this is especially true of the adolescent brain (Dobbs, 2011). The implication for schools is that when students feel socially disconnected from the school environment, their brain triggers a threat response, making learning more difficult (Rock, 2009). Membership within a small school community serves as a protective factor against this response.
Journal of Educational Issues ISSN 2377-2263
2016, Vol. 2, No. 2
www.macrothink.org/jei 394
3.1.4 Theme 4: “Don’t Just Sit There in the Back Just Watching”: Student Self-Efficacy
Participants were motivated by explicit and public evidence of their growth and efficacy as learners through meeting clear goals (e.g. acceleration, perfect attendance, public rewards). One participant remarked, “I always used to love to accelerate. If I didn’t accelerate, I’d be disappointed.” In discussing the power of goal setting and tracking, participants shared many ways this could be increased at the school. They also expressed that increased opportunities for students to see concrete evidence of their effort would amplify the school’s positive impact on student success. Participants specifically stated that students would benefit from opportunities to set, monitor, and get feedback on their goals, and to publicly present their academic learning. One participant described a possible model for public feedback:
I also think that they should have a feedback day when they’ve got maybe an hour or so and it would be, like, feedback Friday … take an hour during the day and all sit down in a room … and give each other feedback. Give your growth and your strength and what you can work on.
Another participant suggested a model for increased public goal-setting.
Every Monday they can set a goal for something which you want to accomplish for the week. And Friday, see if you accomplished that or what you need to do to accomplish that a lot faster. We, we didn’t have that, set of goal.
Participant comments suggest students would benefit from more opportunities to develop their self-efficacy as learners. For example, some participants attributed their success to the support of their teachers, rather than taking ownership for their success. Several participants suggested that the advice they would give to future students would be to, “Be proactive in class. Engage yourself in it. Don’t just sit there in the back just watching …” Participants also discussed the difficulty of transitioning to a large high school where teachers did not provide as much support or personalized attention. This suggests that increased opportunities for students to see concrete evidence of their efficacy as learners, and take more personal ownership for their success, may prepare students to better enact skills as independent learners in a high school environment and beyond that is less supportive or personalized.
Research on the relationship between self-efficacy and student outcomes supports the students’ recommendations to increase practices that cultivate self-efficacy (Gaylon, Blondin, Yaw, Nalls, & Williams, 2012; Hammond, 2015). The concept of self-efficacy, introduced by Albert Bandura, is defined by Gaylon et al., as “the term used to describe a person’s belief that he/she has the ability to perform a particular activity or behavior” (p. 233). Hammond (2015) identifies self-efficacy as the core of “academic mindset” and explains that one’s academic mindset creates a script that the brain codes “into its safety-threat system with instructions to either avoid certain learning situations or embrace them” (p. 112). This helps explain how self-efficacy enables learners to engage in the productive struggle that increases their intellective capacity, and in turn increase likelihood of academic achievement. Higher levels of self-efficacy increase academic performance, positive behavior, attendance rates, and higher aspirations for the future (Alvernini & Lucidi, 2011; Hudley, Daoud, Hershberg,
Journal of Educational Issues ISSN 2377-2263
2016, Vol. 2, No. 2
www.macrothink.org/jei 395
Wright-Castro, & Polanco, 2002; Lucio, Rapp-Paglicci, & Rowe, 2010; Niehaus, Rudasill, & Adelson, 2011). Finally, the students’ specific recommendations to increase public goal setting and opportunities for feedback comprise practices that would increase self-efficacy by making learning visible (Estrada & Warren, 2014; Hammond, 2015; Hattie, 2009).
3.1.5 Theme 5: “They Embrace Diversity. You Know, We Are Equal No Matter What”: Embrace Diversity, Uphold Equity
Participants expressed that diversity was embraced and equity was upheld at the school. They spoke about this in a number of ways, noting that the school embraced all students regardless of their background, race/ethnicity, socioeconomic status, etc.:
You know, we all come from different backgrounds, like my own... I came from a really bad neighborhood…some people would come from a really good neighborhood and when we come here, it just, it really doesn’t matter where you come from, who you are.
Another student remarked, “So what I like about UCAP is they embrace diversity … We were all treated as equal. It didn’t matter where we came from.” For students, this meant that the school was safe, absent of the negative experiences they endured in other schools, such as bullying or race-based discrimination. One student, who had experienced what she described as racism in high school described that at UCAP, “We don’t see a lot of, you know, racial, there was never any racial comments going around.” One student contrasted her experience at the school to negative prior school experiences:
Another good thing that makes the school different from others is that it’s a really safe place to come to. Like the middle school I was at before I came here, I was like severely bullied. And when I came here I almost instantly had friends and the teachers were so nice and they made sure that everybody was nice to each other and that you were in a safe place.
Research support participants’ positive perception of the school’s practice to embrace diversity and uphold equity. This school practice is critical and should be continued because when the brain’s threat response is triggered, the neural response of the brain makes learning more difficult (Hammond, 2015; Rock, 2009). Students from marginalized groups are particularly susceptible to experiencing a threat response as a result of microaggressions (“the subtle, everyday verbal and nonverbal slights, snubs, or insults which communicate hostile, derogatory, or negative messages to people of color based solely on their marginalized group membership”) (Hammond, p. 47). Schools need to craft conditions that decrease microaggressions and stereotype threat when members of a demographic group sense that their group is negatively stereotyped in relation to their ability to perform on a specific task (Mendozo-Denton, 2014) and increase feelings of acceptance and belonging (Banks et al., 2001; Gay, 2000).
Importantly, because students expressed that everyone was treated uniformly, UCAP staff might examine if they engage in “colorblindness”, a practice in which all students are seen as the same, regardless of race, ethnicity or culture. In contrast, it is important for educators to build their understanding of complex characteristics of diverse racial, ethnic and cultural

Journal of Educational Issues ISSN 2377-2263
2016, Vol. 2, No. 2
www.macrothink.org/jei 396
groups, the complex ways in which race, ethnicity, language, and social class interact to influence student behavior, and the sociopolitical context in which schools operate (Banks et al., 2001; Gay, 2000; Hammond, 2015; Kleinfeld, 1975; Pollock, 2008; Ware; 2006). The school might further amplify its practice of “embracing diversity” by examining student performance and engagement by subgroup to identify and address equity gaps, especially for the two groups highlighted in the quantitative data as having significantly lower UCAP outcomes (males and students receiving Special Education Services).
3.2 Quantitative Descriptive Data
The frequency and percentages for the quantitative variables are displayed in Tables 4-6 for students who completed UCAP in 2007 (n = 61), 2008 (n = 43), and 2009 (n = 60). Table 4 displays the demographic variables.
Table 4. Demographic information for students (N = 164)
Demographics Frequency Percent
Gender
Male
Female
82
82
50
50
Special Education Status
No
Yes
147
17
90
10
Due the unique model that allows students to ‘accelerate’ or earn more than one credit a year in their core courses, there are a few ways to measure the acceleration outcomes. These are represented as variables in Table 5 and further defined in Table 3. The first way is by acceleration status: 33% of UCAP students in the study achieved at the highest level and earned an extra grade level or ‘accelerated’ in all their core courses. These students either earned three grade levels in two years (a 1.5 rate of acceleration) or even more challenging, they earned two grade levels in one year (a 2.0 rate of acceleration). Those students who did not earn an extra grade while they were at UCAP, but rather earned one grade for each year they attended had a 1.0 rate of acceleration, which represents typical growth at other schools. These first two ways to measure UCAP outcomes (acceleration status and rate of acceleration) report whether a student accelerated or earned an additional overall grade level (e.g. earned credit for 7th, 8th, and 9th grade in two years). The third way to view student outcomes at UCAP is by the number of accelerations a student earned in each course (number of accelerations). A student earns an ‘acceleration’ in a core academic course if they demonstrate competency in that course in an accelerated timeframe (e.g. a student who demonstrates all the competencies needed to complete 7th grade science by 2/3rds of the way through their 7th grade year ‘accelerate’ in 7th grade because their pace of learning is accelerated). While 38%

Journal of Educational Issues ISSN 2377-2263
2016, Vol. 2, No. 2
www.macrothink.org/jei 397
of students did not accelerate in any of their core academic courses (they progressed at a typical rate of progress), the remaining students earned between 1-8 accelerations in their courses in their second or only year at UCAP.
Table 5. UCAP acceleration outcomes for (N = 164)
Acceleration Variables Frequency Percent
Acceleration status
No
Yes
110
54
67
33
Rate of acceleration
1.0
1.5
2.0
110
37
17
67
23
10
Number of course accelerations
0
1
2
3
4
5
6
7
8
63
22
16
8
10
16
8
9
12
38
13
10
5
6
10
5
6
7
The frequency, mean and standard deviations are displayed in Table 6 for each of the high school outcome (see Table 3 for definitions). The number of students who eventually transferred out of the district in the study was 47%. This made the calculation of a graduation rate impossible. Interestingly, 67% stayed in the district for at least 3 years before they transferred, graduated or dropped out.

Journal of Educational Issues ISSN 2377-2263
2016, Vol. 2, No. 2
www.macrothink.org/jei 398
Table 6. High school outcomes for students
High School Outcome Variables N Mean or % SD
Attendance Rate 140 .72 .22
Grade Point Average 137 1.19 .89
Credits Earned Per Year in District HS 129* 3.61 2.53
Graduation Status
Transferred
Graduated
Dropped out
143
67
63
13
47%
44%
9%
Years in District HS
1
2
3
4
5
17
29
65
28
1
12%
21%
46%
20%
1%
Note. * Only students who were enrolled for at least one semester included.
3.3 Demographic Relationship to UCAP Outcomes
The demographic variables were analyzed to explore their relationship to the UCAP outcomes that reported rate of acceleration and number of acceleration (see Tables 7 and 8). From this process, it was identified that both the rate of acceleration and number of accelerations was significantly higher for female than male students. Further, the rate of acceleration was significantly higher for students categorized as Asian, Hispanic, African American, and/or Native American than it was for student categorized as White. Finally, the number of accelerations was significantly higher for students who were not enrolled in Special Education services than it was for students who were enrolled in Special Education services.

Journal of Educational Issues ISSN 2377-2263
2016, Vol. 2, No. 2
www.macrothink.org/jei 399
Table 7. Results of t-test for demographics of students to rate of acceleration
M SD t p d**
Gender 2.22 .027 .33
Female (n = 82) 1.27 .37
Male (n = 82) 1.16 .29
Special Education .90 .372
Yes (n = 17) 1.15 .29
No (n = 147) 1.22 .34
Race/Ethnicity
AHANA*(n = 153)
White (n = 10)
1.23
1.00
.34
.00
8.22
.001 1.35
Socioeconomic Level
Yes Free/Reduced Meal (n = 139)
No Free/Reduced Meals (n = 23)
1.22
1.17
.35
.29
.64 .521
Note. * AHANA refers to Asian, Hispanic, African American, Native American, ** Effect size guidelines were as follows: .20 = small, .50 = medium, .80 = large.
Table 8. Results of t-test for demographics of students to number of accelerations
M SD t p d**
Gender 2.59 .01 .40
Female (n = 82) 3.01 2.99
Male (n = 82) 1.93 2.34
Special Education 4.00 .001 1.30
Yes (n = 17) .95 1.48
No (n = 147) 2.65 2.79
Race/Ethnicity
AHANA*(n = 153)
White (n = 10)
2.48
2.00
2.74
2.58
.54
.539
Socioeconomic Level
Yes Free/Reduced Meal (n = 139)
No Free/Reduced Meals (n = 23)
2.55
1.96
2.75
2.62
.97 .333
Note. * AHANA refers to Asian, Hispanic, African American, Native American, ** Effect size guidelines were as follows: .20 = small, .50 = medium, .80 = large.
Journal of Educational Issues ISSN 2377-2263
2016, Vol. 2, No. 2
www.macrothink.org/jei 400
3.4 Relationship between UCAP Academic Outcomes and High School Outcomes
A series of three hierarchical multiple regression analyses explored the degree to which the two UCAP outcome variables (acceleration rate and number of accelerations) explained the variation in three of the high school outcome variables (attendance rate, grade point average, and credits earned per year), after controlling for the following demographic variables: Gender (male = 1, female = 2), Special Education (no = 0, yes = 1), Race/Ethnicity (White = 0, Asian, African American, Hispanic, Native American = 1), Socioeconomic Level (No Free/Reduced Lunch = 0, Free/Reduced = 1). In each analysis, the only control/demographic variable that explained a significant amount of variation was socioeconomic level. Students with a higher socioeconomic level (i.e., not qualified for free/reduced meals) had lower attendance rates and GPA than students with a lower a socioeconomic level. This finding contradicts state results, but is likely due to the unique characteristics (e.g. retained in school) of the students enrolled in the school.
3.4.1 Hierarchical Regression Analyses: Demographic and UCAP Acceleration Variables Predicting High School Outcomes
After controlling for the demographic variables, the number of accelerations a student earned at UCAP was found to be a significant predictor (R = .30, R2 = .09, p=.004, medium effect size) of high school attendance rate. The rate of accelerations did not enter in the equation, as it did note explain a significant additional amount of the variation in the high school attendance rate.
After controlling for the demographic variables, the number of accelerations was also found to be significant predictor (R = .33, R2 = .11, p < .05, medium effect size) of high school grade point average. As with attendance, the rate of accelerations did not enter in the equation, as it did not explain a significant additional amount of the variation in the high school grade point average.
Finally, after controlling for the demographic variables, the number of accelerations was also found to be a significant predictor (R = .36, R2 = .13, p= .002, medium effect size) of high school credits earned per year. And again, the rate of accelerations did not enter in the equation, as it did not explain a significant additional amount of the variation in the high school credits earned per year.
3.4.2 ANOVA Analysis: UCAP Acceleration Variables Relationship to High School Graduation Status
The final analyses for exploring the relationship between the UCAP outcomes and the high school outcomes were two one-way ANOVAs with the Scheffé post hoc test. These analyses examined the extent to which there was a relationship between the two UCAP acceleration variables (number of accelerations and rate of acceleration) and the students’ graduation status (dropped out, transferred, and graduated). Students who graduated had a significantly higher number of accelerations (M = 3.35) than students who dropped out (M = 2.08) or transferred (M = 2.04) (F = 4.19, p = .017, η2 = .06, medium effect size). No differences were found among the groups for the rate of acceleration.

Journal of Educational Issues ISSN 2377-2263
2016, Vol. 2, No. 2
www.macrothink.org/jei 401
In summary, the three key quantitative results indicated: (1) Females had a statistically significant greater rate of acceleration and number of accelerations at UCAP than males. (2) The rate of acceleration (whether a student earned 1 grade per year, 1.5 grades per year or 2 grades per year) did not have a statistically significant relationship with any of the high school outcomes. (3) In contrast, the number of accelerations a student earned in their core academic courses in their last or only year at UCAP had a statistically significant relationship with all of the high school outcomes.
3.5 Connecting the Quantitative and Qualitative Results
The analysis of quantitative and qualitative strands occurred independently, with data mixed during the interpretation phase. Results from both strands were compared to infer meaning and confirm interpretations (see Table 9).
Table 9. Comparing qualitative and quantitative results to connect findings
Qualitative Themes Key Quantitative Results
Number of Accelerations
at UCAP significant
predictor of HS outcomes
UCAP outcomes for
males significantly lower
than females
Students making up a
grade (rate of
acceleration) not
significant predictor of
HS outcomes
Student
Self-Efficacy
Setting, monitoring and
celebrating progress (e.g.
achieving accelerations)
increases student efficacy
in high school.
Males may need
increased opportunities
to set, monitor and
celebrate progress.
Smaller, clear goals (e.g.
measured by number of
accelerations) may
increase self-efficacy
more than large goals
(e.g. making up a grade).
Teacher as Warm
Demander
Engaging students in
productive struggle
communicates teacher
belief in student ability to
meet high expectations.
Males may need
increased opportunities
for productive struggle.
Smaller, clear goals may
encourage students to
engage in productive
struggle more than a
large goal.
Employing Diverse
and Creative
Practices
Provide scaffolding by
diversifying learning
approaches while not
lowing expectations.
Males may need
increased scaffolding by
diversifying learning
approaches while not
lowering the
expectations.
Smaller, clear goals may
scaffold high
expectations, rather than
working to achieve a
large goal.
Being One
Community
Culture of strong
community connection
can be used to increase
Data on males and other
subgroups of students
should be tracked to
Smaller, clear goals may
help students feel
connected to the

Journal of Educational Issues ISSN 2377-2263
2016, Vol. 2, No. 2
www.macrothink.org/jei 402
UCAP staff’s capacity to
take set, monitor
progress, and act on data
to improve practice for
all students.
ensure all students feel
emotionally and
academically successful
and connected.
community because they
offer more chance to
celebrate all students
accomplishments than
large goals.
Embrace Diversity,
Uphold Equity
Diversity is a strength
and can be used to
increase cultural
competence of staff and
students.
May need to increase
focus on unique assets of
male students to increase
equitable gender
outcomes.
Smaller, clear goals may
help increase equitable
outcomes compared to
large goals.
4. Conclusions
The UCAP model demonstrates many strengths that enable student success. Evidence suggests that student success at UCAP, when measured by the number of accelerations, is a predictor of every high school outcome in the study. Furthermore, UCAP alumni articulated two important school and teacher practices that contribute to student success at UCAP and beyond: being part of a safe community and employing diverse and creative practices in and out of school. Thus, UCAP should continue these vigorous practices and use them to further increase four practices (further discussed in the remainder of this section) that emerged from the converged findings (Table 9) to evolve the school design. The four recommended practices are: (1) Increase way for students to set, monitor, and share publicly their progress toward clear smaller goals; (2) Increase expectations for students to meet high learning goals; (3) Use the same practices suggested for the students to set, monitor, and share clear goals in the adult community, specifically around student subgroups who are not performing as well as others (e.g. males); and (4) Increase diverse cultural reference points and practices by strengthening the cultural competent practices of the adults and students.
The most significant practice to incorporate in the redesign are ways for students to set, track, monitor, and share publicly their progress and learning to build their self-efficacy as learners and students. Findings converge and corroborate this conclusion. Students at UCAP who had a greater number of accelerations in their core academic courses were engaging in this practice more often and had significantly better high school outcomes. This suggests that the monitoring and celebrating of smaller clear goals (e.g. measured by number of accelerations) may increase self-efficacy more than large goals (e.g. earning credit for an additional grade level). Focus group participants offered more specific suggestions relating to this practice than any other area.
Further, findings suggest that the school should deepen student engagement in more rigorous, complex learning. While the number of accelerations predicted high school outcomes, a majority of students did not meet the highest goal set for them at UCAP and make up a grade (acceleration rate 1.5 and 2). This, along with the focus group participants’ comments about wanting rigor increased, suggests the need to find ways to raise expectations for students.

Journal of Educational Issues ISSN 2377-2263
2016, Vol. 2, No. 2
www.macrothink.org/jei 403
The next area to strengthen is to use the same practices suggested for the students to set, monitor, and assess clear and high goals in the adult learning community, specifically around student subgroups who are not performing as well as others. The data suggests that the subgroups of males and students receiving special education services may not be as well served by the school design as their peers. Examining student performance and engagement data by subgroup to identify, address and close equity gaps will build the adult learning community’s capacity to continue to do so.
The final key finding is to increase the inclusion of diverse cultural reference points and practices by strengthening the cultural competent practices of the adults and students. This could further affirm the unique identities of the students and create a more pluralistic school culture in which students’ differences are valued as assets, which in turn can increase students’ brains ability to learn in a safe and affirming environment.
This study affirmed the results of prior UCAP program evaluations that there is a strong and positive relationship between the UCAP practices and student success. The study also further unpacked the design features that are most significant to students and suggested four key areas to strengthen as part of the evolution of the school design. The results of over 25 years of implementation of a unique school model, as well as the next steps identified in this study, can also be used to illuminate direction for other schools serving linguistically and culturally diverse students who may be at risk for dropping out of school.
Acknowledgements
This research was supported by a grant from the Nellie Mae Foundation to the Urban Collaborative Accelerated Program.
References
Afterschool Alliance. (2009). Afterschool: A High school dropout prevention tool. Afterschool Alert Issue Brief, 38.
Alivernini, F., & Lucidi, F. (2011). Relationship between social context, self-efficacy, motivation, academic achievement, and intention to drop out of high school: A Longitudinal study. The Journal of Educational Research, 104(4), 241-252. https://doi.org/10.1080/002206 71003728062
Balfanz, R., Herzon, L., & Mac Iver, D. J. (2007). Preventing student disengagement and keeping students on the graduation path in urban middle-grades schools: Early identification and effective interventions. Educational Psychologist, 42(4), 223-235. https://doi.org/ 10.1080/00461520701621079
Banks, J. A., Cookson, P., Gay, G., Hawley, W. D., Irvine, J. J., Nieto, S., Schofield, J. W., & Stephan, W. G. (2001). Diversity Within Unity: Essential Principles For Teaching and Learning In a Multicultural Society. Phi Delta Kappan, 83(3), 196. https://doi.org/10.1177/ 003172170108300309
Bondy, E., & Ross, D. (2008). The Teacher as Warm Demander. Educational Leadership,

Journal of Educational Issues ISSN 2377-2263
2016, Vol. 2, No. 2
www.macrothink.org/jei 404
66(1), 54-58.
Braun, D., Mojkowsi, C., & Van Horne, W. (2007). Student performance outcomes of a Rhode Island public alternative school: The challenge and the results. Retrieved from http://www.ucap.org/whatever_it_takes/UCAP_Eval_Report_part1.pdf
Bridgeland, J. M. (2010). The New dropout challenge: Bridging gaps among students, parents, and teachers. New Directions for Youth Development, 127, 101-110. https://doi.org/10.1002/ yd.366
Chen, W., & Gregory, A. (2010). Parental involvement as a protective factor during the transition to high school. The Journal of Educational Research, 103(1), 53-62. https://doi.org/ 10.1080/00220670903231250
Dobbs, D. (2011). Teenage Brains. National Geographic. Retrieved from http://ngm.national geographic.com/2011/10/teenage-brains/dobbs-text/2
Estrada, B., & Warren, S. (2014). Increasing the writing performance of urban seniors placed at-risk through goal-setting in a culturally responsive and creativity-centered classroom. Journal of Urban Learning, Teaching, and Research, 10, 50-63.
Galyon, C., Blondin, C., Yaw, J., Nalls, M., & Williams, R. (2011). The relationship of academic self-efficacy to class participation and exam performance. Social Psychology of Education Soc Psychol Educ, 15(2), 233-249. https://doi.org/10.1007/s11218-011-9175-x
Gay, G. (2000). The Power of Caring. Culturally responsive teaching theory, research, and practice. New York, NY: Teachers College Press.
Gregory, A., Bell, J., & Pollock, M. (2014). How educators can eradicate disparities in school discipline: A Briefing paper on school-based interventions. Retrieved from http://www.indiana.edu/~atlantic/wp-content/uploads/2014/12/Disparity_Intervention_Full_121114.pdf
Hammond, Z. (2015). Culturally Responsive Teaching and The Brain: Promoting authentic engagement and rigor among culturally and linguistically diverse students. Thousand Oaks, CA: Corwin.
Hattie, J. (2009). Visible learning: A Synthesis of over 800 meta-analyses related to achievement. New York, NY: Routledge.
Hudley, C., Daoud, A., Hershberg, R., Wright-Castro, R., & Polanco, T. (April 1, 2002). Factors supporting school engagement and achievement among adolescents. Paper presented at Annual Meeting of the American Educational Research Association, New Orleans.
Jimerson, S. R., Ferguson, P., Whipple, A. D., Anderson, G. E., & Dalton, M. J. (2002). Exploring the association between grade retention and dropout: A Longitudinal study examining socio-emotional, behavioral, and achievement characteristics of retained students. The California School Psychologist, 7, 51-62. https://doi.org/10.1007/BF03340889
Kleinfeld, J. (1975). Effective Teachers of Eskimo and Indian Students. The School Review,

Journal of Educational Issues ISSN 2377-2263
2016, Vol. 2, No. 2
www.macrothink.org/jei 405
83(2), 301-304. https://doi.org/10.1086/443191
Kruegar, R. A., & Casey, M. A. (2015). Focus groups: A Practical guide for applied research. Thousand Oaks, CA: Sage Publications.
Lisi, A. (2003). The Personalization of the school environment: The Relationship of students’ access to support from an adult with student adjustment outcomes and experiences of school climate (Unpublished doctoral dissertation). University of Rhode Island and Rhode Island College, Providence, RI.
Losen, D. J. (2015). Closing the school discipline gap: Equitable remedies for excessive exclusion. New York, NY: Teachers College Press.
Lucio, R., Rapp-Paglicci, L., & Rowe, W. (2010). Developing an additive risk model for predicting academic index: School factors and academic achievement. Child and Adolescent Social Work Journal, 28(2), 153-173. https://doi.org/10.1086/443191
Lynch, M. (2014). The True costs of social promotion and retention. International Journal of Progressive Education, 10(3), 6-17.
McClure, L., Yonezawa, S., & Jones, M. (2010). Can school structures improve teacher-student relationships? The Relationship between advisory programs, personalization and students’ academic achievement. Education Policy Analysis Archives, 18(17), 2-14. https://doi.org/10.14507/epaa.v18n17.2010
McLaughlin, M., & Talbert, J. (2006). Learning to Improve Student Achievement. Building school-based teacher learning communities: Professional strategies to improve student achievement. New York, NY: Teachers College Press.
McNeely, C., Nonnemaker, J., & Blum, R. (2002). Promoting School Connectedness: Evidence from the National Longitudinal Study of Adolescent Health. Journal of School Health, 72(4), 138-146. https://doi.org/10.1111/j.1746-1561.2002.tb06533.x
Mendozo-Denton, R. (2014). A Social psychological perspective n the achievement gap in standardized test performance between white and minority students: Implications for assessment. The Journal of Negro Education, 83(4), 465-484. https://doi.org/10.7709/ jnegroeducation.83.4.0465
Niehaus, K., Rudasill, K., & Adelson, J. (2011). Self-Efficacy, intrinsic motivation, and academic outcomes among Latino middle school students participating in an after-school program. Hispanic Journal of Behavioral Sciences, 34(1), 118-136. https://doi.org/10.1177/ 0739986311424275
Onwuegbuzie, A. J., & Teddlie, C. (2003). A framework for analyzing data in mixed methods research. In A. Tashakkori & C. Teddlie (Eds.), Handbook of mixed methods in social and behavioral research (2nd ed., pp. 397-430). Thousand Oaks, CA: Sage.
Pinkus, L. (2008). Using early-warming data to improve graduation rates: Closing cracks in the education system. PolicyBrief, August. Washington DC: Alliance for Excellent Education.

Journal of Educational Issues ISSN 2377-2263
2016, Vol. 2, No. 2
www.macrothink.org/jei 406
Pollock, M. (2008). Introduction. Everyday antiracism. New York, NY: New Press.
Reilly, R. C., Lilly, F., Bramwell, G., & Kronish, N. (2011). A synthesis of research concerning creative teachers in a Canadian context. Teaching and Teacher Education, 27(3), 533-542. https://doi.org/10.1016/j.tate.2010.10.007
Rhode Island Department of Education. (2015). Information Works! Rhode Island Department of Education. Retrieved from http://infoworks.ride.ri.gov/school/urban-collabora tive-accelerated-program
Rock, D. (2009). Managing with the brain in mind. Oxford Leadership Journal, 1(1), 1-10.
Stearns, E., Moller, S., Blau, J., & Potochnick, S. (2007). Staying back and dropping out: The Relationship between grade retention and school dropout. Sociology of Education, 80, 210-240. https://doi.org/10.1177/003804070708000302
Thompson, S., Gregg, L., & Niska, J. (2004). Professional Learning Communities, Leadership, and Student Learning. Research in Middle Level Education, 28(1), 1-15. https://doi.org/10.1080/19404476.2004.11658173
Urban Collaborative Accelerated Program (UCAP). (2015). Retrieved from http://www.ucap.org/whatever_it_takes/acceleration/index.html
Wang, M., & Sheikh-Khalil, S. (2014). Does parental involvement matter for student achievement and mental health in high school? Child Development, 85(2), 610-625. https://doi.org/10.1111/cdev.12153
Ware, F. (2006). Warm Demander Pedagogy: Culturally Responsive Teaching That Supports a Culture of Achievement for African American Students. Urban Education, 41(4), 427-456. https://doi.org/10.1177/0042085906289710
Warren, J. R., Hoffman, E., & Andrew, M. (2014). Patterns and trends in grade retention rates in the United States, 1995-2010. Educational Researcher, 43(9), 433-443. https://doi.org/ 10.3102/0013189X14563599
Yolanda, A., Jenson, J. M., Altschul, I., Farrar, J., McQeeen, J., Greer, E., … Simmons, J. (2014). The persistent effect of race and the promise of alternatives to suspension in school discipline outcomes. Children and Youth Services Review, 44, 279-386.
Copyright Disclaimer
Copyright for this article is retained by the author(s), with first publication rights granted to the journal.
This is an open-access article distributed under the terms and conditions of the Creative Commons Attribution license (http://creativecommons.org/licenses/by/3.0/).