evolving a real-time evacuation for urban disaster management
TRANSCRIPT

Evolving a Real-time Evacuation for Urban DisasterManagement
Keith J. DrewUniversity of Idaho
895 Perimeter DriveMoscow, Idaho 83844
Robert B. HeckendornUniversity of Idaho
895 Perimeter DriveMoscow, Idaho 83844
Ahmed Abdel-RahimUniversity of Idaho
895 Perimeter DriveMoscow, Idaho 83844
[email protected] Pydi Kumar Marisetty
University of Idaho895 Perimeter Drive
Moscow, Idaho [email protected]
Anton StalickUniversity of Idaho
895 Perimeter DriveMoscow, Idaho 83844
ABSTRACTIn an urban disaster it is important to efficiently evacuatepeople to safety. We use evolution strategies and a probabil-ity model to route the population by optimizing their safety.The algorithm is designed to use the strengths of evolution-ary computing to repeatedly optimize an evacuation underthe dynamics of a disaster such as accidents blocking crit-ical roadways, bridge collapses, debris closures, changes insafety, and people not following evacuation directions. Ourmodel is unconcerned with specific evacuation routes butrather evolves a robust cloud of probabilities to representbest directions of escape. We show that maintaining a pop-ulation of diverse solutions may allow for rapid adaptation asa disaster unfolds. The core optimization algorithm is testedusing challenging test cases as well as real-world data.
KeywordsEvacuation Planning; Evolution Strategies; Traffic Conges-tion, Safety Optimization, Traffic Assignment
1. INTRODUCTIONNatural and man-made disasters can rapidly render por-
tions of large urban areas unsafe for people. To save lives,emergency managers may order time sensitive evacuationfrom unsafe areas. This can lead to overloading of trans-portation networks resulting in the failure to evacuate all ofthe population from the unsafe areas and large loss of life.Even if an evacuation is planned for long before it is needed,numerous unforeseen events may occur during the evacu-ation such as accidents blocking critical roadways, bridgecollapses, debris closures, and flooding can cause evacuationfailure and loss of life. Changes in safe zones can occur as
Permission to make digital or hard copies of all or part of this work for personal orclassroom use is granted without fee provided that copies are not made or distributedfor profit or commercial advantage and that copies bear this notice and the full cita-tion on the first page. Copyrights for components of this work owned by others thanACM must be honored. Abstracting with credit is permitted. To copy otherwise, or re-publish, to post on servers or to redistribute to lists, requires prior specific permissionand/or a fee. Request permissions from [email protected].
GECCO ’17, July 15-19, 2017, Berlin, Germanyc© 2017 ACM. ISBN 978-1-4503-4920-8/17/07. . . $15.00
DOI: http://dx.doi.org/10.1145/3071178.3071254
well such as failure to predict the level of storm surge ina hurricane or wind changes in a poison gas leak. Finally,the human factor of people simply not following evacua-tion instructions may also lead to the need to repeatedlyre-optimize to avoid congestion resulting in loss of life.
Unlike some previous work, we see the evacuation problemnot as getting individuals to their predefined safe destina-tions, nor as distributing the people across a small set ofsafe destinations but rather as getting people to regions ofsafety indicated by the level of safety of the nodes in thetransportation network. For example, the problem may beto get people to the half of the city that is higher groundor safety may even be equated with elevation of each inter-section above sea level. Often city emergency planners havesafety maps for various scenarios. There is also a capacityconstraint on nodes so that solution must conform to physi-cal capacities of nodes and edges. We use both real and testcity networks. Traffic congestion is modeled using classicaltraffic formulas. This problem specification is very generalin that we optimize routing based on a arbitrary safety func-tion which can be established for each type of event and sois not necessarily limited to disasters, although this paperfocuses on evacuation planning and response.
We approach the problem of evacuation as a dynamicproblem that needs to be repeatedly solved as a disasterunfolds to handle the unforeseen changes in the problemparameters. This we feel is an added strength of an evolu-tionary solution. A diverse population in nature or in silicomaintains a set of contingent genes that help it adapt tochanging environments. We will attempt to exploit this.
Our solution is to treat the evacuation as a problem ofoptimizing the sum of the safety of all the people at a timet. While more complex and interesting optimizations can bedone, we believe that this building block optimization is the“proof of concept” we will base future work upon. We use anevolutionary approach in which we maintain a population ofpotential solutions and evolve an evacuation plan (see detailsbelow). We hypothesize first: that with an effective evacua-tion representation, we can efficiently solve a wide variety ofevacuation scenarios using an Evolution Algorithm. Second,if during the evacuation unexpected changes in the trans-portation network, the safety of regions, or the evacuee’sposition occurs, the population of evacuation plans in the
1089

algorithm can be used to more quickly compute a responseto the change than if the response was evolved from a restartof the optimization. That is, as one would expect, the pop-ulation acts as a reservoir of innovation for the adapting ofan evacuation to changing conditions. Experiments are per-formed on a variety of problems to test and support bothhypotheses.
We proceed as follows: Section 2 discusses previous work,Section 3 discusses our algorithm, Section 4 describes in de-tail a suite of different problems to challenge our algorithm,and Section 5 presents a summary of conclusions.
2. BACKGROUNDEvacuation planning is not a new topic. Previous work has
addressed problems varying from room or building evacua-tion [1], [2], to city or region evacuation [3], [4], [5]. Opti-mizing traffic while considering the dynamics of traffic in-teraction (e.g. congestion [6]) is known as Dynamic TrafficAssignment (DTA) [7]. Our approach models evacuation asa DTA problem with the single objective of optimizing thesafety of the evacuees. Some authors consider evacuation asa multi-objective optimization problem [8], [9].
Saadatseresht et al. optimize evacuation with respect tocapacity and nearness of safety zones, while Yuan and Hansuggest that evacuation is an inherently multi-objective op-timization problem, and recommend optimizing space-basedrisk and travel time.
Stepanov and Smith also approach evacuation planningas a multi-objective optimization problem in [10], wherethey use Integer Programming instead of evolution. A route-based approach is used. This has the limitation of having toestablish routes for each individual, creating a specific solu-tion that may be ignored.
Attempts have been made at handling roadway congestionusing genetic algorithms, as well. In Dezani et al. [11], Petrinet analysis is used to evaluate fitness in a GA designedto optimize routes for urban traffic, strictly to reduce road-way congestion in real-time. Their approach is not multi-objective, and optimizes routes for shortest time. However,their approach also focuses on route-based solutions for indi-viduals, and optimizes for minimization of travel time alone.
Our solution focuses on safety optimization, without de-termining routes for each traveler. This provides a general-ization for DTA, removing the requirement that each vehiclefollow a specific path.
3. APPROACHWe use an Evolution Strategy (ES) [12] to evolve sets of
probabilities that determine the probability pne of traffic atnode n exiting on edge e with the constraint that∑
e∈E(n)
pne ≤ 1 ∀ n (1)
where E(n) is the set of edges leaving node n. The amountof probability left between the sum above and 1 is the proba-bility of remaining at that node before trying again to leavethe node. The fixed cycle-time is specified for each nodewhen the node is defined. This approach does not build ex-plicit routes but rather relies on probabilistic routing at eachintersection to move traffic to safety. An advantage of thisis that local information about the best route to safety isstored at each intersection. The disadvantage is that in this
first implementation, the probabilities are static and onlychange with re-optimization.
The genome for the ES is the vector of the probabilitiesgiven by the list of pne ∀ n. Fitness at time t is computed:
fitness(E, t) =1
||E||∑a∈E
S(L(a, t)) (2)
where E is the set of all evacuees, t is time, S(`) is the safetyof location `, and L(a, t) is the location of agent a at timet which can be a node or edge. Because this is an averageof safeties, the fitness may make trade-offs based on levelof safety across the whole population. This is a practicalconsideration for the user of the application.
We chose to use an ES(µ + λ) algorithm. For many ofour tests we used, µ = 100, λ = 100, and σ = 0.1 (see spe-cific test results). Using the + operator, the child populationcompetes against the parent population for survival. This isperformed using a simple sort operation, followed by removalof individuals with the lowest λ fitness scores. Mutationprobability Pmutation for a selected genome is 0.5 for eachreal number in the genome. Mutation happens by mutat-ing the value by a normal distribution with σ. Unlike manyES there is also crossover with probability Pcrossover = 0.2.Crossover is uniform crossover respecting that all probabili-ties for a given node change together.
It is important to note that time appears in two contextsin this paper. First, simulation time refers to the amountof time simulated during a fitness evaluation (the t in 2).Second, the amount of real-world time it takes to run themodel for a given problem, referred to as wall-clock time.
3.1 The SLang LanguageWe developed a language called SLang (Simulation Lan-
guage) that can be used to specify cities and optimizationsso that tests can be easily generated, run, saved and shared.SLang is used to specify such things as city topology, thelevel of safety of intersections, and agent distribution. SLangalso specifies experiment parameters for the evolution strat-egy algorithm and simulation of traffic. SLang is also usedto control I/O features of the code.
SLang commands are used to specify all necessary infor-mation needed by a model. Therefore, in our model we useSLang to indicate ES parameters such as population size,σ and the maximum number of generations. SLang is alsoused to specify the traffic network data, indicating freeflowtime, simulation time, and more.
3.2 SimulationDuring simulation agents move through the provided topol-
ogy, according to the current set of probabilities being eval-uated. Agents are stored in a priority queue, sorted by timeof next arrival at an intersection. Time progresses in stepsgoverned solely by the next arrival at a intersection.
The simulation operates by dequeuing an agent from thequeue, checking the arrival time of that agent compared tothe current time in the simulation, selecting the next edgethat agent will take based on the probabilities for the nodethe agent is currently at, calculating the traversal time of theselected edge, then re-queuing the agent. This cycle repeatsuntil the next agent in the priority queue has an arrival timeexceeding the total simulation time (see Figure 1).
We defined the travel time t between nodes using the clas-
1090

Figure 1: A diagram of the how time progresses us-ing a priority queue, during simulation.
sic Bureau of Public Roads (BPR) formula [13]:
t = f + b
(c
cmax
)β(3)
where f is freeflow time of the edge, which is the time re-quired to travel the edge in ideal conditions, typically mean-ing no other traffic. For our simulations all time is mea-sured in hours. c is the current number of evacuees onthe edge, while cmax is the maximum number of evacueesthat the edge can handle per unit time (hour). This is acombination of speed limit, number of lanes, road condi-tion, and length of road. b and β are tuning variables usedto fit real data measured from actual roadways. For our pur-poses we used the default values of b = 4.00, β = 0.15, andcmax = 1000 but is dependent on road size, speed limit andlength. Note that the formula does not include explicit dis-tance or speed limit values, as those values are implied bythe freeflow value, f , as a result of t = distance/speed.
Historically, in normal traffic conditions with working traf-fic lights, cmax must account for total throughput per unittime. For instance, the value is reduced from 1000 by a pro-portion equivalent to the proportion of ”green time” of thetraffic light at the intersection.
Once the simulation is complete, the set of probabilitiesused in the simulation are evaluated for their fitness. Fitnessis a sum of the safety of all the agents (see Equation 2). Themaximum safety for any location is 1.0. Because fitness iscurrently evaluated only at the end of the simulation, fitnessis a measure of safety at a specified time t.
This fitness function was chosen to allow adaptability toany disaster since safety can be designated by any factor.For example, a flood or tsunami event might measure safetyas both distance from the event, as well as elevation. Anearthquake may quantify safety as distance from tall struc-tures or other hazards. Some events will use distance alone,but other events may have more complex safety functions.
In summary, a fitness evaluation is computed as follows:
1. InitializationThe set of probabilities to be evaluated is loaded intothe city topology; the city has been defined in SLangprior to any fitness evaluations and the set of proba-bilities must match that topology.Agents are initialized in their starting locations andtimes; their initialization values are specified in SLangbefore any fitness evaluations are made. Typically, agentsare initialized with an arrival time of zero seconds.Finally, the current time is set to zero seconds. This
value is replaced with each next agent evaluated, andis replaced with the next agent’s arrival time.
2. SimulationThe main activity during simulation consists of pop-ping agents from the priority queue one at a time,evaluating their next move and arrival time at thenext node, and replacing them in the priority queue atthe appropriate location. In the case where an agentchooses to stay in a node, the agent’s next time of ar-rival is specified by the node’s wait time field, and isgenerally fixed.
3. FitnessThe fitness of the set of probabilities is calculated whenthe simulation time has expired, using Equation 2.
4. EXPERIMENTSA series of experiments were performed to test our soft-
ware and hypotheses. The tests included validation teststo show that the code works in simple transparent problems,dynamic tests to show that the code can use populationsto adapt to changing problem parameters such as capac-ity, comparison tests to compare our work to the workof others, and scaling tests to see if the code will workfor topologies and traffic found in a real city. While we ranmany tests, due to publication size, only a subset of tests isgiven in this paper.
4.1 Validation TestsTo validate our model we performed a variety of simple
transparent tests. First, we created a test with a 5×5 grid,with all edge and node variables equal. Agents were initial-ized to begin in the top left corner of the grid, while safetywas only in the two nodes in the bottom right of the grid(see Figure 2). The program quickly routed all evacuees tosafety.
Figure 2: Simple 5×5 grid validation test. The heavierweight edges in the figure show higher probabilities.The thinnest lines are generally very near zero butare just drawn to show the topology. The numbersin the nodes are level of safety. Unless otherwisestated, best case of several is shown.
To validate our model we tested that capacity and freeflowconstraints effected our results as expected. We recorded thepath to safety indicated by highest probabilities calling it theselected path. We then repeat the experiment by creating a
1091

single path from danger to safety by reducing the freeflowtime of the edges along the selected path, while increasingfreeflow along every other edge in the graph the path is easilyfound, as it should be. Similarly, if we increase maximumcapacity along the selected path, while decreasing maximumcapacity along all other edges, the path is again easily found.
We then constructed a maze as seen in Figure 3. Thepath indicated in the figure was marked in one test by highcapacity and marked by low freeflow time in the other test.Notably the safety was zero except for the safe zone at theend. Both tests found the easier routes highlighted in thefigure. As the number of evacuees increases past the limit ofthe easy path side streets become used to share the load.
Figure 3: A cartoon of 5×5 maze test showing theroute of least resistance. In this case, these are not aprobabilities but rather just an indication of wherewe tried to make the roads faster or higher capacity.
4.2 Dynamic TestsThe following experiments test if our model accommo-
dates dynamic events during an evacuation. We hypothesizethat if probability distributions are optimized in advance,they can be used to initialize an evolution strategy (ES)to reduce optimization time, both in real time, and num-ber of generations without loss of accuracy. The results ofthese tests demonstrate that pre-optimization leads to fasteradaptability in response to real-time events. This is a veryimportant feature for a real-world evacuation manage-ment system.
For these experiments we make several assumptions. First,we assume changes are not significantly large. We assume analgorithm’s population will have genetic contingency infor-mation usable for similar problems. For example, we assumethat from one optimization to the next during an evacua-tion, we won’t suddenly switch from West side of the cityis safe to East side is safe. In fact, in such a case wherethe graph characteristics have been changed significantly,re-optimization using a previous solution may take signifi-cantly longer than using random initialization. The eventswe are concerned with are changes in topology, safety zones,capacity, and agent distribution.
To test our hypothesis, we perform two initial optimiza-tions (case 1) we optimize a population of solutions that areinitialized with random values for the initial graph config-uration and (case 2) we optimize a population of solutionsthat are initialized with random values for the graph config-
uration after some change in topology, safety, capacity, or ve-hicle distribution has been modified. Finally, (case 3) we usethe final population from the first optimization to initializethe starting population used to optimize the second graphconfiguration. Results will be labeled 1, 2, or 3 correspondingto the three different cases. For each test, the ES parame-ters were kept the same for the sake of comparison. Theparameters are ES(100 + 100), Pcrossover = 0.2, Pmutation =0.5, σ = 0.1
4.2.1 Adapting to Capacity ChangesDuring an evacuation event a roadway may see a change in
capacity as a result of becoming partially blocked by debris,accidents in one or more lanes on a multi-lane road, or as aresult of other unpredictable events. In such a case our modelmust be able to quickly adapt through re-optimization. Wepredict that using pre-optimized traffic probability distribu-tions will allow for quick adaptation. To test this predictionwe run three tests. First, we create a topology with a max-imum capacity of 1000 agents per unit time for all edges,G1. Next, we create a topology that is identical, except thatmaximum capacity is lowered by 100 for each edge, G2.
We then optimize both of these graphs using our modelsand record the average number of generations until max-imum fitness is achieved. We also store the population ofsolutions found from G1, as they will be the starting popu-lation for optimization in the next test. For the third partof the test we re-optimize G2, starting with the solutionsfrom G1. We record and compare the number of generationsneeded to reach maximum fitness below. The probabilitiesare graphically represented in Figures 4 and 5. Since thelandscape is flat and load is light, many evacuations plansare equivalent and so variation in the probabilities occur.Solution time is shorter in case 3. Results are shown Table1.
Figure 4: 5×5 capacity test results for case 1.
4.2.2 Adapting to Topology ChangesAnother event that might occur during an evacuation is
a change in topology, meaning some route or partial routebecomes unusable, such as a bridge collapse or a road becom-ing flooded or completely blocked by debris. It is importantthat our model handles such changes quickly. We make asimilar prediction to the capacity change test as well. Notethat a change in topology is a more extreme version of achange in capacity where maximum capacity is reduced to
1092

Figure 5: 5×5 capacity test results for case 2.
zero for a roadway. We again run three tests but using thebridge topology. The first test is on G1, which representsthree bridges connecting two areas, with safety being on theside opposite where vehicles are started for these tests (SeeFigure 6). G2 for this test is identical to G1, except with anedge on the center ”bridge” removed representing a collapse.The first two graphs are optimized from random traffic as-signment probabilities. We then use the solutions from theoptimization of G1 to optimize G2, and record the number ofgenerations for comparison (See 7). Results are shown Table1. Solution quality is similar but time to solve is substan-tially shortened.
Figure 6: The three bridge test. Probabilities forbridge intact and random initialization.
4.2.3 Adapting to Agent Distribution ChangesIn an evacuation, it is expected that individual drivers
will ignore evacuation instructions and instead upon arriv-ing at and intersection rely on their experience driving inthe area. This is expected because people are under stressand optimal traffic assignments may produce non-intuitiveresults in an attempt to balance traffic load on many streetsat once. In such cases, we must adapt and adjust based onwhere vehicles actually are not where we expect them tobe. This is another reason why it is crucial to continuallyre-optimize to adapt to the unforeseen. We make a similarprediction here - our model will find an optimal solutionfaster if initialized with a pre-computed solution for a sim-ilar traffic distribution. Again, we use three tests. All tests
Figure 7: The three bridge test. Probabilities forbridge destroyed and population initialized withpopulation from previous solution.
use an identical topology, but G1 has traffic distributed dif-ferently than G2. The first two runs optimize for differenttraffic distributions, starting with randomized traffic assign-ment probabilities. The third run uses the optimized trafficassignment probabilities from the first test, but with thetraffic distribution of the second run. The traffic probabilitydistributions are qualitatively not different but the time tosolve is much lower. Results are shown in Table 1.
4.2.4 Adapting to Safety ChangesDuring many evacuation events, the threat creating the
need for evacuation is not static. Examples include hurri-canes, floods, tsunamis, poison gas. As a result of the dy-namic nature of the threat, it is imperative that our modelhandles changes in safe areas quickly. We predict that ourmodel handles changes in safety quickly, again provided thechange is not too great. Three runs are used to performthis experiment. The first and second are again identical intopology (see Figure 8). In the case 3 test the safe nodesmove over one node (see Figure 9). The optimized trafficassignment probabilities from run one are used to initial-ize the third run, which has safety in the same location asrun two. Results are shown Table 1. Safety was easily solvequickly. Perhaps a more difficult safety test will tease outthe difference between case 1 and 3 for this problem.
Figure 8: 5×5 safety test for case 1.
1093

Figure 9: 5×5 safety test for case 3.
Table 1: Generations to Complete Optimizations inDynamic Tests: Capacity, Topology, Agents, Safety.In all cases the suffix numbers 1, 2, or 3 representthe three cases in each of the dynamic tests. 100 runsof each case were performed. “Gens” is generationsand thours is the simulated time.
Test Avg. Gens σGens Avg. Fit σfit thoursCapacity1 47.75 5.208 1.0 0.0 1.0Capacity2 55.1 6.64 1.0 0.0 1.0Capacity3 4.35 2.19 1.0 0.0 1.0Topology1 73.54 15.835 1.0 0.001 0.5Topology2 69.92 13.9 0.998 0.009 0.5Topology3 7.01 4.574 1.0 0.0 0.5Agents1 77.99 9.605 0.999 0.003 0.7Agents2 89.69 8.577 0.998 0.004 0.7Agents3 30.5 8.325 1.0 0.0 0.7Safety1 43.02 8.359 1.0 0 1.0Safety2 40.855 8.2 1.0 0 1.0Safety3 34.5 4.574 1.0 0 1.0
4.2.5 SummaryIn the dynamic tests we adjusted one of four attributes to
represent events that can change a transportation network inan evacuation. Graphs shown in Figure 11 show that primingthe population with a population that produced a successfulsolution for the pre-event problem produces a solution morequickly than just starting the optimization over. Figure 10shows the quality of the answers is substantially the same.We believe that as long as the change is modest the popu-lation contains “contingency genes” that will help speed theadaption to the new problem. These results are encouraging,but we are following with more focused tests in our futurework.
4.3 Comparison TestHere we compare our model to the approach used by Baz-
zan et al. in [3]. In their paper they seek to minimize aver-age travel time by evolving traffic assignments through thenetwork, given a set of vehicles, origin/destination pairs forthose vehicles, and a set of k shortest paths. They use a clas-sic graph from [14], (see Figure 12) with the freeflow timesspecified. The way we model capacity is different, but com-
Figure 10: A comparison of the quality of answers forthe four dynamic tests. This indicates the answersare of comparable quality.
parable. We seek to compare our results to provide somecontext of how our model holds up compared to other work.
In their experiment they run k origin/destination pairs,with k ranging from 2 to 16. We compare to the case wherek = 4. We run our experiment with two vehicle origin nodes,corresponding to their origins, with two safe nodes, corre-sponding to their destinations. We let our model optimizefor safety, and provide the results and comparison below.Their evacuation (network clearance) time is significantlylower. We believe this is probably due, in part, to differ-ences vehicle scheduling and is an area for future analysis.While our model does implicitly find routes to safety, theroutes found are not as fast as those found by Bazzan et al.The average time to safety (TTS), with standard deviationis shown in Figure 13.
4.4 Scaling TestsTo test the ability of our model to handle real-world urban
evacuation problems, we used traffic model data for Boise,Idaho, a city with approximately 650,000 people. Our goalwas to discover the wall-clock time it takes to optimize sucha city, using our model. For this experiment we made simpleassumptions about graph properties where we didn’t haveaccurate data (freeflow time, maximum capacity, etc). Ourdata includes 283 nodes with 457 edges. These do not repre-sent every road and intersection in Boise, but rather manyof the artery roads and feeders (see Figure 14). We believethe vast majority of the evacuee’s time will be spent on theseroads and so the test is a realistic estimation of evacuationtime. We feel that Boise is a good representation of a realexample, as it includes a mix of urban downtown areas andsuburban neighborhoods.
We ran a set of 6 experiments 10 times each, and averagedthe wall-clock time each experiment took. Each experimentused the same ES and city parameters, varying only in theway and number vehicles were distributed. Each experimentwas initialized with a base-set of agents (representing 10 ve-hicles each) at each node. This base-set is used to ensureagents begin at every node, thereby applying evolutionarypressure across the whole genome. Not applying pressureto probabilities at each node could produce dangerous re-
1094

(a) Capacity (b) Topology
(c) Agents (d) Safety
Figure 11: The speed of solution for the four dynamic tests and across cases 1, 2, and 3. Generations alongX-axis and fitness along Y-axes. Values averaged over 100 runs.
Figure 12: The network from Bazzan et al. 2014.
sults in a real-world application, as nodes may end up withtraffic assignments that are no better than random. Vehiclegroup starting locations are random in each test. Vehiclesare grouped to improve run time. Each experiment simu-lated one hour of traffic. The number vehicles, number ofgroups, size of each group, and wall-clock run time are shownfor each experiment in Table 2. The experiment shows thatfor a real world city of over a half-million people executiontimes on the order of minutes is a reasonable expectation.
5. CONCLUSIONSIn conclusion, we have evolved static probability distri-
Figure 13: Performance of our algorithm on the Baz-zan test averaged over 100 trials.
butions that are shown to provide routing to safe areas inreasonable time. Further, the solutions used are provided asinitializations for evacuation parameter changes, which re-duce the optimization times of the updated scenarios. Thismakes an evolution based real-time continuous optimizationof an evacuation feasible. The main advantages of our pro-posed model includes a robust method for adapting to thedynamic conditions of a real disaster, relatively fast compu-tation time, and robustness achieved through both evolution
1095
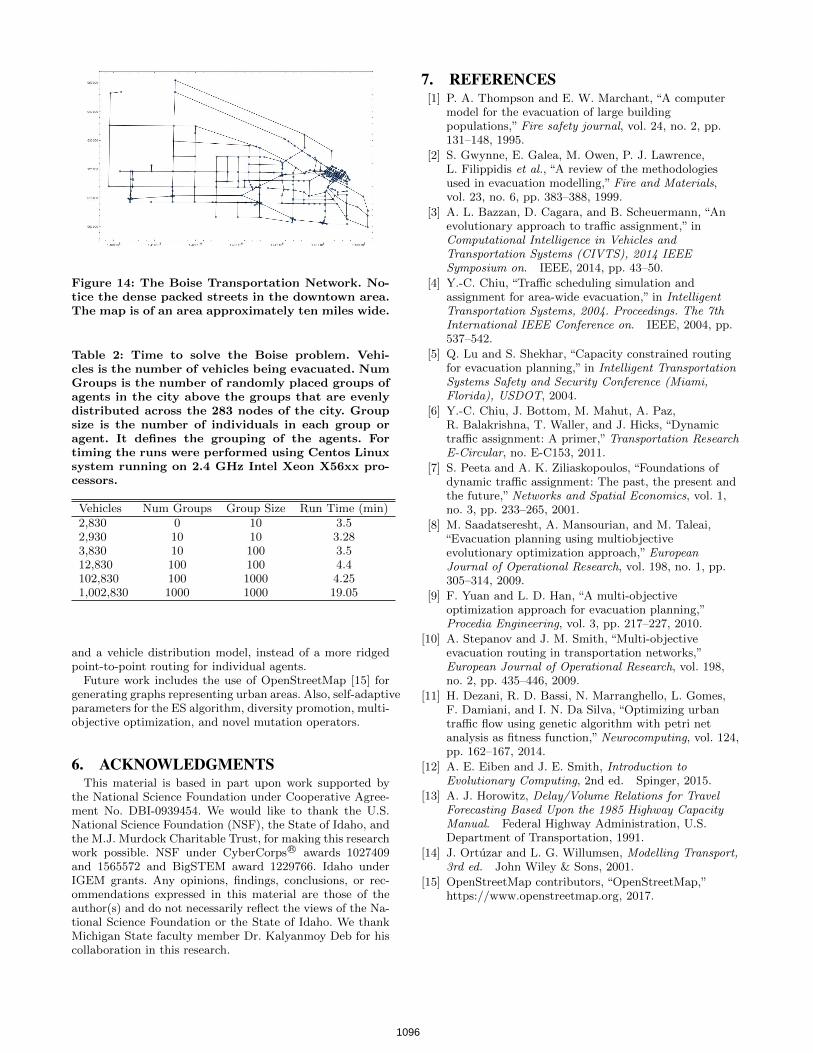
Figure 14: The Boise Transportation Network. No-tice the dense packed streets in the downtown area.The map is of an area approximately ten miles wide.
Table 2: Time to solve the Boise problem. Vehi-cles is the number of vehicles being evacuated. NumGroups is the number of randomly placed groups ofagents in the city above the groups that are evenlydistributed across the 283 nodes of the city. Groupsize is the number of individuals in each group oragent. It defines the grouping of the agents. Fortiming the runs were performed using Centos Linuxsystem running on 2.4 GHz Intel Xeon X56xx pro-cessors.
Vehicles Num Groups Group Size Run Time (min)2,830 0 10 3.52,930 10 10 3.283,830 10 100 3.512,830 100 100 4.4102,830 100 1000 4.251,002,830 1000 1000 19.05
and a vehicle distribution model, instead of a more ridgedpoint-to-point routing for individual agents.
Future work includes the use of OpenStreetMap [15] forgenerating graphs representing urban areas. Also, self-adaptiveparameters for the ES algorithm, diversity promotion, multi-objective optimization, and novel mutation operators.
6. ACKNOWLEDGMENTSThis material is based in part upon work supported by
the National Science Foundation under Cooperative Agree-ment No. DBI-0939454. We would like to thank the U.S.National Science Foundation (NSF), the State of Idaho, andthe M.J. Murdock Charitable Trust, for making this researchwork possible. NSF under CyberCorpsR© awards 1027409and 1565572 and BigSTEM award 1229766. Idaho underIGEM grants. Any opinions, findings, conclusions, or rec-ommendations expressed in this material are those of theauthor(s) and do not necessarily reflect the views of the Na-tional Science Foundation or the State of Idaho. We thankMichigan State faculty member Dr. Kalyanmoy Deb for hiscollaboration in this research.
7. REFERENCES[1] P. A. Thompson and E. W. Marchant, “A computer
model for the evacuation of large buildingpopulations,” Fire safety journal, vol. 24, no. 2, pp.131–148, 1995.
[2] S. Gwynne, E. Galea, M. Owen, P. J. Lawrence,L. Filippidis et al., “A review of the methodologiesused in evacuation modelling,” Fire and Materials,vol. 23, no. 6, pp. 383–388, 1999.
[3] A. L. Bazzan, D. Cagara, and B. Scheuermann, “Anevolutionary approach to traffic assignment,” inComputational Intelligence in Vehicles andTransportation Systems (CIVTS), 2014 IEEESymposium on. IEEE, 2014, pp. 43–50.
[4] Y.-C. Chiu, “Traffic scheduling simulation andassignment for area-wide evacuation,” in IntelligentTransportation Systems, 2004. Proceedings. The 7thInternational IEEE Conference on. IEEE, 2004, pp.537–542.
[5] Q. Lu and S. Shekhar, “Capacity constrained routingfor evacuation planning,” in Intelligent TransportationSystems Safety and Security Conference (Miami,Florida), USDOT, 2004.
[6] Y.-C. Chiu, J. Bottom, M. Mahut, A. Paz,R. Balakrishna, T. Waller, and J. Hicks, “Dynamictraffic assignment: A primer,” Transportation ResearchE-Circular, no. E-C153, 2011.
[7] S. Peeta and A. K. Ziliaskopoulos, “Foundations ofdynamic traffic assignment: The past, the present andthe future,” Networks and Spatial Economics, vol. 1,no. 3, pp. 233–265, 2001.
[8] M. Saadatseresht, A. Mansourian, and M. Taleai,“Evacuation planning using multiobjectiveevolutionary optimization approach,” EuropeanJournal of Operational Research, vol. 198, no. 1, pp.305–314, 2009.
[9] F. Yuan and L. D. Han, “A multi-objectiveoptimization approach for evacuation planning,”Procedia Engineering, vol. 3, pp. 217–227, 2010.
[10] A. Stepanov and J. M. Smith, “Multi-objectiveevacuation routing in transportation networks,”European Journal of Operational Research, vol. 198,no. 2, pp. 435–446, 2009.
[11] H. Dezani, R. D. Bassi, N. Marranghello, L. Gomes,F. Damiani, and I. N. Da Silva, “Optimizing urbantraffic flow using genetic algorithm with petri netanalysis as fitness function,” Neurocomputing, vol. 124,pp. 162–167, 2014.
[12] A. E. Eiben and J. E. Smith, Introduction toEvolutionary Computing, 2nd ed. Spinger, 2015.
[13] A. J. Horowitz, Delay/Volume Relations for TravelForecasting Based Upon the 1985 Highway CapacityManual. Federal Highway Administration, U.S.Department of Transportation, 1991.
[14] J. Ortuzar and L. G. Willumsen, Modelling Transport,3rd ed. John Wiley & Sons, 2001.
[15] OpenStreetMap contributors, “OpenStreetMap,”https://www.openstreetmap.org, 2017.
1096