evolution of cooperation through graduated punishment€¦ · me ensinaram, por nunca me terem...
TRANSCRIPT

Evolution of Cooperation through Graduated Punishment
Marta Gomes da Cunha Couto
Thesis to obtain the Master of Science Degree in
Engineering Physics
Supervisors: Prof. Francisco João Duarte Cordeiro Correia dos SantosProf. José Luís Rodrigues Júlio Martins
Examination Committee
Chairperson: Prof. João Pedro Saraiva BizarroSupervisor: Prof. Francisco João Duarte Cordeiro Correia dos Santos
Member of the Committee: Prof. Jorge Miguel Ramos Domingues Ferreira Vieira
November 2018

ii

We can never do merely one thing.
G. Hardin, 1963
iii

iv

Acknowledgments
Professores Francisco e Jorge, obrigada por todo o apoio, inspiracao, motivacao e simpatia. Foi otimo
te-los como orientadores.
Mae e Pai, obrigada pelo vosso amor, mimo e dedicacao. Obrigada por serem os meus melhores
exemplos, por me terem mostrado o mundo de todas as formas que vos foram possıveis, por tudo o que
me ensinaram, por nunca me terem deixado sentir sozinha. Antonio Pedro, obrigada por seres o meu
companheiro, nada iguala o sentimento que e saber ter-te como irmao. Obrigada aos tres por serem a
minha Casa, sempre.
Pedro, obrigada pelo teu amor, amizade, fonte inesgotavel de paciencia e por me fazeres sentir
importante.
Francisco, Barbara e Francisco Pipa, obrigada por terem sido os meus companheiros de mestrado
e, principalmente, meus amigos.
Avos queridos, Albano, Alice, Couto e Lulas, obrigada por me darem duas segundas Casas.
A todos os familiares, amigos, professores que, de alguma forma, fizeram parte do meu caminho
ate agora, um sincero obrigada.
v

vi

Resumo
Compreender os mecanismos que promovem e mantem a cooperacao e reconhecido como um prob-
lema teorico central. Saber como a especie humana deve cooperar podera ajudar a resolver questoes
complexas globais como a protecao ambiental, a qual requer esforcos coletivos. A presente dissertacao
de mestrado foca-se no papel das punicoes graduais, geridas por instituicoes, na emergencia de
cooperacao em dilemas sociais. Estudos anteriores analisaram o efeito de punicoes estritas (ou in-
condicionais) em jogos de bem publico e dilemas de risco coletivo. Contrariamente, punicoes graduais
consistem em sancoes cuja severidade e gradualmente ajustada segundo o estado do sistema. Este
tipo de punicao e um princıpio fundamental observado empiricamente em sistemas de recursos comuns
que sao casos de sucesso. Usando Teoria de Jogos, Dinamica Evolutiva e Processos Estocasticos,
propoe-se um novo modelo de evolucao em populacoes finitas, onde os indivıduos participam em jo-
gos a N pessoas com tres estrategias possıveis — cooperador, desertor e punidor. Conclui-se que as
punicoes graduais promovem e preservam a cooperacao melhor do que as estritas. Esta melhoria e
realcada se tambem os custos necessarios para estabelecer a instituicao externa forem graduais. Para
alem disso, instituicoes locais sao mais efetivas do que uma global. Por fim, considerando recompensas
em vez de punicoes, provamos que tambem estas devem ter um carater gradual.
Palavras-chave: evolucao da cooperacao, dilema de risco coletivo, punicao gradual, gestao
ambiental
vii

viii

Abstract
Understanding the mechanisms that promote and maintain cooperative behavior is widely recognized
as a major theoretical problem. Knowing how human beings should cooperate may help us to address
real global and complex issues, like environmental protection, which demand a collective commitment.
The present study focuses on the role of graduated punishment conducted by self-organized institutions
in the emergence of cooperation in social dilemmas. Previous studies analyzed the effect of strict (un-
conditional) punishment in Public Goods Games and Collective Risk Dilemmas. Oppositely, graduated
punishment consists of a sanction whose severity is gradually adjusted to the collective returns. This
type of sanctioning system is a design principle empirically observed in long-enduring common-pool
resource institutions. Using Game Theory, Evolutionary Dynamics and Stochastic Processes, we pro-
pose a new model of evolution in finite populations, where individuals engage in N-person games with
three possible strategies — cooperator, defector, and (graduated) punisher. We conclude that gradu-
ated punishment is better at promoting and preserving cooperation than a strict form of punishment. This
improvement is enhanced if the costs required to maintain the external sanctioning institution are also
graduated. Plus, local institutions are more effective than a global one. Finally, if rewards are considered
instead of punishment, we show that they should be graduated as well.
Keywords: evolution of cooperation, collective risk dilemma, graduated punishment, climate gov-
ernance
ix

x
Contents
Acknowledgments . . . . . . . . . . . . . . . . . . . . . . . . . . . . . . . . . . . . . . . . . . . v
Resumo . . . . . . . . . . . . . . . . . . . . . . . . . . . . . . . . . . . . . . . . . . . . . . . . . vii
Abstract . . . . . . . . . . . . . . . . . . . . . . . . . . . . . . . . . . . . . . . . . . . . . . . . . ix
Table of Contents . . . . . . . . . . . . . . . . . . . . . . . . . . . . . . . . . . . . . . . . . . . . xi
List of Figures . . . . . . . . . . . . . . . . . . . . . . . . . . . . . . . . . . . . . . . . . . . . . xiii
Abbreviations . . . . . . . . . . . . . . . . . . . . . . . . . . . . . . . . . . . . . . . . . . . . . . xv
Nomenclature . . . . . . . . . . . . . . . . . . . . . . . . . . . . . . . . . . . . . . . . . . . . . . xvii
1 Introduction 1
1.1 Motivation . . . . . . . . . . . . . . . . . . . . . . . . . . . . . . . . . . . . . . . . . . . . . 1
1.2 Objectives . . . . . . . . . . . . . . . . . . . . . . . . . . . . . . . . . . . . . . . . . . . . . 2
1.3 Thesis Outline . . . . . . . . . . . . . . . . . . . . . . . . . . . . . . . . . . . . . . . . . . 2
2 Background 3
2.1 Evolutionary Game Theory . . . . . . . . . . . . . . . . . . . . . . . . . . . . . . . . . . . 3
2.2 Evolutionary dynamics in infinite populations . . . . . . . . . . . . . . . . . . . . . . . . . 5
2.3 Mechanisms that promote cooperation . . . . . . . . . . . . . . . . . . . . . . . . . . . . . 6
2.4 Punishment . . . . . . . . . . . . . . . . . . . . . . . . . . . . . . . . . . . . . . . . . . . . 8
2.5 Climate Governance . . . . . . . . . . . . . . . . . . . . . . . . . . . . . . . . . . . . . . . 12
3 Methods 15
4 Results and Discussion 21
4.1 2-strategy Collective Risk Dilemma with punishment . . . . . . . . . . . . . . . . . . . . . 21
4.2 3-strategy Collective Risk Dilemma with punishment . . . . . . . . . . . . . . . . . . . . . 23
4.3 A different kind of incentive . . . . . . . . . . . . . . . . . . . . . . . . . . . . . . . . . . . 37
5 Conclusions 41
5.1 Achievements . . . . . . . . . . . . . . . . . . . . . . . . . . . . . . . . . . . . . . . . . . . 41
5.2 Future Work . . . . . . . . . . . . . . . . . . . . . . . . . . . . . . . . . . . . . . . . . . . . 42
Bibliography 43
xi

xii

List of Figures
2.1 Gradient of selection of a 2-strategy game for an infinite population. . . . . . . . . . . . . 6
2.2 Five mechanisms that favor cooperation. . . . . . . . . . . . . . . . . . . . . . . . . . . . . 7
3.1 Representation of a public good system with an external sanctioning institution. . . . . . . 16
3.2 Sanctioning policies. . . . . . . . . . . . . . . . . . . . . . . . . . . . . . . . . . . . . . . . 17
3.3 Update process diagram. . . . . . . . . . . . . . . . . . . . . . . . . . . . . . . . . . . . . 18
3.4 Phase space representation. . . . . . . . . . . . . . . . . . . . . . . . . . . . . . . . . . . 20
4.1 Gradient of selection and stationary distribution of 2-strategy games — Ds versus Ps and
Cs versus Ps — for different sanctioning policies. . . . . . . . . . . . . . . . . . . . . . . . 22
4.2 Gradient of selection and stationary distribution of 2-strategy games — Ds versus Ps and
Cs versus Ps — for different sanctioning policies (for a lower fine and no risk). . . . . . . . 23
4.3 Average group achievement ηG and institution prevalence ηI versus the risk r for different
sanctioning policies. . . . . . . . . . . . . . . . . . . . . . . . . . . . . . . . . . . . . . . . 24
4.4 Simplexes of CRD with three strategies for different sanctioning policies and local institu-
tions. . . . . . . . . . . . . . . . . . . . . . . . . . . . . . . . . . . . . . . . . . . . . . . . . 25
4.5 Simplex of CRD with three strategies for strict punishment and costs, and global institution. 27
4.6 Average group achievement ηG and institution prevalence ηI versus the graduateness of
the punishment/cost g for different sanctioning policies. . . . . . . . . . . . . . . . . . . . 27
4.7 Average group achievement ηG and institution prevalence ηI versus the contribution c for
different sanctioning policies. . . . . . . . . . . . . . . . . . . . . . . . . . . . . . . . . . . 28
4.8 Average group achievement ηG and institution prevalence ηI versus group size N for
different sanctioning policies. . . . . . . . . . . . . . . . . . . . . . . . . . . . . . . . . . . 29
4.9 Simplex of CRD with three strategies — large groups. . . . . . . . . . . . . . . . . . . . . 29
4.10 Average group achievement ηG and institution prevalence ηI versus institution threshold
nP for different sanctioning policies. . . . . . . . . . . . . . . . . . . . . . . . . . . . . . . 30
4.11 Simplexes of CRD with three strategies — dependence on nP . . . . . . . . . . . . . . . . 31
4.12 Average group achievement ηG, institution prevalence ηI and average fraction of Ds ver-
sus the PG threshold nPG for different sanctioning policies. . . . . . . . . . . . . . . . . . 32
4.13 Dependence of fines on public good threshold nPG. . . . . . . . . . . . . . . . . . . . . . 32
xiii

4.14 Average group achievement ηG, institution prevalence ηI and average fraction of Cs plus
Ps for different values of nPG and g. . . . . . . . . . . . . . . . . . . . . . . . . . . . . . . 33
4.15 Average group achievement ηG and institution prevalence ηI for different values of πf and
πt, for different sanctioning policies. . . . . . . . . . . . . . . . . . . . . . . . . . . . . . . 34
4.16 Average group achievement ηG and institution prevalence ηI versus intensity of selection
β for different sanctioning policies. . . . . . . . . . . . . . . . . . . . . . . . . . . . . . . . 35
4.17 Average group achievement ηG and institution prevalence ηI versus mutation probability
µ for different sanctioning policies. . . . . . . . . . . . . . . . . . . . . . . . . . . . . . . . 35
4.18 Simplexes of CRD with three strategies — dependence on µ. . . . . . . . . . . . . . . . . 36
4.19 Average group achievement ηG and institution prevalence ηI versus reward πr for different
rewarding policies. . . . . . . . . . . . . . . . . . . . . . . . . . . . . . . . . . . . . . . . . 38
4.20 Simplexes of the CRD with three strategies — rewards. . . . . . . . . . . . . . . . . . . . 39
xiv

Abbreviations
C Cooperator.
CPR Common Pool Resources.
CRD Collective Risk Dilemma.
D Defector.
EGT Evolutionary Game Theory.
IEA International Environmental Agreement.
P Punisher.
PD Prisoner’s Dilemma.
PG Public Good.
PGG Public Good Game.
R Rewarder.
xv

xvi

Nomenclature
β Intensity of selection
ηG Average group achievement
ηI Institution prevalence
µ Mutation probability (or exploration rate)
πf Fine
πr Reward
πt Tax
b Benefit of the PG
c Contribution to the PG
g Graduateness of punishment/costs
N Size of the group
nP Institution threshold (minimum number of punishers needed to sustain the sanctioning institution)
nPG PG threshold (minimum number of contributors needed to sustain the PG)
r Risk
Z Size of the population
xvii

xviii

Chapter 1
Introduction
1.1 Motivation
One of the biggest mysteries about human behavior is cooperation [1]. Perhaps surprisingly to some,
Physics may help solve this problem [2, 3] if we look at social systems as complex systems, where global
patterns and collective phenomena are more than the sum of individual contributions.
Cooperation is a concept that sounds quite familiar to us human beings. Nature and human life
show us every day that cooperation is in fact important. However, if we think thoroughly, the idea of
offering assistance to others is rather odd from a purely rational point of view. Why would one lose
something (like time, money or energy) to cooperate with a stranger? Or why should we pay taxes if we
know that many don’t but still benefit from the common goods? Why do we care to do well if that act
may represent a cost to ourselves? These questions reveal the conundrum associated with cooperation
[1], recently identified by Science’s invited panel of scientists as one of the major scientific challenges of
our century [4].
We see that cooperation is widespread in Nature at all scales and levels of complexity. Yet, we
also know that Darwin’s natural selection is about competition. In a nutshell, individuals are in conflict
(for instance, to get food or to mate), the stronger ones survive and, as a consequence, their genes
are preserved in the following generations. This is the so-called survival of the fittest. Natural selection
favors the selfish and strong even though cooperative interactions prevail in living systems. Cooperation
has been identified as the third building block of evolution, next to selection and mutation, working from
the level of cells to large societies [5].
Examples of egocentrism among human race history are abundant. That way of thinking led our
ancestors to conquer great achievements because being selfish meant also being self-protective. But
times have changed. Cooperation has proved to be a very efficient and much kinder way of thriving.
Yet, mankind is still much driven by individualistic instincts, often ignoring or not worrying about possible
collective consequences of our actions. Social injustice and environmental deterioration are the most
immediate and wicked examples.
The present challenge is to understand the mechanisms that enabled the emergence of cooperation
1
over time and hopefully apply the insights attained to human endeavors where cooperation is still not
achieved. It is thereby fundamental to understand the contexts that prevent selfishness and conflict while
allowing pro-sociality to be sustained (or induced, when absent).
1.2 Objectives
In this thesis, we study the impact and the emergence of different forms of institutional punishment in
the promotion of cooperation. Punishment should be regarded as a costly tool — applying sanctions
to cheaters bears a cost since it requires monitorization and the act of punishing itself. Agents must
be responsible for those sanctions, either directly (known as peer-punishment) or through an external
institution (known as pool-punishment). In the latter, an institution may apply a fixed fine to those who
do not contribute to the collective goals. It has been shown that such strict form of institutions helps
increasing cooperation in some scenarios [6]. However, as it represents a relatively high cost to one fac-
tion, a second-order dilemma arises, and the sanctioning institution may not be sustained. To overcome
this problem, here, we analyze the emergence of an alternative form of institutional sanctioning.
Inspired by the work of the late Nobel Prize Elinor Ostrom, who reported that many successful
communities apply graduated sanctions — a punishment whose severity is gradually adjusted to the
harm caused by the defector — in this thesis we would like to i) study the efficiency in the promotion
of cooperation of strict and graduated institutional systems, ii) understand how graduated punishment
may has co-evolved with cooperation, and iii) understand how we can apply these ideas to real issues
like the present worldwide problem of climate change and environmental protection. This is likely the
most critical collective dilemma we face [7–10], and the one where carefully designed institutions and
incentives may help us to coordinate efforts towards the preservation of the planet Earth.
The mitigation of the effects of dangerous climate change may be described through a Collective
Risk Dilemma (CRD), a threshold Public Good Game (PGG) with uncertain returns [9, 11]. Here, we
address the behavioral dynamics emerging from this dilemma in the presence of strict and different
forms of graduated punishment, developing a new theoretical framework employing evolutionary game
theory, combined with stochastic dynamics in finite populations.
1.3 Thesis Outline
We introduce the main topic of cooperation in Background, providing a theoretical overview of technical
tools that are especially useful for our study and stating some of the main methods and results found in
the literature. In Methods, the model is described in detail. Then, we present and explain our outcomes
in Results and Discussion. Finally, we emphasize the essential achievements and leave some notes on
future work in Conclusions.
2

Chapter 2
Background
In order to fulfill our goals, it is important that we start by defining cooperation and understanding how it
is studied. At the same time, we must situate our proposal within the group of mechanisms that promote
cooperation and, particularly, ascertain what has been elaborated about punishment. Also, as we aim at
applying our insights to climate agreements, it might be fruitful to include some notes on that topic too.
2.1 Evolutionary Game Theory
Cooperation is an interaction involving at least two individuals where an individual is ready to pay a
cost for others to have a benefit [12]. Cooperation can be conveniently formalized resorting to the
mathematics of Game Theory. First proposed in 1944 by John von Neumann and Oskar Morgenstern,
Game Theory is the formal way to quantitatively describe situations of conflict of interests. In their first
paper, von Neumann and Morgenstern claimed that they were about to ”establish a new exact science —
the science of economics” [13]. In fact, they started by making a parallel between a business operation
and a game. John Nash is another giant in this field, famous for his concept now called Nash equilibrium
[14]. Game Theory turned out to be a very transversal framework, being of considerable importance
in several fields such as economics, political sciences, psychology but also in computer science and
biology.
A game or interaction is defined by a set of players, the options or strategies available to the players
and a payoff rule which determines the gain (or payoff) of each player after one round of the game. Note
that players are not aware of each other’s choices beforehand and the payoffs depend on everyone’s
choices. For a 2-person and 2-strategy symmetric game, the payoff rule is represented by the following
matrix (payoff matrix)
C D
C R S
D T P
3

where C and D are the strategies (cooperation and defection, respectively) and R, S, T , and P (real
numbers) are the payoffs. In the payoff matrix, the ij entry is the payoff of the rows’ player when he/she
chooses strategy i and his/her opponent (columns’ player) chooses strategy j. That is, if both cooperate,
both get a payoff R, if both defect they get P , if one defects while the other cooperates, the former wins
T and the latter wins S. The relation between R, S, T , and P defines the character of the game. The
simplest useful game in the study of cooperation is the so-called Prisoner’s Dilemma (PD). In this 2-
person game, there are two possible strategies, to cooperate (C) or to defect (D), and the payoffs obey
T > R > P > S. For example,
C D
C 1 −2
D 2 −1
It is easy to see why this is called a dilemma. Irrespectively of the choice of the opponent, it is always
beneficial to stick to defection. However, the defection of both players is a worse result than both co-
operating (R > P ). Therefore, the optimal choice for an individual is to defect, whereas for the group
of players (socially speaking) is better to cooperate. When there is this kind of antagonism between
strategies — one which is good for the population but not the best for the individual — we are in the
presence of a social dilemma [12].
Contrary to the PD game, many dilemmas involve simultaneous decisions of several individuals,
instead of two, with a natural increase in complexity. We are now moving from pairwise to N -player
interactions. Thus, if we consider PD with N players this is called a Public Good Game (PGG). Here,
each individual chooses how much to contribute to a common pot and how much to save; then the
amount contributed is increased by some factor and equally redistributed. Again, an individual is tempted
to defect (not to contribute) because he/she will get the common benefit without any cost. However, if
no one contributes there is no benefit at all, a situation often called the tragedy of the commons [15].
To study the evolution of cooperation in large populations we may rely on Evolutionary Dynamics.
This is the mathematical instrument used to model the evolution of populations, that is, how they change
over time. As already mentioned, natural selection means that the fittest agents will out-compete others:
the weak die and the strong prevail. Interestingly, dynamics of peer-influence can be formally equivalent
to natural selection, in the sense that strategies that provide better payoffs will be imitated and will spread
(social learning). Fitness may be related not only with the genetic background but also with cultural traits
or chosen strategies. This way, we can use Evolutionary Dynamics to describe and model populations
of players, individuals provided with strategies that play with each other. For that, we need a selection
rule or, better said in our context, an imitation rule, which takes into account the strategies’ payoffs and
how sensitive to imitation the agents are. This combination of Game Theory and Evolutionary Dynamics
is called Evolutionary Game Theory (EGT).
Importantly, once we wish to look into finite populations, some randomness is introduced in the
systems. The adoption of new strategies by individuals can be described as a stochastic process, where
4
errors and random exploration of strategies are explicitly considered. We can tackle this analytically (as
we present below) or through numerical simulations.
2.2 Evolutionary dynamics in infinite populations
EGT, contrary to classical Game Theory, studies the evolution of strategies adopted by a population,
which depends on the proportions (or frequencies) of those strategies in the population. This evolution
can stem from different processes: reproduction (fittest agents reproduce faster) or imitation (better
strategies are imitated). In our social context, is more appropriate to stick with the idea that strategies will
not be inherited, but transmitted through social learning. The dynamics can be shown to be equivalent
and is given by the so-called replicator equation [16].
Let’s consider an infinitely large population of players, where each one can choose a strategy, say
Si, from the set of strategies S1, . . . , Sn. Occasionally, two players (it could be more) meet and play a
game which result is given by a payoff matrix A (an n×n matrix similar to the one defined in section 2.1).
So, player i (strategy Si) will earn a payoff of aij and player j (strategy Sj) will earn a payoff of aji. Now
we have to introduce the notion of evolution. Players will change strategies depending on everyone’s
outcomes (here we must assume that individual decisions are known to all in the population, that is,
there exists some way of communication between participants). The state of the population is given by
the vector x = (x1, . . . , xn), where xi is the fraction of the population that uses strategy Si (0 ≤ xi ≤ 1
and x1 + · · ·+ xn = 1). It is easy to see that a player with strategy Si has an expected payoff of
(Ax)i =∑j
aijxj (2.1)
Thus, the average payoff of the population is
x ·Ax =∑i
xi(Ax)i (2.2)
We want to know how the vector x evolves. This is when replicator equation comes in, being
xi = xi[(Ax)i − x ·Ax] (2.3)
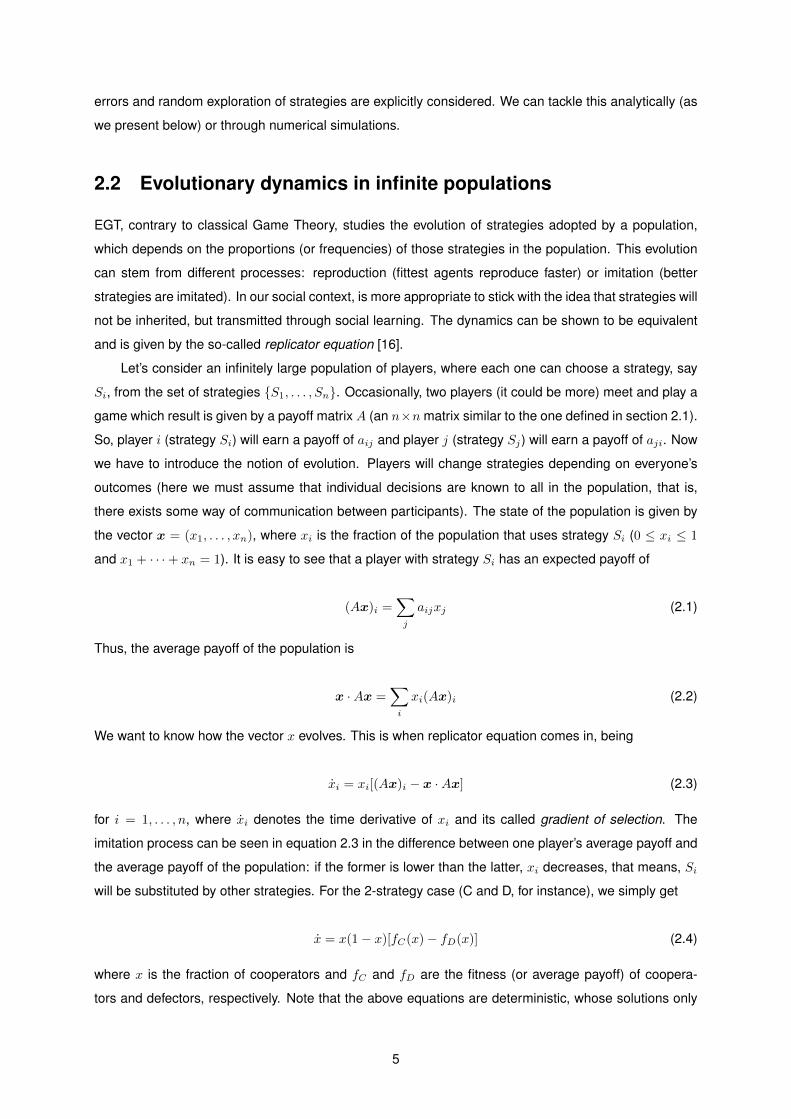
for i = 1, . . . , n, where xi denotes the time derivative of xi and its called gradient of selection. The
imitation process can be seen in equation 2.3 in the difference between one player’s average payoff and
the average payoff of the population: if the former is lower than the latter, xi decreases, that means, Si
will be substituted by other strategies. For the 2-strategy case (C and D, for instance), we simply get
x = x(1− x)[fC(x)− fD(x)] (2.4)
where x is the fraction of cooperators and fC and fD are the fitness (or average payoff) of coopera-
tors and defectors, respectively. Note that the above equations are deterministic, whose solutions only
5

depend on an initial condition (initial state, x0). The fixed points or equilibria [17] of the differential equa-
tions 2.3 and 2.4, denoted by x∗, can be found solving x = 0. In a phase space plot (x versus x), it is
easy to see which fixed points are stable or unstable. To follow a particular example, let us attend figure
2.1 (it doesn’t matter what game is, for now). When x is positive (negative), x increases (decreases), in
other words, the system evolves to the right (left), as it can be seen by the arrows’ direction. So, when
at the left of x∗, x is positive (negative) and at its right, x is negative (positive), x∗ is stable (unstable).
Therefore, if the goal is to raise cooperation levels, xL should be small and xR should be large (which is
precisely the effect of increasing risk). Occasionally, xL and xR are called coordination and coexistence
points, respectively. The former spots the fraction of cooperators that is needed to be surpassed so that
the tragedy of the commons (x = 0) is avoided, and the later is the point where the two species stably
coexist.
-
()
()
xRxL
Figure 2.1: Gradient of selection of a 2-strategy game (defectors versus cooperators) of an infinite
population. xL and xR denote left and right (respectively) inner equilibria, and the arrows indicate the
direction of evolution. Note: since the purpose of this figure is a purely qualitative understanding, we do
not specify the game or any parameter.
2.3 Mechanisms that promote cooperation
The main purpose of studying cooperation is to explore its grounds, in which conditions it emerges and
endures. There are several known mechanisms that promote cooperation. To better contextualize our
problem, it might be useful to mind some of the most well-studied mechanisms (see figure 2.2) [12].
6

Figure 2.2: Schematic representation of five mechanisms that favor cooperation — direct reciprocity,
indirect reciprocity, spatial selection, multi-level selection, and kin selection. Adapted from [12].
Direct reciprocity A mechanism that is usually present when there are repeated encounters (same
players meet several times). Consists of cooperating expecting future reciprocal cooperation, so that
everyone benefits [16, 18].
Indirect reciprocity Again, it occurs if there are repeated encounters but this time players’ moves
are being observed by third parties and a reputation is created [19]. So, one has access to others’
previous strategies and may act according to that information. Here, a social norm that specifies the
way reputations are updated is required [20].
Network reciprocity (or spatial selection) Population structure is important because structure de-
fines who interacts with whom. The simplest structure that allows us to go beyond a well-mixed popula-
tion (or randomly mixed population, which means that everyone can interact with the same probability)
is a lattice. Many studies consider a well-mixed population, either for simplicity or to isolate effects that
may arise from sources other than the network. However, we know that our social networks are not
well-mixed — we are organized in networks with more complex topologies, namely scale-free networks
[21], which are characterized by following a decreasing power-law in the number of nodes (there are
many nodes with few connections and little nodes with many connections). The structure can also be
defined geographically, assuming that we interact more with our neighbors. Interestingly, the population
structure affects evolutionary outcomes and some structures are more favorable to cooperation than
others, as for instance, the famous scale-free network [11, 22].
Multilevel selection When there is competition between groups, individuals inside the group tend
to cooperate more with each other, otherwise, other groups may easily out-compete them. It’s like
teamwork [23, 24].
7
Kin selection It is the predisposition one has to protect and help individuals genetically related with
him or her (somehow, the protection of one’s own genes) [25].
Most of the studies consider these mechanisms separately. However, it is also interesting and
relevant to study the combination of more than one (like it actually happens in social systems), as
it might lead to non-expected results. For instance, direct reciprocity and spatial structure can have
a constructive or destructive interplay depending on the amounts of repetition and assortment of the
structure [26]. Moreover, some of the described mechanisms, as reciprocities, work well for 2-person
games, however they are not extensively studied for N -person games and it is not obvious that the
effects are the same.
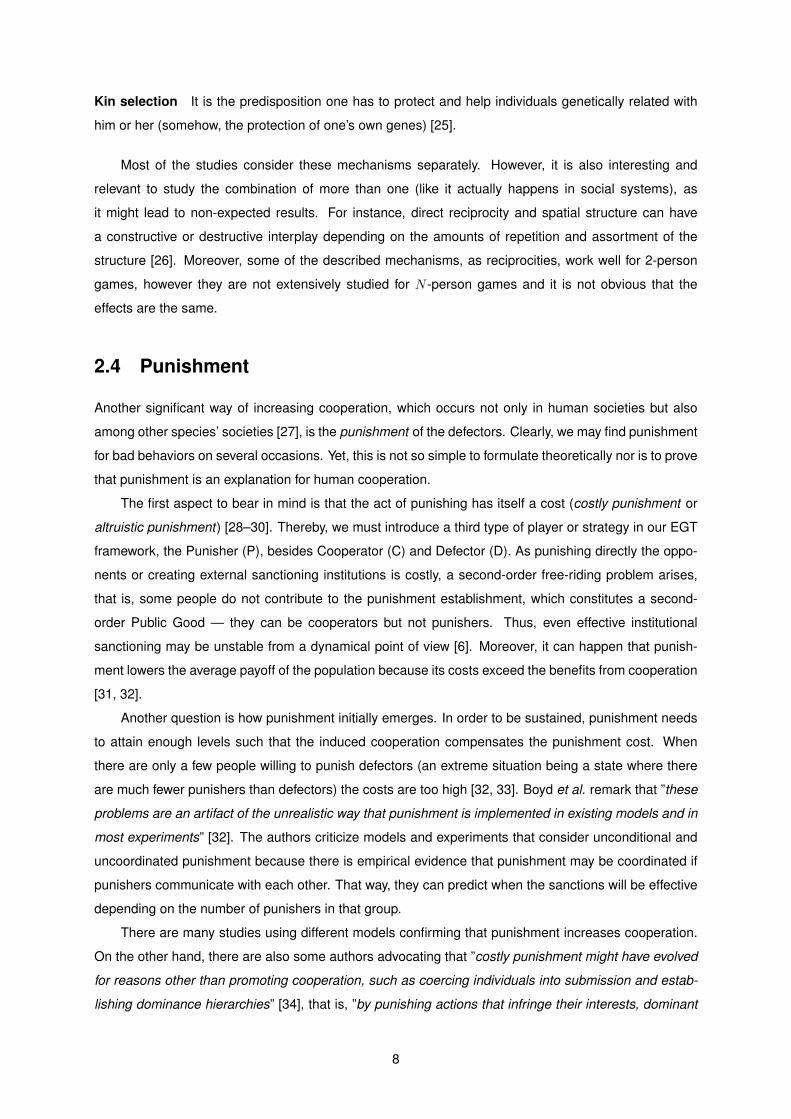
2.4 Punishment
Another significant way of increasing cooperation, which occurs not only in human societies but also
among other species’ societies [27], is the punishment of the defectors. Clearly, we may find punishment
for bad behaviors on several occasions. Yet, this is not so simple to formulate theoretically nor is to prove
that punishment is an explanation for human cooperation.
The first aspect to bear in mind is that the act of punishing has itself a cost (costly punishment or
altruistic punishment) [28–30]. Thereby, we must introduce a third type of player or strategy in our EGT
framework, the Punisher (P), besides Cooperator (C) and Defector (D). As punishing directly the oppo-
nents or creating external sanctioning institutions is costly, a second-order free-riding problem arises,
that is, some people do not contribute to the punishment establishment, which constitutes a second-
order Public Good — they can be cooperators but not punishers. Thus, even effective institutional
sanctioning may be unstable from a dynamical point of view [6]. Moreover, it can happen that punish-
ment lowers the average payoff of the population because its costs exceed the benefits from cooperation
[31, 32].
Another question is how punishment initially emerges. In order to be sustained, punishment needs
to attain enough levels such that the induced cooperation compensates the punishment cost. When
there are only a few people willing to punish defectors (an extreme situation being a state where there
are much fewer punishers than defectors) the costs are too high [32, 33]. Boyd et al. remark that ”these
problems are an artifact of the unrealistic way that punishment is implemented in existing models and in
most experiments” [32]. The authors criticize models and experiments that consider unconditional and
uncoordinated punishment because there is empirical evidence that punishment may be coordinated if
punishers communicate with each other. That way, they can predict when the sanctions will be effective
depending on the number of punishers in that group.
There are many studies using different models confirming that punishment increases cooperation.
On the other hand, there are also some authors advocating that ”costly punishment might have evolved
for reasons other than promoting cooperation, such as coercing individuals into submission and estab-
lishing dominance hierarchies” [34], that is, ”by punishing actions that infringe their interests, dominant
8

animals teach subordinates to behave in a fashion that increases (or avoids reducing) the dominant’s
fitness” [27]. Moreover, it is unclear whether costly punishment is by itself a mechanism for the evolution
of cooperation or if it enhances cooperation while in the presence of some kind of reciprocity (direct
or indirect) [34, 35]. Dreber et al. say ”costly punishment is a form of direct or indirect reciprocity: if I
punish you because you have defected against me, direct reciprocity is used; if I punish you because
you have defected with others, indirect reciprocity is at work ” [34]. In this experimental study, repeated
PD game, where people chose between cooperation, defection and costly punishment, they concluded
that winners don’t punish, meaning that those people who won the highest total payoff tended not to use
costly punishment.
To understand the model that we are going to use, we should introduce some concepts about
punishment, which have been studied in different ways. In fact, its own nature can be diverse — we
can observe peer-punishment or pool-punishment (institutionalized punishment). In peer-punishment,
punishers directly punish the defectors (and only if there are defectors), whereas, in pool-punishment,
punishers pay beforehand a fixed tax to an external institution which is responsible to effectively apply
sanctions to the defectors. Either way, punishing is costly to the punisher. The difference is that in pool-
punishment the punishers contribute with the tax independently of institution’s necessity or efficiency,
while peer-punishment is only applied when defectors are identified [3] — ”pool-punishment is like paying
towards a police force, whereas peer-punishers take law enforcement into their own hands” [36]. The
first is more expensive collectively, but the second doesn’t assure a stable outcome. Pool-punishment
was suggested to overcome the second-order free-riding problem [36] caused by peer-punishing. Peer-
punishing can compromise the system’s sustainability because non-punishers cannot be distinguished
from peer-punishers when everyone contributes to the Public Good. Therefore, the number of non-
punishers may increase which would allow an invasion of defectors. Sigmund et al. defend that pool-
punishers can evolve more than peer-punishers if second-order punishment is applied (that is, the non-
punishers are also subject to sanctions).
Another distinction to be made is between strict and graduated punishment. When we say strict
we mean that the punishment applied is constant and do not depend on the state of the system. On
the contrary, graduated punishment depends on the harm caused to the society by choosing defection
which can be defined in different manners. For instance, it can be proportional to one’s offense [37]
(if that can be measured) or it can be related to the number of defectors in the population (the more
defectors, the bigger should be the sanctions). As pointed out in [38], ”models where sanctioning is
considered as an unchanging part of one’s strategy fail to acknowledge a common real-life observation,
which is that an increase in antisocial behavior will frequently trigger an increase in both willingness
as well as severity of sanctioning amongst those who feel threatened by the negative consequences.
Extreme examples thereof include terrorist attacks and other malicious acts, upon which the security
measures in the affected areas are often tightened rather drastically”. So, we can think of graduated
punishment as the antithesis of unconditional punishment.
Researchers have found that graduated punishment may be an efficient way of promoting and
maintaining cooperation [29, 37, 39]. This might sound trivial. For instance, traditional crime penalties
9

are related to the amount of harm caused by the criminal act in most countries and this idea is commonly
accepted. However, to set up a rigorous explanation for things apparently banal is not always elementary
and this is true within the settings we aim to study.
One curious fact is that graduated punishment was empirically observed in specific systems called
Common Pool Resources (CPR). CPR systems enclose resources which are finite (they can have an
end) and non-excludable (it is difficult to prohibit someone to make use of them), as for instance fisheries.
They can be owned by national or local governments and also private institutions or individuals. By
observing and analyzing numerous such systems, Elinor Ostrom, a political economist, found that in
many successful communities, that is, where a self-management of the resources had sustainability
emerged, eight design principles were applied. Graduated punishment is one of those key principles
[29]:
Appropriators who violate operational rules are likely to be assessed graduated sanctions
(depending on the seriousness and context of the offense) by other appropriators, by officials
accountable to these appropriators, or by both (...) In these robust institutions, monitoring and
sanctioning are undertaken not by external authorities but by the participants themselves.
One of the reasons that Ostrom points out for graduated punishment to work better than strict is that, in
the case of a singular act of defection (without precedents and in an unusual problematic situation), a
harsh sanction can cause ”resentment and unwillingness to conform to the rules in the future”. Ostrom
also notices that ”the appropriators in these CPRs somehow have overcome the presumed problem of
the second-order dilemma” which comes up with the fact that punishment is almost always costly to
the punisher. What may explain this achievement is that either the costs of monitoring and sanctioning
activities are low or the benefits from it are high (or even both). Particularly, in certain systems, the costs
of monitoring are low because they are a natural result of the set of rules that are being used. Plus, the
act of monitor can also provide direct benefits such as privileged information about the behavior of other
appropriators (which may be precious when one needs to make a decision about his/her own strategy).
Overall, coercion has an important role in giving confidence to cooperators: someone is more willing to
cooperate if he/she knows that others will do the same — as Ostrom and Margaret Levi [40] put it, ”the
compliance of each depends on the compliance of the others. No one prefers to be a ’sucker’.”
Interestingly, Iwasa and Lee explored graduated punishment mathematically, using the concept of
total welfare function φ, which is the total gain of the community (simply the sum of the payoffs of all
individuals) [37]. This function is maximized when punishment is gradual, more concretely, when a
punishment that grows with the square root of harm caused to the society by the defector is applied.
But this is so under specific conditions: possible false accusation (a certain probability of an innocent
being punished or a cheater getting away with a bad action) and heterogeneity among people (different
sensibilities when adopting a strategy).
Likewise, other authors have also wondered about the optimal way of punishing, if it should be strict
or graduated [39, 41]. Shimao and Nakamaru made a graduated versus strict peer-punishment analysis
in a well-mixed and in a structured population (square lattice) [39]. In their model, each agent has four
adaptive continuous traits or strategies: a propensity for altruism or level of cooperation (how much they
10
cooperate in the PGG), severity of punishment, tolerance level (threshold of punishment) and strictness
of punishment (from strict to graduate). These traits influence everyone’s payoff. The cost of punish-
ing is proportional to the sanction applied. Simulation results show that stricter punishment promotes
increased cooperation more than graduated punishment in a spatially structured population, whereas
graduated punishment increases cooperation more than strict punishment in a well-mixed population.
This is so because, in the presence of a social structure, the opponents of an individual (the focal player)
are fixed, that is, a player always plays with his neighbors. If his level of cooperation is below his op-
ponent’s threshold of punishment, he will be severely punished (at the highest level) if they are strict
punishers (even if his cooperation level is only slightly lower). This will make him rise his cooperation
level in order to avoid a future harsh punishment. Therefore, the cooperation level and the punishment
threshold both evolve within neighborhoods. Yet, in a well-mixed population, the level of cooperation
evolves if graduated punishment is applied. In this case, the opponents are randomly chosen (which
doesn’t allow the tuning of one’s level of cooperation and the punishment threshold of his neighbors,
as there is no concept of a neighborhood). Here, graduated punishment reduces the cost of punishing
when there is no real necessity of a severe and strict punishment: with graduated punishment there is
always a sanction, however, the graduated punisher has a lower cost in relation to the strict punisher if
there is a small difference between his threshold and the level of cooperation of the punished. The con-
clusion of this study (quoting, ”Strict punishment would evolve in a small, fixed society, such as a band,
whereas graduated punishment would more likely evolve in a fluid society.”) and also of [41] seems to
contradict Elinor Ostrom’s observations on CPR systems [29]. She claims that graduated punishment
contributes more efficiently to the sustainability of the systems which concern small-scale communities
of about few hundreds of people as, for instance, the case of Zanjera irrigation communities in the Philip-
pines. Iwasa and Lee [37] also noticed this conflict between Ostrom’s proposal and other’s, and they
also tried to figure out an explanation for the graduated punishment emergence.
Perc and Szolnoki thought of a different mode of non-strict punishment [38]. They devised an adap-
tive sanctioning method where punishment is only applied when cooperators witness the spreading of
defectors in their neighborhood, that is, when a cooperator imitates a defector. Cooperators become
punishers only when defectors start evolving and the more they evolve, the higher are the sanctions.
Inversely, if an increase of defectors is not detected, there are no penalties. The adaptive punishment
model is compared to strict punishment, which is implemented by introducing punishers (who always
punish the same amount) besides (non-punishers) cooperators. Simulations show that adaptive pun-
ishment is better at promoting cooperation in the spatial PGG and that the overall punishing cost is not
too high (”adaptive punishment may be evolutionary advantageous in that not only it can maintain high
levels of cooperation under very unfavorable conditions, but also in that the footprint of sanctioning in
terms of expenses of the whole population is negligible” [38]). One of the main reasons that explain
this enhancement is the spontaneous emergence of some punishers localized at the interfaces sepa-
rating cooperative and defection areas which keep punishing the defectors, preventing invasions. This
maintains the smoothness of the interface, which in turn backs up spatial reciprocity.
Another alternative concept of non-strict punishment was proposed by Ohdaira [42, 43] - sanction
11

with jealousy, meaning that a player punishes a neighbor if his own payoff (resulting from a PD round) is
smaller than his neighbor’s. We can see this process as inequity aversion [44]. The sanction and its cost
are equal and defined to be proportional to his payoff. Plus, the probability of a player to punish other is
proportional to the difference of their payoffs. This way, the author accomplished to avoid two problems:
antisocial behavior (retaliation of a defector on a cooperator) and the fact that peer-punishment induces
the decrease of the average payoff of all players pointed out by [45] and [34], respectively.
In some realistic situations, people feel significantly influenced by peers and when they don’t fit in
the group, they are punished somehow, either psychologically or financially. Aiming to capture this effect,
in [46] peer pressure is modeled by means of punishment, such that, players punish others that have a
different strategy, whatever that is. It may seem that this mutual punishment has little importance in the
enhancement of cooperation, but the authors prove the contrary.
Until now, we have seen that there are several studies about punishment that use different ap-
proaches. Some conclusions are even contradictory. Our goal is to study the impact and sustainability
of sanctioning institutions and our guess is that graduated punishment may have opened an evolutionary
route for costly institutions to prevail.
2.5 Climate Governance
The underlying assumption that enables the application of the mechanism we are about to present to
climate governance is simply that we can regard our planet as a big Public Good — whether or not
we contribute to its maintenance, we all benefit from it [7, 8]. We should now introduce the important
concept of Collective Risk Dilemma (CRD). A CRD is an N -person game, where there is a threshold in
the number of cooperators, such that if this number is not attained or surpassed, everyone will lose their
earnings, with a probability r, which is called the risk. Here, we can say that people cooperate so that
they don’t lose what they have, contrary to the PGG, where players immediately get a positive payoff after
each round. It is proved analytically [11] and experimentally [9] that the awareness of the risk increases
the number of cooperators. Despite being quite simple, this formulation might well mimic worldwide
conventions on climate governance, where agents (for example, countries) cooperate (or not) for the
environment protection and the risk of failure is not to be disregarded. The idea that a minimum number
of contributors is needed to fight the possibility of a climate catastrophe seems fair. At the present time,
the perception of risk concerning climate matters is low [8, 47], which in certain conditions won’t be
sufficient to keep cooperation. We can either increase the risk awareness or find other mechanisms to
have a part along risk in boosting cooperation, as for instance, direct and indirect reciprocity (suggested
in [10]) or sanctioning institutions [6].
According to International Environmental Agreements Database Project (https://iea.uoregon.
edu), an International Environmental Agreement (IEA) is defined as ”an intergovernmental document
intended as legally binding with a primary stated purpose of preventing or managing human impacts on
natural resources”. Although considered the most important climate treaty in history, there are diver-
gent opinions about the Paris Agreement under the United Nations Framework Convention on Climate
12

Change (UNFCCC) of 2015. Some authors believe the settled objectives are adequate according to
today’s scientific knowledge [48], while others defend that those measures are still not enough to put
a break on global temperature rise [49]. For instance, in a The Guardian’s article [50], James Hansen
claims that only a worldwide tax on greenhouse gas emissions could solve this problem, which is not
contemplated in the cited agreement. He also criticizes that much is pledged but little is actually accom-
plished.
Several studies have been performed in order to find the optimal design for IEAs. Barrett advocates
that IEAs should not overlook the fact that states often act selfishly, thus, these treaties must make their
participation pay, if they aim at changing behaviors. Looking at IEAs from a Game Theory perspective,
this means that the underlying game should be revised in order to enclose incentives to cooperation [7].
Plus, the author warns for the self-enforcing feature of the treaties, which cannot be externally imposed
but freely adhered — somehow, parties must be willing to make part of it [51].
It is also important to bear in mind that we are still under considerable uncertainty. Despite recent
advancements on possible future states of Earth system, a planetary threshold (that, if surpassed,
would lead us to an irreversible catastrophic scenery) is not known accurately [52]. ”Without reliable
information about how current actions are likely to affect the trajectory of global change, and how global
change is likely to alter the well-being of future generations, it is hard to provide sensible advice to
decision-makers” [53]. So, designing norms and goals about something we are not sure of demands
an adaptive management approach, an ”iterative decision-making process (...) to learn and incorporate
new information and thereby improve future decision-making” [53] (see this reference for a review on
decision-making under great uncertainty applied to environmental management). Another obstacle to
global decision-making pointed out in [53] is precisely the fact that it is global. In climate issues, any
decision or action may affect all parties involved, however, interests seldom converge, which hinders a
joint global governance [8, 54]. Not uncommonly, distinct interests lead to an unduly manipulation of
information [55] (which is even more facilitated under uncertain settings). For that reason, it is important
to produce clear and, of course, unbiased scientific materials.
To better contextualize our proposal, it is worth stressing two particular ideas on how IEAs may be
enhanced. One is graduated punishment, which, besides had been observed by Ostrom in successful
CPR systems [29], was also recommended by Law specialists to cope with environmental offenses in
the United States and Europe [56]. In this study, authors argue that environmental crimes should be
punished with graduated sanctions according to the seriousness of the environmental harm, thus, a full
spectrum of such crimes is provided. Nevertheless, they acknowledge the difficulty that is to define
”harm to the environment”, how that can be measured in different situations and what are the thresholds
at which a threat becomes an actual injury. There is also a problem of causation — to prove that the
defendant’ act really caused a certain harm may not be straightforward since ”the effects of a polluting
event may not be clear for a great many years” or ”a defendant may be able to show that one or more
additional actors independently emitted pollutants into the same water, soil, or air, either previously,
simultaneously, or subsequently to the defendant’s own actions” [56]. As described in Methods, our ap-
proach to graduated punishment is different, though. We avoid this individual categorization by defining
13
a bad act as non-compliance to an agreement and harm as the collective result of those behaviors.
The other important concept is polycentricity [54, 57, 58]. Ostrom defines: ”polycentric systems
are characterized by multiple governing authorities at differing scales rather than a monocentric unit.
Each unit within a polycentric system exercises considerable independence to make norms and rules
within a specific domain (such as a family, a firm, a local government, a network of local governments,
a state or province, a region, a national government, or an international regime)” [54]. She suggests
this approach arguing that while an effective global treaty (which should be part of a long-term plan) is
not possible, many smaller acts at different scales can create a cumulative benefit. But more than this,
it is dynamically proven that when agents engage in smaller groups, cooperation emerges more easily
[6, 11]. So, a bottom-up collaboration is indeed more effective. Even sanctioning institutions should
be constituted at a local level [6]. Barrett also says that the total number of countries involved in an
IEA shouldn’t be too great [51]. Moreover, a bottom-up governance structure facilitates learning and
experimentation [54]. Experiments in climate governance are of much importance because they enable
the emergence of innovative solutions [59].
It is over this background that we make our proposal. Strict punishment in a CRD has been studied
analytically. Graduated sanctions have been proposed to deal with the lack of cooperation in climate
issues. So, here we fill the gap in the study of graduated punishment institutions in a CRD, using an
EGT framework for finite populations.
14

Chapter 3
Methods
In this chapter, we describe the methods that allow us to explore our hypothesis about punishment. We
start by following [11] and [6], which study the evolutionary dynamics of a finite population under a CRD
(briefly explained in section 2.5) and introduce our new definition of punishment and costs.
In a finite population of size Z, individuals interact in groups of size N , each one choosing one of the
three strategies (C, D or P) and starting with an initial endowment or benefit b. Cs and Ps contribute c, a
part of their endowment, to a common amount, while Ds do not contribute. If the total contribution of the
group is below the Public Good (PG) threshold, that is, if the sum of the number of Cs and Ps is below
nPG, everyone in the group will lose their remaining endowments with a probability r, the perception
of risk. Besides this (classical CRD, so far), Ps also contribute a tax πt to an institution that effectively
punishes Ds by an amount πf if it has enough funding, nPπt. The sanctioning institution constitutes a
second-order Public Good, only achieved if there are at least nP contributors (only Ps, in this case). We
distinguish the type of institution by the scale at which it is formed and upon which it acts — a global
one (like the United Nations, for instance) concerns the entire population (is sustained by all Ps and
punishes all Ds), whereas a local institution concerns only one group (supported by Ps belonging to that
group and punishes Ds inside the same group). These are the two cases considered in [6]. The payoff
functions for Cs, Ds, and Ps in a group where there are jC Cs, jP Ps, and jD ≡ N − jP − jC Ds can be
written as
ΠC = −c+ bΘ(jC + jP − nPG) + (1− r)b[1−Θ(jC + jP − nPG)] (3.1a)
ΠP = ΠC −∆t where ∆t = πt (3.1b)
ΠD = ΠC + c−∆fΘ(jP − nP ) where ∆f = πf (3.1c)
where Θ(k) is the Heaviside function (being 0 for k < 0 and 1 for k ≥ 0), nPG is a positive integer
(0 < nPG < N ), r is real (0 < r < 1) and the parameters c, πt (tax), πf (fine) and b are positive real
numbers. Equation 3.1c is defined for local institutions. For a global institution we substitute jP by the
15

number of punishers of the entire population (iP ). Note that whenever nP is achieved, ∆fΘ(jP − nP ) is
a positive constant (strict punishment) [6]. In figure 3.1, there is a representation of a Public Good with
sanctioning institution.
Public Good
SanctioningInstitution
C D
Pc
c Δ𝑓
Δ#
Figure 3.1: Schematic representation of a public good system with an external sanctioning institution.
Ps and Cs contribute c to the PG, while Ds do not. Ps contribute a tax ∆t to the sanctioning institution,
while Cs and Ds do not. Ds pay a fine ∆f .
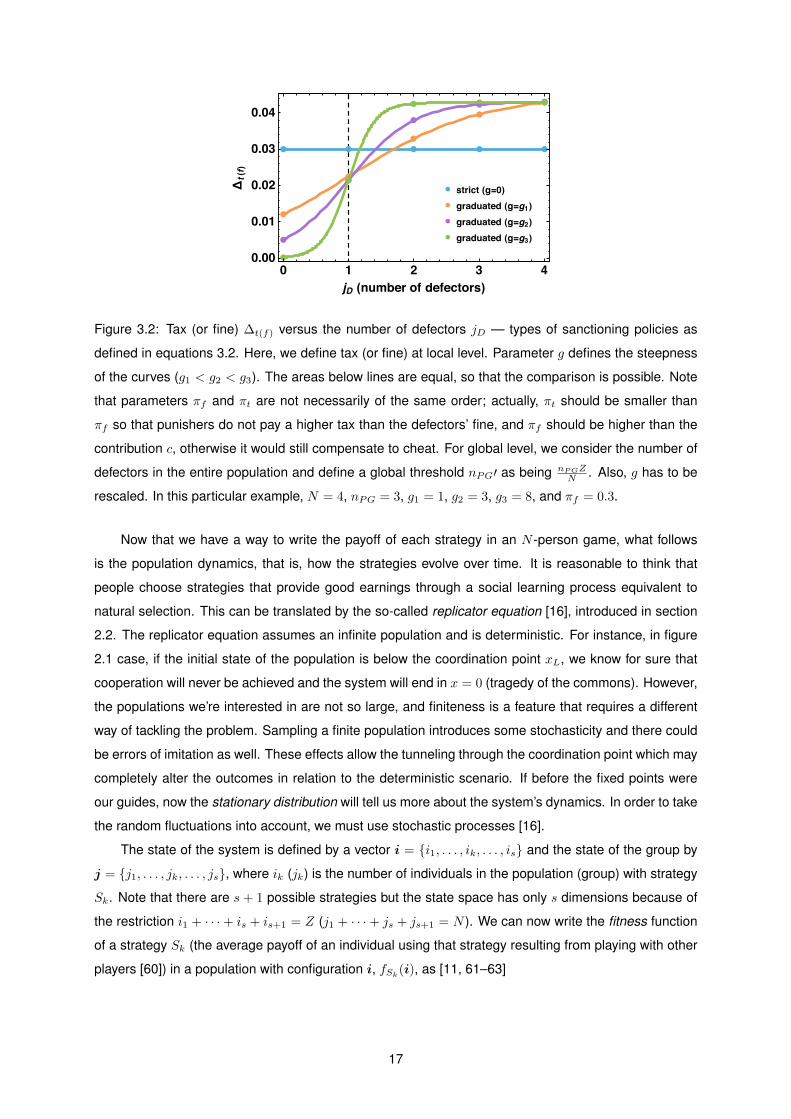
Since we intend to analyze the effect of graduated punishment, we have to introduce some changes
in the payoff functions. This way, we define a new kind of punishment, where ∆f is dependent on the
number of defectors: the higher the number of defectors, the more severe is the punishment. Actually,
we choose to inspect and compare three different sanctioning policies — strict punishment and strict
costs, graduated punishment and fixed costs, and graduated punishment and graduated costs (see
equations 3.2 and figure 3.2).
∆strictt(f) = πt(f) (3.2a)
∆graduatedt(f) ∝
πt(f)
1 + e−g[jD−(N−nPG)](3.2b)
Note that πt(f) is the average (over the number of defectors jD) of ∆graduatedt(f) , so that the comparison is
possible. The parameter g defines the steepness of the functions — the higher the g, the more abrupt
is the variation of the fine or tax around the point N − nPG, which is the defectors’ threshold (number
of defectors above which there is a risk r of losing everything). Graduated costs also follow the function
3.2b because we are assuming that the more defectors, the higher are the costs to manage the sanctions
application.
16
( )
Δ()
(=) (=) (=) (=)
( )
Δ()
(=) (=) (=) (=)
Figure 3.2: Tax (or fine) ∆t(f) versus the number of defectors jD — types of sanctioning policies as
defined in equations 3.2. Here, we define tax (or fine) at local level. Parameter g defines the steepness
of the curves (g1 < g2 < g3). The areas below lines are equal, so that the comparison is possible. Note
that parameters πf and πt are not necessarily of the same order; actually, πt should be smaller than
πf so that punishers do not pay a higher tax than the defectors’ fine, and πf should be higher than the
contribution c, otherwise it would still compensate to cheat. For global level, we consider the number of
defectors in the entire population and define a global threshold nPG′ as being nPGZN . Also, g has to be
rescaled. In this particular example, N = 4, nPG = 3, g1 = 1, g2 = 3, g3 = 8, and πf = 0.3.
Now that we have a way to write the payoff of each strategy in an N -person game, what follows
is the population dynamics, that is, how the strategies evolve over time. It is reasonable to think that
people choose strategies that provide good earnings through a social learning process equivalent to
natural selection. This can be translated by the so-called replicator equation [16], introduced in section
2.2. The replicator equation assumes an infinite population and is deterministic. For instance, in figure
2.1 case, if the initial state of the population is below the coordination point xL, we know for sure that
cooperation will never be achieved and the system will end in x = 0 (tragedy of the commons). However,
the populations we’re interested in are not so large, and finiteness is a feature that requires a different
way of tackling the problem. Sampling a finite population introduces some stochasticity and there could
be errors of imitation as well. These effects allow the tunneling through the coordination point which may
completely alter the outcomes in relation to the deterministic scenario. If before the fixed points were
our guides, now the stationary distribution will tell us more about the system’s dynamics. In order to take
the random fluctuations into account, we must use stochastic processes [16].
The state of the system is defined by a vector i = i1, . . . , ik, . . . , is and the state of the group by
j = j1, . . . , jk, . . . , js, where ik (jk) is the number of individuals in the population (group) with strategy
Sk. Note that there are s + 1 possible strategies but the state space has only s dimensions because of
the restriction i1 + · · ·+ is + is+1 = Z (j1 + · · ·+ js + js+1 = N ). We can now write the fitness function
of a strategy Sk (the average payoff of an individual using that strategy resulting from playing with other
players [60]) in a population with configuration i, fSk(i), as [11, 61–63]
17
fSk(i) =
(Z − 1
N − 1
)−1×
(j;jk=N−1)∑(j;jk=0)
ΠSk(j)
(ik − 1
jk
) s+1∏l=1(l 6=k)
(iljl
)(3.3)
where ΠSk(j) is the payoff of a strategy Sk in a group with composition j and (j; jk = q) designates
any group configuration in which there are specifically q players with strategy Sk. The fitness functions
have this form because random sampling without replacement from a finite population leads to groups
that follow a hypergeometric distribution. So, fitness is an average payoff over all possible groups in
the population (remind that individuals interact within small groups). For infinite populations, we would
rather use the binomial distribution.
We can now use equation 3.3 to compute other interesting variables. For instance, to obtain the
average fraction of groups that achieve nPG contributors (that is, that can maintain the public good),
aG(i), we must only substitute ΠSk(j) by Θ(jC + jP − nPG). To compute the average fraction of groups
that reach nP Ps (that is, that can support a sanctioning institution), aI(i), we replace ΠSk(j) by Θ(jP −
nP ) (for local institutions) or Θ(iP − np) (for global institutions).
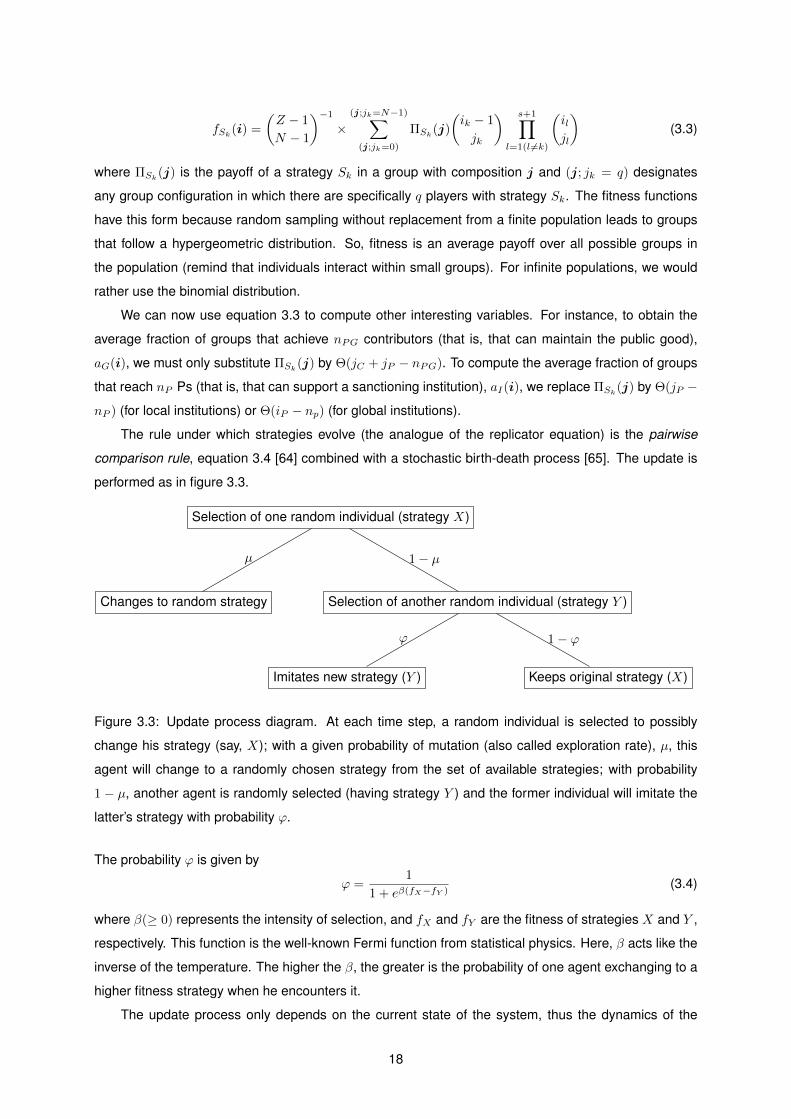
The rule under which strategies evolve (the analogue of the replicator equation) is the pairwise
comparison rule, equation 3.4 [64] combined with a stochastic birth-death process [65]. The update is
performed as in figure 3.3.
Selection of one random individual (strategy X)
Changes to random strategy Selection of another random individual (strategy Y )
Imitates new strategy (Y ) Keeps original strategy (X)
µ 1− µ
ϕ 1− ϕ
Figure 3.3: Update process diagram. At each time step, a random individual is selected to possibly
change his strategy (say, X); with a given probability of mutation (also called exploration rate), µ, this
agent will change to a randomly chosen strategy from the set of available strategies; with probability
1 − µ, another agent is randomly selected (having strategy Y ) and the former individual will imitate the
latter’s strategy with probability ϕ.
The probability ϕ is given by
ϕ =1
1 + eβ(fX−fY )(3.4)
where β(≥ 0) represents the intensity of selection, and fX and fY are the fitness of strategies X and Y ,
respectively. This function is the well-known Fermi function from statistical physics. Here, β acts like the
inverse of the temperature. The higher the β, the greater is the probability of one agent exchanging to a
higher fitness strategy when he encounters it.
The update process only depends on the current state of the system, thus the dynamics of the
18

vector i(t) (the configuration of the population at time t) corresponds to a Markov process over an s-
dimensional space [64–68]. The probability density function pi(t) is the predominance of configuration i
at time t, which evolves under the master equation (whose derivation can be found in [68])
dpi(t)
dt=∑i′
Ti′ipi′(t)− Tii′pi(t) (3.5)
where Tii′ denotes the transition probability per unit time (transition rate) from configuration i to i′. This
is a gain-loss equation — it is easy to see that the first term on the right-hand side refers to the gain
due to transitions from other states (i′) to i and the second term is the loss due to transitions from i
to other states. It can be harsh to solve this equation, that is, to know the probability of a certain state
at a certain time. Besides, more interesting is to know the stationary distribution pi, which gives the
probability of each state after a sufficiently long time. For that, we set the left-hand side of equation 3.5
to zero, which corresponds to an eigenvector search problem [68], namely, the eigenvector associated
with the eigenvalue 1 of the transition matrix Λ = [Tij ]T . This is trivial to show noticing that
∑i′ Tii′ = 1.
Then, writing equation 3.5 in matrix form we get Λp = p.
The stationary distribution will also allow the computation of relevant quantities such as average
group achievement (ηG =∑
i piaG(i)), which is the average (over time) fraction of groups that overcome
the threshold nPG, and institution prevalence (ηI =∑
i piaI(i)), which is the average fraction of groups
that sustain the institution. These quantities are a measure of cooperation and institutitons establishment
in a population, respectively.
Now, to construct the transition matrix Λ, we need to compute the transition probabilities among all
possible configurations. The way we define the update process imposes that, from one configuration to
the next (after one time step), the only transition allowed is: the number of individuals playing a certain
strategy is increased by one and the number of individuals playing another strategy is decreased by
one, that is, just one agent can change its strategy. It is possible that the former strategy coincides with
the latter — in that case, nothing happens. As an example, for a 2-strategy case, Λ has the following
tridiagonal form
Λ =
T00 T10 0 0 0 . . . 0 0
T01 T11 T21 0 0 . . . 0 0
0 T12 T22 T23 0 . . . 0 0...
......
......
. . ....
...
0 0 0 0 0 . . . Tn−1 n Tnn
where n + 1 is the number of states (in this particular case, n = Z). For more than two strategies, the
transition matrix becomes larger and there are more non-zero entries besides the tridiagonal.
By the pairwise comparison rule (equation 3.4), the transition rates are
TSl→Sk= (1− µ)
[ilZ
ikZ − 1
(1 + eβ(fSl
−fSk))−1]
+ µilsZ
(3.6a)
19
Tii = 1−∑i′ 6=i
Ti′i (3.6b)
where the mutation rate µ is considered and Sl and Sk are two different strategies.
Thus, the probability to increase (decrease) by one the number of individuals with strategy Sk, TS+k
i
(TS−k
i ) is
TS±ki =
∑i′1,...,i
′k−1,i
′k+1,...,i
′s
Tii′1,...,ik±1,...,i′s (3.7)
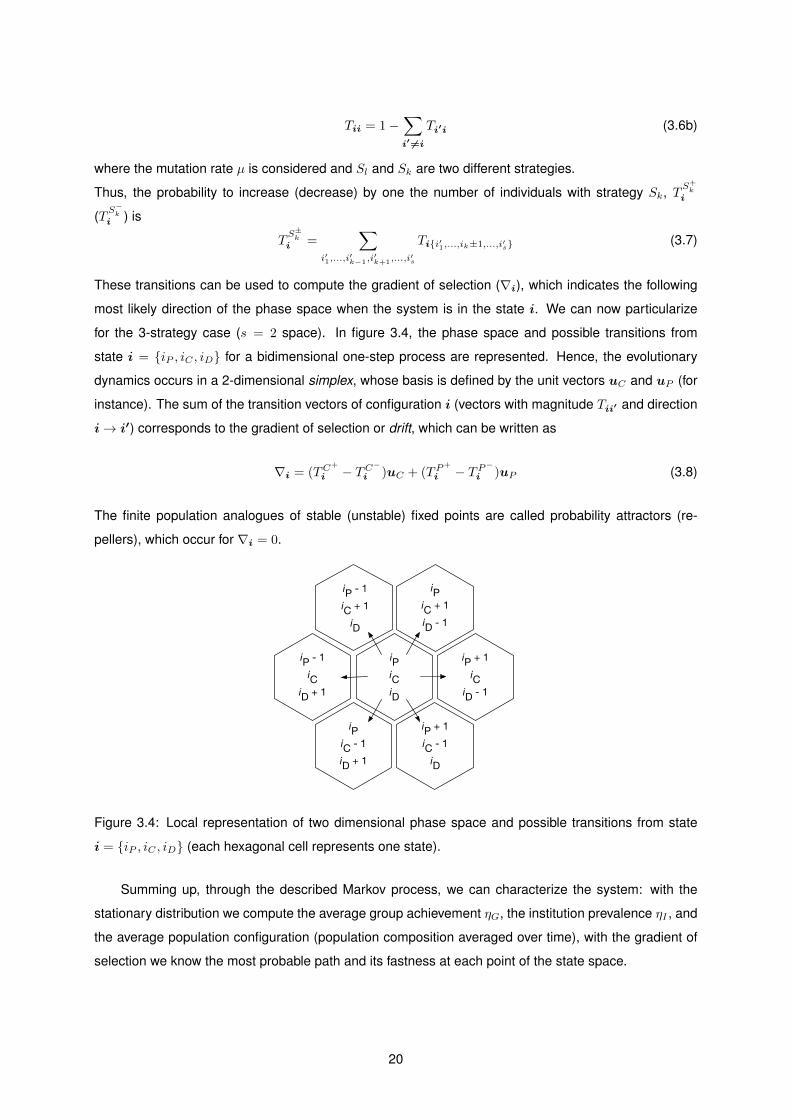
These transitions can be used to compute the gradient of selection (∇i), which indicates the following
most likely direction of the phase space when the system is in the state i. We can now particularize
for the 3-strategy case (s = 2 space). In figure 3.4, the phase space and possible transitions from
state i = iP , iC , iD for a bidimensional one-step process are represented. Hence, the evolutionary
dynamics occurs in a 2-dimensional simplex, whose basis is defined by the unit vectors uC and uP (for
instance). The sum of the transition vectors of configuration i (vectors with magnitude Tii′ and direction
i→ i′) corresponds to the gradient of selection or drift, which can be written as
∇i = (TC+
i − TC−
i )uC + (TP+
i − TP−
i )uP (3.8)
The finite population analogues of stable (unstable) fixed points are called probability attractors (re-
pellers), which occur for ∇i = 0.
iPiCiD
iPiC + 1iD - 1
iP - 1iC
iD + 1
iP + 1iC
iD - 1
iPiC - 1iD + 1
iP - 1iC + 1iD
iP + 1iC - 1iD
Figure 3.4: Local representation of two dimensional phase space and possible transitions from state
i = iP , iC , iD (each hexagonal cell represents one state).
Summing up, through the described Markov process, we can characterize the system: with the
stationary distribution we compute the average group achievement ηG, the institution prevalence ηI , and
the average population configuration (population composition averaged over time), with the gradient of
selection we know the most probable path and its fastness at each point of the state space.
20

Chapter 4
Results and Discussion
In this chapter, we start by presenting an analysis of 2-strategy CRD and then move on to our main
purpose, the outcomes from 3-strategy CRD. We also verify the results’ robustness over all parameters.
Finally, we discuss alternative mechanisms.
4.1 2-strategy Collective Risk Dilemma with punishment
Having three available strategies, there are three possible 2-strategy games: Ds versus Cs, Ds versus
Ps, and Cs versus Ps. In figures 4.1 and 4.2, we show the effect of punishment in these games. Note
that when sanctions are not applied, a Ds versus Ps game is equivalent to a Ds versus Cs.
In Ds versus Ps game, the action of graduated punishment/costs is to displace the coordination
point to the left (see upper left panels of figures 4.1 and 4.2), which facilitates the tunneling through
that barrier, allowing the growth of Ps. From the stationary distribution in the bottom left panel of figure
4.1, a pronounced difference between the different sanctioning policies is not observed. It seems that
all policies (except no punishment) induce a state with many punishers. However, if we lower the risk
r and fine πf (figure 4.2), there is already a curious variation: the red peak is displaced to the left but
not the green and blue, which is an indication that graduated punishment and costs may effectively
be more suitable than strict to attain cooperation in hard conditions. Moreover, with graduated costs,
the coexistence point between Cs and Ps is pushed to the right and the peak values that gradient and
stationary distribution take are very low (see right panels).
But the story cannot end here. Even if in a Ds versus Ps game a state with many Ps is reached,
it may not be stable. As much as an agent is capable of choosing to contribute or not to the primary
public good, he can choose to contribute or not to the sanctioning institution, that is, to be a punisher or
a (simple) cooperator. This means that in reality, we must have three strategies because Ps can choose
to turn into Cs and that would annihilate the stable states portrayed in the bottom left plot of figures 4.1
and 4.2 (since to be a cooperator against many punishers is individually beneficial).
21

----
Figure 4.1: Gradient of selection and stationary distribution of 2-strategy games — Ds versus Ps (left)
and Cs versus Ps (right) — for different sanctioning policies (see legend) and local institutions. Pun-
ishment does not affect a Ds versus Cs game because Cs do not punish. Therefore, the black line in
the left panel (no punishment) is equivalent to the gradient of selection of Ds versus Cs game. In the
right panel, red and blue lines are superimposed because there is no difference from strict to graduated
punishment since there are no defectors in that game. Note that both the gradient of selection and the
stationary distribution are discrete but for convenience of the figure, continuous lines are shown. Param-
eters: Z = 100, b = 1, c = 0.1, r = 0.15, N = 4, nPG = 0.75×N , nP = 0.25×N , µ = 1/Z, β = 5, g = 5
(when graduated), πf = 0.3, πt = 0.03.
22

-
-
-
----
Figure 4.2: Gradient of selection and stationary distribution of 2-strategy games — Ds versus Ps (left)
and Cs versus Ps (right) — for different sanctioning policies and local institutions (for a lower fine and
no risk). Caption and parameters are the same as in figure 4.1, except r = 0.0 and πf = 0.15.
4.2 3-strategy Collective Risk Dilemma with punishment
Although we have already obtained some knowledge about the role of the different sanctioning policies
by studying the 2-strategy CRD, we have also just seen the necessity of moving on to three strategies
— only a 3-strategy CRD can embody all possible interactions between agents and consequent effects.
In this section, we confirm some results from previous studies concerning the dependence on risk and
the action of either local and global institutions, but we extend the results by including now the three
sanctioning policies defined in chapter 3. Whenever necessary, we resort to simplexes to comprehend
the dynamics of the system and thus, the reasons of some (not so obvious) dependencies.
In figure 4.3, we present the dependence of ηG and ηI on the risk r for different types of external
institutions. Firstly, we confirm that risk increases cooperation (ηG grows with r) as obtained by other
authors in [11] and [6]. This can be explained resorting to figure 2.1, which represents the dynamics
of a 2-strategy game under a Collective Risk Dilemma (for an infinite population). High risk causes
both the decreasing of coordination point and the increasing of coexistence point (the recipe for high
cooperation) [11], which is an effect that is propagated to the 3-strategy game. Newly, we can verify
that different sanctioning policies have diverse consequences. The more effective type is graduated
23
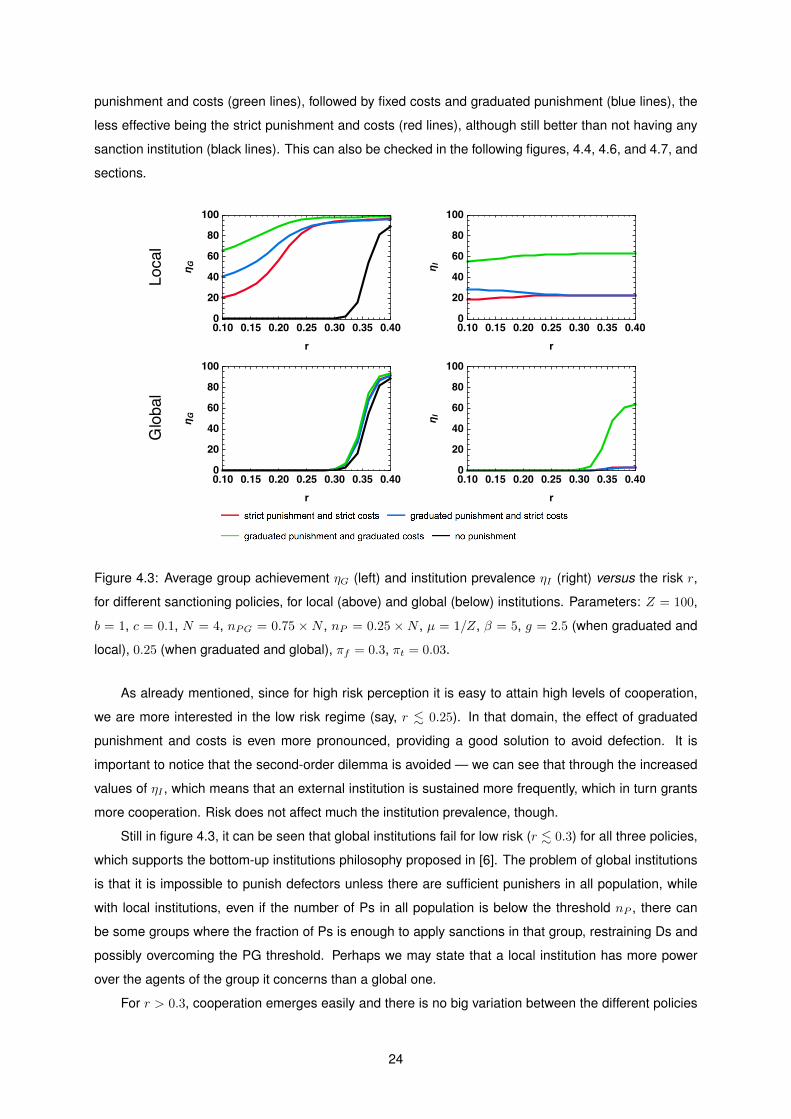
punishment and costs (green lines), followed by fixed costs and graduated punishment (blue lines), the
less effective being the strict punishment and costs (red lines), although still better than not having any
sanction institution (black lines). This can also be checked in the following figures, 4.4, 4.6, and 4.7, and
sections.Local
Global
η
η
η
η
Figure 4.3: Average group achievement ηG (left) and institution prevalence ηI (right) versus the risk r,
for different sanctioning policies, for local (above) and global (below) institutions. Parameters: Z = 100,
b = 1, c = 0.1, N = 4, nPG = 0.75 ×N , nP = 0.25 ×N , µ = 1/Z, β = 5, g = 2.5 (when graduated and
local), 0.25 (when graduated and global), πf = 0.3, πt = 0.03.
As already mentioned, since for high risk perception it is easy to attain high levels of cooperation,
we are more interested in the low risk regime (say, r . 0.25). In that domain, the effect of graduated
punishment and costs is even more pronounced, providing a good solution to avoid defection. It is
important to notice that the second-order dilemma is avoided — we can see that through the increased
values of ηI , which means that an external institution is sustained more frequently, which in turn grants
more cooperation. Risk does not affect much the institution prevalence, though.
Still in figure 4.3, it can be seen that global institutions fail for low risk (r . 0.3) for all three policies,
which supports the bottom-up institutions philosophy proposed in [6]. The problem of global institutions
is that it is impossible to punish defectors unless there are sufficient punishers in all population, while
with local institutions, even if the number of Ps in all population is below the threshold nP , there can
be some groups where the fraction of Ps is enough to apply sanctions in that group, restraining Ds and
possibly overcoming the PG threshold. Perhaps we may state that a local institution has more power
over the agents of the group it concerns than a global one.
For r > 0.3, cooperation emerges easily and there is no big variation between the different policies
24

(all ηG curves fairly overlap) — the risk plays the lead role. Since in the case of graduated costs, the
taxes are low when there is little defection, the institution is maintained with minor costs, that is, Cs and
Ps are virtually the same, which leads to the rise of ηI green curve in the bottom right plot.
The next two figures help better understanding the former results. In figure 4.4, the simplexes
represent the entire state space, each small circle being a different state, and they show the dynamics
of the system (with three strategies): the gradient of selection (vectors following a temperature color
gradient) and the stationary distribution (grey scale points, the darker spots being the most probable
states). Each vertex of the simplex is associated with a state entirely populated by just one of the
strategies (monomorphic configurations), whereas in each edge only two strategies are at stake. The
centre corresponds to the state with equal fractions of each species. Note that the edges of simplexes
do not exactly correspond to a 2-strategy game (as in the previous section 4.1) because mutations to a
third strategy are included. That is, the system can leave the edge moving to an inner state through a
mutation.
a) Strict punishment and costs b) Graduated punishment and strict costs c) Graduated punishment and costs
0.0 1.5
Gradient of selection (×10−1)
0.0 4.8
Stationary distribution (×10−%)
Figure 4.4: Simplexes of CRD with three strategies (C, P and D) for different sanctioning policies and
local institutions. Gradient of selection (colored vectors) and stationary distribution (grey scale points)
at each point of the state space, i. Below each simplex, the corresponding values of ηG, ηI , and the
average population configuration are displayed. Parameters are the same as in figure 4.1: Z = 100,
b = 1, c = 0.1, r = 0.15, N = 4, nPG = 0.75 × N , nP = 0.25 × N , µ = 1/Z, β = 5, g = 5 (when
graduated), πf = 0.3, πt = 0.03.
From figure 4.4 a) to b), states near vertex C become more probable (darker points). This effect is
due to the gradual nature of punishment — when the system is around vertex D (high levels of defection),
if the institution is attained, the sanctions on defectors are high, inhibiting their propagation. We can
verify this through the gradient of selection near vertex D: while in figure 4.4 a) the vectors are clearly
pointing towards that vertex, in figure b) they are less pronounced (the coordination barrier is almost
suppressed), escaping the full defection state and allowing the system to evolve onto highly cooperative
25

states. We can also notice that near edge D-P, the growth of Ps is faster (redder arrows from figure a) to
b)). From figure 4.4 b) to c), states close to C-P edge become more probable and the gradient ceases
to bend towards vertex C but strongly points to the C-P edge. This time, also the costs are graduated,
therefore in states with few defectors, punishers pay little (or almost no) taxes. Because of that, Cs and
Ps are virtually the same in C-P edge and the average number of Ps increases (from 11.1% to 40.9%).
Notice that, from the gradient of selection and the stationary distribution of the Cs versus Ps game in
figure 4.1 (right), we can tell that the stability of C-P edge is related to the low values of the gradient.
States near C-P are dangerous to defectors because if one pops up due to a mutation, it is likely that
there will be enough Ps to punish him/her. Hence, ηG increases from 54.2% to 83.7%.
In figure 4.5, and for the sake of illustration, the effect of a global institution becomes evident. It
can be seen a virtual line defined by iP = nP , which separates two areas of the state space, one where
there is no punishment (iP < nP ) and another where there is (iP ≥ nP ). Gradient of selection follows
very particular directions in these two different areas: for iP < nP it points towards vertex D, while for
iP ≥ nP it goes to C-P edge, after which the system is re-directed to area iP < nP , from where it is very
hard to escape. This is why the population is composed by many defectors most of the time.
Once we have seen, in figure 4.3, that the effect of the different policies is technically the same
for global institutions (where the risk is much more important), from now on we will only work with local
institutions. This is a legitimate assumption because, within our setting, the type of institution (local
or global) can be controlled. The same doesn’t apply to risk, for instance. Despite being possible to
implement measures in order to raise awareness among general public about today’s climate risks,
it is difficult to know with certainty the real risk (although it has been recently suggested that Earth
system is close to a ”planetary threshold that could lock in a continuing rapid pathway toward much
hotter conditions” which would lead to consequences that could not be reversed [52]). So, being able to
choose the type of external institution, let us assume a local one and investigate the possible outcomes.
26

0.0 1.5
Gradient of selection (×10$%)
0.0 4.8
Stationary distribution (×10$&)
D P
C
ηG = 0.0619%, ηI = 0.0088%
Ps = 1.62%, Cs = 2.09%, Ds = 96.3%
Figure 4.5: Simplex of CRD with three strategies (C, P and D) for strict punishment and costs, and global
institution. Below simplex, the values of ηG, ηI , and the average population configuration are displayed.
Parameters are the same as in figure 4.1: Z = 100, b = 1, c = 0.1, r = 0.15, N = 4, nPG = 0.75 × N ,
nP = 0.25× Z, µ = 1/Z, β = 5, πf = 0.3, πt = 0.03.
One may now investigate how graduate (or steep) should be the punishment and costs. So, we
explore the dependence on parameter g introduced in section 3. In figure 4.6, we can see that the higher
this parameter, the more cooperation and institutions are enhanced. This means that the variation of
fines and taxes (according to the number of defectors in the group) should be abrupt.
η
η
Figure 4.6: Average group achievement ηG (left) and institution prevalence ηI (right) versus the steep-
ness of graduated punishment/cost g for different sanctioning policies and local institutions. For g = 0,
strict punishment/cost is recovered. Parameters: Z = 100, b = 1, c = 0.1, r = 0.2, N = 4,
nPG = 0.75×N , nP = 0.25×N , µ = 1/Z, β = 5, πf = 0.3, πt = 0.03.
27

Another important parameter of our framework is the contribution c. Since we define benefit b as
1, c represents the fraction of the benefit one agent contributes in order to sustain the public good. It is
easy to understand how cooperation varies with c — if it is high, fewer agents will be willing to contribute,
as we can see in figure 4.7. As it turns out, graduated punishment and costs help increase cooperation
and institution prevalence even for high c. For instance, when the contribution is 20% of the benefit, it
is possible to raise ηG from approximately 3% to 25%, and ηI from 11% to 30%. This is valuable since
the costs associated with the maintenance of the public good may indeed be high — for example, the
primary expenses required to study and implement alternative energies to fossil fuels are substantial.
η
η
Figure 4.7: Average group achievement ηG (left) and institution prevalence ηI (right) versus contribution
c for different sanctioning policies and local institutions. Parameters: Z = 50, b = 1, r = 0.15, N = 4,
nPG = 0.75×N , nP = 0.25×N , µ = 1/Z, β = 5, g = 5 (when graduated), πf = 0.3, πt = 0.03.
The previous results about graduated punishment and costs are robust under a wide spectrum of
parameter combinations. We now inspect the impact of these parameters.
The impact of group size
In figure 4.8, we show the importance of the group size N . This parameter defines the scale at which
the games are played (or the agreements are discussed). We conclude that small groups are more
favorable to a cooperative behavior (as in [6]) and also to sanctioning institutions’ prevalence. In the limit
N → Z, a local institution becomes global, thus large groups (but not necessarily as large as N ≈ Z)
produce a dynamics that much resembles the one obtained with a global institution. Looking at figure
4.9, we can see that with only N = 12, a pattern similar to figure 4.5 already occurs. As we have seen,
that is not propitious to the growth of cooperators and punishers, which explains the decrease in ηG and
ηI , for increasing N .
28

η
η
Figure 4.8: Average group achievement ηG (left) and institution prevalence ηI (right) versus group size
n for different sanctioning policies and local institutions. Parameters: Z = 100, b = 1, c = 0.1, r = 0.2,
nPG = 0.75×N , nP = 0.25×N , µ = 1/Z, β = 5, g = 5 (when graduated), πf = 0.3, πt = 0.03.
0.0 1.5
Gradient of selection (×10$%)
0.0 4.8
Stationary distribution (×10$&)
D P
C
ηG = 0.486%, ηI = 0.693%
Ps = 1.86%, Cs = 2.36%, Ds = 95.8%
Figure 4.9: Simplex of CRD with three strategies (C, P and D) for strict punishment and costs, local insti-
tution, and large groups. Below simplex, the values of ηG, ηI , and the average population configuration
are displayed. Parameters: Z = 100, b = 1, c = 0.1, r = 0.15, N = 12, nPG = 0.75×N , nP = 0.25×N ,
µ = 1/Z, β = 5, πf = 0.3, πt = 0.03.
29
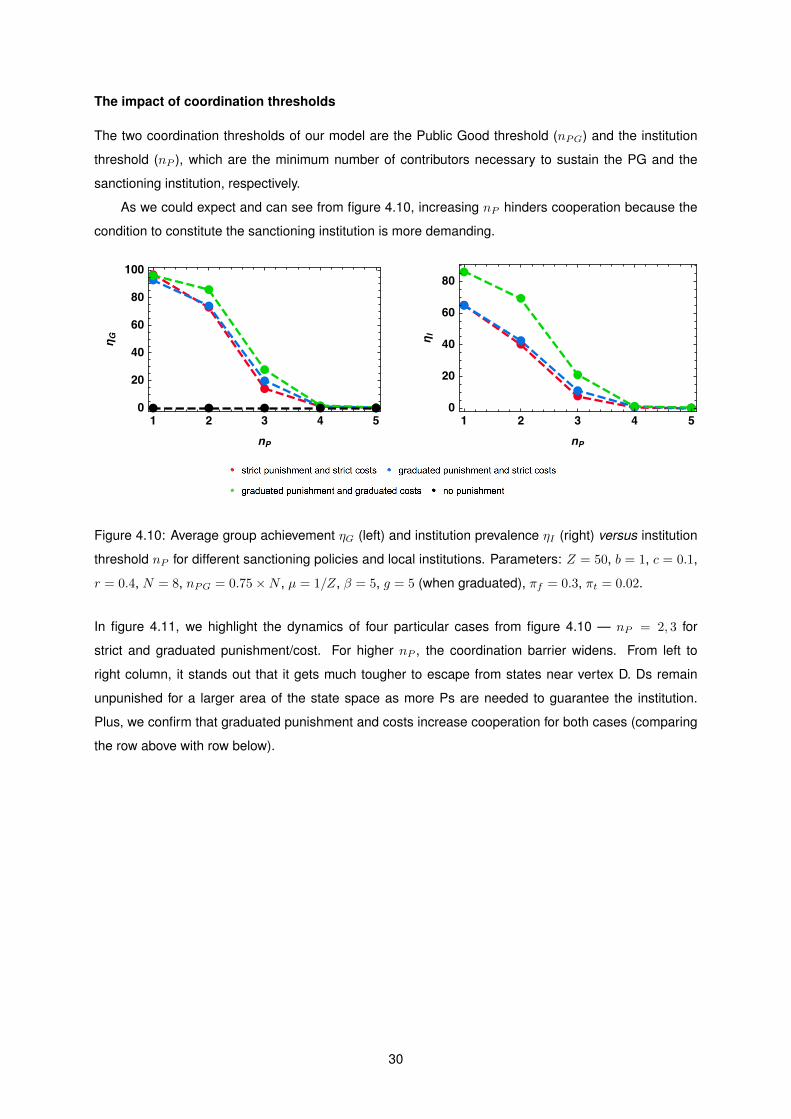
The impact of coordination thresholds
The two coordination thresholds of our model are the Public Good threshold (nPG) and the institution
threshold (nP ), which are the minimum number of contributors necessary to sustain the PG and the
sanctioning institution, respectively.
As we could expect and can see from figure 4.10, increasing nP hinders cooperation because the
condition to constitute the sanctioning institution is more demanding.
η
η
Figure 4.10: Average group achievement ηG (left) and institution prevalence ηI (right) versus institution
threshold nP for different sanctioning policies and local institutions. Parameters: Z = 50, b = 1, c = 0.1,
r = 0.4, N = 8, nPG = 0.75×N , µ = 1/Z, β = 5, g = 5 (when graduated), πf = 0.3, πt = 0.02.
In figure 4.11, we highlight the dynamics of four particular cases from figure 4.10 — nP = 2, 3 for
strict and graduated punishment/cost. For higher nP , the coordination barrier widens. From left to
right column, it stands out that it gets much tougher to escape from states near vertex D. Ds remain
unpunished for a larger area of the state space as more Ps are needed to guarantee the institution.
Plus, we confirm that graduated punishment and costs increase cooperation for both cases (comparing
the row above with row below).
30
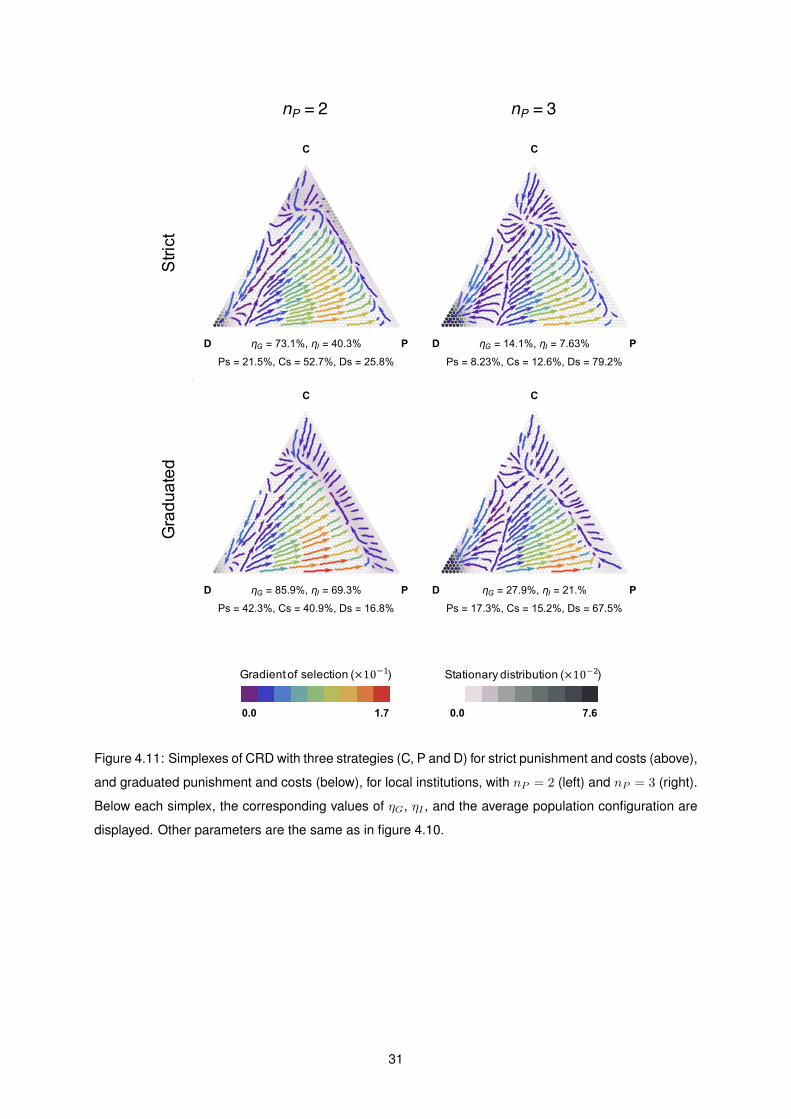
Strict
Graduated
D P
C
ηG = 73.1%, ηI = 40.3%Ps = 21.5%, Cs = 52.7%, Ds = 25.8%
D P
C
ηG = 14.1%, ηI = 7.63%Ps = 8.23%, Cs = 12.6%, Ds = 79.2%
D P
C
ηG = 85.9%, ηI = 69.3%Ps = 42.3%, Cs = 40.9%, Ds = 16.8%
D P
C
ηG = 27.9%, ηI = 21.%Ps = 17.3%, Cs = 15.2%, Ds = 67.5%
0.0 1.7
Gradient of selection (×10−1)
0.0 7.6
Stationary distribution (×10−%)
nP = 2 nP = 3
Figure 4.11: Simplexes of CRD with three strategies (C, P and D) for strict punishment and costs (above),
and graduated punishment and costs (below), for local institutions, with nP = 2 (left) and nP = 3 (right).
Below each simplex, the corresponding values of ηG, ηI , and the average population configuration are
displayed. Other parameters are the same as in figure 4.10.
31

In figure 4.12, we study the dependence on nPG. We would expect an increase of ηG with low
nPG because it becomes easier to attain the PG if the threshold is not too high. However, this wouldn’t
necessarily lead to more cooperators (since it is possible to achieve the PG with fewer contributors).
This is not what happens, though.
η
η
Figure 4.12: Average group achievement ηG, institution prevalence ηI and average fraction of Ds versus
the PG threshold nPG for different sanctioning policies and local institutions. Parameters: Z = 100,
b = 1, c = 0.1, r = 0.2, N = 8, nP = 0.25 × N , µ = 1/Z, β = 5, g = 5 (when graduated), πf = 0.3,
πt = 0.03.
The threshold nPG influences significantly the punishment/cost curves due to the way we define them
(remember equations 3.2). To help to picture it, we add the auxiliary figure 4.13. When nPG is low (see
the orange line, for instance), a great part of the domain jD (number of defectors in a group) has a very
low punishment: only for jD ≥ N − nPG the punishment is strong. This affects the effectiveness of the
sanctions and might be the reason why strict punishment (see blue line) works better than graduated
punishment for low values of nPG.
( )
Δ(
)
===
( )
Δ(
)
===
Figure 4.13: Fine ∆f versus the number of defectors jD. Comparison between strict punishment (blue
line) and graduated punishment (other lines) for different values of nPG (2, 4 and 6). Note that this plot
is of the same type of the one in figure 3.2, except that here we vary nPG and keep g constant for all
curves. Parameters: N = 8, g = 5 (when graduated), and πf = 0.3.
This information does not compromise the validity of graduated sanctions. Until now, we have kept
32

nPG constant and relatively high (0.75 ×N ) because efforts needed to achieve the Public Good, which
in the present scenario is the environment preservation, are still substantial [11]. Besides being more
realistic to assume a high nPG, for low nPG one does not really have a problem to solve because it is
much less difficult to coordinate efforts. That said, we are only interested in the high nPG case. In that
regime, graduated still wins (in figure 4.12, for instance, that occurs for nPG & 0.5×N ).
The effect of nPG and g combined is better perceived in figure 4.14. The highest levels of coop-
eration are attained for very low nPG and fairly strict punishment (low g). Notice that the first vertical
bar of the contour plots, g = 0, corresponds to strict punishment and costs (while for g > 0 we have
graduated punishment and costs). For increasing g, the coloring of the vertical bars starts inverting, that
is, graduated punishment boosts cooperation for high values of nPG. So, we reconfirm that graduated
punishment and costs are more effective in the interval we are interested in, which in figure 4.14 is the
top of each panel (higher nPG).
10
21% 78%
3% 45%
13% 53%
2
0.0 2.5
10
2
0.0 2.5
10
2
0.0 2.5
Figure 4.14: Average group achievement ηG, institution prevalence ηI and average fraction of Cs plus
Ps for different values of nPG and g. The range of the parameters is the same in all panels. Other
parameters: Z = 50, b = 1, c = 0.1, r = 0.25, N = 12, nP = 0.25 × N , µ = 1/Z, β = 5, πf = 0.3,
πt = 0.03.
33

The impact of fine and tax
As for πf and πt, we can see in figure 4.15 that increasing πf enhances cooperation, whereas πt inhibits
it, for obvious reasons. But more meaningful is to notice that graduated punishment and costs work
better for a broader set of parameters — in figure 4.15, reddish areas grow from top to bottom panels.
Graduated
Strict
0.0 0.30.00
0.05
1% 98% 10% 80%
0.0 0.30.00
0.05
0.0 0.30.00
0.05
0.0 0.30.00
0.05
Figure 4.15: Average group achievement ηG (left) and institution prevalence ηI (right) for different values
of πf and πt, for strict (top) and graduated punishment and costs (bottom) local institutions. The range
of the parameters is the same in all panels. Other parameters: Z = 50, b = 1, c = 0.1, r = 0.2, N = 4,
nPG = 0.75×N , nP = 0.25×N , µ = 1/Z, β = 5, g = 5 (when graduated).
The impact of intensity of selection and mutation probability
Finally, let’s investigate the importance of intensity of selection β and mutation probability µ. Intensity of
selection, as the name implies, defines how relevant is the fitness difference to the choice of imitating
(or not) a new strategy. Thus, β = 0 means neutral selection, that is, the choice is not influenced
by strategies’ fitness whereas β → ∞ corresponds to always copy better strategies (perfect imitation).
Intermediate values of β account for errors of imitation. In figure 4.16, we can verify that there exists
an optimal value for β, which is around 5, for graduated punishment and costs. For values above that,
cooperation and also institutions rapidly decrease. Generically, choices with errors favor cooperation,
which is good news since humans are indeed prone to error and there may be many reasons influencing
a choice other than what is accounted in payoff functions. Moreover, we prove once again that graduated
punishment and costs help to raise cooperation.
34
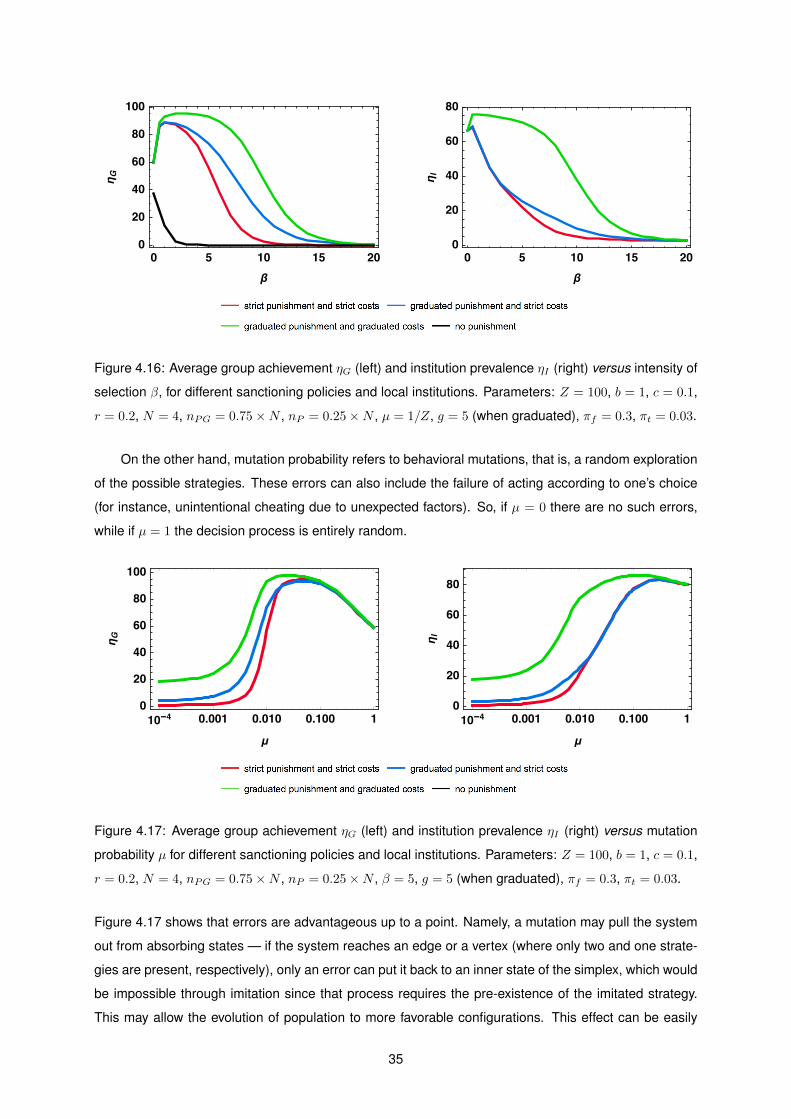
β
η
β
η
Figure 4.16: Average group achievement ηG (left) and institution prevalence ηI (right) versus intensity of
selection β, for different sanctioning policies and local institutions. Parameters: Z = 100, b = 1, c = 0.1,
r = 0.2, N = 4, nPG = 0.75×N , nP = 0.25×N , µ = 1/Z, g = 5 (when graduated), πf = 0.3, πt = 0.03.
On the other hand, mutation probability refers to behavioral mutations, that is, a random exploration
of the possible strategies. These errors can also include the failure of acting according to one’s choice
(for instance, unintentional cheating due to unexpected factors). So, if µ = 0 there are no such errors,
while if µ = 1 the decision process is entirely random.
-
μ
η
-
μ
η
Figure 4.17: Average group achievement ηG (left) and institution prevalence ηI (right) versus mutation
probability µ for different sanctioning policies and local institutions. Parameters: Z = 100, b = 1, c = 0.1,
r = 0.2, N = 4, nPG = 0.75×N , nP = 0.25×N , β = 5, g = 5 (when graduated), πf = 0.3, πt = 0.03.
Figure 4.17 shows that errors are advantageous up to a point. Namely, a mutation may pull the system
out from absorbing states — if the system reaches an edge or a vertex (where only two and one strate-
gies are present, respectively), only an error can put it back to an inner state of the simplex, which would
be impossible through imitation since that process requires the pre-existence of the imitated strategy.
This may allow the evolution of population to more favorable configurations. This effect can be easily
35
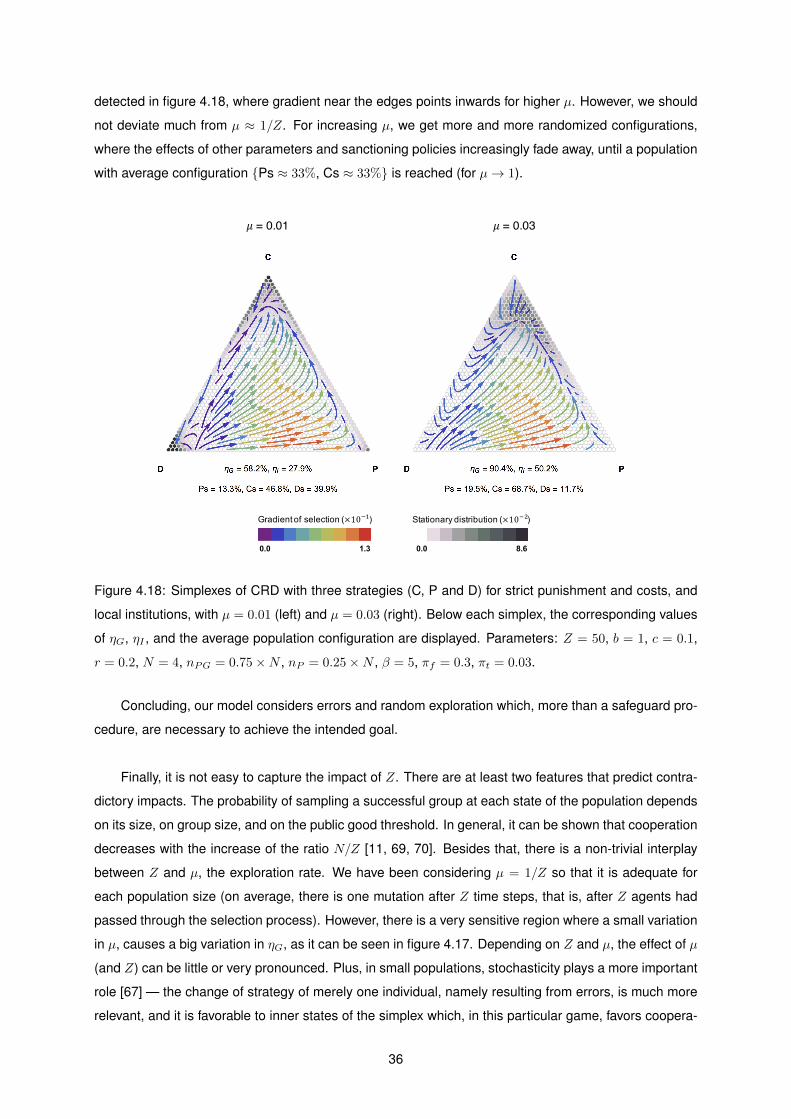
detected in figure 4.18, where gradient near the edges points inwards for higher µ. However, we should
not deviate much from µ ≈ 1/Z. For increasing µ, we get more and more randomized configurations,
where the effects of other parameters and sanctioning policies increasingly fade away, until a population
with average configuration Ps ≈ 33%, Cs ≈ 33% is reached (for µ→ 1).
0.0 1.3
Gradient of selection (×10$%)
0.0 8.6
Stationary distribution (×10$&)
𝜇= 0.01 𝜇= 0.03
Figure 4.18: Simplexes of CRD with three strategies (C, P and D) for strict punishment and costs, and
local institutions, with µ = 0.01 (left) and µ = 0.03 (right). Below each simplex, the corresponding values
of ηG, ηI , and the average population configuration are displayed. Parameters: Z = 50, b = 1, c = 0.1,
r = 0.2, N = 4, nPG = 0.75×N , nP = 0.25×N , β = 5, πf = 0.3, πt = 0.03.
Concluding, our model considers errors and random exploration which, more than a safeguard pro-
cedure, are necessary to achieve the intended goal.
Finally, it is not easy to capture the impact of Z. There are at least two features that predict contra-
dictory impacts. The probability of sampling a successful group at each state of the population depends
on its size, on group size, and on the public good threshold. In general, it can be shown that cooperation
decreases with the increase of the ratio N/Z [11, 69, 70]. Besides that, there is a non-trivial interplay
between Z and µ, the exploration rate. We have been considering µ = 1/Z so that it is adequate for
each population size (on average, there is one mutation after Z time steps, that is, after Z agents had
passed through the selection process). However, there is a very sensitive region where a small variation
in µ, causes a big variation in ηG, as it can be seen in figure 4.17. Depending on Z and µ, the effect of µ
(and Z) can be little or very pronounced. Plus, in small populations, stochasticity plays a more important
role [67] — the change of strategy of merely one individual, namely resulting from errors, is much more
relevant, and it is favorable to inner states of the simplex which, in this particular game, favors coopera-
36

tion. For all these reasons, the effect of Z is not necessarily monotonic and there is not a straightforward
conclusion about it.
4.3 A different kind of incentive
Until now we have just been talking about punishment. However, it is quite natural to think that the
reverse kind of incentive, reward, might also be a nice tool to instigate a prosocial behavior [71–75]. In
the literature, we can find the designation positive and negative incentive for reward and punishment,
respectively, which we abstain from using here since it can be mistaken as a right/wrong connotation.
We now include a few remarks about rewards.
First, for the same reasons as before, the new incentive is also costly, so, in our EGT framework,
we still need agents that pay for it — we call them Rewarders (Rs), although their role is identical to that
of punishers. Considering that the ones which should be rewarded are all players except defectors, we
write the payoff functions similarly to equations 3.1, only exchanging the subtractive term of punishment
πf in the payoff of defectors, by an additive term of reward πr in the payoffs of cooperators and rewarders:
ΠC = −c+ bΘ(jC + jR − nPG) + (1− r)b[1−Θ(jC + jR − nPG)] + ∆rΘ(jR − nR) (4.1a)
ΠR = ΠC −∆t (4.1b)
ΠD = bΘ(jC + jR − nPG) + (1− r)b[1−Θ(jC + jR − nPG)] (4.1c)
In the equations above, we substituted the index P by R. For instance, analogously to nP , nR is the
number of rewarders needed to establish the reward institution.
Second, rewarding cannot be directly compared to sanctioning in the sense that imposing ∆f = ∆r
wouldn’t be fair. The fine should be greater than c but there is no sense in the reward being too — that
would unbalance and change the nature of the game. Therefore, our point is not to compare the effect
of rewards with sanctions, but rather to assess if graduated rewards lead to better results than strict
rewards. Nevertheless, it can be argued that rewarding is more effective than punishing at overcoming
the coordination problem [74]. It is very difficult that a single punisher gives rise to cooperation, while a
single rewarder has more chances due to the balance between the tax paid for the fund and the reward
itself.
So, the idea is to implement graduated rewards analogously to punishment, that is, to give higher
rewards to Cs and Rs when these are few. Another aspect to bear in mind is how we should define
the graduated costs. Before, we assumed that the costs to constitute the sanctioning institution would
increase with the number of defectors (more cheaters to deal with imply more expenses). Now makes
sense that costs increase when there exist many agents to reward, that is, when there are just a few
defectors. For that, we just need to adapt equation 3.2b changing the sign in the exponent,
37
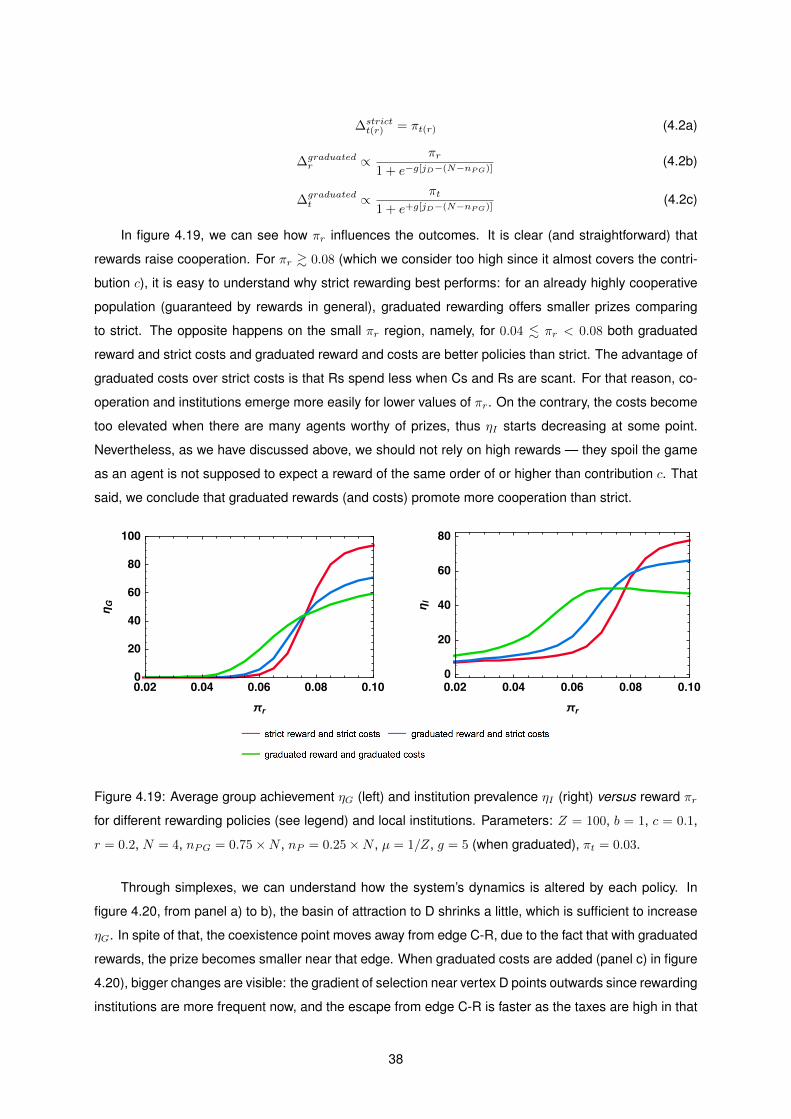
∆strictt(r) = πt(r) (4.2a)
∆graduatedr ∝ πr
1 + e−g[jD−(N−nPG)](4.2b)
∆graduatedt ∝ πt
1 + e+g[jD−(N−nPG)](4.2c)
In figure 4.19, we can see how πr influences the outcomes. It is clear (and straightforward) that
rewards raise cooperation. For πr & 0.08 (which we consider too high since it almost covers the contri-
bution c), it is easy to understand why strict rewarding best performs: for an already highly cooperative
population (guaranteed by rewards in general), graduated rewarding offers smaller prizes comparing
to strict. The opposite happens on the small πr region, namely, for 0.04 . πr < 0.08 both graduated
reward and strict costs and graduated reward and costs are better policies than strict. The advantage of
graduated costs over strict costs is that Rs spend less when Cs and Rs are scant. For that reason, co-
operation and institutions emerge more easily for lower values of πr. On the contrary, the costs become
too elevated when there are many agents worthy of prizes, thus ηI starts decreasing at some point.
Nevertheless, as we have discussed above, we should not rely on high rewards — they spoil the game
as an agent is not supposed to expect a reward of the same order of or higher than contribution c. That
said, we conclude that graduated rewards (and costs) promote more cooperation than strict.
π
η
π
η
Figure 4.19: Average group achievement ηG (left) and institution prevalence ηI (right) versus reward πr
for different rewarding policies (see legend) and local institutions. Parameters: Z = 100, b = 1, c = 0.1,
r = 0.2, N = 4, nPG = 0.75×N , nP = 0.25×N , µ = 1/Z, g = 5 (when graduated), πt = 0.03.
Through simplexes, we can understand how the system’s dynamics is altered by each policy. In
figure 4.20, from panel a) to b), the basin of attraction to D shrinks a little, which is sufficient to increase
ηG. In spite of that, the coexistence point moves away from edge C-R, due to the fact that with graduated
rewards, the prize becomes smaller near that edge. When graduated costs are added (panel c) in figure
4.20), bigger changes are visible: the gradient of selection near vertex D points outwards since rewarding
institutions are more frequent now, and the escape from edge C-R is faster as the taxes are high in that
38

region. Overall, a beneficial effect is produced (see values of ηG, ηI and average configuration).
D R
C
ηG =6.05%, ηI =16.3%
Rs=5.16%, Cs=5.98%, Ds=88.9%
D R
C
ηG =13.8%, ηI =30.9%
Rs=11.2%, Cs=10.7%, Ds=78.1%
D R
C
ηG =29.2%, ηI =48.%
Rs=18.4%, Cs=22.9%, Ds=58.6%
a) Strict rewards and costs b) Graduated rewards and strict costs c) Graduated rewards and costs
0.0 0.61
Gradient of selection (×10$%)
0.0 5.5
Stationary distribution (×10$&)
Figure 4.20: Simplexes of CRD with three strategies (C, R and D) for different rewarding policies and
local institutions. Below each simplex, the corresponding values of ηG, ηI , and the average population
configuration are displayed. Parameters are the same as in figure 4.1: Z = 100, b = 1, c = 0.1, r = 0.15,
N = 4, nPG = 0.75×N , nP = 0.25×N , µ = 1/Z, β = 5, g = 5 (when graduated), πr = 0.065, πt = 0.03.
There are many ways of implementing incentives, including a combination of both types [75, 76].
For example, based on a PGG with pool-incentives, a study suggests that an adaptive hybrid institutional
policy which either rewards or punishes, according to the state of the system (”first carrot, then stick”)
is more effective and cost-efficient than rewards or sanctions alone [75]. Again, we have evidence that
conditional incentives (as for instance, our proposal of graduated punishment or rewards) are a gateway
to achieving more cooperative societies. Thus, innovative designs and subsequent experiments are
highly desirable.
39

40
Chapter 5
Conclusions
5.1 Achievements
We are now at a position that allows the recovery of questions posed in section 1.2 and answer them.
First, we conclude that graduated punishment is better than strict at preventing defection in a Collective
Risk Dilemma when the conjoint effort needed to maintain the public good is relatively high, especially
if the perception of risk is low. Plus, the proposed formulation of graduated costs solves the problem of
second-order free-riding, sustaining external institutions with ease. Our model overcomes some of the
previously identified problems pointed out in section 2.4, namely the artificiality of assuming an uncon-
ditional and uncoordinated punishment. Although we do not take into account communication between
punishers, we somehow coordinate costs (supported by punishers or rewarders) as we consider gradu-
ated costs — the institution threshold (nP or nR) is constant but when there are few agents to punish or
reward, the cost is diminished, while when there are many the cost is raised.
The results reported support Ostrom’s empirical findings [29], despite the fact that her argument
was based on psychological reasons, since severe sanctions can create resentment or distrust. Beyond
that, we show that graduated punishment is indeed an enduring collective solution. Thus, it is plausible
that it has co-evolved with cooperation more than strict punishment.
Not surprisingly, rewards also work as a mechanism to avoid the tragedy of the commons. We
emphasize that is not straightforward to compare rewards with sanctions. But curiously, we verify that
graduated rewards are more effective than strict, similarly to what happens with punishment.
As previously discovered, cooperation emerges more frequently if agents engage in small groups
(N ∼ 4). Newly, graduated punishment works better in such conditions, that is if regulated by local
institutions, instead of a global one. These facts suggest that agreements on climate change should
concern regions or a compartmented structure rather than being implemented at a global scale. This
is the so-called polycentric or bottom-up approach to environmental governance advocated by several
authors [54, 58]. Sigmund et al. [36] nicely put it as following
A punishment fund can be viewed as a rudimentary institution to uphold the common interest.
Many small-scale societies use this principle, for instance by hiring an enforcer. In Ostrom’s
41

”Governing the Commons” [29], several examples of self-financed contract enforcement are
described. (...) individuals can spontaneously adopt a self-governing institution to monitor
contributions and sanction free-riders. It needs no top-down prescriptions from higher au-
thorities, nor great feats of planning: trial and error, and the imitation of successful examples
can lead to a social contract among individuals guided by self-interest.
So, using a Collective Risk Dilemma approach, we prove that polycentricity allied to graduated
sanctions is a robust policy to cope with environmental offenses.
Summarizing, our proposal encloses the following sub-achievements
• a useful dynamical framework which allows the study of the evolution of strategies in finite popula-
tions;
• a mechanism that promotes cooperation in a risky context, graduated incentives;
• an application for climate governance.
5.2 Future Work
We end up reflecting on work that may be carried out in the future. First, it is worth stressing that the
theoretical tool used here is both powerful and general. It is easy to apply to other collective dilemmas,
provided that strategies and corresponding payoffs are suitably defined. For instance, new strategies
can be added or different functions for punishment and costs could be studied. Also, it is important
to think how the present theoretical results can, in effect, be applied to real settings. Experimentation,
either in the lab or in actual populations, is needed.
One feature that is not studied here is population structure. We know already that different popula-
tion organizations may give different results [11, 39]. Particularly, it should be recognized how important
is the structure in the context of environmental agreements. How do countries organize themselves in
groups of co-players? Which are more frequent: groups of countries that share borders or countries that
are equally wealthy, for instance? Which countries are the most influent (that is, that are role models
to others)? On this, one can also ask if groups are approximately fixed or not. Ultimately, the point is
to know how all these settings can be optimally engineered, that is, what are the best combinations of
incentives and population organization, in terms of cooperation levels, feasibility and readiness.
Also the effects of indirect reciprocity (reputation), diversity in agents’ characteristics and wealth
inequality combined with sanctions and/or rewards should be investigated.
In this Future Work section, we would also like to leave a final note on how presently we need to
change minds and actions. For a long time, we have been cheating on Earth, but now we really have to
start cooperating instead, before all kinds of reciprocity become exhausted.
42

Bibliography
[1] R. Axelrod. The Evolution of Cooperation. Basic Books, Inc., Publishers, 1984. ISBN
9788578110796. doi: 10.1017/CBO9781107415324.004.
[2] C. Hauert and G. Szabo. Game theory and physics. American Journal of Physics, 73(5):405–414,
5 2005. ISSN 0002-9505. doi: 10.1119/1.1848514.
[3] M. Perc, J. J. Jordan, D. G. Rand, Z. Wang, S. Boccaletti, and A. Szolnoki. Statistical physics of hu-
man cooperation. Physics Reports, 5 2017. ISSN 03701573. doi: 10.1016/j.physrep.2017.05.
004. URL http://arxiv.org/abs/1705.07161%0Ahttp://dx.doi.org/10.1016/j.physrep.
2017.05.004.
[4] E. Pennisi. How did cooperative behavior evolve? Science, 309(5731):93–93, 2005. ISSN 0036-
8075. doi: 10.1126/science.309.5731.93. URL http://science.sciencemag.org/content/309/
5731/93.
[5] M. Nowak and R. Highfield. SuperCooperators: Altruism, Evolution, and Why We Need Each Other
to Succeed. Simon and Schuster, 2011.
[6] V. V. Vasconcelos, F. C. Santos, and J. M. Pacheco. A bottom-up institutional approach to co-
operative governance of risky commons. Nature Climate Change, 3(9):797–801, 2013. doi:
10.1038/nclimate1927.
[7] S. Barrett. Environment and Statecraft: The Strategy of Environmental Treaty-Making. Oxford Uni-
versity Press, 2005. URL https://EconPapers.repec.org/RePEc:oxp:obooks:9780199286096.
[8] S. Barrett. Why cooperate? The incentive to supply global public goods. Oxford University Press,
2007.
[9] M. Milinski, R. D. Sommerfeld, H.-J. Krambeck, F. A. Reed, and J. Marotzke. The collective-risk
social dilemma and the prevention of simulated dangerous climate change. Proceedings of the
National Academy of Sciences, 105(7):2291–2294, 2008. ISSN 0027-8424. doi: 10.1073/pnas.
0709546105. URL http://www.pnas.org/cgi/doi/10.1073/pnas.0709546105.
[10] A. Dreber and M. A. Nowak. Gambling for global goods. Proceedings of the National Academy
of Sciences, 105(7):2261–2262, 2008. ISSN 0027-8424. doi: 10.1073/pnas.0800033105. URL
http://www.pnas.org/content/105/7/2261.
43

[11] F. C. Santos and J. M. Pacheco. Risk of collective failure provides an escape from the tragedy
of the commons. Proc. Natl. Acad. Sci. USA, 108(26):10421–10425, 2011. doi: 10.1073/pnas.
1015648108.
[12] D. G. Rand and M. A. Nowak. Human cooperation. Trends in Cognitive Sciences, 17(8):413–425,
2013. doi: 10.1016/j.tics.2013.06.003.
[13] J. Von Neumann and O. Morgenstern. Theory of games and economic behavior. Bull. Amer. Math.
Soc, 51(7):498–504, 1947. ISSN 0031-8248. doi: 10.1086/286866.
[14] J. F. Nash. Equilibrium points in n-person games. Proceedings of the National Academy of Sci-
ences, 36(1):48–49, 1950. ISSN 0027-8424. doi: 10.1073/pnas.36.1.48. URL http://www.pnas.
org/cgi/doi/10.1073/pnas.36.1.48.
[15] G. Hardin. The tragedy of the commons. Science, 162(3859):1243–1248, 1968. ISSN 0036-
8075. doi: 10.1126/science.162.3859.1243. URL http://science.sciencemag.org/content/
162/3859/1243.
[16] K. Sigmund. The Calculus of Selfishness. Princeton University Press, 2010. ISBN 9780691142753.
[17] S. H. Strogatz. Nonlinear Dynamics and Chaos. Perseus Books, 1994. ISBN 0738204536. doi:
9780738204536.
[18] R. L. Trivers. The evolution of reciprocal altruism. The Quarterly Review of Biology, 46(1):35–57,
1971. doi: 10.1086/406755. URL https://doi.org/10.1086/406755.
[19] M. A. Nowak and K. Sigmund. Evolution of indirect reciprocity. Nature, 437:1291–1298, 2005. URL
http://dx.doi.org/10.1038/nature04131.
[20] F. P. Santos, F. C. Santos, and J. M. Pacheco. Social norm complexity and past reputations in the
evolution of cooperation. Nature Publishing Group, 555(7695):242–245, 2018. ISSN 0028-0836.
doi: 10.1038/nature25763. URL http://dx.doi.org/10.1038/nature25763.
[21] A.-L. Barabasi and R. Albert. Emergence of scaling in random networks. Science, 509(1999), 1999.
ISSN 00368075. doi: 10.1126/science.286.5439.509. URL http://arxiv.org/abs/cond-mat/
9910332%0Ahttp://dx.doi.org/10.1126/science.286.5439.509.
[22] F. C. Santos and J. M. Pacheco. Scale-free networks provide a unifying framework for the
emergence of cooperation. Physical Review Letters, 95(9):1–4, 2005. ISSN 00319007. doi:
10.1103/PhysRevLett.95.098104.
[23] D. S. Wilson. A theory of group selection. Proc. Natl. Acad. Sci. USA, 72(1):143–146, 1975.
[24] A. Traulsen and M. A. Nowak. Evolution of cooperation by multilevel selection. Proceed-
ings of the National Academy of Sciences, 103(29):10952–10955, 2006. ISSN 0027-
8424. doi: 10.1073/pnas.0602530103. URL http://www.pnas.org/content/103/29/
44

10952.abstract%5Cnhttp://www.pnas.org/content/103/29/10952.full.pdf%5Cnhttp:
//www.pnas.org/cgi/content/abstract/103/29/10952.
[25] W. Hamilton. The genetical evolution of social behaviour. i. Journal of Theoretical Biology, 7(1):1 –
16, 1964. ISSN 0022-5193. doi: https://doi.org/10.1016/0022-5193(64)90038-4.
[26] M. van Veelen, J. Garcia, D. G. Rand, and M. A. Nowak. Direct reciprocity in structured popula-
tions. Proceedings of the National Academy of Sciences, 109(25):9929–9934, 2012. ISSN 0027-
8424. doi: 10.1073/pnas.1206694109. URL http://www.pnas.org/cgi/doi/10.1073/pnas.
1206694109.
[27] T. H. Clutton-Brock and G. A. Parker. Punishment in animal societies. Nature, 373:209–216, 1995.
[28] R. Axelrod. An Evolutionary Approach to Norms. The American Political Science Review, 80(4):
1095–1111, 1986.
[29] E. Ostrom. Governing the Commons: The Evolution of Institutions for Collective Action. Cambridge
University Press, New York, 1990.
[30] E. Fehr and S. Gachter. Altruistic punishment in humans. Nature, 415(6868):137–140, 2002. ISSN
00280836. doi: 10.1038/415137a.
[31] E. Fehr and S. Gachter. Cooperation and Punishment in Public Goods Experiments. American
Economic Review, 90(4):980–994, 2000.
[32] R. Boyd, H. Gintis, and S. Bowles. Coordinated punishment of defectors sustains cooperation and
can proliferate when rare. Science, 328(5978):617–620, 2010. ISSN 0036-8075. doi: 10.1126/
science.1183665. URL http://www.sciencemag.org/cgi/doi/10.1126/science.1183665.
[33] R. Boyd and P. J. Richerson. Punishment allows the evolution of cooperation (or anything else) in
sizable groups. Ethology and Sociobiology, 13(3):171–195, 1992. ISSN 01623095. doi: 10.1016/
0162-3095(92)90032-Y.
[34] A. Dreber, D. G. Rand, D. Fudenberg, and M. A. Nowak. Winners don’t punish. Nature, 452:
348–351, 2008. doi: 10.1038/nature06723.
[35] M. A. Nowak. Five rules for the evolution of cooperation. Science, 314(5805):1560–1563, 2006.
doi: 10.1126/science.1133755.Five.
[36] K. Sigmund, H. De Silva, A. Traulsen, and C. Hauert. Social learning promotes institutions for
governing the commons. Nature, 466(7308):861–863, 2010. ISSN 0036-8075. doi: 10.1038/
nature09203. URL http://dx.doi.org/10.1038/nature09203.
[37] Y. Iwasa and J.-H. Lee. Graduated punishment is efficient in resource management if people are
heterogeneous. Journal of Theoretical Biology, 333:117–125, 2013. doi: 10.1016/j.jtbi.2013.05.
007.
45

[38] M. Perc and A. Szolnoki. Self-organization of punishment in structured populations. New Journal
of Physics, 14, 2012.
[39] H. Shimao and M. Nakamaru. Strict or graduated punishment? Effect of punishment strictness on
the evolution of cooperation in continuous public goods games. PLoS ONE, 8(1):1–10, 2013. doi:
10.1371/journal.pone.0059894.
[40] M. Levi. Of Rule and Revenue. University of California Press, 1988. ISBN 9780520067509. URL
http://www.jstor.org/stable/10.1525/j.ctt1pngtk.
[41] M. Nakamaru and U. Dieckmann. Runaway selection for cooperation and strict-and-severe punish-
ment. Journal of Theoretical Biology, 257(1):1–8, 2009. doi: 10.1016/j.jtbi.2008.09.004.
[42] T. Ohdaira. Study of the Evolution of Cooperation Based on an Alternative Notion of Punishment
“Sanction with Jealousy”. Journal of Information Processing, 24(3):534–539, 2016. ISSN 1882-
6652. doi: 10.2197/ipsjjip.24.534. URL https://www.jstage.jst.go.jp/article/ipsjjip/24/
3/24_534/_article.
[43] T. Ohdaira. Evolution of cooperation by the introduction of the probabilistic peer-punishment based
on the difference of payoff. Scientific Reports, 6(April):1–9, 2016. ISSN 20452322. doi: 10.1038/
srep25413. URL http://dx.doi.org/10.1038/srep25413.
[44] E. Fehr and K. M. Schmidt. A theory of fairness, competition, and cooperation. The Quarterly
Journal of Economics, 114(3):817–868, 1999. URL https://EconPapers.repec.org/RePEc:oup:
qjecon:v:114:y:1999:i:3:p:817-868.
[45] D. G. Rand and M. A. Nowak. The evolution of antisocial punishment in optional public
goods games. Nature Communications, 2(1):434–437, 2011. ISSN 20411723. doi: 10.1038/
ncomms1442. URL http://dx.doi.org/10.1038/ncomms1442.
[46] H. X. Yang, Z. X. Wu, Z. Rong, and Y. C. Lai. Peer pressure: Enhancement of cooperation through
mutual punishment. Physical Review E - Statistical, Nonlinear, and Soft Matter Physics, 91(2):1–6,
2015. ISSN 15502376. doi: 10.1103/PhysRevE.91.022121.
[47] G. Heal and B. Kristrom. Uncertainty and climate change. Environmental and Resource Economics,
22(1):3–39, 2002.
[48] H. Schellnhuber, S. Rahmstorf, and R. Winkelmann. Why the right climate target was agreed in
paris. Nature Climate Change, 6:649–653, 06 2016.
[49] J. Rogelj, M. Elzen, N. Hohne, T. Fransen, H. Fekete, H. Winkler, R. Schaeffer, F. Sha, K. Riahi, and
M. Meinshausen. Paris Agreement climate proposals need a boost to keep warming well below
2oC. Nature, 534:631–639, 06 2016.
[50] O. Milman. James Hansen, father of climate change awareness, calls Paris talks ’a fraud’. The
Guardian, December 2015. URL https://www.theguardian.com/environment/2015/dec/12/
james-hansen-climate-change-paris-talks-fraud.
46
[51] S. Barrett. Self-enforcing international environmental agreements. Oxford Economic Papers, 46
(Supplement 1):878–894, oct 1994. doi: 10.1093/oep/46.supplement 1.878. URL https://doi.
org/10.1093%2Foep%2F46.supplement_1.878.
[52] W. Steffen, J. Rockstrom, K. Richardson, T. M. Lenton, C. Folke, D. Liverman, C. P. Summer-
hayes, A. D. Barnosky, S. E. Cornell, M. Crucifix, J. F. Donges, I. Fetzer, S. J. Lade, M. Scheffer,
R. Winkelmann, and H. J. Schellnhuber. Trajectories of the earth system in the anthropocene. Pro-
ceedings of the National Academy of Sciences, 115(33):8252–8259, 2018. ISSN 0027-8424. doi:
10.1073/pnas.1810141115. URL http://www.pnas.org/content/115/33/8252.
[53] S. Polasky, S. R. Carpenter, C. Folke, and B. Keeler. Decision-making under great uncertainty:
Environmental management in an era of global change. Trends in Ecology and Evolution, 26(8):
398–404, 2011. ISSN 01695347. doi: 10.1016/j.tree.2011.04.007.
[54] E. Ostrom. Polycentric systems for coping with collective action and global environmental change.
Global Environmental Change, 20(4):550 – 557, 2010. ISSN 0959-3780. doi: https://doi.org/
10.1016/j.gloenvcha.2010.07.004. URL http://www.sciencedirect.com/science/article/pii/
S0959378010000634. 20th Anniversary Special Issue.
[55] N. Oreskes and E. M. Conway. Merchants of Doubt: How a Handful of Scientists Obscured the
Truth on Issues from Tobacco Smoke to Global Warming. Bloomsbury, 2010.
[56] S. Mandiberg and M. Faure. A graduated punishment approach to environmental crimes: beyond
vindication of administrative authority in the United States and Europe. Columbia Journal Of Envi-
ronmental Law, (34):447–511, 2009.
[57] A. Jordan, D. Huitema, M. Hilden, h. van asselt, T. Rayner, J. J. Schoenefeld, J. Tosun, J. Forster,
and E. Boasson. Emergence of polycentric climate governance and its future prospects. Nature
Climate Change, 5:977—-982, 05 2015.
[58] A. Jordan, D. Huitema, H. van Asselt, and J. Forster, editors. Governing Climate Change: Polycen-
tricity in Action? Cambridge University Press, 2018. doi: 10.1017/9781108284646.
[59] P. Kivimaa, M. Hilden, D. Huitema, A. Jordan, and J. Newig. Experiments in climate governance
— A systematic review of research on energy and built environment transitions. Journal of Cleaner
Production, 169:17–29, 2017. ISSN 09596526. doi: 10.1016/j.jclepro.2017.01.027.
[60] J. Hofbauer and K. Sigmund. Evolutionary Games and Population Dynamics. Cambridge University
Press, Cambridge, UK, 1998.
[61] S. Van Segbroeck, J. M. Pacheco, T. Lenaerts, and F. C. Santos. Emergence of fairness in repeated
group interactions. Physical Review Letters, 108(15):1–5, 2012. ISSN 00319007. doi: 10.1103/
PhysRevLett.108.158104.
47
[62] C. Hauert, A. Traulsen, H. Brandt, M. A. Nowak, and K. Sigmund. Via freedom to coercion: The
emergence of costly punishment. Science, 316(5833):1905–1907, 2007. ISSN 00368075. doi:
10.1126/science.1141588.
[63] J. M. Pacheco, F. C. Santos, M. O. Souza, and B. Skyrms. Evolutionary Dynamics of Collec-
tive Action in N-person Stag-Hunt Dilemmas. Proceedings of the Royal Society B, 276:315–321,
2009. doi: 10.1007/978-3-0348-0122-5. URL http://link.springer.com/chapter/10.1007/
978-3-0348-0122-5_7.
[64] A. Traulsen, M. Nowak, and J. Pacheco. Stochastic dynamics of invasion and fixation. Physical
Review E, 74(1):011909, 2006. doi: 10.1103/physreve.74.011909.
[65] S. Karlin and H. M. Taylor. A first course in stochastic processes. Academic Press Inc., 2nd edition,
1975. ISBN 9780691142753.
[66] A. Traulsen, J. M. Pacheco, and L. A. Imhof. Stochasticity and evolutionary stability. Phys. Rev. E,
74:021905, Aug 2006. doi: 10.1103/PhysRevE.74.021905. URL https://link.aps.org/doi/10.
1103/PhysRevE.74.021905.
[67] A. Traulsen, J. C. Claussen, and C. Hauert. Coevolutionary dynamics: From finite to infinite pop-
ulations. Physical Review Letters, 95(23):1–4, 2005. ISSN 00319007. doi: 10.1103/PhysRevLett.
95.238701.
[68] N. G. van Kampen. Stochastic processes in physics and chemistry. North-Holland, 3rd edition,
2007.
[69] F. C. Santos, V. V. Vasconcelos, M. D. Santos, P. N. B. Neves, and J. M. Pacheco.
Evolutionary Dynamics of Climate Change Under Collective-Risk Dilemmas. Mathematical
Models and Methods in Applied Sciences, 22(supp01):1140004, 2012. ISSN 0218-2025.
doi: 10.1142/S0218202511400045. URL http://www.worldscientific.com/doi/abs/10.1142/
S0218202511400045.
[70] J. M. Pacheco, V. V. Vasconcelos, and F. C. Santos. Climate change governance, cooperation and
self-organization. Physics of Life Reviews, 11(4):573–586, 2014. ISSN 15710645. doi: 10.1016/j.
plrev.2014.02.003. URL http://dx.doi.org/10.1016/j.plrev.2014.02.003.
[71] K. Sigmund, C. Hauert, and M. A. Nowak. Reward and punishment. Proceedings of the Na-
tional Academy of Sciences, 98(19):10757–10762, 2001. ISSN 0027-8424. doi: 10.1073/pnas.
161155698. URL http://www.pnas.org/cgi/doi/10.1073/pnas.161155698.
[72] C. Hauert. Replicator dynamics of reward reputation in public goods games. Journal of Theoretical
Biology, 267(1):22 – 28, 2010. ISSN 0022-5193. doi: https://doi.org/10.1016/j.jtbi.2010.08.009.
URL http://www.sciencedirect.com/science/article/pii/S0022519310004182.
48

[73] T. Sasaki and T. Unemi. Replicator dynamics in public goods games with reward funds. Journal of
Theoretical Biology, 287(1):109–114, 2011. ISSN 00225193. doi: 10.1016/j.jtbi.2011.07.026. URL
http://dx.doi.org/10.1016/j.jtbi.2011.07.026.
[74] T. Sasaki and S. Uchida. Rewards and the evolution of cooperation in public good games. Biology
Letters, 10(1):20130903–20130903, 2014. ISSN 1744-9561. doi: 10.1098/rsbl.2013.0903. URL
http://rsbl.royalsocietypublishing.org/cgi/doi/10.1098/rsbl.2013.0903.
[75] X. Chen, T. Sasaki, A. Brannstrom, and U. Dieckmann. First carrot, then stick: How the adaptive
hybridization of incentives promotes cooperation. Journal of the Royal Society Interface, 12(102),
2015. ISSN 17425662. doi: 10.1098/rsif.2014.0935.
[76] C. Hilbe and K. Sigmund. Incentives and opportunism: from the carrot to the stick. Proceedings
of the Royal Society of London B: Biological Sciences, 277(1693):2427–2433, 2010. ISSN 0962-
8452. doi: 10.1098/rspb.2010.0065. URL http://rspb.royalsocietypublishing.org/content/
277/1693/2427.
49

50