v9.3 sas system output - federal communications ... · web viewu.s. federal communications...
TRANSCRIPT

Table 1Connections over 200 kbps in at Least One Direction 2008-2012
(In thousands)
2008 2009 2010 2011 2012
Technology Jun Dec Jun Dec Jun Dec Jun Dec Jun
Total 132,814 102,239 119,433 136,294 157,017 182,065 206,131 230,387 243,397 Total Fixed 73,123 75,707 77,997 79,994 81,764 84,521 86,575 88,320 89,959 Mobile Wireless1 59,691 26,532 41,436 56,300 75,253 97,544 119,556 142,066 153,438
Table 2Connections at Least 3 Mbps Downstream and 768 kbps Upstream 2008-2012
(In thousands)
2008 2009 2010 2011 2012
Technology Dec Jun Dec Jun Dec Jun Dec Jun
Total 31,120 33,332 40,669 45,552 55,110 64,819 82,013 100,271 Total Fixed 30,987 33,108 38,963 41,364 44,694 48,577 51,095 57,247 Mobile Wireless1 133 224 1,706 4,188 10,416 16,242 30,918 43,025
Table 3Residential Connections over 200 kbps in at Least One Direction 2008-2012
(In thousands)
2008 2009 2010 2011 2012
Technology Jun Dec Jun Dec Jun Dec Jun Dec Jun
Total 79,090 88,190 103,300 117,089 132,567 149,441 171,773 186,702 196,704 Total Fixed 67,554 69,047 71,509 73,394 75,251 76,918 78,906 80,709 82,233 Mobile Wireless1 11,536 19,142 31,791 43,695 57,316 72,523 92,867 105,993 114,472
Table 4Residential Connections at Least 3 Mbps Downstream and 768 kbps Upstream 2008-2012
(In thousands)
2008 2009 2010 2011 2012
Technology Dec Jun Dec Jun Dec Jun Dec Jun
Total 29,127 31,356 38,426 42,243 47,632 51,783 63,734 78,616 Total Fixed 29,013 31,161 36,844 39,037 41,769 45,263 47,425 53,077 Mobile Wireless1 114 196 1,582 3,206 5,863 6,520 16,309 25,539
1 Reporting instructions for mobile wireless changed between the June 2008 and December 2008 data. See Technical Notes at the end of the report. Note: Some historical data have been revised. Figures may not sum to totals due to rounding. Source: FCC Form 477, Parts I and VI.
U.S. Federal Communications Commission Internet Access Services: Status as of June 30, 2012 17
17

Chart 1Distribution of Connections over 200 kbps in at Least One Direction
as of June 30, 2012
Note: Inner circle (light shading) represents upstream speeds.
Downstream Speed < 3 Mbps; 52.4% >= 3 Mbps & < 6 Mbps; 13.9% >= 6 Mbps; 33.7%
< 768 kbps38.0%
>= 768 kbps & < 1.5 Mbps13.5%
>= 1.5 Mbps0.8%
>= 768 kbps & < 1.5 Mbps7.1%
< 768 kbps4.4%
>= 1.5 Mbps2.4%
>= 1.5 Mbps22.8%
Connections over 200 kbps in at Least One Direction (in thousands)
Downstream Speed
Upstream SpeedLess than 3
Mbps
At least 3 Mbpsand less than 6
Mbps At least 6 Mbps Total
Less than 768 kbps 92,545 10,624 5,021 108,189
At least 768 kbps & Less than 1.5 Mbps 32,945 17,351 21,508 71,804
At least 1.5 Mbps 1,991 5,873 55,539 63,404
Total 127,481 33,848 82,068 243,397
Percentages
Less than 768 kbps 38.0 4.4 2.1 44.4
At least 768 kbps & Less than 1.5 Mbps 13.5 7.1 8.8 29.5
At least 1.5 Mbps 0.8 2.4 22.8 26.0
Total 52.4 13.9 33.7 100.0
Note: Figures may not sum to totals due to rounding. Source: FCC Form 477, Part I.
U.S. Federal Communications Commission Internet Access Services: Status as of June 30, 2012 18
18

Chart 2Distribution of Fixed Connections over 200 kbps in at Least One Direction
as of June 30, 2012
Note: Inner circle (light shading) represents upstream speeds.
Downstream Speed < 3 Mbps; 23.8% >= 3 Mbps & < 6 Mbps; 16.6% >= 6 Mbps; 59.6%
< 768 kbps18.9%
>= 768 kbps & < 1.5 Mbps4.3%
>= 1.5 Mbps0.6%
>= 768 kbps & < 1.5 Mbps9.1%
< 768 kbps7.1%
>= 1.5 Mbps0.4%
>= 1.5 Mbps40.9%
Fixed Connections over 200 kbps in at Least One Direction (in thousands)
Downstream Speed
Upstream SpeedLess than 3
Mbps
At least 3 Mbpsand less than 6
Mbps At least 6 Mbps Total
Less than 768 kbps 16,962 6,353 4,987 28,302
At least 768 kbps & Less than 1.5 Mbps 3,830 8,231 11,879 23,940
At least 1.5 Mbps 581 347 36,790 37,717
Total 21,372 14,931 53,656 89,959
Percentages
Less than 768 kbps 18.9 7.1 5.5 31.5
At least 768 kbps & Less than 1.5 Mbps 4.3 9.1 13.2 26.6
At least 1.5 Mbps 0.6 0.4 40.9 41.9
Total 23.8 16.6 59.6 100.0
Note: Figures may not sum to totals due to rounding. Source: FCC Form 477, Part I.
U.S. Federal Communications Commission Internet Access Services: Status as of June 30, 2012 19
19

Chart 3Distribution of Residential Connections over 200 kbps in at Least One Direction
as of June 30, 2012
Note: Inner circle (light shading) represents upstream speeds.
Downstream Speed < 3 Mbps; 52.9% >= 3 Mbps & < 6 Mbps; 12.7% >= 6 Mbps; 34.3%
< 768 kbps39.6%
>= 768 kbps & < 1.5 Mbps12.6%
>= 1.5 Mbps0.7%
>= 768 kbps & < 1.5 Mbps5.6%
< 768 kbps4.6%
>= 1.5 Mbps2.5%
>= 1.5 Mbps25.7%
Residential Connections over 200 kbps in at Least One Direction (in thousands)
Downstream Speed
Upstream SpeedLess than 3
Mbps
At least 3 Mbpsand less than 6
Mbps At least 6 Mbps Total
Less than 768 kbps 77,854 9,025 4,945 91,825
At least 768 kbps & Less than 1.5 Mbps 24,864 11,074 12,004 47,942
At least 1.5 Mbps 1,399 4,959 50,579 56,938
Total 104,118 25,058 67,528 196,704
Percentages
Less than 768 kbps 39.6 4.6 2.5 46.7
At least 768 kbps & Less than 1.5 Mbps 12.6 5.6 6.1 24.4
At least 1.5 Mbps 0.7 2.5 25.7 28.9
Total 52.9 12.7 34.3 100.0
Note: Figures may not sum to totals due to rounding. Source: FCC Form 477, Parts I and VI.
U.S. Federal Communications Commission Internet Access Services: Status as of June 30, 2012 20
20

Chart 4Distribution of Residential Fixed Connections over 200 kbps in at Least One Direction
as of June 30, 2012
Note: Inner circle (light shading) represents upstream speeds.
Downstream Speed < 3 Mbps; 23.0% >= 3 Mbps & < 6 Mbps; 15.6% >= 6 Mbps; 61.3%
< 768 kbps18.7%
>= 768 kbps & < 1.5 Mbps4.3%
>= 768 kbps & < 1.5 Mbps8.9%
< 768 kbps6.4%
>= 1.5 Mbps0.2%
>= 1.5 Mbps42.0%
Residential Fixed Connections over 200 kbps in at Least One Direction (in thousands)
Downstream Speed
Upstream SpeedLess than 3
Mbps
At least 3 Mbpsand less than 6
Mbps At least 6 Mbps Total
Less than 768 kbps 15,359 5,286 4,916 25,561
At least 768 kbps & Less than 1.5 Mbps 3,521 7,357 10,981 21,860
At least 1.5 Mbps 74 191 34,546 34,812
Total 18,954 12,835 50,443 82,233
Percentages
Less than 768 kbps 18.7 6.4 6.0 31.1
At least 768 kbps & Less than 1.5 Mbps 4.3 8.9 13.4 26.6
At least 1.5 Mbps 0.1 0.2 42.0 42.3
Total 23.0 15.6 61.3 100.0
Note: Figures may not sum to totals due to rounding. Source: FCC Form 477, Part VI.
U.S. Federal Communications Commission Internet Access Services: Status as of June 30, 2012 21
21

Chart 5Distribution of Mobile Wireless Connections over 200 kbps in at Least One Direction
as of June 30, 2012
Note: Inner circle (light shading) represents upstream speeds.
Downstream Speed < 3 Mbps; 69.2% >= 3 Mbps & < 6 Mbps; 12.3% >= 6 Mbps; 18.5%
< 768 kbps49.3%
>= 768 kbps & < 1.5 Mbps19.0%
>= 1.5 Mbps0.9%
>= 768 kbps & < 1.5 Mbps5.9%
>= 1.5 Mbps3.6%
< 768 kbps2.8%
Mobile Wireless Connections over 200 kbps in at Least One Direction (in thousands)
Downstream Speed
Upstream SpeedLess than 3
Mbps
At least 3 Mbpsand less than 6
Mbps At least 6 Mbps Total
Less than 768 kbps 75,583 4,271 34 79,887
At least 768 kbps & Less than 1.5 Mbps 29,115 9,120 9,629 47,864
At least 1.5 Mbps 1,411 5,526 18,749 25,686
Total 106,109 18,917 28,412 153,438
Percentages
Less than 768 kbps 49.3 2.8 0.0 52.1
At least 768 kbps & Less than 1.5 Mbps 19.0 5.9 6.3 31.2
At least 1.5 Mbps 0.9 3.6 12.2 16.7
Total 69.2 12.3 18.5 100.0
Note: Figures may not sum to totals due to rounding. Source: FCC Form 477, Part I.
U.S. Federal Communications Commission Internet Access Services: Status as of June 30, 2012 22
22
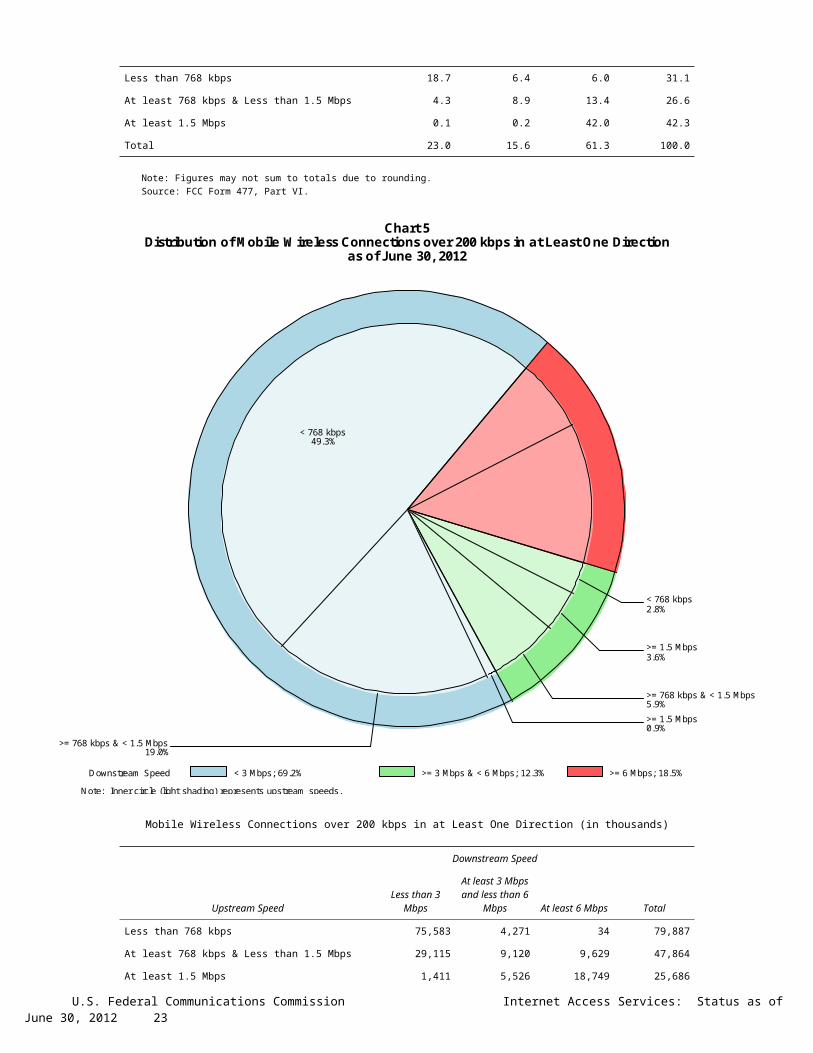
Table 5Connections over 200 kbps in at Least One Direction by Technology 2008-2012
(In thousands)
2008 2009 2010 2011 2012
Technology Jun Dec Jun Dec Jun Dec Jun Dec Jun
Total 132,814 102,239 119,433 136,294 157,017 182,065 206,131 230,387 243,397 Total Fixed 73,123 75,707 77,997 79,994 81,764 84,521 86,575 88,320 89,959 aDSL 29,964 30,198 30,631 30,987 30,759 31,470 31,611 31,341 31,188 sDSL 275 241 217 225 191 167 159 148 140 Other Wireline1 670 709 689 719 755 795 778 795 769 Cable Modem 38,190 40,251 41,434 42,439 43,923 45,334 46,698 48,257 49,663 FTTP2 2,346 2,884 3,548 3,980 4,441 4,993 5,477 5,898 6,299 Satellite 869 938 990 1,116 1,144 1,176 1,204 1,190 1,217 Fixed Wireless 808 485 488 527 551 587 649 692 683 Mobile Wireless3 59,691 26,532 41,436 56,300 75,253 97,544 119,556 142,066 153,438
1 Power Line and Other are summarized with Other Wireline to maintain firm confidentiality. See Technical Notes at the end of the report for a description of Form 477 technology categories and other reporting requirements. 2 Fiber to the premises. 3 Reporting instructions for mobile wireless changed between the June 2008 and December 2008 data. Note: Some historical data have been revised. Figures may not sum to totals due to rounding. Source: FCC Form 477, Part I.
Chart 6Connections by Technology as of June 30, 2012
aDSL12.8%
FTTP2.6%
Cable Modem
U.S. Federal Communications Commission Internet Access Services: Status as of June 30, 2012 23
23
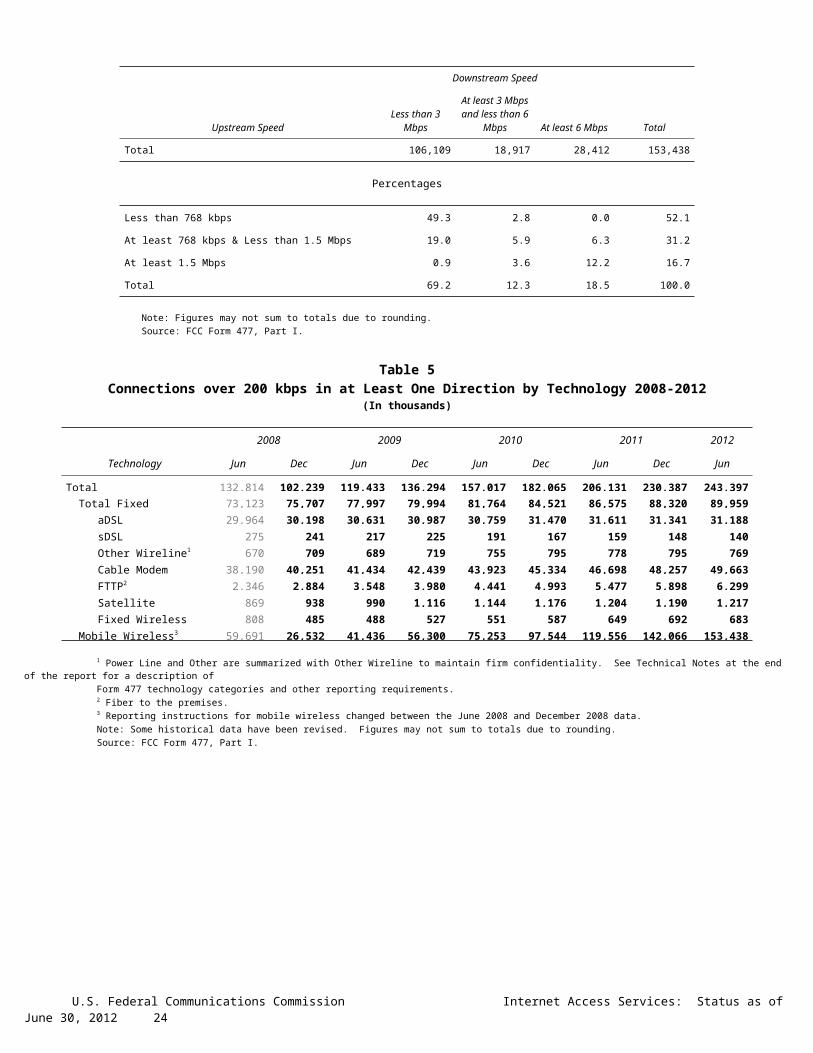
Table 6Residential Connections over 200 kbps in at Least One Direction by Technology 2008-2012
(In thousands)
2008 2009 2010 2011 2012
Technology Jun Dec Jun Dec Jun Dec Jun Dec Jun
Total 79,090 88,190 103,300 117,089 132,567 149,441 171,773 186,702 196,704 Total Fixed 67,554 69,047 71,509 73,394 75,251 76,918 78,906 80,709 82,233 aDSL 26,950 26,488 27,047 27,402 27,488 27,467 27,754 27,767 27,650 sDSL 81 74 71 85 65 53 52 54 49 Other Wireline1 37 47 49 56 61 76 45 40 13 Cable Modem 36,901 38,681 39,909 40,872 42,178 43,295 44,480 45,826 47,032 FTTP2 2,139 2,717 3,348 3,758 4,185 4,704 5,118 5,521 5,892 Satellite 705 630 668 767 787 811 885 886 998 Fixed Wireless 741 410 417 454 486 513 572 615 598 Mobile Wireless3 11,536 19,142 31,791 43,695 57,316 72,523 92,867 105,993 114,472
1 Power Line and Other are summarized with Other Wireline to maintain firm confidentiality. See Technical Notes at the end of the report for a description of Form 477 technology categories and other reporting requirements. 2 Fiber to the premises. 3 Reporting instructions for mobile wireless changed between the June 2008 and December 2008 data. Note: Some historical data have been revised. Figures may not sum to totals due to rounding. Source: FCC Form 477, Part I.
Chart 7Residential Connections by Technology as of June 30, 2012
aDSL14.1%
FTTP3.0%
Cable Modem
U.S. Federal Communications Commission Internet Access Services: Status as of June 30, 2012 24
24

Table 7Connections at Least 3 Mbps Downstream and 768 kbps Upstream by Technology 2008-2012
(In thousands)
2008 2009 2010 2011 2012
Technology Dec Jun Dec Jun Dec Jun Dec Jun
Total 31,120 33,332 40,669 45,552 55,110 64,819 82,013 100,271 Total Fixed 30,987 33,108 38,963 41,364 44,694 48,577 51,095 57,247 aDSL 5,403 5,614 6,389 6,275 7,302 8,909 10,355 12,879 sDSL 5 9 19 13 14 16 26 32 Other Wireline1 122 129 150 177 211 204 228 239 Cable Modem 22,708 23,958 28,583 30,616 32,338 34,113 34,693 37,798 FTTP2 2,694 3,333 3,739 4,192 4,725 5,188 5,606 6,000 Satellite # # # # # # # 87 Fixed Wireless 54 64 82 92 105 145 186 212 Mobile Wireless 133 224 1,706 4,188 10,416 16,242 30,918 43,025
# = Rounds to Zero. 1 Power Line and Other are summarized with Other Wireline to maintain firm confidentiality. See Technical Notes at the end of the report for a description of Form 477 technology categories and other reporting requirements. 2 Fiber to the premises. Note: Some historical data have been revised. Figures may not sum to totals due to rounding. Source: FCC Form 477, Part I.
Chart 8Connections at Least 3 Mbps Downstream and 768 kbps Upstream
by Technology as of June 30, 2012
aDSL12.8%
FTTP6.0%
U.S. Federal Communications Commission Internet Access Services: Status as of June 30, 2012 25
25

Table 8Residential Connections at Least 3 Mbps Downstream and 768 kbps Upstream by Technology 2008-2012
(In thousands)
2008 2009 2010 2011 2012
Technology Dec Jun Dec Jun Dec Jun Dec Jun
Total 29,127 31,356 38,426 42,243 47,632 51,783 63,734 78,616 Total Fixed 29,013 31,161 36,844 39,037 41,769 45,263 47,425 53,077 aDSL 4,613 4,895 5,633 5,557 6,421 7,909 9,278 11,571 sDSL 1 2 10 2 2 4 12 12 Other Wireline1 11 12 19 20 36 15 16 7 Cable Modem 21,776 23,025 27,548 29,398 30,742 32,321 32,687 35,583 FTTP2 2,571 3,177 3,566 3,982 4,482 4,894 5,271 5,632 Satellite 0 0 0 0 0 0 # 86 Fixed Wireless 42 50 68 77 86 121 161 184 Mobile Wireless 114 196 1,582 3,206 5,863 6,520 16,309 25,539
# = Rounds to Zero. 1 Power Line and Other are summarized with Other Wireline to maintain firm confidentiality. See Technical Notes at the end of the report for a description of Form 477 technology categories and other reporting requirements. 2 Fiber to the premises. Note: Some historical data have been revised. Figures may not sum to totals due to rounding. Source: FCC Form 477, Part I.
Chart 9Residential Connections at Least 3 Mbps Downstream and 768 kbps Upstream
by Technology as of June 30, 2012
aDSL14.7%
FTTP7.2%
U.S. Federal Communications Commission Internet Access Services: Status as of June 30, 2012 26
26
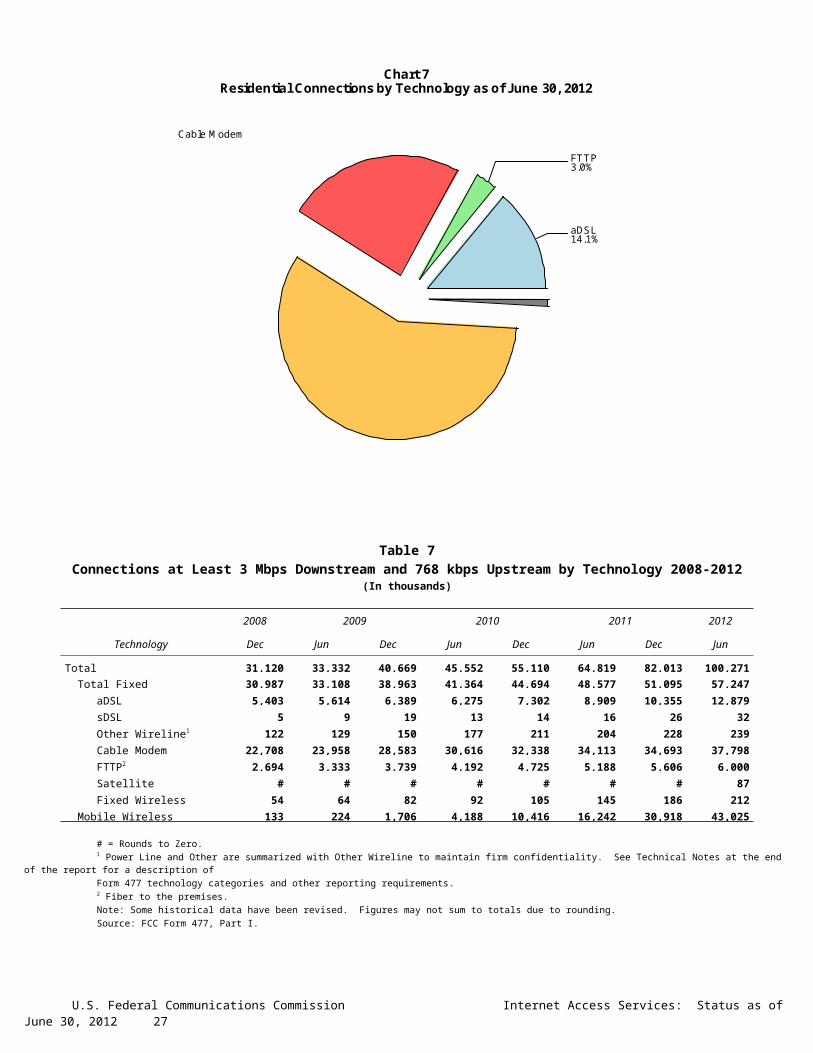
Chart 10Residential Fixed Connections over 200 kbps in at Least One Direction 2007-2012
(Shares of selected technologies)
aDSL Cable Modem FTTP All Other Fixed
54.5
40.8
56.0
3.9
38.4
55.7
5.1
37.3
56.3
6.1
35.7
56.8
6.8
34.4
54.6
3.2
39.9
55.8
4.7
37.8
56.0
5.6
36.5
56.4
6.5
35.2
57.2
7.2
33.6
Perc
enta
ge o
f Res
iden
tial F
ixed
Con
nect
ions
0
10
20
30
40
50
60
70
80
90
100
Dec
Con
nect
ions
in T
hous
ands
-1000
0
1000
2000
3000
4000
Jun 2008 toJun 2009
Jun 2009 toJun 2010
Jun 2010 toJun 2011
Jun 2011 toJun 2012
Chart 11Residential Fixed Connections over 200 kbps in at Least One Direction 2008-2012
(Net adds for selected technologies)
aDSL Cable Modem FTTP
97
442266
-104
3008
2269 23022553
U.S. Federal Communications Commission Internet Access Services: Status as of June 30, 2012 27
27

Chart 12Residential Fixed Connections by Technology as of June 30, 2012
(Shares of selected technologies for selected speeds, connections in thousands)
aDSL Cable Modem FTTP All Other Fixed
33.6
57.2
7.22.0
32.7
58.8
7.4
24.6
65.9
9.0
21.8
67.0
10.6
83.7
15.4
83.7
15.5
Estim
ated
Per
cent
age
of H
ouse
hold
s
0
10
20
30
40
50
60
70
80
90
100
Ov er 200 kbps in atleast one direction
At least 768 kbpsdownstream and ov er
U.S. Federal Communications Commission Internet Access Services: Status as of June 30, 2012 28
28

Table 9Residential Connections by Technology and Speed (BTOP/BIP Definition)
as of June 30, 2012(In thousands)
Technology
At Most200 kbps
Upstream orless than768 kbps
Downstream
Over200 kbps
Upstream andat least
768 kbpsDownstream Total
aDSL 1,803 25,847 27,650sDSL 13 36 49Other Wireline # 13 13Cable Modem 472 46,560 47,032FTTP 14 5,878 5,892Satellite 709 289 998Fixed Wireless 90 507 598Mobile Wireless 37,649 76,823 114,472 Total 40,751 155,953 196,704
# = Rounds to Zero. Power Line and Other are combined with Other Wireline to maintain firm confidentiality. Note: Figures may not sum to totals due to rounding. Source: FCC Form 477, Parts I and VI.
Chart 13Residential Connections (BTOP/BIP Definition) by Technology
as of June 30, 2012
Source: FCC Form 477, Parts I and VI.Note: The BTOP/BIP def inition is adv ertised speeds of at least 768 kbps downstream and 200 kbps upstream to end users.
aDSL16.6%
FTTP3.8%
U.S. Federal Communications Commission Internet Access Services: Status as of June 30, 2012 29
29

Table 10Connections by Downstream Speed Tier and Technology as of June 30, 2012
(In thousands)
Downstream Speed
Technology
Greater than 200
kbps and less than768 kbps
At least 768 kbps
and less than1.5 Mbps
At least 1.5 Mbps
and less than3 Mbps
At least 3 Mbps
and less than6 Mbps
At least 6 Mbps
and less than10 Mbps
At least 10 Mbps
and less than25 Mbps
At least 25 Mbps
and less than100 Mbps
At least 100 Mbps Total
aDSL 1,666 4,391 7,452 10,192 4,855 2,525 105 # 31,188
sDSL 37 43 28 * * 16 * # 140
Other Wireline 43 40 448 102 24 44 41 27 769
Cable Modem 145 1,321 3,983 4,200 5,158 27,819 6,968 69 49,663
FTTP 17 78 112 234 160 4,377 1,262 59 6,299
Satellite 328 537 258 * * * 0 0 1,217
Fixed Wireless 85 167 195 174 42 18 2 1 683
Mobile Wireless 43,714 7,568 54,826 18,917 24,767 * * 0 153,438
Total 46,034 14,145 67,302 33,848 35,010 34,911 11,990 156 243,397
Percentages
aDSL 0.7 1.8 3.1 4.2 2.0 1.0 0.0 0.0 12.8
sDSL 0.0 0.0 0.0 * * 0.0 * 0.0 0.1
Other Wireline 0.0 0.0 0.2 0.0 0.0 0.0 0.0 0.0 0.3
Cable Modem 0.1 0.5 1.6 1.7 2.1 11.4 2.9 0.0 20.4
FTTP 0.0 0.0 0.0 0.1 0.1 1.8 0.5 0.0 2.6
Satellite 0.1 0.2 0.1 * * * 0.0 0.0 0.5
Fixed Wireless 0.0 0.1 0.1 0.1 0.0 0.0 0.0 0.0 0.3
Mobile Wireless 18.0 3.1 22.5 7.8 10.2 * * 0.0 63.0
Total 18.9 5.8 27.7 13.9 14.4 14.3 4.9 0.1 100.0
# = Rounds to Zero. Power Line and Other are combined with Other Wireline to maintain firm confidentiality.* = Data withheld to maintain firm confidentiality.Note: Figures may not sum to totals due to rounding.Source: FCC Form 477, Part I.
U.S. Federal Communications Commission Internet Access Services: Status as of June 30, 2012 30
30

Table 11Residential Connections by Downstream Speed Tier and Technology as of June 30, 2012
(In thousands)
Downstream Speed
Technology
Greater than 200
kbps and less than768 kbps
At least 768 kbps
and less than1.5 Mbps
At least 1.5 Mbps
and less than3 Mbps
At least 3 Mbps
and less than6 Mbps
At least 6 Mbps
and less than10 Mbps
At least 10 Mbps
and less than25 Mbps
At least 25 Mbps
and less than100 Mbps
At least 100 Mbps Total
aDSL 1,546 4,027 6,536 8,639 4,486 2,319 98 # 27,650
sDSL 13 20 4 * * 9 * 0 49
Other Wireline # 4 2 1 1 3 0 1 13
Cable Modem 130 1,299 3,900 3,822 4,815 26,285 6,730 52 47,032
FTTP 13 70 90 206 147 4,170 1,176 20 5,892
Satellite 194 494 220 * * * 0 0 998
Fixed Wireless 75 145 172 154 37 14 1 # 598
Mobile Wireless 35,216 6,839 43,109 12,223 13,737 * * 0 114,472
Total 37,188 12,897 54,033 25,058 23,224 32,907 11,324 74 196,704
Percentages
aDSL 0.8 2.0 3.3 4.4 2.3 1.2 0.0 0.0 14.1
sDSL 0.0 0.0 0.0 * * 0.0 * 0.0 0.0
Other Wireline 0.0 0.0 0.0 0.0 0.0 0.0 0.0 0.0 0.0
Cable Modem 0.1 0.7 2.0 1.9 2.4 13.4 3.4 0.0 23.9
FTTP 0.0 0.0 0.0 0.1 0.1 2.1 0.6 0.0 3.0
Satellite 0.1 0.3 0.1 * * * 0.0 0.0 0.5
Fixed Wireless 0.0 0.1 0.1 0.1 0.0 0.0 0.0 0.0 0.3
Mobile Wireless 17.9 3.5 21.9 6.2 7.0 * * 0.0 58.2
Total 18.9 6.6 27.5 12.7 11.8 16.7 5.8 0.0 100.0
# = Rounds to Zero. Power Line and Other are combined with Other Wireline to maintain firm confidentiality.* = Data withheld to maintain firm confidentiality.Note: Figures may not sum to totals due to rounding.Source: FCC Form 477, Part I.
U.S. Federal Communications Commission Internet Access Services: Status as of June 30, 2012 31
31

Table 12Nationwide Number of Providers of Connections over 200 kbps in at Least One Direction
by Technology 2008-2012
2008 2009 2010 2011 2012
Technology Jun Dec Jun Dec Jun Dec Jun Dec Jun
aDSL 863 881 876 862 875 865 867 868 860sDSL 238 264 257 261 251 247 252 255 249Other Wireline 259 292 283 274 267 270 265 274 258Cable Modem 296 342 351 345 345 357 400 404 399FTTP 308 432 462 485 510 545 579 621 642Satellite 4 5 4 4 4 4 5 6 5Fixed Wireless 505 620 621 607 625 646 672 711 707Mobile Wireless 24 47 48 51 55 57 64 69 68Power Line and Other 6 5 6 6 5 7 4 5 * Total 1,395 1,562 1,551 1,526 1,536 1,566 1,624 1,683 1,662
Note: Some historical data have been revised. Multiple Form 477 filers within a holding company structure count as one provider. * = 1-3 providers. Source: FCC Form 477, Part I.
Chart 14Nationwide Number of Providers of Connections over 200 kbps in at Least One Direction
Selected Technologies 2008-2012
aDSL Cable Modem FTTP Mobile Wireless
Num
ber o
f Pro
vide
rs
0
100
200
300
400
500
600
700
800
900
Jun2008
Dec2008
Jun2009
Dec2009
Jun2010
Dec2010
Jun2011
U.S. Federal Communications Commission Internet Access Services: Status as of June 30, 2012 32
32

Table 13Residential Fixed Connections (Approximating the National Broadband Availability Target)
and Households by State as of June 30, 2012(Connections with advertised speeds at least 3 Mbps down and 768 up and households, in thousands)
State Connections HouseholdsSubscribership
RatioAlabama 564 1,902 0.30Alaska 88 260 0.34American Samoa 0 11 0.00Arizona 1,330 2,440 0.54Arkansas 294 1,159 0.25California 5,609 12,712 0.44Colorado 1,217 2,005 0.61Connecticut 799 1,372 0.58Delaware 240 347 0.69District of Columbia 175 268 0.65Florida 3,830 7,463 0.51Georgia 1,542 3,648 0.42Guam * 51 *Hawaii * 456 *Idaho 180 593 0.30Illinois 2,150 4,861 0.44Indiana 1,042 2,516 0.41Iowa 302 1,231 0.25Kansas 366 1,121 0.33Kentucky 658 1,732 0.38Louisiana 535 1,756 0.30Maine 147 556 0.26Maryland 1,503 2,156 0.70Massachusetts 1,914 2,549 0.75Michigan 1,775 3,848 0.46Minnesota 1,017 2,097 0.48Mississippi 237 1,120 0.21Missouri 693 2,390 0.29Montana 157 415 0.38Nebraska 328 727 0.45Nevada 511 1,027 0.50New Hampshire 339 519 0.65New Jersey 2,436 3,215 0.76New Mexico 302 806 0.37New York 3,939 7,345 0.54North Carolina 668 3,818 0.17North Dakota 117 283 0.41Northern Mariana Isl * 21 *Ohio 1,154 4,597 0.25Oklahoma 416 1,476 0.28Oregon 854 1,539 0.55Pennsylvania 2,896 5,025 0.58Puerto Rico 114 1,230 0.09Rhode Island * 410 *South Carolina 534 1,831 0.29South Dakota 153 326 0.47Tennessee 996 2,522 0.39Texas 3,024 9,113 0.33Utah 508 903 0.56Vermont 156 256 0.61Virgin Islands * 56 *Virginia 1,855 3,079 0.60Washington 1,608 2,657 0.61West Virginia 373 766 0.49Wisconsin 682 2,289 0.30Wyoming 102 231 0.44Total 53,077 119,103 0.45
# = Rounds to Zero; * = Data withheld to maintain firm confidentiality. Note: Figures may not sum to totals due to rounding. Sources: FCC Form 477, Part VI (Connections); Geolytics 2011 Block-Level Estimates (Households for U.S. and District of Columbia); Census 2010 (Housing Units for Puerto Rico, American Samoa, Guam, Northern Mariana Islands and U.S. Virgin Islands).
U.S. Federal Communications Commission Internet Access Services: Status as of June 30, 2012 34
34

Table 14Residential Fixed Connections and Households by State as of June 30, 2012
(Connections over 200 kbps in at least one direction and households, in thousands)
State Connections HouseholdsSubscribership
RatioAlabama 1,091 1,902 0.57Alaska 185 260 0.71American Samoa * 11 *Arizona 1,692 2,440 0.69Arkansas 625 1,159 0.54California 9,634 12,712 0.76Colorado 1,517 2,005 0.76Connecticut 1,078 1,372 0.79Delaware 271 347 0.78District of Columbia 194 268 0.72Florida 5,492 7,463 0.74Georgia 2,385 3,648 0.65Guam * 51 *Hawaii * 456 *Idaho 364 593 0.61Illinois 3,268 4,861 0.67Indiana 1,601 2,516 0.64Iowa 808 1,231 0.66Kansas 751 1,121 0.67Kentucky 1,079 1,732 0.62Louisiana 1,045 1,756 0.60Maine 417 556 0.75Maryland 1,638 2,156 0.76Massachusetts 2,056 2,549 0.81Michigan 2,503 3,848 0.65Minnesota 1,452 2,097 0.69Mississippi 558 1,120 0.50Missouri 1,472 2,390 0.62Montana 264 415 0.64Nebraska 493 727 0.68Nevada 681 1,027 0.66New Hampshire 421 519 0.81New Jersey 2,623 3,215 0.82New Mexico 473 806 0.59New York 5,553 7,345 0.76North Carolina 2,637 3,818 0.69North Dakota 197 283 0.70Northern Mariana Isl * 21 *Ohio 3,118 4,597 0.68Oklahoma 853 1,476 0.58Oregon 1,064 1,539 0.69Pennsylvania 3,591 5,025 0.71Puerto Rico 521 1,230 0.42Rhode Island 311 410 0.76South Carolina 1,164 1,831 0.64South Dakota 219 326 0.67Tennessee 1,465 2,522 0.58Texas 5,916 9,113 0.65Utah 658 903 0.73Vermont 196 256 0.77Virgin Islands 16 56 0.29Virginia 2,156 3,079 0.70Washington 1,919 2,657 0.72West Virginia 459 766 0.60Wisconsin 1,534 2,289 0.67Wyoming 152 231 0.66Total 82,233 119,103 0.69
# = Rounds to Zero; * = Data withheld to maintain firm confidentiality. Note: Figures may not sum to totals due to rounding. Sources: FCC Form 477, Part VI (Connections); Geolytics 2011 Block-Level Estimates (Households for U.S. and District of Columbia); Census 2010 (Housing Units for Puerto Rico, American Samoa, Guam, Northern Mariana Islands and U.S. Virgin Islands).
U.S. Federal Communications Commission Internet Access Services: Status as of June 30, 2012 35
35
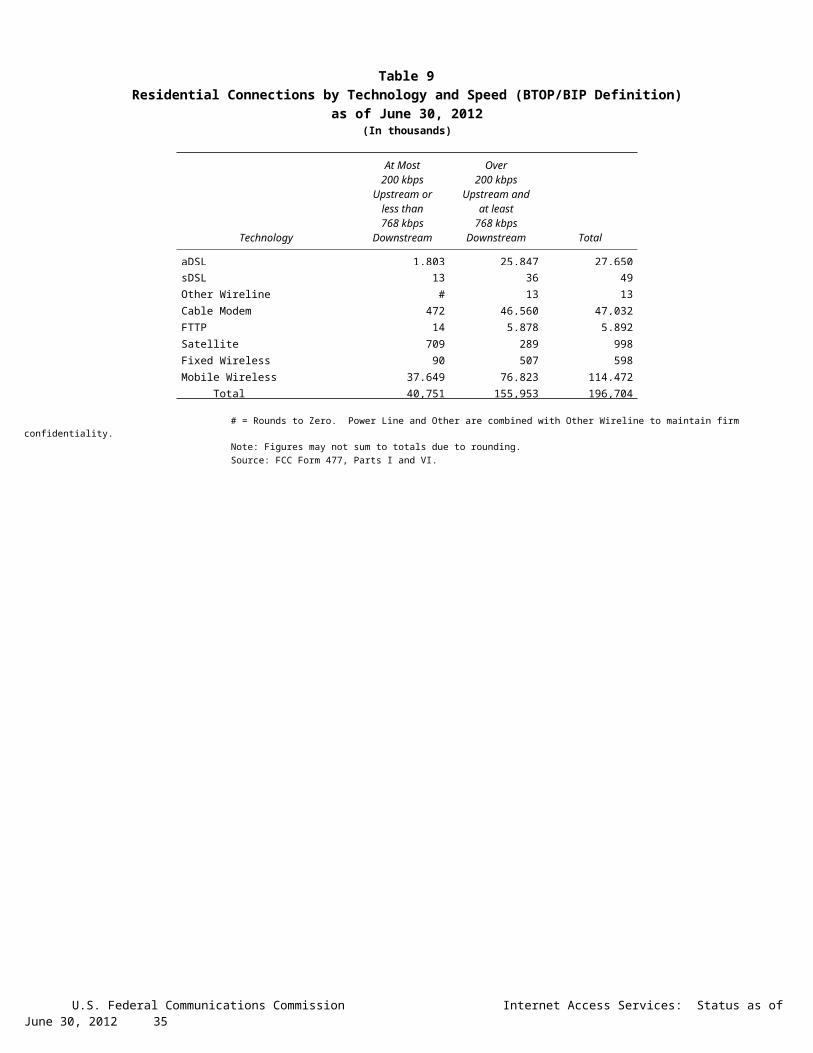
Table 15Connections by Type of End User by State as of June 30, 2012
(Connections over 200 kbps in at least one direction, in thousands)
Connections PercentagesState Residential Business Residential Business Total
Alabama 2,706 407 86.9 13.1 3,113Alaska 506 78 86.7 13.3 584American Samoa * * * * *Arizona 3,881 713 84.5 15.5 4,594Arkansas 1,703 253 87.0 13.0 1,956California 25,044 5,730 81.4 18.6 30,773Colorado 3,498 853 80.4 19.6 4,352Connecticut 2,455 557 81.5 18.5 3,012Delaware 603 134 81.9 18.1 737District of Columbia 557 655 46.0 54.0 1,211Florida 12,638 3,213 79.7 20.3 15,851Georgia 6,082 1,488 80.3 19.7 7,571Guam 58 14 80.0 20.0 72Hawaii 964 175 84.7 15.3 1,139Idaho 870 198 81.5 18.5 1,068Illinois 7,983 2,101 79.2 20.8 10,085Indiana 3,660 667 84.6 15.4 4,326Iowa 1,588 307 83.8 16.2 1,895Kansas 1,660 628 72.5 27.5 2,289Kentucky 2,475 494 83.4 16.6 2,969Louisiana 2,902 510 85.1 14.9 3,412Maine 748 111 87.1 12.9 859Maryland 3,986 902 81.6 18.4 4,887Massachusetts 4,503 1,010 81.7 18.3 5,512Michigan 5,478 1,813 75.1 24.9 7,291Minnesota 3,200 911 77.8 22.2 4,111Mississippi 1,696 219 88.6 11.4 1,915Missouri 3,431 969 78.0 22.0 4,400Montana 594 88 87.1 12.9 682Nebraska 1,038 251 80.5 19.5 1,289Nevada 1,821 404 81.8 18.2 2,225New Hampshire 834 149 84.8 15.2 983New Jersey 6,244 1,379 81.9 18.1 7,623New Mexico 1,134 188 85.8 14.2 1,322New York 13,128 3,054 81.1 18.9 16,182North Carolina 5,709 1,375 80.6 19.4 7,085North Dakota 453 83 84.6 15.4 536Northern Mariana Isl * * * * *Ohio 6,881 1,737 79.8 20.2 8,618Oklahoma 2,253 381 85.5 14.5 2,634Oregon 2,447 528 82.3 17.7 2,975Pennsylvania 7,930 1,652 82.8 17.2 9,581Puerto Rico 1,628 201 89.0 11.0 1,829Rhode Island 659 151 81.4 18.6 809South Carolina 2,393 445 84.3 15.7 2,838South Dakota 494 67 88.0 12.0 561Tennessee 3,666 860 81.0 19.0 4,526Texas 16,676 4,612 78.3 21.7 21,288Utah 1,571 421 78.8 21.2 1,992Vermont 371 67 84.8 15.2 438Virgin Islands 59 18 76.2 23.8 78Virginia 5,136 1,357 79.1 20.9 6,493Washington 4,404 1,166 79.1 20.9 5,570West Virginia 968 142 87.2 12.8 1,110Wisconsin 2,975 749 79.9 20.1 3,724Wyoming 354 55 86.6 13.4 408Total 196,704 46,693 80.8 19.2 243,397
# = Rounds to Zero. * = Data withheld to maintain firm confidentiality. Figures may not sum to totals due to rounding. Source: FCC Form 477, Part I and VI.
U.S. Federal Communications Commission Internet Access Services: Status as of June 30, 2012 36
36

Table 16Connections by Technology by State as of June 30, 2012
(Connections over 200 kbps in at least one direction, in thousands)
State ADSL SDSLOther
WirelineCable
Modem Fiber SatelliteFixed
WirelessMobile
Wireless TotalAlabama 546 4 * 592 9 * 4 1,911 3,113Alaska 78 2 0 * 1 * 4 369 584American Samoa * * 0 * * 0 * 0 *Arizona 600 1 * 1,156 4 * 25 2,772 4,594Arkansas 344 # * 308 6 * 2 1,265 1,956California 4,370 13 * 5,222 710 * 29 20,228 30,773Colorado * 2 0 870 6 * 45 2,690 4,352Connecticut * 1 0 744 4 * * 1,836 3,012Delaware * # 0 * * * 0 445 737District of Columbia * 2 0 * 14 * * 988 1,211Florida 1,955 1 * 3,557 395 * 5 9,846 15,851Georgia 1,291 1 * 1,245 28 * 1 4,938 7,571Guam * * * * * 0 * * 72Hawaii * * 0 * 2 * * 742 1,139Idaho 201 # * 160 3 * 23 667 1,068Illinois 1,519 7 * 1,936 16 * 36 6,504 10,085Indiana 760 2 * 835 69 * 31 2,591 4,326Iowa 393 2 * 403 41 * 24 1,009 1,895Kansas 275 1 * 455 47 * 27 1,463 2,289Kentucky 502 3 * 614 17 * 7 1,793 2,969Louisiana 444 2 * 625 39 * 5 2,256 3,412Maine 139 4 0 300 5 * * 400 859Maryland * 2 0 842 * * 1 3,122 4,887Massachusetts * 2 0 1,454 * * 2 3,282 5,512Michigan 909 6 * 1,687 9 * 29 4,572 7,291Minnesota 627 19 * 846 39 * 20 2,525 4,111Mississippi 309 1 * 270 2 * # 1,294 1,915Missouri 864 1 * 653 15 * 22 2,782 4,400Montana 123 1 0 * 7 * 12 * 682Nebraska 175 # * 331 10 * 16 746 1,289
U.S. Federal Communications Commission Internet Access Services: Status as of June 30, 2012 37
37

Table 16 - ContinuedConnections by Technology by State as of June 30, 2012
(Connections over 200 kbps in at least one direction, in thousands)
State ADSL SDSLOther
WirelineCable
Modem Fiber SatelliteFixed
WirelessMobile
Wireless TotalNevada 255 # 0 * 3 * 3 1,483 2,225New Hampshire 89 1 * 354 13 * # 516 983New Jersey 387 1 0 1,830 * * * 4,731 7,623New Mexico 285 # * 198 4 * 16 804 1,322New York 841 7 0 4,253 * * 2 10,064 16,182North Carolina 1,059 1 * 1,729 28 * 2 4,216 7,085North Dakota 72 1 * 111 31 * 6 311 536Northern Mariana Isl * 0 * * * 0 * * *Ohio 1,175 4 * 2,057 47 * 27 5,255 8,618Oklahoma 391 # * 490 14 * 13 1,688 2,634Oregon 372 4 * 683 64 * 15 1,812 2,975Pennsylvania 1,063 4 0 2,200 * * 1 5,687 9,581Puerto Rico * 0 0 * * * * 1,264 1,829Rhode Island * # 0 * * * * 470 809South Carolina 477 * 0 730 34 * * 1,566 2,838South Dakota 65 * 0 141 22 * 12 * 561Tennessee 603 # * 881 72 * 4 2,911 4,526Texas 2,967 5 * 2,804 430 * 82 14,803 21,288Utah 314 1 * 325 22 * 44 1,275 1,992Vermont 97 * 0 109 5 * 1 216 438Virgin Islands * 0 * * 0 * * * 78Virginia 471 1 0 1,187 * * 5 4,154 6,493Washington 597 3 * 1,362 65 * 10 3,483 5,570West Virginia * * 0 297 1 * 2 614 1,110Wisconsin 651 19 * 914 22 * 32 2,053 3,724Wyoming 62 2 * 89 2 * 11 236 408Total 31,188 140 769 49,663 6,299 1,217 683 153,438 243,397
# = Rounds to Zero. Power Line and Other are summarized with Other Wireline to maintain firm confidentiality. * = Data withheld to maintain firm confidentiality. Figures may not sum to totals due to rounding. Source: FCC Form 477, Part I.
U.S. Federal Communications Commission Internet Access Services: Status as of June 30, 2012 38
38

Table 17Connections by Technology by State as of June 30, 2012
(Connections at least 3 Mbps downstream and 768 kbps upstream, in thousands)
State ADSL SDSLOther
WirelineCable
Modem Fiber SatelliteFixed
WirelessMobile
Wireless TotalAlabama 140 # 3 454 5 * # * 924Alaska 28 * 1 * 1 * * * 125American Samoa 0 * 0 0 * 0 * 0 *Arizona 378 * 6 0 3 * 7 * 1,907Arkansas 99 * 2 210 4 * * * 409California 1,576 2 25 3,667 691 * 15 * 10,530Colorado * * 8 858 3 * 28 687 1,994Connecticut * * 2 729 4 * 0 * 1,222Delaware * 0 1 * * * 0 * 367District of Columbia * * 3 * * * * * 635Florida 710 # 18 2,979 * * 2 2,595 6,689Georgia 450 # * 1,158 20 * # 2,063 3,702Guam * * * * * 0 * * 7Hawaii * * # * 2 * * * 583Idaho 121 * 1 73 2 * 5 * 387Illinois 526 3 * 1,751 13 * 6 2,971 5,283Indiana 331 # 2 715 62 * 7 * 1,632Iowa 176 # 1 131 26 * 7 * 483Kansas 78 # * 280 27 * 2 537 928Kentucky 208 * 1 476 9 * 3 374 1,073Louisiana 79 * 2 452 27 * 1 * 722Maine 81 1 # 87 5 * * * 219Maryland * # 6 821 * * # * 2,390Massachusetts * # 9 1,428 * * 1 722 2,783Michigan 336 2 4 1,514 8 * 7 * 3,266Minnesota 306 12 * 744 26 * 2 831 1,929Mississippi 50 * 1 203 1 * * * 327Missouri 283 # * 438 8 * 2 1,345 2,087Montana 39 # 1 * 5 * 1 0 174Nebraska 103 * 1 241 6 * 1 * 460
U.S. Federal Communications Commission Internet Access Services: Status as of June 30, 2012 39
39

Table 17 - ContinuedConnections by Technology by State as of June 30, 2012
(Connections at least 3 Mbps downstream and 768 kbps upstream, in thousands)
State ADSL SDSLOther
WirelineCable
Modem Fiber SatelliteFixed
WirelessMobile
Wireless TotalNevada 102 * 2 * 3 * 3 696 1,231New Hampshire 48 # 1 309 13 * * * 463New Jersey 227 * 11 1,796 * * * * 3,614New Mexico 140 # 2 180 3 * 1 * 468New York 567 1 21 2,876 * * 1 * 6,938North Carolina 404 # * 321 22 * # 1,184 1,940North Dakota 26 # 1 89 15 * 2 * 180Northern Mariana Isl * 0 0 0 * 0 * 0 *Ohio 583 * 5 651 43 * 4 1,486 2,773Oklahoma 101 # * 326 9 * 5 210 654Oregon 186 1 2 662 61 * 8 * 1,374Pennsylvania 621 * 9 1,932 * * # * 4,487Puerto Rico * 0 * * * * * * 242Rhode Island * * 1 * * * * * 446South Carolina 159 * 4 389 27 * * 334 915South Dakota 27 0 # 126 14 * 2 * 216Tennessee 161 # 5 842 55 * # * 1,767Texas 1,074 # * 1,723 390 * 42 7,492 10,751Utah 173 # 3 313 22 * 34 * 924Vermont 64 * # 104 5 * * * 190Virgin Islands 0 0 * * 0 0 * 0 *Virginia 261 # 8 1,119 * * 2 * 3,020Washington 329 * 8 1,322 60 * 3 * 2,635West Virginia * 0 # 245 1 * 2 * 428Wisconsin 232 2 * 484 15 * 2 484 1,225Wyoming 23 * # * 2 * 1 * 153Total 12,879 32 239 37,798 6,000 87 212 43,025 100,271
# = Rounds to Zero. Power Line and Other are summarized with Other Wireline to maintain firm confidentiality. * = Data withheld to maintain firm confidentiality. Figures may not sum to totals due to rounding. Source: FCC Form 477, Part I.
U.S. Federal Communications Commission Internet Access Services: Status as of June 30, 2012 40
40
Table 18Percentage of Connections by Downstream Speed by State as of June 30, 2012
(Connections over 200 kbps in at least one direction)
Over 200 kbps Upstream and
State% over 200 kbps
Downstream% at least 768 kbps
Downstream% at least 3 Mbps
Downstream% at least 6 Mbps
Downstream% at least 10 Mbps
DownstreamAlabama 94.3 77.2 38.2 30.8 18.1Alaska 94.4 90.6 26.2 20.6 12.7American Samoa * * * * *Arizona 95.2 75.8 43.2 36.4 23.4Arkansas 95.7 82.6 27.0 18.8 11.7California 95.1 77.9 36.5 27.2 14.6Colorado 95.6 79.4 46.8 40.2 24.9Connecticut 95.9 77.8 42.8 35.3 23.9Delaware 95.0 76.2 51.9 45.3 33.1District of Columbia 93.7 75.7 52.5 47.1 14.0Florida 96.1 80.8 48.2 38.2 23.0Georgia 94.7 76.2 62.7 31.5 17.3Guam * * * * *Hawaii 97.4 85.8 52.0 41.4 19.5Idaho 92.9 71.4 43.2 28.6 11.6Illinois 96.2 83.5 63.4 34.1 19.7Indiana 95.0 78.5 42.2 32.2 18.4Iowa 95.0 76.0 41.4 30.9 19.3Kansas 93.8 80.8 48.9 36.5 13.6Kentucky 94.4 85.2 43.6 28.7 15.8Louisiana 94.0 84.2 29.3 20.4 14.2Maine 93.2 80.4 46.7 37.8 11.5Maryland 94.6 77.5 49.0 40.7 29.5Massachusetts 95.5 76.8 50.7 43.7 33.8Michigan 94.6 75.2 47.3 35.6 19.7Minnesota 95.2 79.1 50.7 41.7 24.1Mississippi 95.0 65.3 25.5 16.0 11.6Missouri 95.2 86.6 66.1 28.9 12.8Montana 88.5 52.3 27.7 22.6 15.5Nebraska 91.9 66.4 38.4 27.7 16.1
U.S. Federal Communications Commission Internet Access Services: Status as of June 30, 2012 41
41

Table 18 - ContinuedPercentage of Connections by Downstream Speed by State as of June 30, 2012
(Connections over 200 kbps in at least one direction)
Over 200 kbps Upstream and
State% over 200 kbps
Downstream% at least 768 kbps
Downstream% at least 3 Mbps
Downstream% at least 6 Mbps
Downstream% at least 10 Mbps
DownstreamNevada 96.6 84.8 66.4 33.6 20.6New Hampshire 93.3 69.9 51.2 42.8 31.9New Jersey 94.9 73.6 47.6 42.1 33.3New Mexico 93.9 74.2 38.0 32.5 12.1New York 95.0 76.0 45.3 37.1 25.7North Carolina 93.9 76.3 50.0 39.0 10.1North Dakota 93.6 69.1 41.8 32.7 20.7Northern Mariana Isl * * * * *Ohio 92.4 72.3 46.6 34.8 8.3Oklahoma 95.9 91.2 32.3 20.1 14.0Oregon 96.3 82.0 48.0 39.5 25.8Pennsylvania 95.0 78.2 48.8 38.5 26.3Puerto Rico 94.5 87.4 20.8 12.2 8.3Rhode Island 95.7 79.9 55.2 46.2 35.1South Carolina 93.2 72.2 47.4 35.7 16.7South Dakota 93.2 71.2 41.1 38.6 26.0Tennessee 94.0 74.5 43.6 34.6 20.0Texas 96.3 85.4 63.3 26.7 11.7Utah 96.5 81.7 48.8 40.1 22.5Vermont 93.1 76.7 44.6 33.4 18.7Virgin Islands 96.2 81.6 * * *Virginia 94.2 75.6 47.5 37.6 25.0Washington 96.1 82.0 49.0 40.9 26.6West Virginia 96.3 90.0 39.9 37.3 19.1Wisconsin 96.0 83.7 45.1 34.3 15.0Wyoming 93.4 65.3 39.5 34.2 16.0Total 95.1 78.8 47.6 33.7 19.3
* = Data withheld to maintain firm confidentiality. Source: FCC Form 477, Part I.
U.S. Federal Communications Commission Internet Access Services: Status as of June 30, 2012 42
42

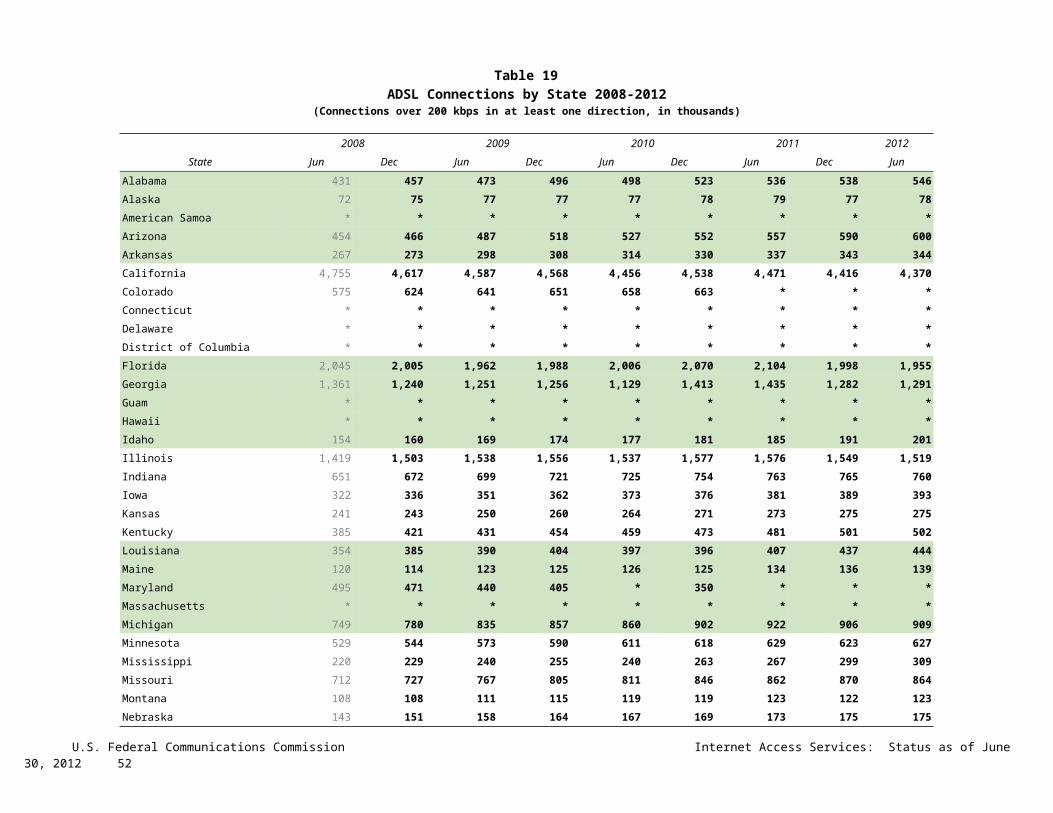
Table 19ADSL Connections by State 2008-2012
(Connections over 200 kbps in at least one direction, in thousands)
2008 2009 2010 2011 2012State Jun Dec Jun Dec Jun Dec Jun Dec Jun
Alabama 431 457 473 496 498 523 536 538 546Alaska 72 75 77 77 77 78 79 77 78American Samoa * * * * * * * * *Arizona 454 466 487 518 527 552 557 590 600Arkansas 267 273 298 308 314 330 337 343 344California 4,755 4,617 4,587 4,568 4,456 4,538 4,471 4,416 4,370Colorado 575 624 641 651 658 663 * * *Connecticut * * * * * * * * *Delaware * * * * * * * * *District of Columbia * * * * * * * * *Florida 2,045 2,005 1,962 1,988 2,006 2,070 2,104 1,998 1,955Georgia 1,361 1,240 1,251 1,256 1,129 1,413 1,435 1,282 1,291Guam * * * * * * * * *Hawaii * * * * * * * * *Idaho 154 160 169 174 177 181 185 191 201Illinois 1,419 1,503 1,538 1,556 1,537 1,577 1,576 1,549 1,519Indiana 651 672 699 721 725 754 763 765 760Iowa 322 336 351 362 373 376 381 389 393Kansas 241 243 250 260 264 271 273 275 275Kentucky 385 421 431 454 459 473 481 501 502Louisiana 354 385 390 404 397 396 407 437 444Maine 120 114 123 125 126 125 134 136 139Maryland 495 471 440 405 * 350 * * *Massachusetts * * * * * * * * *Michigan 749 780 835 857 860 902 922 906 909Minnesota 529 544 573 590 611 618 629 623 627Mississippi 220 229 240 255 240 263 267 299 309Missouri 712 727 767 805 811 846 862 870 864Montana 108 108 111 115 119 119 123 122 123Nebraska 143 151 158 164 167 169 173 175 175
U.S. Federal Communications Commission Internet Access Services: Status as of June 30, 2012 43
43

Table 19 - ContinuedADSL Connections by State 2008-2012
(Connections over 200 kbps in at least one direction, in thousands)
2008 2009 2010 2011 2012State Jun Dec Jun Dec Jun Dec Jun Dec Jun
Nevada 225 222 225 229 232 242 245 250 255New Hampshire 97 91 91 86 84 85 87 88 89New Jersey 700 666 624 568 530 486 449 415 387New Mexico 217 231 242 250 259 266 271 278 285New York 1,169 1,122 1,100 1,046 1,010 957 928 875 841North Carolina 870 891 918 969 985 995 1,026 1,050 1,059North Dakota 60 65 64 67 67 69 71 71 72Northern Mariana Isl * * * * * * * * *Ohio 1,034 1,069 1,109 1,127 1,145 1,177 1,190 1,184 1,175Oklahoma 334 338 349 359 361 379 384 387 391Oregon 361 371 367 367 362 359 360 364 372Pennsylvania 1,209 1,231 1,246 1,232 1,202 1,159 1,131 1,098 1,063Puerto Rico * * * * * * * * *Rhode Island * * * * * * * * *South Carolina 386 400 412 428 437 434 452 471 477South Dakota 53 56 58 58 60 58 60 63 65Tennessee 535 541 549 559 570 557 576 593 603Texas 2,475 2,608 2,706 2,784 2,797 2,898 2,943 2,952 2,967Utah 284 299 280 309 312 311 309 310 314Vermont 73 61 79 81 84 85 87 94 97Virgin Islands * * * * * * * * *Virginia 561 553 547 536 527 507 498 486 471Washington 600 599 596 593 589 582 583 591 597West Virginia 147 152 160 161 162 * * * *Wisconsin 556 556 586 612 615 646 658 657 651Wyoming 55 57 58 58 59 59 59 62 62Total 29,964 30,198 30,631 30,987 30,759 31,470 31,611 31,341 31,188
# = Rounds to Zero. * = Data withheld to maintain firm confidentiality. Note: Some historical data have been revised. Figures may not sum to totals due to rounding. Source: FCC Form 477, Part I.
U.S. Federal Communications Commission Internet Access Services: Status as of June 30, 2012 44
44

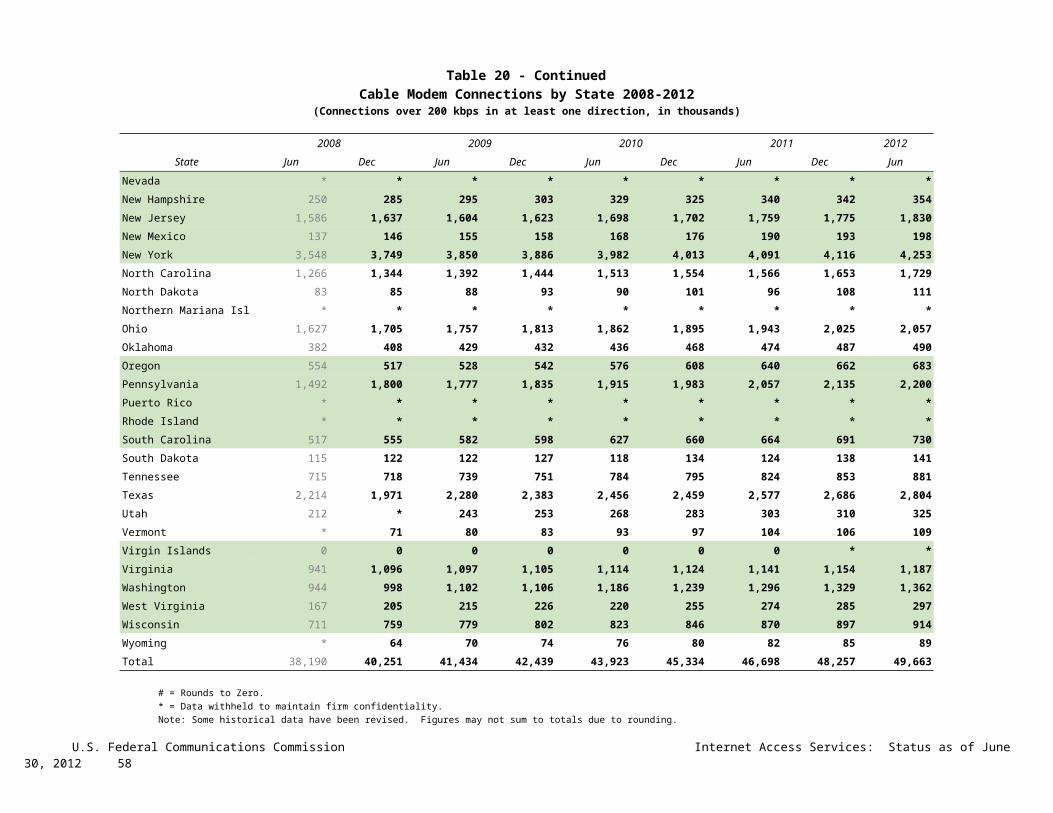
Table 20Cable Modem Connections by State 2008-2012
(Connections over 200 kbps in at least one direction, in thousands)
2008 2009 2010 2011 2012State Jun Dec Jun Dec Jun Dec Jun Dec Jun
Alabama 417 460 478 497 513 539 556 576 592Alaska * * * * * * * * *American Samoa 0 0 0 0 0 * * * *Arizona 992 1,044 1,039 1,104 1,096 1,161 1,104 1,169 1,156Arkansas 236 227 252 262 267 278 288 301 308California 3,799 3,990 4,144 4,224 4,418 4,639 4,853 5,034 5,222Colorado 626 659 693 709 744 787 817 848 870Connecticut 576 615 626 640 672 673 713 723 744Delaware * * * * 158 156 164 * *District of Columbia * * * * * * * * *Florida 2,631 2,825 2,859 2,992 3,076 3,292 3,313 3,549 3,557Georgia 904 974 1,020 1,022 1,052 1,114 1,151 1,190 1,245Guam * * * * * * * * *Hawaii * * * * * * * * *Idaho 127 121 130 133 137 145 150 158 160Illinois 1,625 1,591 1,575 1,577 1,630 1,696 1,768 1,857 1,936Indiana 456 626 641 669 697 728 766 801 835Iowa 309 330 344 360 376 389 395 397 403Kansas 380 415 419 435 434 441 447 456 455Kentucky 482 452 483 497 512 530 565 597 614Louisiana 481 518 544 559 562 586 593 612 625Maine 197 202 224 237 259 269 286 282 300Maryland 871 801 757 768 778 773 797 826 842Massachusetts 1,159 1,291 1,253 1,250 1,339 1,343 1,401 1,415 1,454Michigan 1,307 1,394 1,431 1,451 1,517 1,537 1,603 1,643 1,687Minnesota 622 666 685 701 739 776 800 820 846Mississippi 188 216 227 232 241 246 258 263 270Missouri 517 560 561 586 599 604 617 623 653Montana 90 92 102 108 113 119 127 * *Nebraska 262 278 286 295 293 309 316 324 331
U.S. Federal Communications Commission Internet Access Services: Status as of June 30, 2012 45
45

Table 20 - ContinuedCable Modem Connections by State 2008-2012
(Connections over 200 kbps in at least one direction, in thousands)
2008 2009 2010 2011 2012State Jun Dec Jun Dec Jun Dec Jun Dec Jun
Nevada * * * * * * * * *New Hampshire 250 285 295 303 329 325 340 342 354New Jersey 1,586 1,637 1,604 1,623 1,698 1,702 1,759 1,775 1,830New Mexico 137 146 155 158 168 176 190 193 198New York 3,548 3,749 3,850 3,886 3,982 4,013 4,091 4,116 4,253North Carolina 1,266 1,344 1,392 1,444 1,513 1,554 1,566 1,653 1,729North Dakota 83 85 88 93 90 101 96 108 111Northern Mariana Isl * * * * * * * * *Ohio 1,627 1,705 1,757 1,813 1,862 1,895 1,943 2,025 2,057Oklahoma 382 408 429 432 436 468 474 487 490Oregon 554 517 528 542 576 608 640 662 683Pennsylvania 1,492 1,800 1,777 1,835 1,915 1,983 2,057 2,135 2,200Puerto Rico * * * * * * * * *Rhode Island * * * * * * * * *South Carolina 517 555 582 598 627 660 664 691 730South Dakota 115 122 122 127 118 134 124 138 141Tennessee 715 718 739 751 784 795 824 853 881Texas 2,214 1,971 2,280 2,383 2,456 2,459 2,577 2,686 2,804Utah 212 * 243 253 268 283 303 310 325Vermont * 71 80 83 93 97 104 106 109Virgin Islands 0 0 0 0 0 0 0 * *Virginia 941 1,096 1,097 1,105 1,114 1,124 1,141 1,154 1,187Washington 944 998 1,102 1,106 1,186 1,239 1,296 1,329 1,362West Virginia 167 205 215 226 220 255 274 285 297Wisconsin 711 759 779 802 823 846 870 897 914Wyoming * 64 70 74 76 80 82 85 89Total 38,190 40,251 41,434 42,439 43,923 45,334 46,698 48,257 49,663
# = Rounds to Zero. * = Data withheld to maintain firm confidentiality. Note: Some historical data have been revised. Figures may not sum to totals due to rounding. Source: FCC Form 477, Part I.
U.S. Federal Communications Commission Internet Access Services: Status as of June 30, 2012 46
46

Table 21Providers of Connections by Technology by State as of June 30, 2012
(Connections over 200 kbps in at least one direction)
State ADSL SDSLOther
WirelineCable
Modem Fiber SatelliteFixed
WirelessMobile
WirelessPower Lineand Other Total
Alabama 24 9 22 20 25 * 15 7 0 74Alaska 13 4 9 4 6 4 9 7 0 27American Samoa * * 0 * * 0 * 0 0 *Arizona 24 6 27 11 24 4 22 6 0 74Arkansas 21 7 13 16 15 * 7 6 0 54California 36 18 50 23 27 * 36 10 0 122Colorado 37 8 34 16 26 * 31 11 0 96Connecticut 8 8 22 8 12 * * 5 0 39Delaware 6 4 17 * 5 * 0 6 0 28District of Columbia 11 8 25 * 9 * * 5 0 37Florida 26 16 47 17 34 * 16 7 0 94Georgia 35 16 41 31 38 * 9 8 0 105Guam * * * * * 0 * * 0 5Hawaii 5 4 7 * 6 * * 5 0 22Idaho 25 4 20 14 20 * 14 8 0 59Illinois 57 20 49 20 31 * 47 11 0 145Indiana 36 9 34 13 37 * 41 7 0 99Iowa 126 30 27 41 80 * 70 11 0 206Kansas 39 13 26 29 36 * 31 11 0 97Kentucky 26 9 23 27 23 * 17 9 0 88Louisiana 17 7 22 15 19 * 8 7 0 59Maine 12 10 16 5 11 * * 5 0 32Maryland 16 11 31 12 14 * 7 7 0 61Massachusetts 17 8 33 10 11 * 8 6 0 58Michigan 39 20 36 19 21 * 27 9 0 100Minnesota 51 20 32 17 46 * 32 6 0 107Mississippi 19 5 21 10 11 * 4 6 0 49Missouri 37 14 33 19 32 * 42 8 0 109Montana 24 8 16 6 13 * 16 * 0 47Nebraska 35 7 14 21 30 * 26 8 0 75
U.S. Federal Communications Commission Internet Access Services: Status as of June 30, 2012 47
47

Table 21 - ContinuedProviders of Connections by Technology by State as of June 30, 2012
(Connections over 200 kbps in at least one direction)
State ADSL SDSLOther
WirelineCable
Modem Fiber SatelliteFixed
WirelessMobile
WirelessPower Lineand Other Total
Nevada 18 8 24 6 14 * 7 7 0 55New Hampshire 14 8 17 5 11 * 5 6 0 39New Jersey 21 12 40 6 15 * * 6 0 57New Mexico 22 10 19 7 12 * 17 10 0 54New York 44 16 39 19 26 * 15 6 0 93North Carolina 27 7 29 21 28 * 8 10 0 78North Dakota 31 9 18 7 17 * 13 4 0 49Northern Mariana Isl * 0 * * * 0 * * 0 *Ohio 39 11 32 27 33 * 23 8 * 104Oklahoma 41 9 24 17 21 * 17 10 0 84Oregon 40 12 31 14 34 * 22 6 0 85Pennsylvania 34 11 41 25 25 * 9 7 0 90Puerto Rico * 0 5 * * * * 5 0 14Rhode Island 7 4 12 4 6 * * 5 0 25South Carolina 21 * 20 15 15 * * 9 0 48South Dakota 31 * 13 7 21 * 20 4 0 57Tennessee 22 12 24 17 23 * 16 7 0 79Texas 71 21 59 33 48 * 60 11 0 172Utah 20 9 19 8 17 * 12 7 0 53Vermont 10 * 17 5 9 * 4 4 0 37Virgin Islands * 0 * * 0 * * * 0 7Virginia 26 14 33 15 22 * 17 8 0 75Washington 33 7 38 17 26 * 21 7 0 86West Virginia 7 * 18 12 9 * 6 8 0 47Wisconsin 47 18 26 18 32 * 30 8 0 97Wyoming 14 6 9 4 5 * 13 7 0 37Total 860 249 258 399 642 5 707 68 * 1,662
* Indicates one to three providers. Source: FCC Form 477, Part I.
U.S. Federal Communications Commission Internet Access Services: Status as of June 30, 2012 48
48
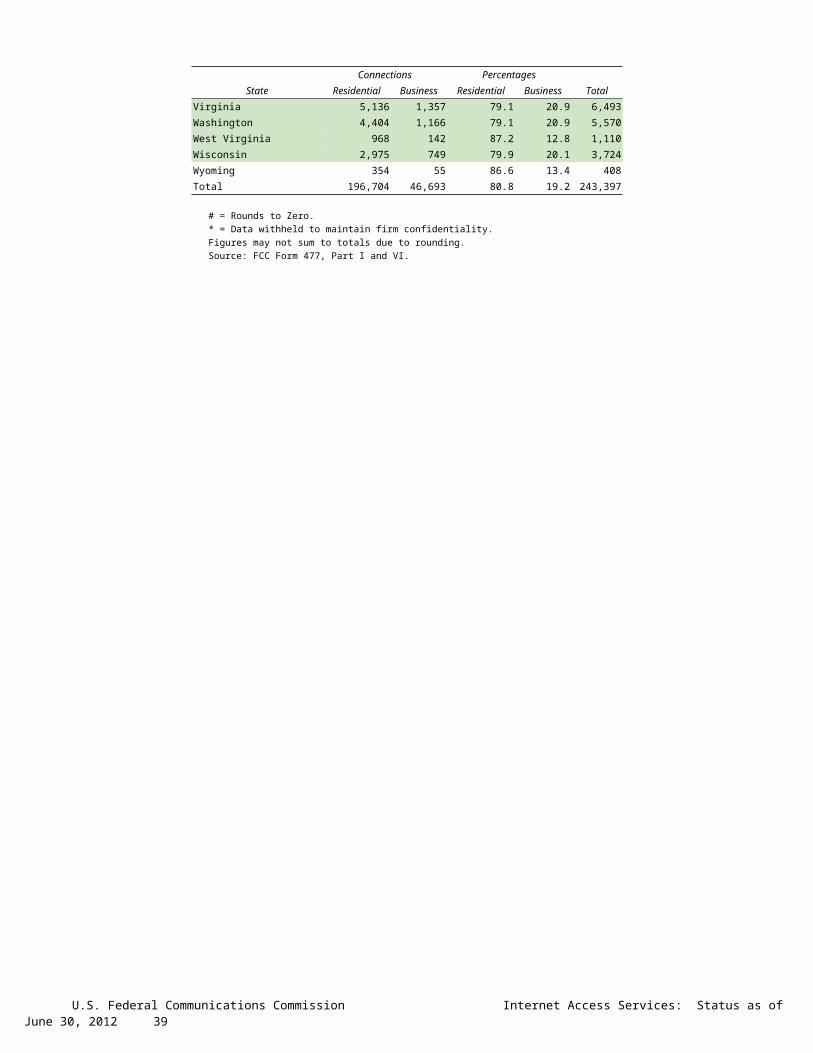
Table 22Percentage of Residential End-User Premises with Access to Servicesover 200 kbps in at Least One Direction by State as of June 30, 2012
StatexDSL Availability Where ILECsOffer Local Telephone Service
Cable Modem Availability Where CableSystems Offer Cable TV Service
Alabama 83 93Alaska 81 *American Samoa * *Arizona 92 99Arkansas 83 84California 87 99Colorado * 99Connecticut * 100Delaware * *District of Columbia * *Florida 87 97Georgia 94 93Guam * *Hawaii * *Idaho 88 98Illinois 89 97Indiana 87 97Iowa 87 93Kansas 86 96Kentucky 88 94Louisiana 85 95Maine 86 96Maryland * 99Massachusetts * 99Michigan 81 98Minnesota 92 97Mississippi 81 91Missouri 85 96Montana 86 *Nebraska 88 94Nevada 92 *New Hampshire 89 98New Jersey 78 100New Mexico 89 95New York 74 99North Carolina 95 95North Dakota 90 92Northern Mariana Isl * *Ohio 90 98Oklahoma 83 94Oregon 92 98Pennsylvania 81 97Puerto Rico * *Rhode Island * *South Carolina 92 95South Dakota 83 87Tennessee 86 99Texas 83 98Utah 96 96Vermont 92 71Virgin Islands * *Virginia 67 98Washington 91 96West Virginia * 93Wisconsin 88 98Wyoming 84 95Total 85 97
* = Data withheld to maintain firm confidentiality. Note: This table summarizes responses to Form 477 questions about service availability, as opposed to subscribership. xDSL includes both asymmetric and symmetric DSL. Each state-specific estimate is a weighted average of the availability percentages that ILECs or cable system operators report for the areas they serve. Reported xDSL availability is weighted by ILEC end-user switched access lines and VoIP lines. Reported cable modem availability is weighted by cable TV subscribers. The weighted averages include ILECs or cable system operators that report no availability. Figures are presented to the nearest percent. Source: FCC Form 477, Parts I and II; Warren Communications News, Inc., Television & Cable Factbook: Online (Cable General Information, February 2010).
U.S. Federal Communications Commission Internet Access Services: Status as of June 30, 2012 49
49

Chart 15Distribution of Counties by Ratio of Residential Fixed Connections over 200 kbps in at Least One Direction
to County Households as of June 30, 2012
Sources: FCC Form 477, Part VI; Geoly tics 2011 Block-Lev el Estimates; and Census 2010. 2010 housing units proxy households in island area counties.Note: Ratios ov er 1 were set to 1. See Technical Notes at the end of the report.
0 0.05 0.10 0.15 0.20 0.25 0.30 0.35 0.40 0.45 0.50 0.55 0.60 0.65 0.70 0.75 0.80 0.85 0.90 0.95 Max0%
2%
4%
6%
8%
10%
12%
14%
16%Pe
rcen
tage
of C
ount
ies
Number of Counties
U.S. Federal Communications Commission Internet Access Services: Status as of June 30, 2012 51
51

Table 23Distribution of Counties by Ratio of Residential Fixed Connections over 200 kbps in at Least One Direction
to County Households by Technology as of June 30, 2012
Ratio of Residential Fixed Connections to County Households
Technology Zero
Greater than 0 and no more
than 5%
Greater than 5 and no more than 10%
Greater than 10 and no more than 20%
Greater than 20 and no more than 30%
Greater than 30 and no more than 40%
Greater than 40 and no more than 50%
Greater than 50 and no more than 60%
Greater than 60 and no more than 80%
Greater than 80 and no more than
100%100% or
more
aDSL 0.5 1.8 4.9 26.1 31.4 21.2 9.4 3.4 0.9 0.3 0.1
sDSL 83.9 15.4 0.4 0.2 0.1 0.0 0.0 0.0 0.0 0.0 0.0
Other Wireline 97.7 2.1 0.1 0.0 0.0 0.0 0.0 0.0 0.0 0.0 0.0
Cable Modem 13.5 9.1 9.4 18.0 17.2 14.6 10.9 5.0 1.9 0.2 0.2
FTTP 57.8 29.2 4.4 3.7 2.4 1.2 0.6 0.4 0.3 0.0 0.0
Satellite 0.5 83.2 13.0 3.0 0.1 0.1 0.0 0.0 0.0 0.0 0.0
Fixed Wireless 43.8 44.2 7.6 3.6 0.6 0.2 0.1 0.0 0.0 0.0 0.0
Power Line 100.0 0.0 0.0 0.0 0.0 0.0 0.0 0.0 0.0 0.0 0.0
All Other 100.0 0.0 0.0 0.0 0.0 0.0 0.0 0.0 0.0 0.0 0.0
Total 0.1 0.1 0.2 0.7 3.6 9.4 19.2 26.5 34.1 5.5 0.7
Note: Figures may not sum to totals due to rounding. See Technical Notes at the end of the report. Sources: FCC Form 477, Part VI; Geolytics 2011 Block-Level Estimates; and Census 2010. 2010 housing units proxy households in island area counties.
U.S. Federal Communications Commission Internet Access Services: Status as of June 30, 2012 52
52

Chart 16Distribution of Census Tracts by Ratio of Residential Fixed Connections over 200 kbps in at Least One Direction
to Tract Households as of June 30, 2012
Sources: FCC Form 477, Part VI; Geoly tics 2011 Block-Lev el Estimates; and Census 2000.Note: Ratios ov er 2 were set to 2. See Technical Notes at the end of the report.
0 0.10 0.20 0.30 0.40 0.50 0.60 0.70 0.80 0.90 1.00 1.10 1.20 1.30 1.40 1.50 1.60 1.70 1.80 1.90 Max0
2
4
6
8
10
U.S. Federal Communications Commission Internet Access Services: Status as of June 30, 2012 53
53

Table 24Distribution of Census Tracts by Ratio of Residential Fixed Connections over 200 kbps in at Least One Direction
to Tract Households by Technology as of June 30, 2012
Ratio of Residential Fixed Connections to Tract Households
Technology Zero
Greater than 0 and no more
than 5%
Greater than 5 and no more than 10%
Greater than 10 and no more than 20%
Greater than 20 and no more than 30%
Greater than 30 and no more than 40%
Greater than 40 and no more than 50%
Greater than 50 and no more than 60%
Greater than 60 and no more than 80%
Greater than 80 and no more than
100%100% or
more
aDSL 1.3 8.3 11.1 28.4 23.6 14.8 7.5 3.0 1.4 0.3 0.3
sDSL 96.5 3.3 0.1 0.1 0.0 0.0 0.0 0.0 0.0 0.0 0.0
Other Wireline 99.8 0.2 0.0 0.0 0.0 0.0 0.0 0.0 0.0 0.0 0.0
Cable Modem 5.8 3.5 2.6 8.8 15.3 18.8 17.1 13.6 11.9 1.8 0.9
FTTP 73.2 10.7 2.0 3.0 3.4 3.4 2.3 1.2 0.6 0.1 0.0
Satellite 46.7 47.7 3.7 1.6 0.2 0.1 0.0 0.0 0.0 0.0 0.0
Fixed Wireless 84.4 12.3 1.7 1.2 0.3 0.1 0.0 0.0 0.0 0.0 0.0
Power Line 99.9 0.1 0.0 0.0 0.0 0.0 0.0 0.0 0.0 0.0 0.0
All Other 100.0 0.0 0.0 0.0 0.0 0.0 0.0 0.0 0.0 0.0 0.0
Total 0.6 0.2 0.3 1.1 2.9 6.1 9.9 14.2 36.6 24.4 3.7
Note: Figures may not sum to totals due to rounding. See Technical Notes at the end of the report. Sources: FCC Form 477, Part VI; Geolytics 2011 Block-Level Estimates; and Census 2000.
U.S. Federal Communications Commission Internet Access Services: Status as of June 30, 2012 54
54

Table 25Percentage of Census Tracts with Residential Fixed Connections by Technology as of June 30, 2012
(Connections over 200 kbps in at least one direction)
Number of Providers
Technology Zero One Two Three Four Five SixSeven or
More
aDSL 1.3 48.0 35.9 12.5 1.9 0.3 0.0 0.0
sDSL 96.5 3.3 0.2 0.0 0.0 0.0 0.0 0.0
Other Wireline 99.8 0.2 0.0 0.0 0.0 0.0 0.0 0.0
Cable Modem 5.8 81.4 12.3 0.5 0.0 0.0 0.0 0.0
FTTP 73.2 26.1 0.6 0.0 0.0 0.0 0.0 0.0
Satellite 46.7 24.0 26.9 2.5 0.0 0.0 0.0 0.0
Fixed Wireless 84.4 12.0 2.9 0.6 0.1 0.0 0.0 0.0
Power Line 99.9 0.1 0.0 0.0 0.0 0.0 0.0 0.0
aDSL and/or Cable Modem and/or FTTP 0.8 2.9 40.9 35.5 15.8 3.4 0.6 0.1
Any Technology 0.6 0.6 18.4 27.6 25.9 15.6 7.1 4.2
Note: Figures may not sum to totals due to rounding. Sources: FCC Form 477, Part VI and Census 2010.
U.S. Federal Communications Commission Internet Access Services: Status as of June 30, 2012 55
55

Table 26Distribution of Counties by Ratio of Residential Fixed Connections to County Households by State as of June 30, 2012
(Connections over 200 kbps in at least one direction)
Ratio of Residential Fixed Connections over 200 kbps in at Least One Direction to County Households
State Counties Zero
Greater than 0 and no more than 5%
Greater than 5 and no more than 10%
Greater than 10 and
no more than 20%
Greater than 20 and
no more than 30%
Greater than 30 and
no more than 40%
Greater than 40 and
no more than 50%
Greater than 50 and
no more than 60%
Greater than 60 and
no more than 80%
Greater than 80 and
no more than 100%
100% or more
Alabama 67 0 0 0 2 4 9 30 9 13 0 0Alaska 29 0 0 1 2 1 3 7 0 14 0 1American Samoa 5 2 1 0 1 1 0 0 0 0 0 0Arizona 15 0 0 0 0 0 2 0 7 6 0 0Arkansas 75 0 0 0 0 3 23 31 10 8 0 0California 58 0 0 0 1 0 1 3 8 34 10 1Colorado 64 0 0 0 0 1 1 8 17 22 9 6Connecticut 8 0 0 0 0 0 0 0 0 4 4 0Delaware 3 0 0 0 0 0 0 0 0 2 1 0District of Columbia 1 0 0 0 0 0 0 0 0 1 0 0Florida 67 0 0 0 0 2 1 13 9 31 9 2Georgia 159 0 0 1 2 10 18 37 35 47 9 0Guam 1 0 0 0 0 0 0 0 1 0 0 0Hawaii 5 0 1 0 0 0 0 0 0 1 3 0Idaho 44 0 0 0 0 2 4 14 11 12 0 1Illinois 102 0 0 1 1 2 7 20 38 29 3 1Indiana 92 0 0 0 0 1 5 23 37 24 2 0Iowa 99 0 0 0 0 0 0 8 46 43 2 0Kansas 105 0 0 0 0 0 2 15 37 48 3 0Kentucky 120 0 0 0 0 4 10 31 36 36 3 0Louisiana 64 0 0 0 0 4 10 18 14 18 0 0Maine 16 0 0 0 0 0 0 0 2 10 4 0Maryland 24 0 0 0 0 0 0 4 1 14 5 0Massachusetts 14 0 0 0 0 0 0 0 0 7 4 3Michigan 83 0 0 0 0 2 7 15 29 27 3 0Minnesota 87 0 0 0 0 0 1 6 28 50 2 0Mississippi 82 0 0 0 2 15 30 17 11 6 1 0Missouri 115 0 0 1 1 3 16 33 39 20 2 0Montana 56 0 0 0 0 0 0 10 24 22 0 0Nebraska 93 0 0 0 0 0 7 17 35 33 1 0
U.S. Federal Communications Commission Internet Access Services: Status as of June 30, 2012 56
56

Table 26 - ContinuedDistribution of Counties by Ratio of Residential Fixed Connections to County Households by State as of June 30, 2012
(Connections over 200 kbps in at least one direction)
Ratio of Residential Fixed Connections over 200 kbps in at Least One Direction to County Households
State Counties Zero
Greater than 0 and no more than 5%
Greater than 5 and no more than 10%
Greater than 10 and
no more than 20%
Greater than 20 and
no more than 30%
Greater than 30 and
no more than 40%
Greater than 40 and
no more than 50%
Greater than 50 and
no more than 60%
Greater than 60 and
no more than 80%
Greater than 80 and
no more than 100%
100% or more
Nevada 17 0 0 0 0 0 4 3 3 7 0 0New Hampshire 10 0 0 0 0 0 0 0 1 4 5 0New Jersey 21 0 0 0 0 0 0 0 0 8 12 1New Mexico 33 0 0 0 0 2 7 7 8 7 2 0New York 62 0 0 0 0 0 1 0 9 41 10 1North Carolina 100 0 0 0 0 0 3 23 25 37 11 1North Dakota 53 0 0 0 0 0 1 4 9 35 4 0Northern Mariana Isl 4 1 0 0 3 0 0 0 0 0 0 0Ohio 88 0 0 0 0 0 3 11 27 45 2 0Oklahoma 77 0 0 0 0 8 17 20 22 10 0 0Oregon 36 0 0 0 0 0 1 3 13 19 0 0Pennsylvania 67 0 0 0 0 0 3 1 12 38 11 2Puerto Rico 78 0 0 0 0 18 21 29 9 1 0 0Rhode Island 5 0 0 0 0 0 0 0 0 3 2 0South Carolina 46 0 0 0 0 2 9 8 14 11 2 0South Dakota 66 0 0 0 0 1 4 5 21 32 3 0Tennessee 95 0 0 0 1 4 15 36 23 15 1 0Texas 254 0 0 0 0 11 33 73 71 60 5 1Utah 29 0 0 0 0 1 2 0 9 15 1 1Vermont 14 0 0 0 0 0 0 0 1 8 5 0Virgin Islands 3 0 0 0 0 1 2 0 0 0 0 0Virginia 134 0 0 1 6 11 12 21 38 29 16 0Washington 39 0 0 0 0 1 3 1 9 24 1 0West Virginia 55 0 0 0 0 1 5 9 24 15 1 0Wisconsin 72 0 0 0 0 0 0 4 19 46 2 1Wyoming 23 0 0 0 0 0 1 3 6 12 1 0Total 3,234 3 2 5 22 116 304 621 857 1104 177 23
Note: Figures may not sum to totals due to rounding. See Technical Notes at the end of the report. Sources: FCC Form 477, Part VI (Connections); Geolytics 2011 Block-Level Estimates (Households for U.S. and District of Columbia); Census 2010 (Housing units for Puerto Rico, American Samoa, Guam, Northern Mariana Islands and U.S. Virgin Islands).
U.S. Federal Communications Commission Internet Access Services: Status as of June 30, 2012 57
57

Table 27Distribution of Census Tracts by Ratio of Residential Fixed Connections to Tract Households by State as of June 30, 2012
(Connections over 200 kbps in at least one direction)
Ratio of Residential Fixed Connections over 200 kbps in at Least One Direction to Tract Households
State Tracts Zero
Greater than 0 and no more than 5%
Greater than 5 and no more than 10%
Greater than 10 and
no more than 20%
Greater than 20 and
no more than 30%
Greater than 30 and
no more than 40%
Greater than 40 and
no more than 50%
Greater than 50 and
no more than 60%
Greater than 60 and
no more than 80%
Greater than 80 and
no more than 100%
100% or more
Alabama 1,179 4 2 1 30 92 176 233 207 318 97 19Alaska 167 2 2 1 5 6 7 11 20 79 23 11American Samoa 18 3 6 1 2 2 0 2 1 0 1 0Arizona 1,526 18 14 7 18 40 81 134 200 525 418 71Arkansas 686 0 2 1 22 66 125 146 109 162 41 12California 8,036 40 14 13 56 79 207 483 841 2,938 3,055 310Colorado 1,249 12 0 2 3 9 27 79 158 456 427 76Connecticut 829 3 0 0 0 3 14 45 60 273 408 23Delaware 215 1 0 0 1 0 2 16 26 78 70 21District of Columbia 179 1 0 0 0 0 3 22 26 75 46 6Florida 4,199 30 3 4 11 51 137 332 559 1,690 1,131 251Georgia 1,964 10 5 1 23 78 187 290 316 650 352 52Guam 56 6 2 0 4 2 2 0 1 3 3 33Hawaii 326 7 1 1 3 0 2 11 23 128 108 42Idaho 298 1 0 1 0 7 19 46 87 113 20 4Illinois 3,121 7 5 3 26 80 249 376 485 1,166 674 50Indiana 1,508 3 2 3 5 35 100 262 357 542 177 22Iowa 825 2 1 1 1 8 20 82 212 420 69 9Kansas 770 7 1 0 4 14 48 92 175 275 130 24Kentucky 1,115 8 0 2 14 43 87 192 227 382 130 30Louisiana 1,136 10 0 2 16 60 154 214 216 350 100 14Maine 351 0 0 0 0 2 5 22 40 178 77 27Maryland 1,394 7 0 1 1 16 67 90 128 467 560 57Massachusetts 1,471 9 0 0 1 5 6 33 107 572 658 80Michigan 2,767 24 1 4 40 172 251 290 362 1,001 586 36Minnesota 1,335 4 0 2 6 6 31 106 257 621 289 13Mississippi 661 3 1 6 18 87 153 120 93 134 32 14Missouri 1,393 3 4 4 16 93 138 201 272 433 205 24Montana 271 2 0 2 2 3 15 32 74 110 23 8Nebraska 532 2 0 1 0 2 25 58 114 216 91 23
U.S. Federal Communications Commission Internet Access Services: Status as of June 30, 2012 58
58
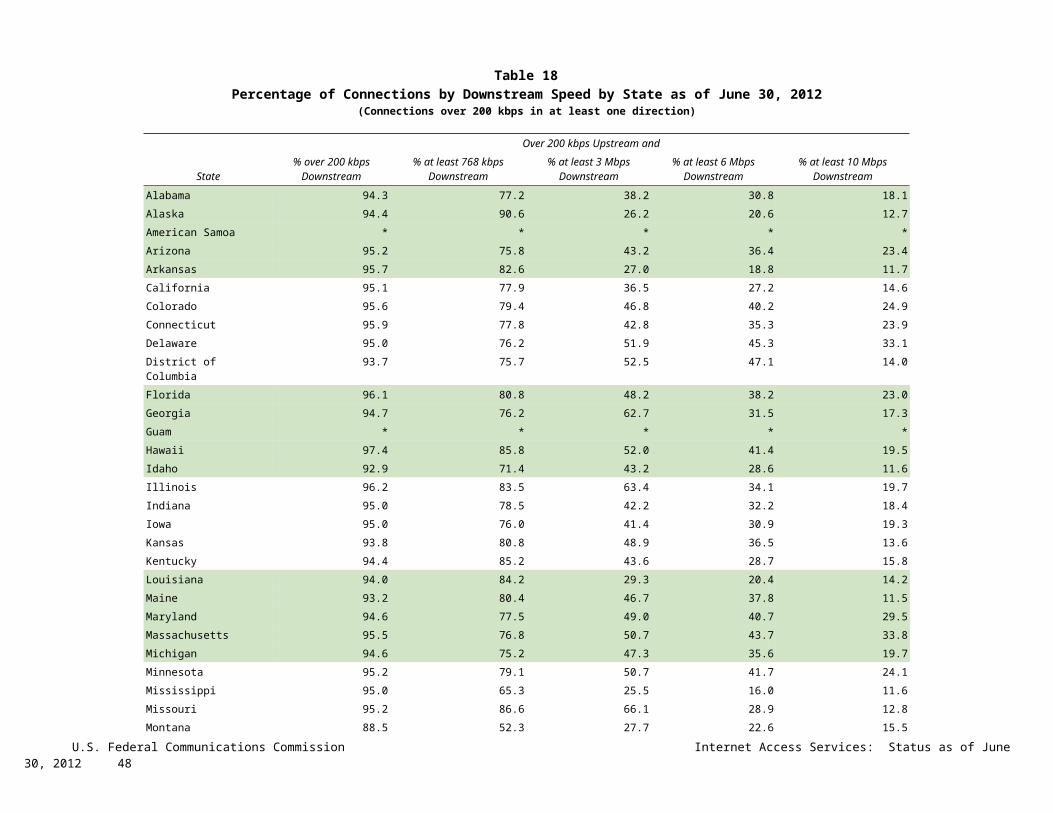
Table 27 - ContinuedDistribution of Census Tracts by Ratio of Residential Fixed Connections to Tract Households by State as of June 30, 2012
(Connections over 200 kbps in at least one direction)
Ratio of Residential Fixed Connections over 200 kbps in at Least One Direction to Tract Households
State Tracts Zero
Greater than 0 and no more than 5%
Greater than 5 and no more than 10%
Greater than 10 and
no more than 20%
Greater than 20 and
no more than 30%
Greater than 30 and
no more than 40%
Greater than 40 and
no more than 50%
Greater than 50 and
no more than 60%
Greater than 60 and
no more than 80%
Greater than 80 and
no more than 100%
100% or more
Nevada 683 5 0 3 9 25 45 73 92 252 151 28New Hampshire 294 2 0 1 0 0 0 6 17 114 139 15New Jersey 2,004 8 1 2 1 0 10 32 112 754 984 100New Mexico 499 5 11 4 9 27 53 86 87 155 47 15New York 4,900 65 2 9 20 37 119 158 452 2,295 1,541 202North Carolina 2,183 14 1 1 9 52 134 282 370 719 421 180North Dakota 205 0 0 0 0 3 6 17 34 106 28 11Northern Mariana Isl 22 3 2 0 1 3 0 0 2 1 1 9Ohio 2,946 6 0 2 12 76 214 319 495 1,226 541 55Oklahoma 1,046 1 9 12 34 76 136 177 171 265 138 27Oregon 827 2 0 0 1 1 13 53 166 419 165 7Pennsylvania 3,217 13 2 3 20 34 78 220 497 1,455 749 146Puerto Rico 903 15 2 27 167 171 176 116 79 54 31 65Rhode Island 241 0 0 0 0 0 0 3 23 129 76 10South Carolina 1,097 9 0 0 12 60 121 187 186 322 136 64South Dakota 222 1 0 0 1 3 8 20 44 113 28 4Tennessee 1,497 14 2 3 22 92 181 299 284 424 149 27Texas 5,253 29 11 33 104 269 621 769 739 1,433 1,030 215Utah 588 5 1 3 2 5 6 33 80 281 143 29Vermont 184 1 0 0 0 0 1 2 18 101 48 13Virgin Islands 29 0 0 1 4 6 4 3 4 4 0 3Virginia 1,895 18 3 12 34 68 98 182 226 472 693 89Washington 1,446 1 0 2 7 19 42 80 163 646 456 30West Virginia 484 0 4 6 17 13 39 73 95 177 41 19Wisconsin 1,393 2 3 1 6 30 73 116 251 677 212 22Wyoming 132 1 0 0 3 3 6 10 20 71 17 1Total 73,767 449 120 189 823 2,134 4,522 7,336 10,460 27,020 17,966 2,748
Note: Figures may not sum to totals due to rounding. See Technical Notes at the end of the report. Sources: FCC Form 477, Part VI (Connections); Geolytics 2011 Block-Level Estimates (Households for U.S. and District of Columbia); Census 2000 (Households for Puerto Rico, American Samoa, Guam, Northern Mariana Islands and U.S. Virgin Islands).
U.S. Federal Communications Commission Internet Access Services: Status as of June 30, 2012 59
59

Chart 17Ratio of Residential Fixed Connections over 200 kbps in at Least One Direction to Households
by Income Deciles as of June 30, 2012(County Data)
Sources: FCC Form 477, Part VI; Geoly tics 2011 Block-Lev el Estimates (Households in 2011); and 2007-2011 ACS 5-y ear Estimates (Median household income).one direction across all counties in decile N and all deciles less than N to the number of households in all the counties in decile N and deciles less than N.decile to the sum of households across counties in the decile. The height of the blue, cumulativ e bar f or decile N represents the ratio of the sum of residential f ixed connections ov er 200 kbps in at leastCensus Bureau. For each decile, the height of any red, non-cumulativ e bar represents the ratio of the sum of residential f ixed connections ov er 200 kbps in at least one direction across counties in theThis chart shows cumulativ e and non-cumulativ e subscribership ratios by income deciles. Counties were grouped into income deciles based on county median household income in 2009, as reported by the
Lower Income Counties Ranked by Median Household Income, in Deciles Higher Income
Cumulative Not Cumulative
0.42 0.42
0.47
0.510.50
0.540.52
0.560.54
0.60
0.57
0.64
0.59
0.65
0.62
0.69
0.65
0.72
0.69
0.81
Subs
crib
ersh
ip R
atio
0.00
0.10
U.S. Federal Communications Commission Internet Access Services: Status as of June 30, 2012 67
67

Max
Q1
Q3
Median
Min
Chart 18Subscribership Ratio Distributions by Income Deciles as of June 30, 2012
Sources: FCC Form 477, Part VI; Geoly tics 2011 Block-Lev el Estimates (Households in 2011); and 2007-2011 ACS 5-y ear Estimates (Median household income).observ ation below Q3+1.5(Q3-Q1); and is any data point bey ond Q1-1.5(Q3-Q1) or Q3+1.5(Q3-Q1). Ratios greater than 1 were set to 1.but note also that + denotes the position of the av erageresidential subscribership ratio taken across all counties in the decile; is the minimum observ ation abov e Q1-1.5(Q3-Q1); T is the maximumNote: Each box plot shows the distribution of residential subscribership to connections ov er 200 kbps in at least one direction f or counties in the income decile. Some of the f eatures are labeled,
1 2 3 4 5 6 7 8 9 10
0
0.1
0.2
0.3
0.4
0.5
0.6
0.7
0.8
0.9
1.0
Subs
crib
ersh
ip R
atio
Lower Income Median Household Income by Decile Higher Income
Subscribership Ratio
U.S. Federal Communications Commission Internet Access Services: Status as of June 30, 2012 68
68

Chart 19Ratio of Residential Fixed Connections over 200 kbps in at Least One Direction to Households
by Density Deciles as of June 30, 2012(County Data)
Sources: FCC Form 477, Part VI; Geoly tics 2011 Block-Lev el Estimates (Households in 2011); and Census 2010 (County land area).and deciles less than N.the sum of residential f ixed connections ov er 200 kbps in at least one direction across all counties in decile N and all deciles less than N to the number of households in all the counties in decile Nov er 200 kbps in at least one direction across counties in the decile to the sum of households across counties in the decile. The height of the blue, cumulativ e bar f or decile N represents the ratio ofestimated county households in 2010 to county land area f rom the Census Bureau. For each decile, the height of any red, non-cumulativ e bar represents the ratio of the sum of residential f ixed connectionsThis chart shows cumulativ e and non-cumulativ e subscribership ratios by density deciles. Counties were grouped into density deciles based on households per square mile, calculated as the ratio of
Lower Density Counties Ranked by Household Density, in Deciles Higher Density
Cumulative Not Cumulative
0.57 0.57 0.56 0.560.55
0.54 0.540.52
0.54 0.54 0.550.56 0.56
0.600.59
0.64 0.64
0.700.69
0.74
Subs
crib
ersh
ip R
atio
0.00
U.S. Federal Communications Commission Internet Access Services: Status as of June 30, 2012 69
69
Max
Q1
Q3
Median
Min
Chart 20Subscribership Ratio Distributions by Density Deciles as of June 30, 2012
Sources: FCC Form 477, Part VI; Geoly tics 2011 Block-Lev el Estimates (Households in 2011); and Census 2010 (County land area).observ ation below Q3+1.5(Q3-Q1); and is any data point bey ond Q1-1.5(Q3-Q1) or Q3+1.5(Q3-Q1). Ratios greater than 1 were set to 1.but note also that + denotes the position of the av erage residential subscribership ratio taken across all counties in the decile; is the minimum observ ation abov e Q1-1.5(Q3-Q1); T is the maximumNote: Each box plot shows the distribution of residential subscribership to connections ov er 200 kbps in at least one direction f or counties in the density decile. Some of the f eatures are labeled,
1 2 3 4 5 6 7 8 9 10
0
0.1
0.2
0.3
0.4
0.5
0.6
0.7
0.8
0.9
1.0
Subs
crib
ersh
ip R
atio
Lower Density County Household Density by Decile Higher Density
Subscribership Ratio
U.S. Federal Communications Commission Internet Access Services: Status as of June 30, 2012 70
70

Chart 21Ratio of Residential Fixed Connections over 200 kbps in at Least One Direction to Households
by Share of College Graduates in Deciles as of June 30, 2012(County Data)
Sources: FCC Form 477, Part VI; Geoly tics 2011 Block-Lev el Estimates (Households in 2011); and 2007-2011 ACS 5-y ear Estimates (County educational attainment).less than N.residential f ixed connections ov er 200 kbps in at least one direction across all counties in decile N and all deciles less than N, to the number of households in all the counties in decile N and deciles200 kbps in at least one direction across counties in the decile to the sum of households across counties in the decile. The height of the blue, cumulativ e bar f or decile N represents the ratio of the sum ofleast 25 y ears of age with a college degree or higher educational attainment. For each decile, the height of any red, non-cumulativ e bar represents the ratio of the sum of residential f ixed connections ov erThis chart shows cumulativ e and non-cumulativ e subscribership ratios by county share of college graduates in deciles. Counties were grouped into deciles based on the share of the county population at
Lower Share Counties Ranked by Share of College Graduates, in Deciles Higher Share
Cumulative Not Cumulative
0.44 0.44
0.460.48 0.48
0.51 0.50
0.540.52
0.58
0.55
0.62
0.58
0.64
0.60
0.67
0.64
0.710.69
0.78
Subs
crib
ersh
ip R
atio
0.00
U.S. Federal Communications Commission Internet Access Services: Status as of June 30, 2012 71
71

Max
Q1
Q3
Median
Min
Chart 22Subscribership Ratio Distributions by Share of Population with a College Degree (in Deciles) as of June 30, 2012
Sources: FCC Form 477, Part VI; Geoly tics 2011 Block-Lev el Estimates (Households in 2011); and 2007-2011 ACS 5-y ear Estimates (County educational attainment).observ ation below Q3+1.5(Q3-Q1); and is a data point bey ond Q1-1.5(Q3-Q1) or Q3+1.5(Q3-Q1). Ratios greater than 1 were set to 1.but note also that + denotes the position of the av erage residential subscribership ratio taken across all counties in the decile; is the minimum observ ation abov e Q1-1.5(Q3-Q1); T is the maximumNote: Each box plot shows the distribution of residential subscribership to connections ov er 200 kbps in at least one direction f or counties in the share decile. Some of the f eatures are labeled,
1 2 3 4 5 6 7 8 9 10
0
0.1
0.2
0.3
0.4
0.5
0.6
0.7
0.8
0.9
1.0
Subs
crib
ersh
ip R
atio
Lower Share County Share of College Graduates by Decile Higher Share
Subscribership Ratio
U.S. Federal Communications Commission Internet Access Services: Status as of June 30, 2012 72
72

Chart 23Ratio of Residential Fixed Connections over 200 kbps in at Least One Direction to Households
by Average Age in Deciles as of June 30, 2012(County Data)
Sources: FCC Form 477, Part VI; Geoly tics 2011 Block-Lev el Estimates (Households in 2011); and 2007-2011 ACS 5-y ear Estimates (County av erage age).across all counties in decile N and all deciles less than N, to the number of households in all the counties in decile N and deciles less than N.households across counties in the decile. The height of the blue, cumulativ e bar f or decile N represents the ratio of the sum of residential f ixed connections ov er 200 kbps in at least one directiondecile, the height of any red, non-cumulativ e bar represents the ratio of the sum of residential f ixed connections ov er 200 kbps in at least one direction across counties in the decile to the sum ofThis chart shows cumulativ e and non-cumulativ e subscribership ratios by county av erage age in deciles. Counties were grouped into deciles based on the av erage age of the county population. For each
Lower Average Age Counties Ranked by Average Age, in Deciles Higher Average Age
Cumulative Not Cumulative
0.70 0.700.71 0.72
0.70
0.67
0.70 0.70 0.70 0.70 0.70
0.670.69
0.62
0.69
0.64
0.69
0.64
0.690.70
Subs
crib
ersh
ip R
atio
0.00
0.10
U.S. Federal Communications Commission Internet Access Services: Status as of June 30, 2012 73
73

Max
Q1
Q3
Median
Min
Chart 24Subscribership Ratio Distributions by Average Age of County Population (in Deciles) as of June 30, 2012
Sources: FCC Form 477, Part VI; Geoly tics 2011 Block-Lev el Estimates (Households in 2011); and 2007-2011 ACS 5-y ear Estimates (County av erage age).observ ation below Q3+1.5(Q3-Q1); and is a data point bey ond Q1-1.5(Q3-Q1) or Q3+1.5(Q3-Q1). Ratios greater than 1 were set to 1.but note also that + denotes the position of the av erage residential subscribership ratio taken across all counties in the decile; is the minimum observ ation abov e Q1-1.5(Q3-Q1); T is the maximumNote: Each box plot shows the distribution of residential subscribership to connections ov er 200 kbps in at least one direction f or counties in the av erage age decile. Some of the f eatures are labeled,
1 2 3 4 5 6 7 8 9 10
0
0.1
0.2
0.3
0.4
0.5
0.6
0.7
0.8
0.9
1.0
Subs
crib
ersh
ip R
atio
Lower Average Age County Average Age by Decile Higher Average Age
Subscribership Ratio
U.S. Federal Communications Commission Internet Access Services: Status as of June 30, 2012 74
74

Chart 25Ratio of Residential Fixed Connections over 200 kbps in at Least One Direction to Households
by Share White Alone in Deciles as of June 30, 2012(County Data)
Sources: FCC Form 477, Part VI; Geoly tics 2011 Block-Lev el Estimates (Households in 2011); and 2007-2011 ACS 5-y ear Estimates (Race).connections ov er 200 kbps in at least one direction across all counties in decile N and all deciles less than N, to the number of households in all the counties in decile N and deciles less than N.one direction across counties in the decile to the sum of households across counties in the decile. The height of the blue, cumulativ e bar f or decile N represents the ratio of the sum of residential f ixedpopulation that reported their race as white alone. For each decile,the height of any red, non-cumulativ e bar represents the ratio of the sum of residential f ixed connections ov er 200 kbps in at leastThis chart shows cumulativ e and non-cumulativ e subscribership ratios by the share of county population white alone in deciles. Counties were grouped into deciles based on the share of the county
Lower Share Counties Ranked by Share of Population W hite, in Deciles Higher Share
Cumulative Not Cumulative
0.69 0.690.70
0.71 0.70 0.70 0.700.72
0.70 0.69 0.70
0.67
0.70
0.65
0.70
0.62
0.69
0.60
0.69
0.56
Subs
crib
ersh
ip R
atio
0.00
0.10
U.S. Federal Communications Commission Internet Access Services: Status as of June 30, 2012 75
75
Max
Q1
Q3
Median
Min
Chart 26Subscribership Ratio Distributions by Share White Alone (in Deciles) as of June 30, 2012
Sources: FCC Form 477, Part VI; Geoly tics 2011 Block-Lev el Estimates (Households in 2011); and 2007-2011 ACS 5-y ear Estimates (Race).is a data point bey ond Q1-1.5(Q3-Q1) or Q3+1.5(Q3-Q1). Ratios greater than 1 were set to 1.residential subscribership ratio taken across all counties in the decile; is the minimum observ ation abov e Q1-1.5(Q3-Q1); T is the maximum observ ation below Q3+1.5(Q3-Q1); and deciles based on the share of the county population that reported their race as white alone. Some of the f eatures are labeled, but note also that + denotes the position of the av erageNote: Each box plot shows the distribution of residential subscribership to connections ov er 200 kbps in at least one direction f or counties in each race decile. Counties were grouped into
1 2 3 4 5 6 7 8 9 10
0
0.1
0.2
0.3
0.4
0.5
0.6
0.7
0.8
0.9
1.0
Subs
crib
ersh
ip R
atio
Lower Share County Share White Alone by Decile Higher Share
Subscribership Ratio
U.S. Federal Communications Commission Internet Access Services: Status as of June 30, 2012 76
76

Lowest Density Highest Density
Chart 27Subscribership Ratios by Technology and Tract Household Density as of June 30, 2012
(Residential fixed connections over 200 kbps in at least one direction)
Sources: FCC Form 477, Part VI; Geoly tics 2011 Block-Lev el Estimates (Households in 2011); and Census 2010 (Tract land area).
connections to households across tracts in the percentile.estimated tract households in 2011 to tract land area f rom the Census Bureau. For each percentile, the height of the bar represents the household-weighted av erage ratio of residential f ixedThis chart shows subscribership ratios by technology and household density . Tracts were grouped into 100 density percentiles based on households per square mile, calculated as the ratio of
aDSL Cable Modem FTTP Satellite Fixed Wireless
Perc
enta
ge o
f Res
iden
tial F
ixed
Hig
h-Sp
eed
Con
nect
ions
0
10
20
30
40
50
60
70
80
90
U.S. Federal Communications Commission Internet Access Services: Status as of June 30, 2012 77
77

Richest
Poorest
Lowest Density
Highest Density
0%
20%
40%
60%
80%
100%
Chart 28Average Subscribership Ratios by Income and Household Density as of June 30, 2012
(Residential fixed connections over 200 kbps in at least one direction by Tract)
Sources: FCC Form 477, Part VI; Geoly tics 2011 Block-Lev el Estimates (Households in 2011); Census 2010 (Tract land area); 2007-2011 ACS 5-y ear Estimates (Median household income).
residential f ixed connections to households across tracts in the decile.estimated tract households in 2011 to tract land area f rom the Census Bureau, and median household income. For each quantile, the height of the bar represents the household-weighted av erage ratio ofThis chart shows subscribership ratios by household density and income quantiles. Tracts were grouped into 400 density /income quantiles based on households per square mile, calculated as the ratio of
U.S. Federal Communications Commission Internet Access Services: Status as of June 30, 2012 78
78

Med
ian
Ratio
of C
onne
ctio
ns to
Hou
seho
lds
0%
10%
20%
30%
40%
50%
60%
70%
80%
90%
100%
Lower Density Tract Density (Households per Square Mile) in Deciles Higher Density
1 2 3 4 5 6 7 8 9 10
Chart 29Median Ratios of Residential Fixed Connections over 200 kbps in at Least One Direction to Households by Income and Density
Tract Data as of June 30, 2012
Sources: FCC Form 477, Part VI; Geoly tics 2011 Block-Lev el Estimates (Households in 2011); and 2007-2011 ACS 5-y ear Estimates (Median household income).
Tract Median Income in Deciles less than $27,617 $27,617 to $34,524 $34,524 to $39,861$39,861 to $44,688 $44,688 to $50,231 $50,231 to $56,012$56,012 to $63,801 $63,801 to $74,600 $74,600 to $92,321more than $92,321
U.S. Federal Communications Commission Internet Access Services: Status as of June 30, 2012 79
79