event 16 12-15 global information security workforce study 1.0
TRANSCRIPT

2015 Global Information Security Workforce Study
Panagiotis Kalantzis (ISC)2 Hellenic Chapter Board Member

Demographics Diverse Respondent
Representation – 13,930 Responders
Diverse Company Representation
North Americ
a Europe
Asia
ROW
Respondents by Region
C-Levels &
Executives
Managers
Auditors
Architects,
Strategists, &
Strategic Advisors
Security Analysts
& All Other
Job Titles
Respondents by Job Titles
1 to 499
500 - 2,499
2,500 - 9,999
10,000 or
more
Number of Employees
Banking, Insurance & Finance
Manufacturing
Telecom & Media
Healthcare
Information
Technology
Personal & Professiona
l Services
Other Private
Enterprise
Gov't Defense
Gov't Non-Defense
Industry Vertical

Top Insights
• Growing complexity – fluid organizational footprint, technology and solution sprawl, the ever complex progression of the threat landscape
• State of security readiness - forced into reacting to rather than preventing threats
• The skills gap - Estimated at 1.5 million professionals within 5 years, and clear signs of hiring constraints affecting organizations today.
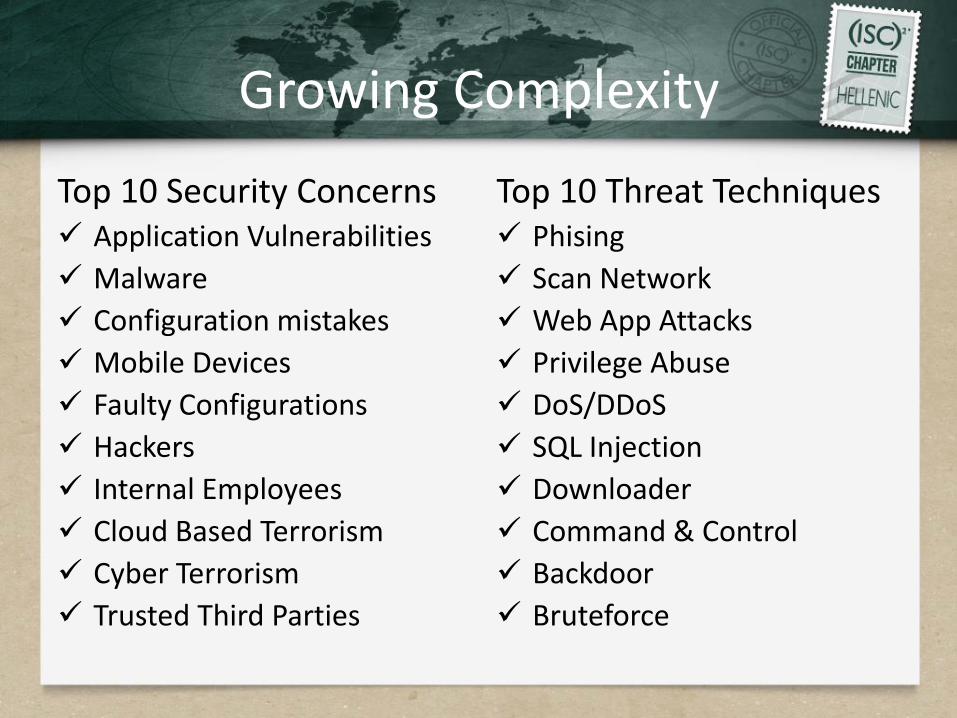
Growing Complexity
Top 10 Security Concerns Application Vulnerabilities
Malware
Configuration mistakes
Mobile Devices
Faulty Configurations
Hackers
Internal Employees
Cloud Based Terrorism
Cyber Terrorism
Trusted Third Parties
Top 10 Threat Techniques Phising
Scan Network
Web App Attacks
Privilege Abuse
DoS/DDoS
SQL Injection
Downloader
Command & Control
Backdoor
Bruteforce

Projected Remediation Time
Projected Remediation Time is Lengthening
Variation Exists Across Verticals
Remediation Time 2011 2013 2015
2015
Banking/Insurance/Finan
ce
Retail/Wholesa
le Utilities
Healthcare
Info Tech
Education
Government
Within one day
(less) 33% 28% 20% 23% 18% 15% 13% 25% 13% 17%
Two to seven days
(more) 43% 41% 44% 42% 33% 40% 50% 45% 50% 47%
Eight to twenty days
(more) 7% 9% 11% 11% 18% 20% 12% 10% 15% 12%
Three to five weeks
(more) 3% 4% 4% 4% 4% 7% 2% 2% 5% 4%
Six weeks or more
(more) 2% 3% 4% 3% 4% 4% 8% 2% 5% 5%
Don’t know 11% 15% 16% 17% 23% 14% 15% 16% 12% 15%

The Reasons Why
Changing Footprint w’ Cloud and Mobility – 100% use could or intend to, reflected across types and platforms
Poor Practice – only 12% ensure the scanning is done before the application is put into production; 89% once a breach is detected
Strain – Security teams are being pushed into reactive mode -Remediation consuming significant time for 85% of security operations personnel
Technology Sprawl – two- thirds expressed concern over the growth and complexity of the technology solutions being deployed into their architecture

Vendors Struggle to keep up
Q50. Please indicate which, if any, of the reasons below explain why your organization has security architecture sprawl? Select all that apply.
Security professionals most commonly cite the quickly evolving nature of threats and the inability of
vendors to keep pace with their existing products as the primary reason for technology sprawl.
No predominate reason; therefore harder to reverse.
Base: Filtered respondents (n=8,849).
6%
16%
17%
17%
22%
24%
32%
We have adopted Infrastructure as a Service (IaaS) andour equipment does not have a cloud-friendly option
Vendors prefer to create standalone products rather thanadd new functionality to existing products
We are following a best-of-breed approach
My organization inherited the situation
There is decentralized purchasing of security technologies
My organization has undertaken mergers and acquisitions
Security threats are evolving faster than vendors canevolve their existing products
Reasons For Sprawl

Workforce Shortage Indicators Churn
No change in employer or employment status
in 2014 81%
Yes, changed employer while still employed
14%
Yes, changed employer due to a layoff or
termination 3%
Yes, became self-employed
2%
Did you change your employer or employment status in 2014? (Percent of Survey Respondents)
Across the 2011, 2013 and 2015 surveys, churn of nearly 20% is the highest that has been seen.

Workforce Shortage Indicators Increasing Compensation
40%
12%
9%
35%
3%
35%
11
%
8%
43%
3%
37%
11
%
7%
45%
1%
41%
10%
5%
42%
1%
42%
9%
10%
36%
2%
Yes, an increase ofup to 5%
Yes, an increase ofbetween 5% and
10%
Yes, an increase ofover 10%
No change in salaryor benefits
Received a salary orbenefit reduction
Salary Change
Worldwide EMEA France Germany United Kingdom

6%
33%
35%
27%
5%
37%
39%
19%
6%
46%
32%
16%
3%
30%
49%
17%
3%
26%
42%
29%
11
%
43%
38%
8%
5%
58%
25%
11
%
Under 30 years of age 30 to 39 years of age 40 to 49 years of age 50 years of age orolder
Worldwide EMEA France Germany United Kingdom South Africa Middle East
An Aging Profession
Q6. How many years have you been actively involved with information or IT security?
Base: All 2015 worldwide respondents (n=13,930).

5%
11
%
25%
28%
22%
9%
5%
12
%
28%
29
%
21%
5%
1%
9%
28%
35%
20%
6%
3%
10%
22%
33%
26%
5%
5%
10%
26%
25%
26%
8%
6%
17%
23%
31%
22%
1%
5%
12%
36%
31%
14%
2%
Three years or less Four to six years Seven to ten years Eleven to fifteenyears
Sixteen to twenty-five years
More than 25 years
Years of Experience
Worldwide EMEA France Germany United Kingdom South Africa Middle East
An Aging Profession
Q6. How many years have you been actively involved with information or IT security?
The largest proportion indicate that they have between 11 and 15 years of experience
Base: All 2015 worldwide respondents (n=13,930).

A Little Context
High levels of job stability and satisfaction – the churn is about people finding better opportunities
Shortage at Entry Level – 64-78% suggest this is where the need is greatest
Some job titles are declining – network security and CISO among them - reabsorbed by IT?

Staffing Plans Insufficient
Increase 52.1%
Stay the same 42.2%
Decrease 3.1%
Don't know 2.5%
Over the next 12 months, do you expect the number of information security professionals in your organization to increase, decrease or
remain the same?
Too many 1.9%
The right number 26.4%
Too few 62.2%
Don't know 9.5%
Would you say that your organization currently has the right number of information
security workers, too few, or too many?
Too was 55.9 % in 2013

Reasons for Workforce Shortage
5%
43%
45%
45%
5%
45%
37%
57%
Other
Leadership in our organization has insufficient understanding ofthe requirement for information security
It is difficult to find the qualified personnel we require
Business conditions can't support additional personnel at thistime
Reasons Why Too Few Information Security Workers (Percent of survey respondents)
2013 2015

Reason for Outsourcing 49%
30%
30%
26%
23%
18%
51%
31%
29
%
32%
19%
16%
57%
40
%
32%
40
%
14%
9%
59%
45%
31%
40%
18%
15%
47%
28%
33%
27%
22%
16%
Lack of in-houseskills
Temporary needfor flex force
capacity
It is lessexpensive
Recruitinglimitations
Alleviating theburden of tedious
tasks
Difficulty inretaining staff
Reasons for Outsourcing
Worldwide EMEA France Germany United Kingdom
Lack of in-house skills most common reason for outsourcing services

Security operations outsourced
Overall, firms in the EMEA are the least likely to outsource risk and compliance management. As a
proportion, the French outsource the most threat intelligence, research, detection, forensics and
remediation.
Base: Filtered respondents (n=7,985)
19
11
19
21
10
21 24
13
28
18
6
14
23
9
20
Security asset management andmonitoring (e.g., firewall, IPS)
Risk and compliance management Threat intelligence, research,detection, forensics, and
remediation
Security Operations Outsourced (Average %)
Worldwide EMEA France Germany United Kingdom

Professional Services Outsourced
Q35a. Please indicate whether you or your organization outsources any of the following professional services
In each case, France and firms in the Middle East are the most likely to outsource professional
services.
Base: Filtered respondents (n=7,985)
26
%
33
%
34
%
30
%
36
%
36
%
37
%
44
%
41
%
29
% 38
%
31
%
29
%
30
%
31
%
Security advisory (securitystrategy, security governance and
compliance, training)
Technical services (security audit,breach management, residency)
Implementation services(integration, security product
installation and migration, securityproduct life cycle
Outsourcing Professional Services
Worldwide EMEA France Germany United Kingdom

Workforce Shortage Effects
Pushing security tasks to IT professionals, a force
multiplier
Security tasks are getting left undone or performed
sub-optimally
Security professional efficiency & Outsourcing
Technology leverage to reduce security professional workload
What you can see
What you can’t see
