evca special paper, central and eastern europe statistics 2010
TRANSCRIPT
Central and Eastern EuropeStatistics 2010
An EVCA Special Paper
Edited by the EVCA Central and Eastern Europe Task Force
July 2011
Our partner: Gide Loyrette Nouel Warsaw Office

EVCA is the voice of European private equity and venture capital.
We promote the interests of our more than 1,200 members, to ensure they can conduct their business effectively.EVCA engages policymakers and promotes the industry among key stakeholders, including institutional investors,entrepreneurs and employee representatives.
EVCA develops professional standards, research reports and holds professional training and networking events.
EVCA covers the whole range of private equity, from early-stage venture capital to the largest buyouts.
EVCA Central and Eastern Europe Task Force
Since 2003, the EVCA Central and Eastern Europe Task Force has undertaken initiatives specifically aimed at the developmentand promotion of private equity and venture capital in the region of Central and Eastern Europe (CEE). Among its accomplishments,the Task Force published Central and Eastern Europe Success Stories in October 2004, and special papers dedicated to annualstatistics for 2005, 2006, 2007, 2008, 2009 and 2010. The Task Force also seeks to develop CEE topics of interest in otherEVCA publications and conferences. Information about the members of the Task Force may be found at www.evca.eu.
PEREP_Analytics
PEREP_Analytics™ is a centralised, non-commercial pan-European private equity database. Currently it is the joint statisticalplatform of EVCA and 19 national and regional private equity and venture capital associations across Europe, of which sevenare from the CEE region: CVCA (Croatia), CVCA (the Czech Republic), EstVCA (Estonia), HVCA (Hungary), LTVCA (Lithuania),PPEA (Poland), SEEPEA (South Eastern Europe) and SLOVCA (Slovakia).
The quantitative and qualitative data collected via PEREP_Analytics serves:
> the needs of all stakeholders for market approach statistics
> the need for accurate, consistent and timely data
> the need for timely ad hoc analyses
> the intrinsic private equity market evolution, which has seen cross-border transactions become the norm,rather than the exception
> the needs of industry practitioners, investors, international organisations, governments and other stakeholders,all of which demand private equity statistics
Figures are updated on a continuous basis and are thus subject to change.
Disclaimer
The information contained in this report has been produced by EVCA, based on PEREP_Analytics data. Although EVCA has takensuitable steps to ensure the reliability of the information presented, it cannot guarantee the accuracy of the information collected.Therefore, EVCA cannot accept responsibility for any decision made or action taken based upon this report or the informationprovided herein.
EVCA
The European Private Equity & Venture Capital Association

EVCA CENTRAL AND EASTERN EUROPE STATISTICS 2010 I 1
Contents
1. Introduction 3
2. Executive summary 4
3. Fundraising 5
4. Investment activity 10
5. Market segments 17
6. Exits 19
7. The CEE venture capital market 24
8. The CEE buyout & growth market 28
9. Methodology 33
10. Definitions 35
11. About Gide Loyrette Nouel Warsaw Office 38
Our partner: Gide Loyrette Nouel Warsaw Office

2 I
About this report
This document provides annual activity statistics for theprivate equity and venture capital markets of Central andEastern Europe in 2010. Similar statistics for 2009, 2008,2007, 2006 and 2005 were published respectively in EVCA’sCentral and Eastern Europe Statistics 2009 (publishedJuly 2010), Central and Eastern Europe Statistics 2008(published July 2009), Central and Eastern EuropeStatistics 2007 (published September 2008), Central andEastern Europe Statistics 2006 (published October 2007)and Central and Eastern Europe Statistics 2005 (publishedNovember 2006). The statistics contained herein are basedsolely on the “market approach” (whereby informationis compiled to show activity in a particular country),rather than the “industry approach” (which shows theactivity of fund managers based in a particular country).EVCA believes this gives a more accurate picture of theoverall investment trends and activities in the markets ofCentral & Eastern Europe (CEE) due to the predominanceof regional funds and fund managers. For the purposes ofthis publication, CEE comprises the countries of Bosniaand Herzegovina, Bulgaria, Croatia, the Czech Republic,Estonia, Hungary, Latvia, Lithuania, Macedonia, Montenegro,Poland, Romania, Serbia, Slovakia, Slovenia and Ukraine.
Amendments of prior years’ statistics
All data reported in this publication is based onPEREP_Analytics, which is continuously updated andtherefore subject to change. Continual updating strives toachieve the highest level of accuracy, however, the resultsdepend on the timely submissions of information fromprivate equity fund managers. As noted in last year’spublication, the year 2007 was a start-up year for thePEREP_Analytics database and it was put to a qualityreview in mid-2009. Due to this review, a number ofmaterial amendments were made in the 2009 CEEStatistics publication to correct historical data presentedin earlier years’ editions of this publication.For more details of what was amended, please referto last year’s publication.
The foregoing methodology has also led to somenon-material corrections of 2009 data presented in thispublication as compared to the previous year’s publication.EVCA always recommends readers to use the most recentpublication when analysing historical data to ensurethe highest accuracy.
Our partner: Gide Loyrette Nouel Warsaw Office
EVCA CENTRAL AND EASTERN EUROPE STATISTICS 2010 I 3
Dear colleague,
Lately, when people talk of ‘Europe’ in the global media,the conference circuit or investor meetings, it tends toconjure images of a mature, low-growth region, consistingof advanced, if sometimes bureaucratic, economiessaddled with a deeply troubled periphery. The realityis far more diverse.
For one, this image ignores the large swathe of young,entrepreneurial economies across Europe’s central andeastern flank, collectively known as ‘Central & EasternEurope’ or ‘CEE’. This region, which proudly stretchesfrom the Baltic Sea round to the Adriatic and Black Seas,is an exciting area of investment opportunity, where the‘convergence’ story continues to be a key driver ofeconomic and social development.
‘CEE’ itself belies a highly heterogeneous collection ofeconomies, where local and regional expertise can providea competitive advantage for investors in the region’s newand established enterprises. With its central location,proximity to export markets, well-educated and productivelabour force and robust internal demand, CEE has becomea preferred destination in the European neighbourhoodfor numerous sectoral investors, from automotive to ITand retail. With the vast majority of CEE countries nowmembers of the EU, the region not only offers high growthpotential, but at the same time the stability and securityof the EU framework.
Thanks to the region’s dynamism, it weathered the recentglobal financial crisis rather well. Its largest economy,Poland, was hailed as a ‘green island’, the only Europeancountry not having fallen into recession, and the latestforecasts for 2011 show a positive outlook for the wholeregion. While the economic performance of these‘emerging’ European markets hasn’t quite matched thatof some hype-filled emerging markets in Asia and LatinAmerica, the region’s resilience through the crisis hashelped shift perceptions of the relative risk betweenmature and developing markets.
The region’s capital markets are still developing andwill benefit from growing investor interest in the regionand more policies that promote inward investment.The successful Warsaw Stock Exchange, backed in part bythe country’s pension schemes, provides a useful sourceof equity in that country, but increasingly, private equityand venture capital are seen as a key source of fuel forentrepreneurial growth. Yet despite this, private equityinvestment is just 0.11% of the region’s GDP (compared to0.77% in Sweden and 0.75% in the UK). This shows thatthe region has significant long-term untapped potentialawaiting those investors willing to recognize CEE as a trulyattractive region of Europe
This special paper on Central and Eastern Europe privateequity and venture capital activity has been prepared toincrease the transparency of the region’s investmentactivity, and help GPs, LPs and advisers encompassthe results of private equity and venture capital acrossthe whole region.
Dörte Höppner Robert ManzEVCA Secretary General Chairman of the
EVCA CEE task force
1. Introduction
Our partner: Gide Loyrette Nouel Warsaw Office

4 I
Fundraising market in the region
> Fundraising for the CEE region reached €645min 2010, 61% above the 2009 level. While this increasecompares favourably with the 13% increase infundraising across Europe as a whole, it should benoted that very few CEE buyout funds went out intothe market in both 2009 and 2010, and that generally,private equity firms active in the CEE region still hadsufficient capital to invest after the preceding yearsof strong fundraising.
> CEE fundraising represented 3% of the total fundsraised in Europe in 2010.
> Government agencies, which increased theircommitments by 170% compared to 2009 (to €376m),remained the leading source of capital for CEE funds,accounting for more than half of total fundraisingsources in 2010.
> 80% of the funds raised for the CEE regionin 2010 originated from Europe.
Investment activity
> Investment in the CEE region slowed down in 2010,with €1.3bn invested, down from more than €2bnin each of the three previous years. The CEE regionlagged behind the trend of Europe as a whole, whichshowed significant growth in investments in 2010,up nearly 80% compared to 2009. However, in 2009the CEE region had maintained investment levelscompared to 2008 while Europe had shown a steepdecline.
> Investments by value in the CEE region represented3% of total private equity investments in Europe,down from 11% in 2009.
> Overall investment values in 2010 represented 0.119%of the CEE region’s GDP, slightly less than in 2009,but only 38% of the level achieved in 2010 in Europeas a whole (0.314% of GDP).
> Despite the lower value of investments, more than160 companies received private equity backing in 2010,an increase of nearly 30% compared to 2009(125 companies).
> Similar to previous years, investment activity in the CEEregion in 2010 was highly concentrated in the largercountries in the region, with six countries (Poland,the Czech Republic, Romania, Ukraine, Bulgaria andHungary) accounting for 94% of the total investmentvalue in 2010 and 68% of the total number ofcompanies financed.
> Poland alone accounted for just over half of the totalamount invested in the region, attracting €657m ofinvestment.
> Consumer goods & retail remained the most investedsector in value in 2010 (€319m), despite a sharp decreasefrom the 2009 level (€865m). The communicationssector remained the most popular in terms of numberof companies financed (26).
> Buyouts’ investment value in the CEE region decreasedby about 65% in 2010 to €660m and the CEE marketwas less buyout-oriented than the total Europeanmarket – buyouts accounted for 51% of CEE investmentvalue, compared with 71% in Europe as a whole.
> Growth capital investments went up by almost 50% to€525m, accounting for 41% of the total CEE investmentvalue, while venture capital investments increasedby 40% to €66m, 5% of the total for CEE.
> Only 36% of the companies financed in the CEE regionwere venture-backed companies, compared to a Europe-wide figure of 60%.
Divestment activity
> CEE divestments at cost of initial investment in 2010(€300m) more than doubled versus 2009 (€132m).This increase compares favourably to a 64% risein Europe overall.
> Trade sale was the most common exit method byamount divested at cost in 2010 (39% of total),while sales to management came first when rankedby number of companies exited (28% of total).
> Write-offs represented a sizeable portion ofdivestments measured by amount divested at cost,at 28% of total divestments, in line with the trend inEurope (22%). However, it should be noted this isthe first time that write-off’s had a material showingin divestments in the CEE region.
2. Executive summary
Our partner: Gide Loyrette Nouel Warsaw Office

EVCA CENTRAL AND EASTERN EUROPE STATISTICS 2010 I 5
In 2010, fundraising for the CEE region1 recoveredsignificantly from the 2009 level, at €645m, a 61%year-on-year increase. In Europe as a whole, fundraisingwent up by only 13%. However, it should be noted that veryfew CEE buyout funds went out into the market in 2009 or2010, and that private equity firms active in the CEE regionstill generally had sufficient capital to invest afterthe preceding years of strong fundraising.
CEE fundraising represented 3% of the total funds raisedin Europe in 2010, similar to 2008, but down from the2009 level of 11%. All fundraising in 2010 was made byindependent funds, with none by captives.
3. Fundraising
4,000
3,500
3,000
2,500
2,000
1,500
1,000
500
0
Figure 1 - Fundraising for CEE private equity, 2003-2010 (in € million)
2003
312
2004
496
2005
1,293
2006
2,254
2007
3,983
2008
2,489
2009
400
2010
645
Source: EVCA/PEREP_Analytics for 2007-2010 data. EVCA/Thomson Reuters/PricewaterhouseCoopers for previous years' data.Disclaimer: Data is continuously updated and therefore subject to change.
1 Fundraising for CEE includes funds raised by advisory teams based in the region and funds raised from teams outside the region that are 100% dedicated to the CEE region.The data does not include those funds that may allocate a portion of their capital to CEE but whose primary focus is elsewhere. As the vast majority of private equity funds raisedfor CEE were for the region as a whole – and not for any specific country – fundraising is presented here as a total pool of capital raised for the region.
Our partner: Gide Loyrette Nouel Warsaw Office

6 I
Table 1 - CEE funds raised, 2009-2010 – incremental closings during the year (in € x 1,000)
2009 2010
Amounts in € thousands Amount % Amount %
Funds raised by fund stage focus
Early-stage
Later-stage venture
Balanced
Total venture
Growth capital
Buyout
Mezzanine
Generalist
Total funds raised
Source: EVCA/PEREP_AnalyticsDisclaimer: Data is continuously updated and therefore subject to change.
12,300 3.1 108,880 16.9
26,000 6.5 8,420 1.3
13,500 3.4 66,030 10.2
51,800 12.9 183,330 28.46,300 1.6 158,390 24.6
197,140 49.2 143,100 22.2
140,000 35.0 130,000 20.2
5,070 1.3 30,000 4.7
400,310 100.0 644,820 100.0
The increase in fundraising in 2010 was mainly drivenby early-stage and growth capital funds. Close to €110mwas raised by early-stage funds, which benefited from thestrong support of government agencies (70% of the totalraised by early-stage funds). Growth capital funds raised€158m, up from only €6m in 2009. In 2010, less buyoutfunds were actively raising new capital than in 2009.
As a result buyout funds raised only €143m, 27% belowthe 2009 level of €197m. Mezzanine fundraising was themost consistent year-on-year, down only 7% to €130m.However, it must be noted that fundraising in the CEEregion remains subject to significant annual swings,depending on when CEE fund managers are in or out ofthe market for new funds. This is particularly true whenanalysing the categories of funds raised.
Our partner: Gide Loyrette Nouel Warsaw Office
EVCA CENTRAL AND EASTERN EUROPE STATISTICS 2010 I 7
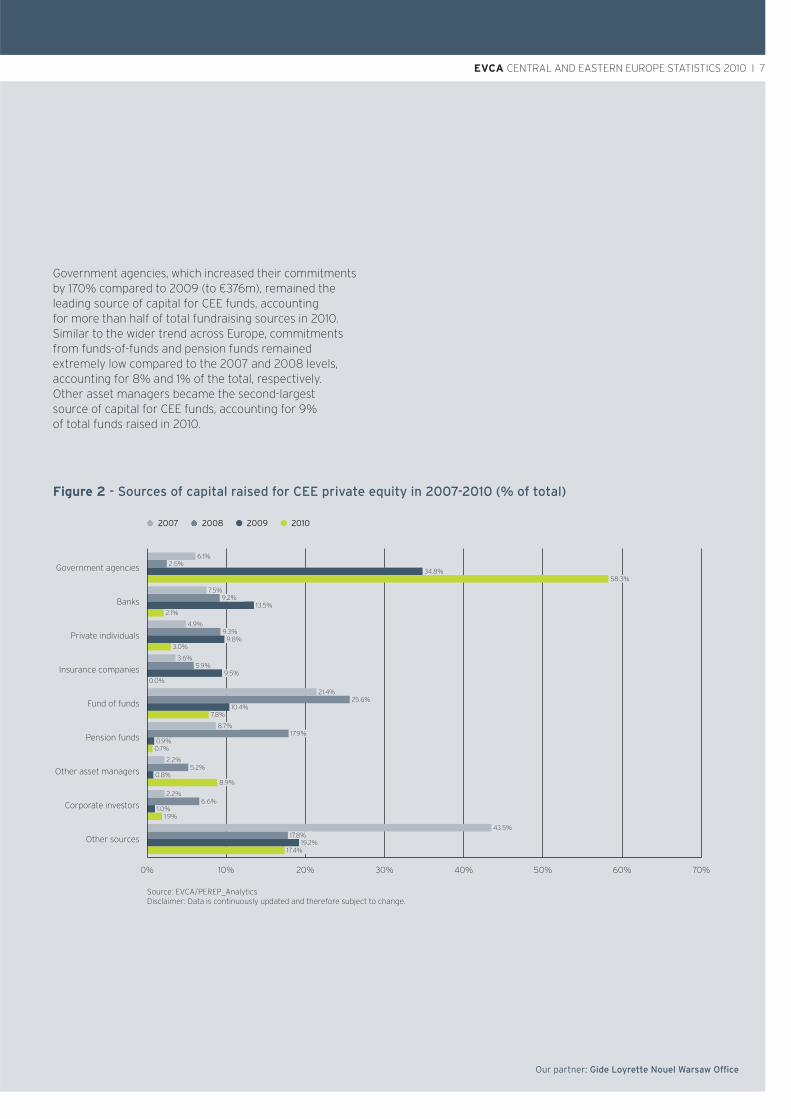
Government agencies, which increased their commitmentsby 170% compared to 2009 (to €376m), remained theleading source of capital for CEE funds, accountingfor more than half of total fundraising sources in 2010.Similar to the wider trend across Europe, commitmentsfrom funds-of-funds and pension funds remainedextremely low compared to the 2007 and 2008 levels,accounting for 8% and 1% of the total, respectively.Other asset managers became the second-largestsource of capital for CEE funds, accounting for 9%of total funds raised in 2010.
Our partner: Gide Loyrette Nouel Warsaw Office
Government agencies
Banks
Private individuals
Insurance companies
Fund of funds
Pension funds
Other asset managers
Corporate investors
Other sources
Figure 2 - Sources of capital raised for CEE private equity in 2007-2010 (% of total)
0% 10% 20% 30% 40% 50% 6 0% 70%
2007 2008 l 2009 l 2010
Source: EVCA/PEREP_AnalyticsDisclaimer: Data is continuously updated and therefore subject to change.
6.1%
7.5%9.2%
13.5%2.1%
4.9%9.3%
9.8%3.0%
3.6%5.9%
9.5%0.0%
21.4%25.6%
10.4%7.8%
8.7%17.9%
0.9%0.7%
2.2%5.2%
0.8%8.9%
2.2%6.6%
1.0%1.9%
43.5%17.8%
19.2%17.4%
34.8%58.3%
2.5%

8 I
Our partner: Gide Loyrette Nouel Warsaw Office
European investors in total (both domestic and non-domestic) continued to grow in importance in 2010,making up nearly 80% of funds raised for CEE privateequity funds. Just over 30% of the funds committed bynon-domestic European Limited Partners (LPs) camefrom the UK. The capital raised from LPs located inthe CEE region increased in absolute terms to €88m,from €71m in 2009. However, the percentage of fundsraised domestically in the CEE region remained far belowthe average in the overall European market (14% of totalin CEE against 46% in Europe). The absolute amountsraised domestically over the past two years is animprovement compared to prior periods and was drivenby a mix of local sources, in particular government agenciesinvesting under local programs to promote venture capital,and private individuals (including entrepreneurs).
However, it remains clear that local CEE institutionalinvestors are still absent and not investing in the privateequity asset class.
Please note that the percentage of funds raised attributedto domestic sources has been revised downward in years2007 and 2008 compared to earlier publications2.
2 This was due to a re-classification of some fund sources to European non-domestic. Please see methodology section for more details.
Figure 3 - Geographic sources of funds raised for CEE private equity, 2007-2010 (% of total)
100%
80%
60%
40%
20%
0%
2007
l Outside Europe
l European (excl. domestic)
l Domestic
l Unknown
38.3%
21.9%
39.1%
2008
51.2%
39.9%
5.9%
2009
50.5%
6.3%
2010
66.2%
17.7%
25.5%
13.6%
16.0%
0.7%
3.1%
4.2%
Source: EVCA/PEREP_AnalyticsDisclaimer: Data is continuously updated and therefore subject to change.
EVCA CENTRAL AND EASTERN EUROPE STATISTICS 2010 I 9
Our partner: Gide Loyrette Nouel Warsaw Office
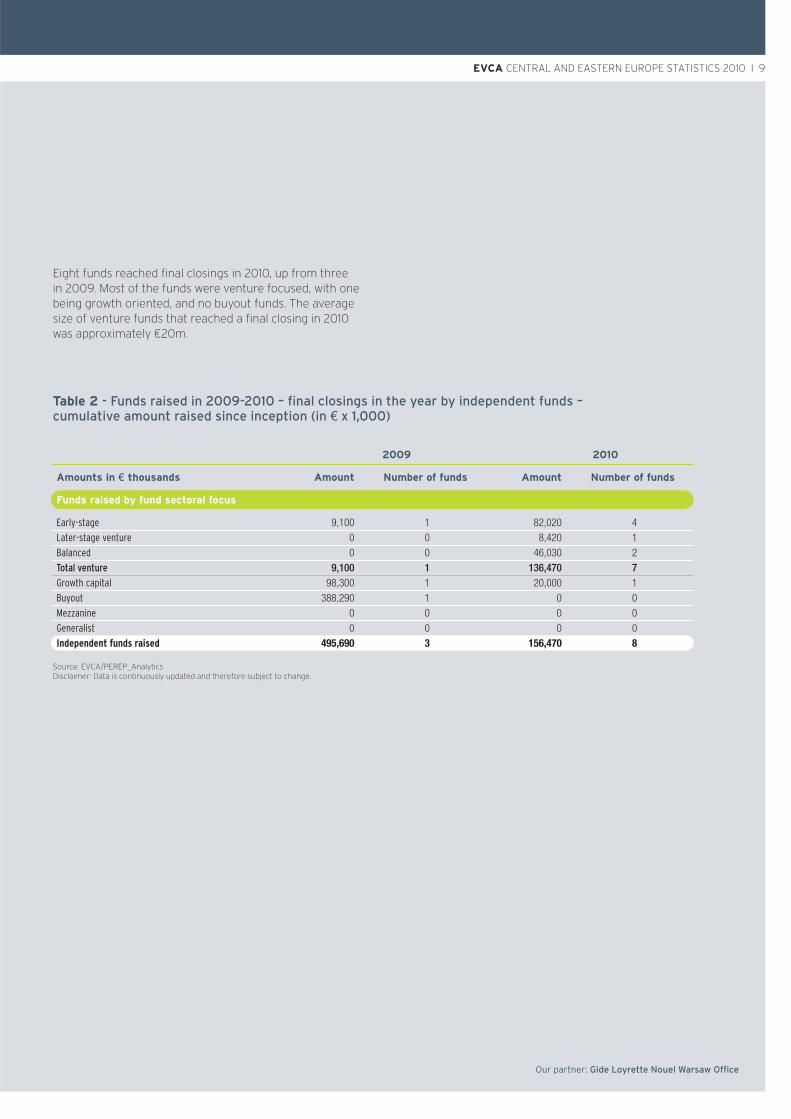
Eight funds reached final closings in 2010, up from threein 2009. Most of the funds were venture focused, with onebeing growth oriented, and no buyout funds. The averagesize of venture funds that reached a final closing in 2010was approximately €20m.
Table 2 - Funds raised in 2009-2010 – final closings in the year by independent funds –cumulative amount raised since inception (in € x 1,000)
2009 2010
Amounts in € thousands Amount Number of funds Amount Number of funds
Funds raised by fund sectoral focus
Early-stage
Later-stage venture
Balanced
Total venture
Growth capital
Buyout
Mezzanine
Generalist
Independent funds raised
Source: EVCA/PEREP_AnalyticsDisclaimer: Data is continuously updated and therefore subject to change.
9,100 1 82,020 4
0 0 8,420 1
0 0 46,030 2
9,100 1 136,470 798,300 1 20,000 1
388,290 1 0 0
0 0 0 0
0 0 0 0
495,690 3 156,470 8

10 I
Private equity investment in the CEE region in 2010decreased significantly in value, with €1.3bn invested in theregion, down by nearly 50% from more than €2bn in eachof the three previous years. It is interesting to comparethis to Europe overall, where investment activity increasedby some 80% in 2010. Over the past two years, one mayobserve a lag in investment trends in the CEE regioncompared to Europe. In 2009, the level of CEE investmentwas relatively stable despite Europe having declined bynearly 60%.
Altogether, investment activity in the CEE regionrepresented 3% of the total investment value in Europein 2010, down from 11% in 2009.
Despite the decrease in value of investments,the number of deals completed rose significantly.More than 160 companies received private equity backingin 2010, an increase of about 30% compared to 2009when 125 companies were private equity financed.
4. Investment activity
2,500
2,000
1,500
1,000
500
0
Figure 4 - Annual investment value in the CEE region 2003-2010 (in € million)
2003
448
2004
546
2005
508
2006
1,667
2007
2,344
2008
2,480
2009
2,447
2010
1,292
Source: EVCA/PEREP_Analytics for 2007-2010 data. Thomson-Reuters/PriceWaterhouseCooper for previous’ years data.
Our partner: Gide Loyrette Nouel Warsaw Office
EVCA CENTRAL AND EASTERN EUROPE STATISTICS 2010 I 11
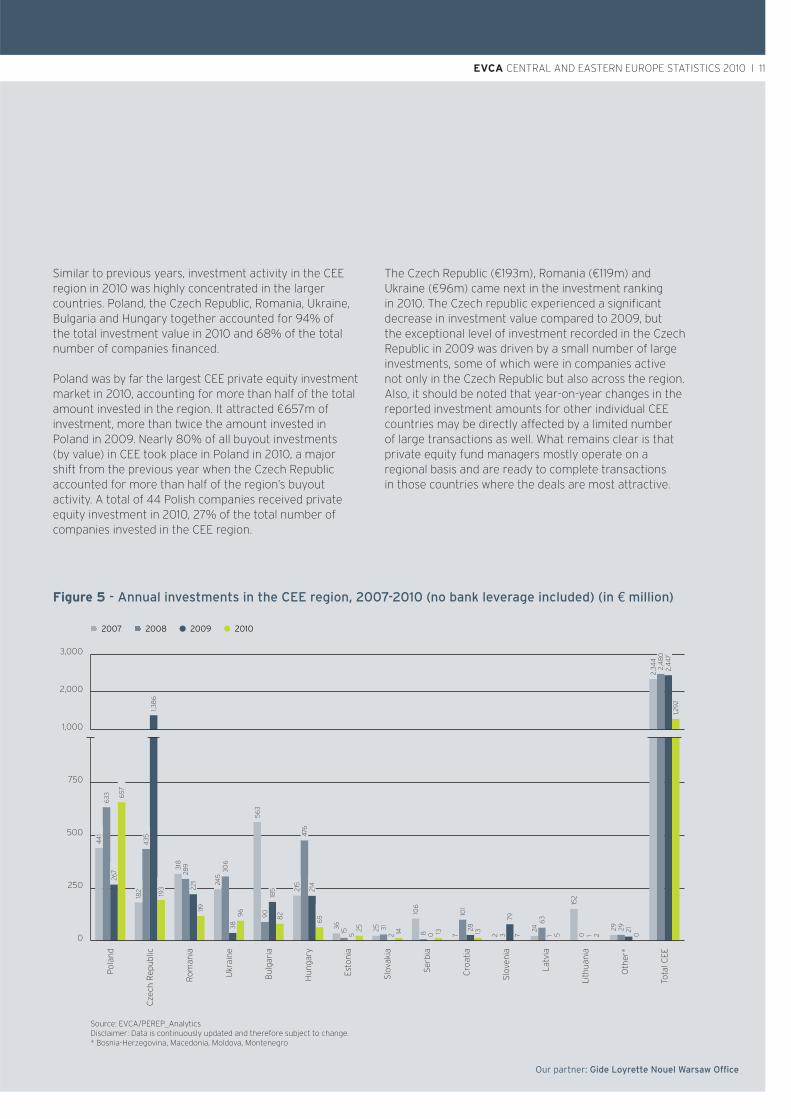
Similar to previous years, investment activity in the CEEregion in 2010 was highly concentrated in the largercountries. Poland, the Czech Republic, Romania, Ukraine,Bulgaria and Hungary together accounted for 94% ofthe total investment value in 2010 and 68% of the totalnumber of companies financed.
Poland was by far the largest CEE private equity investmentmarket in 2010, accounting for more than half of the totalamount invested in the region. It attracted €657m ofinvestment, more than twice the amount invested inPoland in 2009. Nearly 80% of all buyout investments(by value) in CEE took place in Poland in 2010, a majorshift from the previous year when the Czech Republicaccounted for more than half of the region’s buyoutactivity. A total of 44 Polish companies received privateequity investment in 2010, 27% of the total number ofcompanies invested in the CEE region.
The Czech Republic (€193m), Romania (€119m) andUkraine (€96m) came next in the investment rankingin 2010. The Czech republic experienced a significantdecrease in investment value compared to 2009, butthe exceptional level of investment recorded in the CzechRepublic in 2009 was driven by a small number of largeinvestments, some of which were in companies activenot only in the Czech Republic but also across the region.Also, it should be noted that year-on-year changes in thereported investment amounts for other individual CEEcountries may be directly affected by a limited numberof large transactions as well. What remains clear is thatprivate equity fund managers mostly operate on aregional basis and are ready to complete transactionsin those countries where the deals are most attractive.
Our partner: Gide Loyrette Nouel Warsaw Office
3,000
2,000
1,000
750
500
250
0
Figure 5 - Annual investments in the CEE region, 2007-2010 (no bank leverage included) (in € million)
Source: EVCA/PEREP_AnalyticsDisclaimer: Data is continuously updated and therefore subject to change.* Bosnia-Herzegovina, Macedonia, Moldova, Montenegro
2007 2008 l 2009 l 2010
Pola
nd
Cze
ch R
epub
lic
Rom
ania
Ukr
aine
Bulg
aria
Hun
gary
Esto
nia
Slov
akia
Serb
ia
Cro
atia
Slov
enia
Latv
ia
Lith
uani
a
Oth
er*
Tota
l CEE
441
633
267
657
182
435
193
318
289
221
119
245
306
3896
563
90
185
82
215
476
214
65
3615 525 25 31
2 14
106
8 0 13 13710
128
2 379
7
246
31 5
152
10 2 0
29 29 21
2,34
42,
480
2,44
71,2
921,38
6

12 I
300
200
100
75
50
25
0
Figure 6 - Annual investments in the CEE region, 2007-2010 (number of companies)
Source: EVCA/PEREP_AnalyticsDisclaimer: Data is continuously updated and therefore subject to change.* Bosnia-Herzegovina, Macedonia, Moldova, Montenegro
2007 2008 l 2009 l 2010
Pola
nd
Esto
nia
Hun
gary
Rom
ania
Cze
ch R
epub
lic
Ukr
aine
Bulg
aria
Latv
ia
Lith
uani
a
Cro
atia
Serb
ia
Slov
enia
Oth
er*
Tota
l CEE
5571
2544
3 31
19
9 10 1018 19
14 1117
2233
2417
20 1922
15
815
4 45
7
20 0 0
3 4 3 3 2
53 2
42 2
69
2
9 8712
8 9 813
177
207
125
161
Slovakia, which historically saw very few deals completedon a yearly basis, recorded 19 company transactions in2010, and was the second most active market in the CEEregion in this respect. Most of the Slovak companiesfinanced received venture financing (11 companies).Estonia saw a similar level of activity, with 18 transactionsclosed, of which 12 took place in the venture segment.Nevertheless, the CEE market remained largely buyout& growth oriented, with more than 100 companiesfinanced in the buyout & growth segments.
Slov
akia
Our partner: Gide Loyrette Nouel Warsaw Office
EVCA CENTRAL AND EASTERN EUROPE STATISTICS 2010 I 13
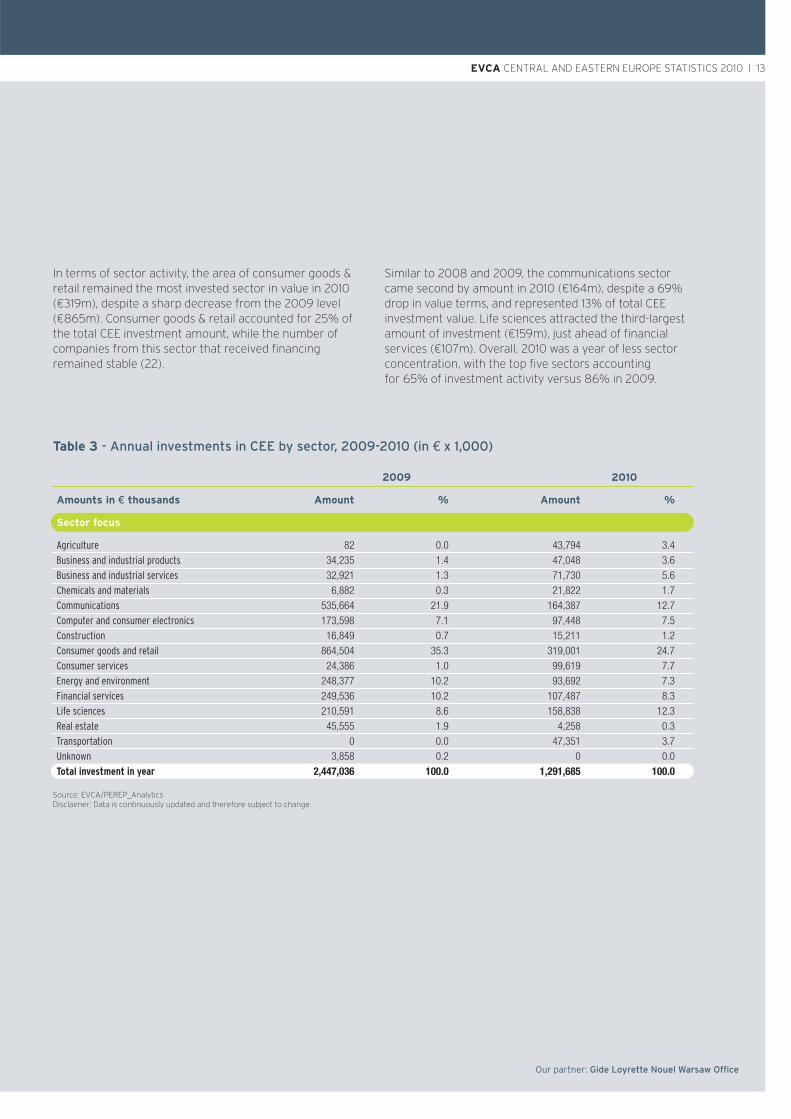
In terms of sector activity, the area of consumer goods &retail remained the most invested sector in value in 2010(€319m), despite a sharp decrease from the 2009 level(€865m). Consumer goods & retail accounted for 25% ofthe total CEE investment amount, while the number ofcompanies from this sector that received financingremained stable (22).
Similar to 2008 and 2009, the communications sectorcame second by amount in 2010 (€164m), despite a 69%drop in value terms, and represented 13% of total CEEinvestment value. Life sciences attracted the third-largestamount of investment (€159m), just ahead of financialservices (€107m). Overall, 2010 was a year of less sectorconcentration, with the top five sectors accountingfor 65% of investment activity versus 86% in 2009.
Table 3 - Annual investments in CEE by sector, 2009-2010 (in € x 1,000)
2009 2010
Amounts in € thousands Amount % Amount %
Sector focus
Agriculture
Business and industrial products
Business and industrial services
Chemicals and materials
Communications
Computer and consumer electronics
Construction
Consumer goods and retail
Consumer services
Energy and environment
Financial services
Life sciences
Real estate
Transportation
Unknown
Total investment in year
Source: EVCA/PEREP_AnalyticsDisclaimer: Data is continuously updated and therefore subject to change.
82 0.0 43,794 3.4
34,235 1.4 47,048 3.6
32,921 1.3 71,730 5.6
6,882 0.3 21,822 1.7
535,664 21.9 164,387 12.7
173,598 7.1 97,448 7.5
16,849 0.7 15,211 1.2
864,504 35.3 319,001 24.7
24,386 1.0 99,619 7.7
248,377 10.2 93,692 7.3
249,536 10.2 107,487 8.3
210,591 8.6 158,838 12.3
45,555 1.9 4,258 0.3
0 0.0 47,351 3.7
3,858 0.2 0 0.0
2,447,036 100.0 1,291,685 100.0
Our partner: Gide Loyrette Nouel Warsaw Office

14 I
Table 4 - Annual investments in CEE by sector, 2009-2010 (in number of companies)
2009 2010
Number of Number of
companies % companies %
Sector focus
Agriculture
Business and industrial products
Business and industrial services
Chemicals and materials
Communications
Computer and consumer electronics
Construction
Consumer goods and retail
Consumer services
Energy and environment
Financial services
Life sciences
Real estate
Transportation
Unknown
Total investment in year
Source: EVCA/PEREP_AnalyticsDisclaimer: Data is continuously updated and therefore subject to change.
1 0.8 5 3.1
8 6.4 9 5.6
6 4.8 11 6.8
3 2.4 4 2.5
36 28.8 26 16.1
12 9.6 16 9.9
3 2.4 8 5.0
21 16.8 22 13.7
5 4.0 10 6.2
9 7.2 9 5.6
7 5.6 15 9.3
9 7.2 16 9.9
3 2.4 2 1.2
0 0.0 8 5.0
2 1.6 0 0.0
125 100.0 161 100.0
Our partner: Gide Loyrette Nouel Warsaw Office
In terms of number of companies financed, communicationsremained at the top of the list, with 26 companies,accounting for 16% of the total. Consumer goods & retailwas the second-most-targeted sector, with 22 companiesfinanced (14% of the total).

EVCA CENTRAL AND EASTERN EUROPE STATISTICS 2010 I 15
Table 5 - Private equity investment by amount (in € x 1,000) and as a percentage of GDP in CEE, 2009-2010
Total investment Investment as % of GDP
2009 2010 2009 2010
Bosnia-Herzegovina
Bulgaria
Croatia
Czech Republic
Estonia
Hungary
Latvia
Lithuania
Macedonia
Moldova
Montenegro
Poland
Romania
Serbia
Slovakia
Slovenia
Ukraine
Total CEE
Total Europe
Source: EVCA/PEREP_Analytics for investment data and Thomson Reuters for GDP data.Disclaimer: Data is continuously updated and therefore subject to change.
6,267 0 0.052% 0.000%
185,165 82,238 0.530% 0.228%
28,154 12,500 0.061% 0.027%
1,385,776 193,211 1.010% 0.133%
4,507 25,461 0.033% 0.176%
213,637 65,046 0.223% 0.068%
997 5,280 0.005% 0.029%
1,183 1,604 0.004% 0.006%
14,388 0 0.217% 0.000%
0 0 0.000% 0.000%
0 0 0.000% 0.000%
266,994 656,754 0.089% 0.192%
220,881 119,138 0.187% 0.101%
0 13,208 0.000% 0.104%
1,739 14,473 0.003% 0.022%
79,130 6,945 0.224% 0.019%
38,219 95,827 0.045% 0.085%
2,447,036 1,291,685 0.241% 0.119%23,245,901 41,231,931 0.186% 0.314%
In 2010, the ratio of private equity investment value toGDP in the CEE region was 0.119%, only 38% of theEurope-wide average of 0.314%. In 2009, the CEE figurehad been exceptionally 30% above the European average.As noted in last year’s publication, in 2009 the ratio wasgreatly affected by exceptional investment levels in theCzech Republic coupled with the sharp decrease in thevalue of private equity investments in the main Europeanmarkets as a result of the financial and economic crisis.
The lower comparative investment to GDP level seenin the CEE region in 2010 is more representative of thehistorical trend and indicates the continuing potential inthe CEE region for further private equity development.
Our partner: Gide Loyrette Nouel Warsaw Office

16 I
Our partner: Gide Loyrette Nouel Warsaw Office
Figure 7 - Private equity investments as a percentage of GDP for Europe, CEE and selectedEuropean countries, 2010
1.0%
0.9%
0.8%
0.7%
0.6%
0.5%
0.4%
0.3%
0.2%
0.1%
0.0%
Sw
eden
Un
ited
Kin
gd
om
No
rway
Irel
and
Fran
ce
Net
her
lan
ds
Fin
lan
d
Sw
itze
rlan
d
Eu
rop
e
Spa
in
Bel
giu
m
Au
stri
a
Bu
lgar
ia
Lu
xem
bo
urg
Po
lan
d
Ger
man
y
Est
on
ia
Den
mar
k
Cze
ch R
epu
blic
CE
E
Po
rtu
gal
Ser
bia
Ital
y
Ro
man
ia
Ukr
ain
e
Hu
ng
ary
Lat
via
Cro
atia
Slo
vaki
a
Slo
ven
ia
Gre
ece
Lit
hu
ania
0.7
75%
0.7
50%
0.6
14%
0.5
00
%
0.3
35%
0.3
33%
0.3
25%
0.3
17%
0.3
14%
0.2
75%
0.2
66%
0.2
46%
0.2
28%
0.2
22%
0.19
2%
0.18
6%
0.17
6%
0.16
5%
0.13
3%
0.11
9%
0.10
9%
0.10
4%
0.10
2%
0.10
1%
0.0
85%
0.0
68
%
0.0
29%
0.0
27%
0.0
22%
0.0
19%
0.0
15%
0.0
06%
Source: EVCA/PEREP_Analytics for investment data and Thomson Reuters for GDP data.Disclaimer: Data is continuously updated and therefore subject to change.

EVCA CENTRAL AND EASTERN EUROPE STATISTICS 2010 I 17
Our partner: Gide Loyrette Nouel Warsaw Office
Table 6 - Type of investment in CEE and Europe, 2010 (no bank leverage included) (in € x 1,000)
Amounts in € thousands Total CEE % of total Total Europe % of total
Stage focus
Seed
Start-up
Later-stage venture
Total venture
Growth
Rescue/Turnaround
Replacement capital
Buyout
Total 2010
Total 2009
Source: EVCA/PEREP_AnalyticsDisclaimer: Data is continuously updated and therefore subject to change.
3,381 0.3 111,308 0.3
27,411 2.1 1,730,420 4.2
34,709 2.7 1,671,937 4.1
65,501 5.1 3,513,664 8.5524,730 40.6 6,366,528 15.4
4,573 0.4 490,711 1.2
37,161 2.9 1,734,743 4.2
659,720 51.1 29,126,285 70.6
1,291,685 100.0 41,231,931 100.02,447,036 23,245,901
Table 7 - Type of investment in CEE, 2009-2010 (in € x 1,000)
2009 2010
Number of Number of
Amounts in € thousands Amount companies Amount companies
Stage focus
Seed
Start-up
Later-stage venture
Total venture
Growth
Rescue/Turnaround
Replacement capital
Buyout
Total
Source: EVCA/PEREP_AnalyticsDisclaimer: Data is continuously updated and therefore subject to change.
461 3 3,381 12
10,537 19 27,411 33
35,935 15 34,709 13
46,933 36 65,501 58354,955 45 524,730 62
6,800 3 4,573 2
170,745 5 37,161 6
1,867,604 40 659,720 35
2,447,036 125 1,291,685 161
In 2010, the total amount invested in buyouts in the CEEregion decreased by 65% compared to 2009, to €660m,with the buyouts’ share of overall CEE investmentdropping from 76% in 2009 to 51% in 2010. At the sametime, the amount invested in growth capital went up byalmost 50% year-on-year to €525m in 2010, accountingnow for 41% of the total CEE investment value.Venture capital investment increased in the same periodby 40% to €66m, accounting for 5% of the total privateequity investment in CEE in 2010.
With only 51% of CEE investment directed into buyouts,the CEE market was less buyout-oriented than Europe asa whole, which saw 71% of investment devoted to buyouts.Venture capital investment in CEE (at 5%) remained ata much lower level than in Europe as a whole (9%).Only 36% of the companies financed in the CEE regionwere venture-backed companies, compared to a Europe-wide figure of 60%. This once again confirms thecontinuing existence of a more pronounced “equity gap”in the CEE region than in Europe as a whole, althoughthe recent increased fundraising aimed at the venturesegment is expected to start addressing this gap.
4. Market segments
18 ITa
ble
8 -
Ty
pe
of
inve
stm
en
t by
CE
E c
ou
ntr
y, 2
010
(n
o b
ank
leve
rag
e in
clu
de
d)
(in
€x
1,0
00
)
20
10
Am
ou
nts
in
€th
ou
san
ds
Bu
lgar
iaC
roat
iaC
zech
Rep
.E
ston
iaH
un
gary
Lat
via
Lit
hu
ania
Pol
and
Rom
ania
Ser
bia
Slo
vaki
aS
love
nia
Ukr
ain
eO
ther
*
Sta
ge
focu
s
Seed
Star
t-up
Late
r-st
age
vent
ure
Tota
l ven
ture
Grow
th
Resc
ue/T
urna
roun
d
Repl
acem
ent c
apita
l
Buyo
ut
Tota
l
20
09
Am
ou
nts
in
€th
ou
san
ds
Bu
lgar
iaC
roat
iaC
zech
Rep
.E
ston
iaH
un
gary
Lat
via
Lit
hu
ania
Pol
and
Rom
ania
Ser
bia
Slo
vaki
aS
love
nia
Ukr
ain
eO
ther
*
Sta
ge
focu
s
Seed
Star
t-up
Late
r-st
age
vent
ure
Tota
l ven
ture
Grow
th
Resc
ue/T
urna
roun
d
Repl
acem
ent c
apita
l
Buyo
ut
Tota
l
Sour
ce: E
VC
A/P
EREP
_Ana
lytic
sD
iscl
aim
er: D
ata
is c
ontin
uous
ly u
pdat
ed a
nd th
eref
ore
subj
ect t
o ch
ange
.*O
ther
incl
udes
: Bos
nia-
Her
zego
vina
, Mac
edon
ia, M
oldo
va a
nd M
onte
negr
o.
00
078
685
30
00
00
1,74
20
00
1,32
830
013
,139
3,37
55,
761
206
104
1,29
31,
904
00
00
0
00
9,91
073
211
,286
00
1,27
210
,050
033
01,
129
00
1,328
300
23,048
4,893
17,900
206
104
2,565
11,954
02,072
1,129
00
80,9
100
145,
017
11,9
316,
897
5,07
40
114,
454
45,1
8413
,208
9,34
60
92,7
110
00
00
00
1,50
03,
073
00
00
00
00
03,
200
00
016
,145
12,0
000
05,
816
00
012
,200
25,1
465,
438
40,2
490
052
0,51
750
,000
03,
055
03,
116
0
82,2
3812
,500
193,
211
25,4
6165
,046
5,28
01,
604
656,
754
119,
138
13,2
0814
,473
6,94
595
,827
0
00
045
10
00
010
00
00
0
1,60
00
02,
292
1,25
50
145
04,
170
00
900
175
0
2,43
70
29,9
870
362
00
634
00
1,73
977
60
0
4,037
029,987
2,743
1,617
0145
634
4,180
01,739
1,676
175
058
214
,417
192,
027
1,76
495
619
71,
038
61,5
5967
,888
00
1,00
07,
260
6,26
7
00
400
00
300
06,
100
00
00
00
00
139,
965
08,
640
00
9922
,041
00
00
0
180,
546
13,7
361,
023,
397
020
2,42
450
00
198,
602
126,
772
00
76,4
5430
,784
14,3
88
185,
165
28,1
541,
385,
776
4,50
721
3,63
799
71,
183
266,
994
220,
881
01,
739
79,1
3038
,219
20,6
55
Our partner: Gide Loyrette Nouel Warsaw Office

EVCA CENTRAL AND EASTERN EUROPE STATISTICS 2010 I 19
The level of CEE divestments at cost of initial investment in2010 was €300m, more than double the amount in 2009(€132m), showing improvement after a continuousdecrease in 2008 and 2009 from the 2007 peak (€453m).The 127% increase in CEE in 2010 compares favourably toa 64% rise in Europe overall. Altogether, CEE divestmentsat cost accounted for 1.6% of the total exit value in Europe.
6. Exits
500
400
300
200
100
0
Figure 8 - Annual divestment value in the CEE region 2003-2010 (exit value at investment cost)(in € million)
2003
236
2004
123
2005
422
2006
442
2007
453
2008
239
2009
132
2010
300
Source: EVCA/PEREP_Analytics for 2007-2010 data. EVCA/Thomson Reuters/PricewaterhouseCoopers for previous years' data.Disclaimer: Data is continuously updated and therefore subject to change.
Our partner: Gide Loyrette Nouel Warsaw Office
20 I
500
400
300
200
150
100
50
0
Figure 9 - Divestment by CEE country (exit value at investment cost), 2007-2010 (in € million)
Source: EVCA/PEREP_AnalyticsDisclaimer: Data is continuously updated and therefore subject to change.* Bosnia-Herzegovina, Macedonia, Serbia, Slovenia
2007 2008 l 2009 l 2010
7 59
88
148
6931
79
4 552
74
3352
1223
9000 00 0
614
199
766 8
32
6 5 723
1 2 1 0 00 300
4
0
45 4
17
1 1 1
453
239
132
300
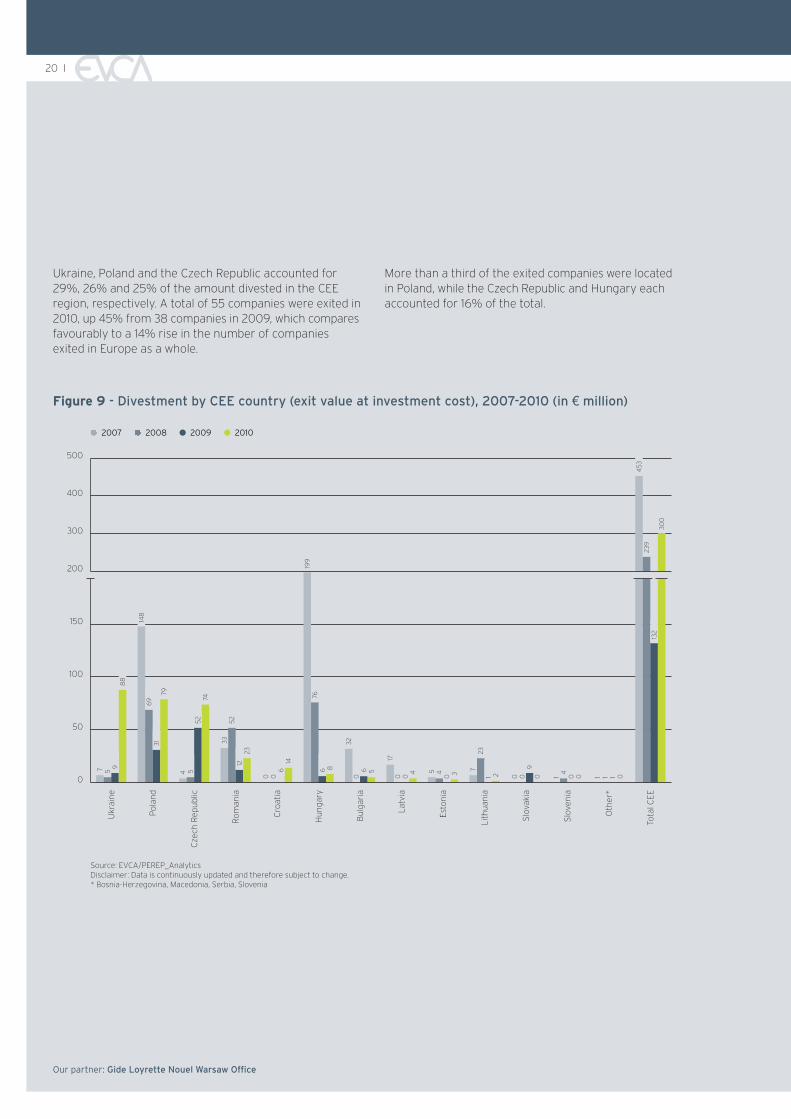
Ukraine, Poland and the Czech Republic accounted for29%, 26% and 25% of the amount divested in the CEEregion, respectively. A total of 55 companies were exited in2010, up 45% from 38 companies in 2009, which comparesfavourably to a 14% rise in the number of companiesexited in Europe as a whole.
More than a third of the exited companies were locatedin Poland, while the Czech Republic and Hungary eachaccounted for 16% of the total.
Our partner: Gide Loyrette Nouel Warsaw Office
Bulg
aria
Lith
uani
a
Slov
enia
Latv
ia
Esto
nia
Oth
er*
Tota
l CEE
Ukr
aine
Pola
nd
Cze
ch R
epub
lic
Rom
ania
Slov
akia
Cro
atia
Hun
gary

EVCA CENTRAL AND EASTERN EUROPE STATISTICS 2010 I 21
Table 9 - Exits in CEE vs total Europe, 2010 (exit value at investment cost) (in € x 1,000)
Amounts in € thousands Total CEE % of total Total Europe % of total
Exit route
Divestment by trade sale
Divestment by public offering
Divestment on flotation (IPO)
Sale of quoted equity
Divestment by write-off
Repayment of silent partnerships
Repayment of principal loans
Sale to another private equity house
Sale to financial institution
Sale to management (MBO)
Divestment by other means
Total 2010
Total 2009
Source: EVCA/PEREP_AnalyticsDisclaimer: Data is continuously updated and therefore subject to change.
115,496 38.6 4,253,987 22.4
1,493 0.5 1,985,461 10.4
0 0.0 998,639 5.21,493 0.5 986,821 5.2
82,721 27.6 4,084,283 21.5
0 0.0 111,514 0.6
1,582 0.5 601,576 3.2
65,039 21.7 6,268,975 32.9
181 0.1 451,562 2.4
30,096 10.0 832,796 4.4
2,923 1.0 438,466 2.3
299,531 100.0 19,028,618 100.0131,919 11,626,930
Trade sale was the most common exit method by amountdivested at cost in the CEE region in 2010 (39% of total),while sales to other private equity firms (the main exitroute in overall Europe) accounted for 22% of the total,in line with the average of the previous three years.Divestment by public offering, typically an area where CEEis relatively strong compared to Europe, was near zeropercent of exit value in CEE in 2010 whereas in Europeoverall it grew significantly to 10% of exit value.
The CEE region historically showed very little in the wayof write-offs and had been spared from any significantwrite-offs since the start of the recent financial crisis(only 1% of divestment value in 2009).
However, in 2010 the region recorded eight write-offs,accounting for 28% of total exit value at investment cost.This was comparable to the average for Europe as a wholeover the past two years, which recorded 22% of exits (atinvestment cost) as write-offs in 2010 and 36% in 2009.
Measuring the relative importance of exit methods bynumber of companies exited (i.e. not by amount) in 2010in CEE, sales to management came first with 28% ofthe total, followed by trade sales with 22% and salesto another private equity house with 21%.
Our partner: Gide Loyrette Nouel Warsaw Office

22 I
Our partner: Gide Loyrette Nouel Warsaw Office
Table 10 - Exits in CEE, 2009-2010 (exit value at investment cost) (in € x 1,000)
2009 2010
Number of Number of
Amounts in € thousands Amount companies Amount companies
Exit route
Divestment by trade sale
Divestment by public offering
Divestment on flotation (IPO)
Sale of quoted equity
Divestment by write-off
Repayment of silent partnerships
Repayment of principal loans
Sale to another private equity house
Sale to financial institution
Sale to management (MBO)
Divestment by other means
Total 2010
Source: EVCA/PEREP_AnalyticsDisclaimer: Data is continuously updated and therefore subject to change.
16,326 9 115,496 13
17,541 5 1,493 3
3,267 1 0 014,274 4 1,493 34,261 3 82,721 8
0 0 0 0
8,615 4 1,582 3
21,456 4 65,039 12
53,043 5 181 2
7,692 6 30,096 16
2,986 6 2,923 1
131,919 38 299,531 55
EVCA CENTRAL AND EASTERN EUROPE STATISTICS 2010 I 23
Our partner: Gide Loyrette Nouel Warsaw Office
Table 11 - CEE Divestments by sector, 2009-2010 (exit value at investment cost) (in € x 1,000)
2009 2010
Number of Number of
Amounts in € thousands Amount companies Amount companies
Sector focus
Agriculture
Business and industrial products
Business and industrial services
Chemicals and materials
Communications
Computer and consumer electronics
Construction
Consumer goods and retail
Consumer services
Energy and environment
Financial services
Life sciences
Real estate
Transportation
Unknown
Total divestment in year
Source: EVCA/PEREP_AnalyticsDisclaimer: Data is continuously updated and therefore subject to change.
0 0 0 0
19,941 4 39,237 8
11,049 2 1,519 2
4,359 2 14,000 1
17,633 7 33,183 15
25,408 5 1,974 2
0 0 2,110 2
44,368 8 50,561 7
1,683 3 4,722 5
152 1 73,200 4
4,896 2 62,754 6
448 1 15,952 2
1,981 3 0 0
0 0 317 1
0 0 0 0
131,919 38 299,531 55
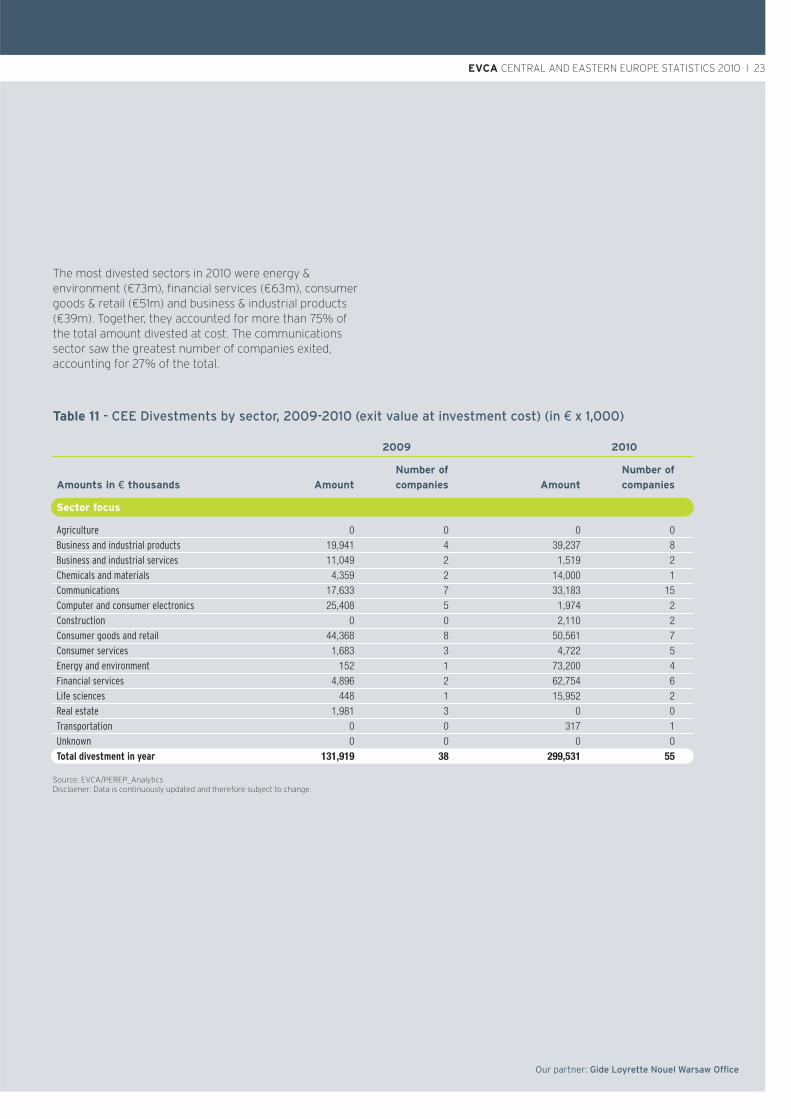
The most divested sectors in 2010 were energy &environment (€73m), financial services (€63m), consumergoods & retail (€51m) and business & industrial products(€39m). Together, they accounted for more than 75% ofthe total amount divested at cost. The communicationssector saw the greatest number of companies exited,accounting for 27% of the total.

24 I
With €66m invested in 58 companies in 2010, the CEEventure capital market accounted for only 2% of totalEuropean venture investments by amount and number ofcompanies. Compared to 2009, the value invested in CEEventure went up by 40%, triggered by a sharp increase instart-up venture investments. The number of companiesfinanced in 2010 went up by more than 57%, driven by a74% increase in the number of start-up companies anda four-fold increase in the number of seed companiesfinanced.
Early-stage (seed and start-up) companies accounted foralmost 80% of the total venture companies financed in2010 in the CEE region, compared to 67% in Europe as awhole. However, the region was much more seed orientedthan Europe overall, with 20% of the venture-backedcompanies receiving seed financing, compared with only12% in overall Europe. By amount invested, the CEE venturemarket was slightly more oriented towards later-stageinvestment than the overall European venture market.Later-stage investments accounted for 53% of totalventure investment in CEE compared with 48% inthe overall European market.
7. The CEE venture capital market
Figure 10 - CEE venture capital investmentsby stage, 2007-2010 (amount in € million)
150
125
100
75
50
25
0
2007
l Seed
l Start-up
l Later stage venture
22
69
2008 2009 2010
3
27
96
4
11
36
28
35
3
Source: EVCA/PEREP_AnalyticsDisclaimer: Data is continuously updated and therefore subject to change.
Total: €94m Total: €126m Total: €47m Total: €66m
The Czech Republic again topped the list of CEE countriesfor most venture investment, and alone accounted for35% of venture investment value in the CEE region in2010. Hungary came second, with 27% of the total,followed by Romania with 18%. In terms of the numberof companies financed, Estonia topped the list, with12 companies, followed by Hungary and Slovakia(11 companies each).
With €17m (invested across 3 companies), financialservices was the most funded in the venture segment in2010, followed closely by communications (€16m across14 companies) and energy & environment (€13m across3 companies).
Figure 11 - CEE venture capital investmentsby stage, 2007-2010 (number of companies)
120
100
80
60
40
20
0
2007
l Seed
l Start-up
l Later stage venture
33
7
12
12
42
2008 2009 2010
48
49
3
19
15
33
13
Source: EVCA/PEREP_AnalyticsDisclaimer: Data is continuously updated and therefore subject to change.
Total: 82 Total: 109 Total: 37 Total: 58
Our partner: Gide Loyrette Nouel Warsaw Office

EVCA CENTRAL AND EASTERN EUROPE STATISTICS 2010 I 25
Our partner: Gide Loyrette Nouel Warsaw Office
Agriculture
Business and industrial products
Business and industrial services
Chemicals and materials
Communications
Computer and consumer electronics
Construction
Consumer goods and retail
Consumer services: other
Energy and environment
Financial services
Life sciences
Real estate
Transportation
Unknown
Figure 12 - CEE venture capital investments by sector, 2007-2010 (amount in € million)
0 5 10 15 20 25 30 35 40
2007 2008 l 2009 l 2010
Source: EVCA/PEREP_AnalyticsDisclaimer: Data is continuously updated and therefore subject to change.
0,91,3
00
12,49,5
0,50,2
4,24,5
01,3
0,21,3
00
14,228,7
38,915,6
5,532,3
4,17,0
2,05,1
0,40,3
3,26,3
0,50,2
4,24,9
0,11,0
25,37,3
0,713,2
13,212,5
017,0
7,79,6
0,85,6
0,30,1
0,63,2
0,82,1
00,8
00,20,2
0

26 I
Agriculture
Business and industrial products
Business and industrial services
Chemicals and materials
Communications
Computer and consumer electronics
Construction
Consumer goods and retail
Consumer services: other
Energy and environment
Financial services
Life sciences
Real estate
Transportation
Unknown
Figure 13 - CEE venture capital investments by sector, 2007-2010 (number of companies)
0 5 10 15 20 25 30 35 40
2007 2008 l 2009 l 2010
Source: EVCA/PEREP_AnalyticsDisclaimer: Data is continuously updated and therefore subject to change.
Our partner: Gide Loyrette Nouel Warsaw Office
21
00
89
11
13
05
12
00
2639
1814
715
713
211
2
73
21
68
23
58
23
51
03
813
19
1111
23
03
011
0

EVCA CENTRAL AND EASTERN EUROPE STATISTICS 2010 I 27
Our partner: Gide Loyrette Nouel Warsaw Office
Table 12 - CEE venture capital divestments by stage, 2009-2010 (exit value at investment cost)(in € x 1,000)
2009 2010
Number of Number of
Amounts in € thousands Amount companies Amount companies
Exit route
Divestment by trade sale
Divestment by public offering
Divestment on flotation (IPO)
Sale of quoted equity
Divestment by write-off
Repayment of silent partnerships
Repayment of principal loans
Sale to another private equity house
Sale to financial institution
Sale to management (MBO)
Divestment by other means
Total divestment in year
Source: EVCA/PEREP_AnalyticsDisclaimer: Data is continuously updated and therefore subject to change.
3,805 4 19,007 2
124 2 1,493 3
0 0 0 0124 2 1,493 3
4,261 3 4,138 4
0 0 0 0
4,000 1 42 1
585 2 18,023 6
4,363 2 150 1
1,757 3 28,298 11
1,675 3 0 0
20,569 16 71,150 28
In 2010, 28 venture-backed companies were exited(accounting for 51% of all CEE companies exited), with atotal amount divested at cost of €71m (24% of total CEEdivestment at cost). Venture divestments increased by250% by amount at cost and by 75% in terms of numberof companies exited compared to 2009.
Close to 40% of venture divestment at cost in 2010 wasaccounted for by sales to management, while trade salesaccounted for 27% and sales to other private equityhouses for 25%. Write-offs accounted for only 6% of totalvalue at cost, compared with 14% in the whole of Europe.

28 I
Figure 14 - CEE buyout & growth investmentby stage, 2007-2010 (amount in € million)
3,000
2,500
2,000
1,500
1,000
500
0
2007
l Rescue/Turnaround and replacement capital
l Growth capital
l Buyout
574
145179
1,530
2008 2009 2010
796
1,553
5
355
1,868 525
660
41
Source: EVCA/PEREP_AnalyticsDisclaimer: Data is continuously updated and therefore subject to change.
Figure 15 - CEE buyout & growth investmentby stage, 2007-2010 (number of companies)
120
100
80
60
40
20
0
2007
l Rescue/Turnaround and replacement capital
l Growth capital
l Buyout
28
14 8
8
64
2008 2009 2010
53
45
4
45
40
62
35
Source: EVCA/PEREP_AnalyticsDisclaimer: Data is continuously updated and therefore subject to change.
Total: 106 Total: 102 Total: 93 Total: 105Total: €2,249m Total: €2,354m Total: €2,400m Total: €1,226m
For the purposes of this section, unless otherwise specificallystated, “buyout & growth” refers to buyouts, growthcapital, rescue/turnaround and replacement transactions.
In the CEE region in 2010, €1.2bn was invested across105 buyout & growth capital companies – half the amountinvested in 2009 (€2.4bn), but 12 companies more.By comparison, in Europe as a whole, buyout & growthcapital investment in value terms increased two-foldyear-on-year in 2010.
Similar to the prior two years, buyout & growth investmentaccounted for 95% of total investment value in the CEEregion. However, in terms of companies financed, buyout& growth’s share dropped slightly - from 72% in 2009 to64% in 2010. This was largely due to the large increasein the number of venture companies financed against arelatively small increase in the number of growth capitaland buyout deals.
Looking at the sub-segments of CEE buyout & growthindividually, compared to 2009, buyouts in 2010 decreasedby 65%, driven primarily by a lack of large and megatransactions, which caused the average buyout deal size todecrease by 60%. Growth capital investment went up invalue by 48%, mainly due to a 7% increase in the averagegrowth capital investment size and a 38% increase in thenumber of growth companies financed. Replacementcapital investment went down by 78% to €37m in 2010.
CEE buyout & growth investment in 2010 accounted for3% of total European buyout & growth investment value,down from 12% in 2009. By number of companies financed,the CEE region accounted for 5% of the companiesfinanced with buyout & growth capital in Europe asa whole in 2010.
8. CEE buyout and growth market
Our partner: Gide Loyrette Nouel Warsaw Office

EVCA CENTRAL AND EASTERN EUROPE STATISTICS 2010 I 29
Our partner: Gide Loyrette Nouel Warsaw Office
Table 13 - Equity and transaction value by type of buyout in 2009-2010 (in € x 1,000)
2010
Equity
Amount Number of Transaction contribution of
Amounts in € thousands (equity value) % companies % value % PE firms (in %)
Buyout investment size
Small
Mid-market
Large and mega
Total buyout
2009
Small
Mid-market
Large and mega
Total buyout
Source: EVCA/PEREP_AnalyticsNote: The difference between the “equity value” and “transaction value” consists of the participation of syndicate members other than private equity firms(i.e. corporates, individuals, financial institutions) and leverage (debt provided by banks or others).
238,599 36.2 29 80.6 322,210 29.3 74.1
421,121 63.8 7 19.4 776,136 70.7 54.3
- - - - - - -
659,720 100.0 35 100.0 1,098,346 100.0 60.1
218,475 11.7 30 75.0 318,612 9.3 68.6
729,129 39.0 8 20.0 997,363 29.1 73.1
920,000 49.3 2 5.0 2,110,000 61.6 43.6
1,867,604 100.0 40 100.0 3,425,975 100.0 54.5
Investment in the CEE buyout & growth capital market in2010 was concentrated in Poland, which accounted for€654m or 53% of the total value. This was driven byPoland capturing €521m of buyout transactions, or 79% ofall buyout investment activity in 2010. The Czech Republicfollowed as the second largest buyout & growth market inthe region in 2010 with 14% of the total investment value,followed by Romania (9%) and Ukraine (8%). In terms ofnumber of companies financed in the buyout & growthsegment, Poland came first as well, accounting for 35% ofthe total, followed by Romania with 13%.
The total transaction value (i.e. including debt and othernon-private equity financing) of CEE buyouts in 2010 was€1.1bn, down from €3.4bn in 2009. No large nor megabuyouts took place in 2010 in the region. A large majorityof the buyout companies financed (81%) were smallbuyouts, but most of the equity invested (64%) went intomid-market transactions. The ratio of private equitycontribution vs total transaction value for small buyoutswas 74%, and only 54% for mid-market deals.

30 I
Agriculture
Business and industrial products
Business and industrial services
Chemicals and materials
Communications
Computer and consumer electronics
Construction
Consumer goods and retail
Consumer services: other
Energy and environment
Financial services
Life sciences
Real estate
Transportation
Unknown
Figure 16 - CEE buyout & growth investment by sector, 2007-2010 (amount in € million)
0
2007 2008 l 2009 l 2010
Source: EVCA/PEREP_AnalyticsDisclaimer: Data is continuously updated and therefore subject to change.
200 400 600 800 1,000 1,200
The consumer goods & retail sector attracted 26% of CEEbuyout & growth investment (€319m) in 2010, driven by arelatively high number of companies financed (21 or 20%of the total). Life sciences was the second most popularsector, accounting for 13% of total investment value,followed closely by communications with 12% of the total.
Our partner: Gide Loyrette Nouel Warsaw Office
10,323,0
043,8
192,5177,2
33,746,9
15,737,6
32,970,4
8,161,3
6,921,8
458,6496,7
148,824,422,2
169,590,4
24,047,3
16,514,9
125,4247,7
864,0318,8
135,1101,0
24,298,6
108,975,0
247,780,4
267,9272,4
249,590,5
100,2598,6
209,8153,2
70,633,1
45,01,1
203,9182,3
046,5
016,8
3,70
962,8

EVCA CENTRAL AND EASTERN EUROPE STATISTICS 2010 I 31
Our partner: Gide Loyrette Nouel Warsaw Office
Agriculture
Business and industrial products
Business and industrial services
Chemicals and materials
Communications
Computer and consumer electronics
Construction
Consumer goods and retail
Consumer services: other
Energy and environment
Financial services
Life sciences
Real estate
Transportation
Unknown
Figure 17 - CEE buyout & growth investment by sector, 2007-2010 (number of companies)
0
2007 2008 l 2009 l 2010
Source: EVCA/PEREP_AnalyticsDisclaimer: Data is continuously updated and therefore subject to change.
5 10 15 20 25
22
15
1511
78
4666
14
34
1217
1912
23
533
42
614
1619
217
53
78
47
616
137
1210
78
73
22
14
30
50
41
0
32 I
Table 14 - CEE Buyout & growth divestment by exit route, 2009-2010 (exit value at investment cost)(in € x 1,000)
2009 2010
Number of Number of
Amounts in € thousands Amount companies Amount companies
Exit route
Divestment by trade sale
Divestment by public offering
Divestment on flotation (IPO)
Sale of quoted equity
Divestment by write-off
Repayment of silent partnerships
Repayment of principal loans
Sale to another private equity house
Sale to financial institution
Sale to management (MBO)
Divestment by other means
Total divestment in year
Source: EVCA/PEREP_AnalyticsDisclaimer: Data is continuously updated and therefore subject to change.
12,521 5 96,489 11
17,417 3 0 0
3,267 1 0 014,150 2 0 0
0 0 78,582 4
0 0 0 0
4,615 3 1,541 2
20,871 2 47,017 7
48,680 3 31 1
5,935 3 1,798 5
1,310 3 2,923 1
111,349 22 228,381 30
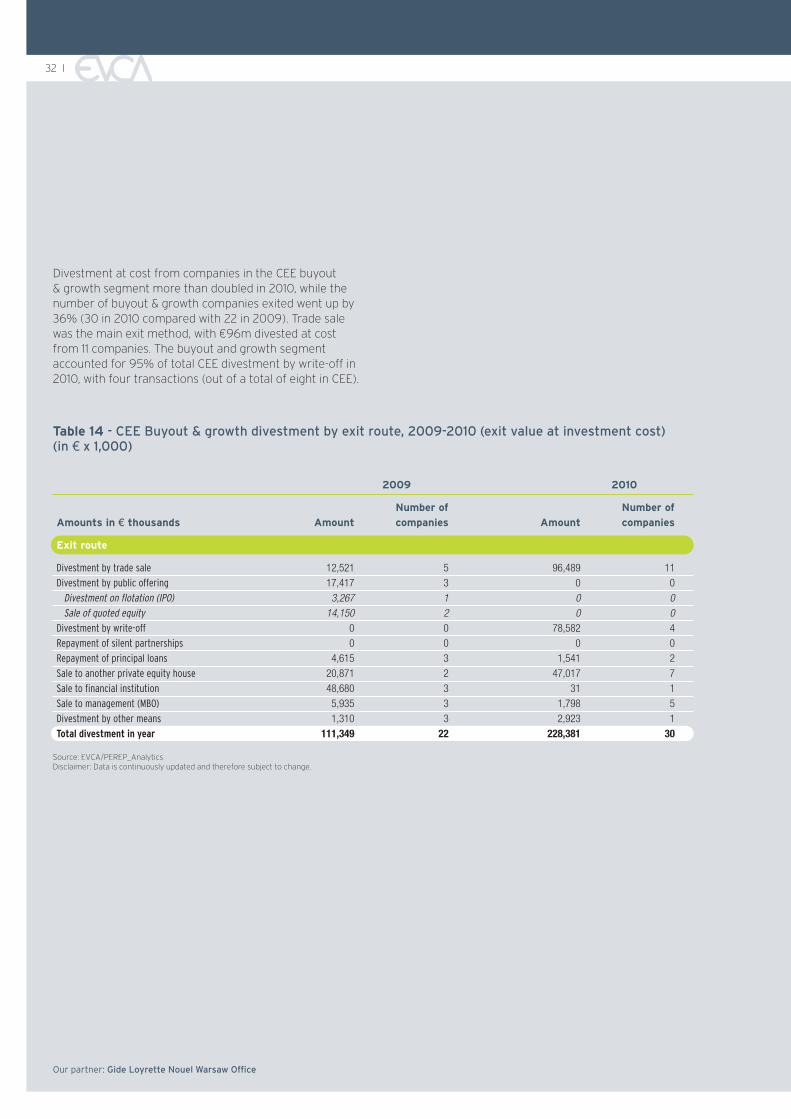
Divestment at cost from companies in the CEE buyout& growth segment more than doubled in 2010, while thenumber of buyout & growth companies exited went up by36% (30 in 2010 compared with 22 in 2009). Trade salewas the main exit method, with €96m divested at costfrom 11 companies. The buyout and growth segmentaccounted for 95% of total CEE divestment by write-off in2010, with four transactions (out of a total of eight in CEE).
Our partner: Gide Loyrette Nouel Warsaw Office

EVCA CENTRAL AND EASTERN EUROPE STATISTICS 2010 I 33
Our partner: Gide Loyrette Nouel Warsaw Office
Fundraising
As the vast majority of private equity funds raised for CEEwere for the region as a whole, and not for any specificcountry, fundraising is presented in this paper as a totalpool of capital raised for the region. Moreover, fundraisingis limited to capital raised by funds that have declared CEEto be their target region. The data does not include thosefunds that may allocate a portion of their capital to theCEE region but whose primary focus is elsewhere.
The funds included in the statistics are:
> private equity funds making direct private equityinvestments
> mezzanine private equity funds > co-investment funds > rescue/turnaround funds
The following funds are excluded from the statistics:
> infrastructure funds> real estate funds > distress debt funds> primary funds-of-funds> secondary funds-of-funds
Restatement of geographical sources of funds:
Capital raised from an LP located in the same countryas the fund it commits to, is usually considered asdomestically raised in the EVCA classification.However, the CEE fundraising data includes private equityfunds located outside of the region but fully dedicated tothe region (e.g.: a UK fund focused on the CEE region).Historically, when such funds raised capital from LPslocated in the same country, these funds were recorded asdomestic. Starting from 2011, it has been decided to reviewthis methodology and only consider the capital raisedfrom CEE based LPs as domestic funds raised. We believethis gives a more accurate picture of the location of LPscommitting to CEE focused funds. The result of this changein methodology was a significant decrease in funds raiseddomestically in 2007 and 2008, and a strong increase infunds raised from other Europe.
Investments
Investments and divestments are aggregated via twomethods – industry statistics and market statistics.
Industry statistics consist of aggregation of the figuresaccording to where the private equity firm investing in aparticular company is domiciled. At the European level,this means investments/divestments made by Europeanprivate equity firms.
Market statistics consist of aggregation of the figureaccording to where the portfolio company is domiciled.At the European level, this means investments in Europeancompanies or divestments from European companies,regardless of the location of the private equity firm.
This report uses only market statistics.
Buyout split
Buyout investments are split into four classes: small,mid-market, large, and mega. In this report, the classificationis based on the transaction value of the buyout deals.If two syndication partners invest equity values of €100mand €200m respectively for a total transaction value of€600m, the deal will be classified under large deals withequity value of €300m and transaction value €600m.
Buyout deals Transaction value (€m)
Small <50
Mid-market 50 ≤ X <500
Large 500 ≤ X <1,000
Mega ≥1,000
Divestments
Divestment amounts are measured by cost of investment,not actual proceeds.
Number of companies
The number of companies represents a distinct list ofentities receiving investments throughout the reportingyear. So if a company receives two investments duringthe year, the number of companies will equal one,but the number of investments will equal two.
In some cases, subtotals and totals may not appear to addup to the same number of companies as individual itemsin the tables. This can be explained by understandingthe issue of counting distinct entities.
9. Methodology

34 I
So for a company receiving multiple distinct rounds offinancing in a year – in this example, a later-stage ventureinvestment of €1m by one investor in January, followed bya management buyout of €20m in November with twoinvestors – the tables would indicate the following:
Stage Amount Companies
Later-stage venture 1,000 1
Management buyout 20,000 1
Total investment 21,000 1
The total number of companies invested in correspondsto the number in the “Total Investment” category under“Companies”. Because any one company can be recordedunder several subcategories, the sum of all subcategoriescan exceed the number of companies that receiveinvestment. So although the table appears to indicate thetotal number of companies would be two (one later-stageventure and one buyout) the total is recorded as one.This will only affect counts of companies – it does not affectthe amounts – and makes any average more accurate.
The same applies to the total number of venture companies.A venture company receiving both seed and start-upfinancing would be recorded as one seed company andone start-up company. However, in the total number ofventure companies, it would be counted only once.
Data updates
PEREP_Analytics offers private equity market participantsthe possibility to submit surveys and validate previouslypopulated data captured from public information sourcesat various stages of time. For example, if a player submitsinformation about a divestment, and the correspondinginvestment has never been previously reported orcaptured, the PEREP Analyst will create the investmentso that no portfolio company is reflected with negativecapital flow in the database. Moreover, some informationis disclosed on the website of the private equity playersat a later stage, after the cut-off for producing the EVCAYearbook, and thus is subsequently processed in thedatabase. For all the above reasons, figures may be updatedyear on year to reflect the latest available statistics forpreviously released years starting with 2007.
Our partner: Gide Loyrette Nouel Warsaw Office

EVCA CENTRAL AND EASTERN EUROPE STATISTICS 2010 I 35
Our partner: Gide Loyrette Nouel Warsaw Office
> Private equity: Private equity provides equity capitalto enterprises not quoted on a stock market.Private equity includes the following investment stages:venture capital, growth capital, replacement capital,rescue/turnaround and buyouts. Private equity fundsare pools of capital managed in general as closed-end,fixed-life funds doing primarily equity capitalinvestments into enterprises (i.e. direct private equityfunds as opposed to primary or secondary privateequity fund of funds) not quoted on a stock market.
> Venture capital: Venture capital is, strictly speaking,a subset of private equity and refers to equityinvestments made for the launch, early development,or expansion of a business.
Type of investors (fundraising tables):
> Corporate investor: Corporations that produceproducts (manufacturing companies) or delivernon-financial services. This definition excludes banks,funds-of-funds, insurance companies, pension fundsand other asset managers.
> Endowment: An institution that is bestowed money(and possibly other assets) via a donation with thestipulation to invest it and use the gains for specificobjectives so that the principal remains intact(for perpetuity, for a defined period of time or untilsufficient assets have been accumulated to achievea designated purpose).
> Family office: An office that provides services suchas investment management and other services(accounting, tax and financial advice etc) to oneor several families.
> Foundations: A non-profit organisation through whichprivate wealth is contributed and distributed for publicpurposes (most often charitable purposes). It mayeither donate funds and support other organisations orbe the sole source of funding for its own charitableactivities.
> Fund of funds: A private equity fund that primarilyinvests and commits equity to private equity funds.
> Other asset manager: Financial institutions (other thanbank, endowment, family office, foundation, insurancecompany or pension fund) managing a pool of capitalby investing it across asset classes with the purpose togenerate financial returns. This category may includedirect private equity funds that occasionally do indirectinvestments, but excludes funds-of-funds, which area distinct category.
> Government agencies: Country, regional, governmentaland European agencies or institutions for innovationand development (including structures such as theEBRD or EIF).
> Sovereign wealth funds: state-owned investment fundmanaging a pool of money derived from a country'sreserves. The funding for a sovereign wealth fund (SWF)comes from central bank reserves that accumulate as aresult of budget and trade surpluses, and from revenuegenerated from the exports of natural resources.
Fund stage focuses (fundraising tables):
> Early-stage fund: A venture capital fund focused oninvesting in companies in the early stages of their lives.
> Later-stage fund: A venture capital fund focusedon investing in later-stage companies in need ofexpansion capital, usually providing third- or fourth-(or a subsequent) rounds of venture investment.
> Balanced fund: A venture capital fund focused onboth early-stage and development, with no particularconcentration on either.
> Growth fund: Funds whose strategy is to invest in oracquire relatively mature companies that are lookingfor capital to expand or restructure operations; theyoften provide the first private equity investment ina company.
> Buyout fund: A fund whose strategy is to acquire otherbusinesses.
> Mezzanine fund: A fund that provides debt (generallysubordinated) to facilitate the financing of buyouts,frequently alongside a right to some of the equity upside.
> Generalist fund: a funds with either a stated focusof investing in all stages of private equity investment,or with a broad area of investment activity.
10.Definitions

36 I
Stage definitions (investment tables):
Several financing stages can be identified in relationto the stages of development of a private-equity-backedcompany:
> Seed: Financing provided to research, assess anddevelop an initial concept before a business hasreached the start-up phase.
> Start-up: Financing provided to companies for productdevelopment and initial marketing. Companies may bein the process of being set up or may have been inbusiness for a short time, but not sold their productcommercially.
> Other early-stage: Financing to companies that havecompleted the product development stage and requirefurther funds to initiate commercial manufacturing andsales. They will likely not yet be generating a profit.
> Later-stage venture: Financing provided for theexpansion of an operating company, which may or maynot be breaking even or trading profitably. Later-stageventure tends to finance companies already backedby VCs, and therefore involves third- or fourth-(or a subsequent) rounds of financing.
> Growth: A type of private equity investment – mostoften a minority investment but not necessarily – inrelatively mature companies that are looking for capitalto expand or restructure operations, enter new marketsor finance a significant acquisition without a changeof control of the business. Growth capital tends to bea company’s first private equity financing.Additionally, most investments made by buyout fundsinto venture stages would be defined as growth capital.
> Bridge financing: Financing made available to acompany for the period of transition between beingprivately owned and publicly quoted.
> Rescue/turnaround: Financing made available toan existing business, which has experienced tradingdifficulties, with a view to re-establishing prosperity.
> Secondary purchase/replacement capital:The purchase of a minority stake of existing sharesin a company from another private equity firm or fromanother shareholder or shareholders.
> Refinancing bank debt: An injection of capitalto reduce a company’s level of gearing.
> Management buyout: Financing provided to enablecurrent operating management and investorsto acquire existing product lines or businesses.
> Management buy-in: Financing provided to enablea manager or group of managers from outside thecompany to buy in to the company with the supportof private equity investors.
> Public-to-private: A transaction involving an offerfor the entire share capital of a listed target companyfor the purpose of delisting the company.Management may be involved in the offering.
> Other PIPE: A private investment in public equity, as aminority or majority stake, without taking the companyprivate.
> Other (leveraged) buyout: Financing provided toacquire a company (other than MBI, MBO, public-to-private or other PIPE). It may use a significant amountof borrowed money to meet the cost of acquisition.
> Secondary buyout: A secondary buyout is a form ofbuyout where both buyer and seller are private equityfirms or financial sponsors (ie a leveraged buyout ofa company that was acquired through a leveragedbuyout). Secondary buyouts differ from secondariesor secondary market purchases which typically involvethe acquisition of portfolios of private equity assets,including limited partnership stakes and directinvestments in corporate securities.
Mapping the above stages into the five main stagesdescribed in this publication leads to the followingclassification:
> Seed: seed> Start-up: start-up, other early stage> Later-stage venture: later-stage venture, bridge financing> Growth: growth> Rescue/turnaround: rescue/turnaround > Replacement capital: secondary purchase/replacement
capital, refinancing bank debt> Buyouts: management buyout, management buy-in,
public-to-private, other PIPE, leveraged buyout,
Our partner: Gide Loyrette Nouel Warsaw Office

EVCA CENTRAL AND EASTERN EUROPE STATISTICS 2010 I 37
Our partner: Gide Loyrette Nouel Warsaw Office
Mapping the above stages into the two main stages– venture and buyout & growth - leads to the followingclassification:
> Venture deals: seed, start-up, later-stage venture> Buyout & growth deals: growth, rescue/turnaround,
replacement capital, buyouts
Amounts definition:
> Equity value: Stricto sensu, the amount of capitalinvested to acquire shares in an enterprise. The equityvalue includes equity, quasi-equity, mezzanine,unsecured debt and secured debt financing provided byfunds raised by private equity firms focused primarilyon direct investments (including co-investment funds)or incorporated direct private equity firms investingfrom the balance sheet (evergreen and direct captiveprivate equity programmes).
Sectoral definitions (investment tables):
For a complete picture of the sectoral classification andits mapping to the NACE standardised sectoralclassification of Eurostat (NACE Rev. 2, 2007), go towww.evca.eu//uploadedFiles/sectoral_classification.pdf
This link above shows the map between the old EVCAsectors, the new 67 sectors used in the online survey byPEREP, their grouping into the 14 sectoral classes used inthe sectoral distribution of investments in the EVCAYearbook, and their further grouping into the sevensectoral clusters used in the fundraising by fund sectoralfocus in the EVCA Yearbook and in this publication.
Divestment methods (divestment tables):
> Divestment on flotation (IPO): An initial public offering(IPO) is the sale or distribution of a company’s shares tothe public for the first time by listing the company onthe stock exchange. It is one way a private equity firmcan sell its shares and exit an investment.
> Sale of quoted equity post-flotation: This relates tothe sale of quoted shares only if connected to a formerprivate equity investment, such as the sale of quotedshares after an IPO and lock-up period restricting salesof shares for a defined period of time.
> Repayment of preference shares/loans: If a privateequity firm provided loans or bought preference sharesin the company at the time of investment, then theirrepayment according to the amortisation schedulerepresents a decrease of the financial claim of the firminto the company, and hence a divestment.
> Repayment of silent partnership: A silent partnershipbelongs to the so-called mezzanine financinginstruments. It is similar to a long-term bank loan but,in contrast to a loan, a silent partnership is subject to asubordination clause, so that in the event of insolvencyall other creditors are paid before the silent partner.The company has to repay the partnership and has topay interest and possibly a profit-related compensation.The subordination clause gives the capital the status ofequity despite its loan character. This financinginstrument is frequently used in Germany.
> Sale to another private equity house: The sale ofcompany shares to another private equity fund.
> Sale to financial institution: The sale of companyshares to banks, insurance companies, pension funds,endowments, foundations and other asset managersother than private equity firms.
> Sale to trade buyers: The sale of company sharesto industrial investors.
> Divestment by write-off: The total or partial write-down of a portfolio company’s value to zero or asymbolic amount (sales for a nominal amount) with theconsequent exit from the company or reduction of theshare owned. The value of the investment is eliminatedand the return to investors is equal or close to -100%.
For more information on the methodology of this report,please contact [email protected].

38 I
Gide Loyrette Nouel was one of the first international legalpractices to open an office in Poland in 1990. Today, theFirm employs 50 lawyers and tax advisors in Warsaw andis frequently called upon to offer legal support to its localand international clients. With 19 offices around the world,Gide Loyrette Nouel (GLN) prides itself on offering expertinternational and local advice. GLN Warsaw's clientsinclude financial institutions, banks, insurance companies,investors, real estate developers, public companies andgovernment ministries. The Firm advises some of the topplayers in Poland including: Enterprise Investors,Abris Capital Partners, Innova Capital, Bain Capital,Deutsche Bank PBC, Bank Zachodni WBK, BankGospodarstwa Krajowego, Société Générale, BRE Bank,Pekao S.A., PKO BP, BNP Paribas, DnB Nord Bank, Dalkia(Veolia), Finmeccanica Group, L'Oréal, France Télécom,Telekomunikacja Polska, PGNiG, KGHM Polska Miedz,ArcelorMittal, Unibail-Rodamco, Neinver, EDF, Sita Suez,Bonduelle, Danone, Citroën, Peugeot, Renault.
The Warsaw Office provides a wide range of legal services,including:
> M&A and Corporate law> Private Equity> Banking & Finance> Capital markets> Energy, Infrastructure & Public law> Real Estate> Litigation and Arbitration> Restructuring and Insolvency law> Tax law> Intellectual Property> Labour law> Competition law
Expertise and practice areas
Mergers, acquisitions and corporate law
Over the last 18 years, GLN Warsaw has been involved in alarge number of transactions: share and asset transactionson the private market, both domestic and international;public tenders and IPOs; private equity deals; LBOs;privatisation transactions; mergers and spin-offs, includingcross-border operations.
Banking and finance
The Banking & Finance team has outstanding expertise incomplex international financing projects. GLN Warsawrepresents Polish and international banks, corporationsand financial institutions as lenders, borrowers, issuers,guarantors, arrangers and institutional investors onvarious structured finance transactions including LBOs,private equity and mezzanine finance deals.
Energy, infrastructure and public law
GLN Warsaw provides legal counsel to the energyand infrastructure sectors in Poland. The Firm regularlyadvises on privatisations, acquisitions, regulatory issues,energy, gas and commodities trading and infrastructureinvestment projects (motorways, pipelines, railways,sea terminals, mining operations) as well as on projectfinance, public procurement and state aid.
Real estate
One of the core activities of the Warsaw Office. The teamprovides assistance at all stages of real estate-relatedprojects including acquisition, development, zoning andconstruction, financing, commercialisation, letting out,sale, administrative and regulatory aspects.
Litigation and arbitration
The Firm has extensive experience in handling litigation,arbitration and administrative proceedings and regularlyadvises on cross-border cases with the support of GLN'sInternational Dispute Resolution team.
Restructuring and insolvency law
GLN represents companies in bankruptcy proceedings andrestructuring operations, both domestic and cross-border(including European bankruptcy proceedings). GLN alsoprovides a broad scope of advisory services to Polishand foreign creditors in bankruptcy proceedings againsttheir debtors.
About Gide Loyrette Nouel Warsaw Office
Our partner: Gide Loyrette Nouel Warsaw Office

EVCA CENTRAL AND EASTERN EUROPE STATISTICS 2010 I 39
Our partner: Gide Loyrette Nouel Warsaw Office
Tax law
GLN Warsaw provides tax advisory services relating tovarious types of transactions such as mergers andacquisitions, restructurings, deals involving trade in realestate, industrial property and new technologies as wellas financial transactions.
Intellectual property
GLN Warsaw provides legal services in trademark lawas well as industrial and intellectual property rights,counteracting infringements of copyright andneighbouring rights, combating unfair competitionpractices, as well as assistance in negotiations andrepresentation in litigation.
Labour law
GLN Warsaw provides legal assistance in employmentrelated issues, including individual employment relationships,the organisation of employment and remunerationsystems, establishing personnel policy and draftinginternal employment-related legal acts, conductingcollective employment-related negotiations and providingadvice in employment restructuring and lay-offs.
Competition law
GLN Warsaw advises clients on all matters relating tocompetition protection, consumer protection law andcommercial agreements, including distribution systemswith regard to domestic and community law.
Gide Loyrette NouelMetropolitan, Pl. Piłsudskiego 100-078 Warsaw - PolandTel. + 48 22 344 00 00Fax + 48 22 344 00 01E-mail: [email protected]
Contact details
> Dariusz TokarczukManaging partner, legal [email protected]
> Paweł GrzeskowiakPartner, [email protected]
> Rafał DziedzicPartner, legal advisor [email protected]
> Agnieszka KowalskaSenior associate, legal [email protected]

40 I
Our partner: Gide Loyrette Nouel Warsaw Office

The ‘Central and Eastern Europe Statistics 2010’ Special Paper is published by the EuropeanPrivate Equity & Venture Capital Association (EVCA). © Copyright EVCA July 2011
Bastion Tower, Place du Champ de Mars 5, B-1050 Brussels, BelgiumT + 32 2 715 00 20F + 32 2 725 07 [email protected] www.evca.eu