evca quarterly activity indicator: q1 2007-q2 2011 29 august, 2011 produced for evca by...
TRANSCRIPT

EVCA Quarterly Activity Indicator: Q1 2007-Q2 2011
29 August, 2011
Produced for EVCA by PEREP_AnalyticsTM

| Creating lasting valueEVCA Quarterly Activity Indicator: Q1 2007-Q2 20112 |
Methodology
• Data collected via questionnaires and reliable public sources
• Definition of Europe:
• for deals, it is defined by the location of the target;• for fundraising it covers funds primarily focused on Europe
• Fundraising: only formal closings are included with committed amount
• Investments: amounts are measured by equity value; debt is included only IF provided by PE funds (bank leverage excluded)
• Divestments: measured at amount at cost divested (not proceeds)

| Creating lasting valueEVCA Quarterly Activity Indicator: Q1 2007-Q2 20113 |
0
20
40
60
80
100
120
Q1 Q2 Q3 Q4 Q1 Q2 Q3 Q4 Q1 Q2 Q3 Q4 Q1 Q2 Q3 Q4 Q1 Q2
Funds raised
Investments
Divestments at cost
Trends in European private equity activity flows
Source: EVCA/PEREP_Analytics
Index Q1 2007=100
2007 2008 2009 2010 2011

| Creating lasting valueEVCA Quarterly Activity Indicator: Q1 2007-Q2 20114 |
25.5
23.7
14.815.9
17.2
23.4
20.5
18.8
5.4
3.84.7
3.9
8.1
4.2 4.6
3.1
6.9
10.5
16.717.8
19.7
16.7
13.6
14.9
16.4
8.2
5.14.4
5.1
8.6 8.2
9.810.7
12.6
8.4
9.9
0
5
10
15
20
25
30
Q1 Q2 Q3 Q4 Q1 Q2 Q3 Q4 Q1 Q2 Q3 Q4 Q1 Q2 Q3 Q4 Q1 Q2
€ billion
Funds raised
Investments
Evolution of activity flowsIncremental amounts raised during quarter
Source: EVCA/PEREP_Analytics
2007 2008 2009 2010 2011

| Creating lasting valueEVCA Quarterly Activity Indicator: Q1 2007-Q2 20115 |
0
20
40
60
80
100
120
Q1 Q2 Q3 Q4 Q1 Q2 Q3 Q4 Q1 Q2 Q3 Q4 Q1 Q2 Q3 Q4 Q1 Q2
Funds raised
Funds raised – Quarterly evolutionIndex Q1 2007=100
Source: EVCA/PEREP_Analytics
2007 2008 2009 2010 2011
| Creating lasting valueEVCA Quarterly Activity Indicator: Q1 2007-Q2 20116 |
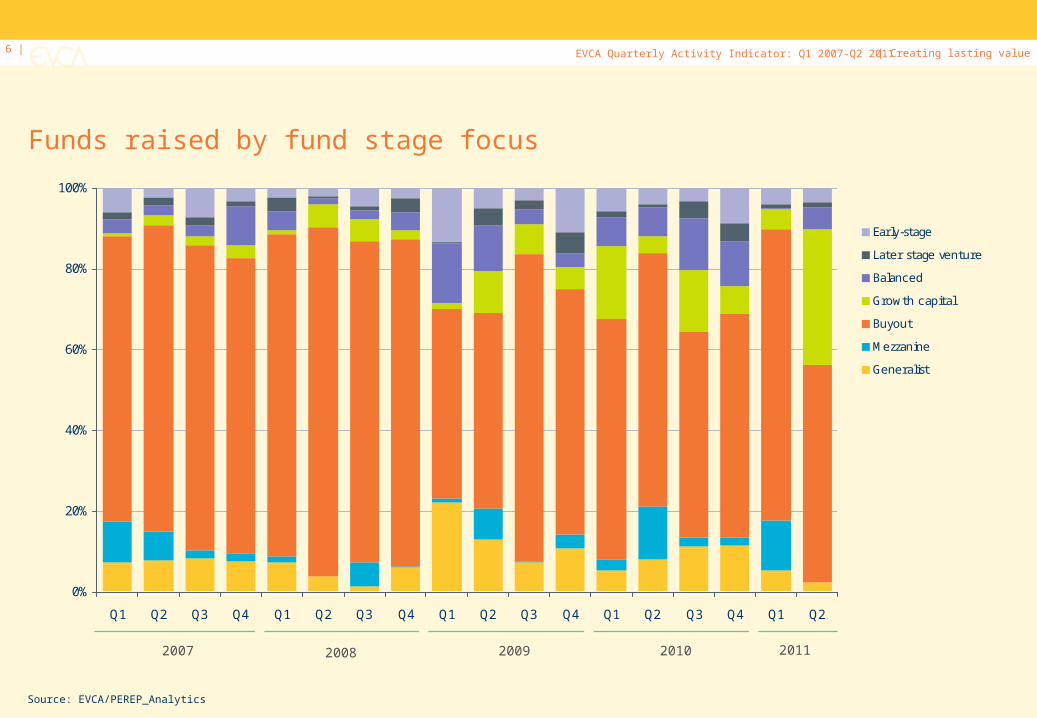
Funds raised by fund stage focus
Source: EVCA/PEREP_Analytics
0%
20%
40%
60%
80%
100%
Q1 Q2 Q3 Q4 Q1 Q2 Q3 Q4 Q1 Q2 Q3 Q4 Q1 Q2 Q3 Q4 Q1 Q2
Early-stage
Later stage venture
Balanced
Growth capital
Buyout
Mezzanine
Generalist
2007 2008 2009 2010 2011

| Creating lasting valueEVCA Quarterly Activity Indicator: Q1 2007-Q2 20117 |
Funds raised by fund stage focus in Q2 2011
Source: EVCA/PEREP_Analytics
Early-stage
3.4%Later stage
venture 0.8%
Balanced
5.3%
Growth capital
33.7%
Buyout
53.8%
Generalist
2.4%
| Creating lasting valueEVCA Quarterly Activity Indicator: Q1 2007-Q2 20118 |
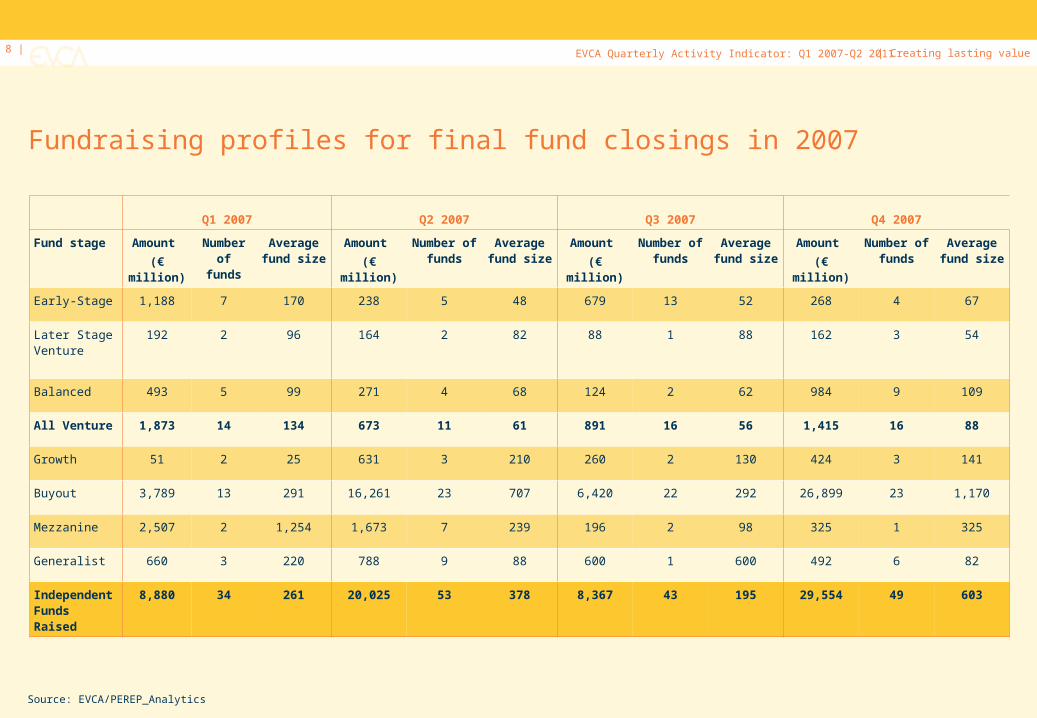
Fundraising profiles for final fund closings in 2007
Q1 2007 Q2 2007 Q3 2007 Q4 2007
Fund stage Amount
(€ million)
Number of funds
Average fund size
Amount
(€ million)
Number of funds
Average fund size
Amount
(€ million)
Number of funds
Average fund size
Amount
(€ million)
Number of funds
Average fund size
Early-Stage 1,188 7 170 238 5 48 679 13 52 268 4 67
Later Stage Venture
192 2 96 164 2 82 88 1 88 162 3 54
Balanced 493 5 99 271 4 68 124 2 62 984 9 109
All Venture 1,873 14 134 673 11 61 891 16 56 1,415 16 88
Growth 51 2 25 631 3 210 260 2 130 424 3 141
Buyout 3,789 13 291 16,261 23 707 6,420 22 292 26,899 23 1,170
Mezzanine 2,507 2 1,254 1,673 7 239 196 2 98 325 1 325
Generalist 660 3 220 788 9 88 600 1 600 492 6 82
Independent Funds Raised
8,880 34 261 20,025 53 378 8,367 43 195 29,554 49 603
Source: EVCA/PEREP_Analytics

| Creating lasting valueEVCA Quarterly Activity Indicator: Q1 2007-Q2 20119 |
Fundraising profiles for final fund closings in 2008
Q1 2008 Q2 2008 Q3 2008 Q4 2008
Fund stage Amount
(€ million)
Number of funds
Average fund size
Amount
(€ million)
Number of funds
Average fund size
Amount
(€ million)
Number of funds
Average fund size
Amount
(€ million)
Number of funds
Average fund size
Early-Stage 208 4 52 509 9 57 546 6 91 206 3 69
Later Stage Venture
754 5 151 6 1 6 58 1 58 100 1 100
Balanced 448 4 112 241 4 60 96 3 32 537 9 60
All Venture 1,410
13 108 755 14 54 701 10 70 843 13 65
Growth 50 1 50 1,181 4 295 1,150 4 288 111 2 55
Buyout 10,435 22 474 19,228 13 1,479 16,021 15 1,068 13,542 18 752
Mezzanine 508 3 169 - 0 - - 0 - - 0 -
Generalist 173 4 43 1,174 9 130 102 2 51 737 5 147
Independent Funds Raised
12,577
43 292 22,339 40 558 17,973 31 580 15,233 38 401
Source: EVCA/PEREP_Analytics
| Creating lasting valueEVCA Quarterly Activity Indicator: Q1 2007-Q2 201110 |
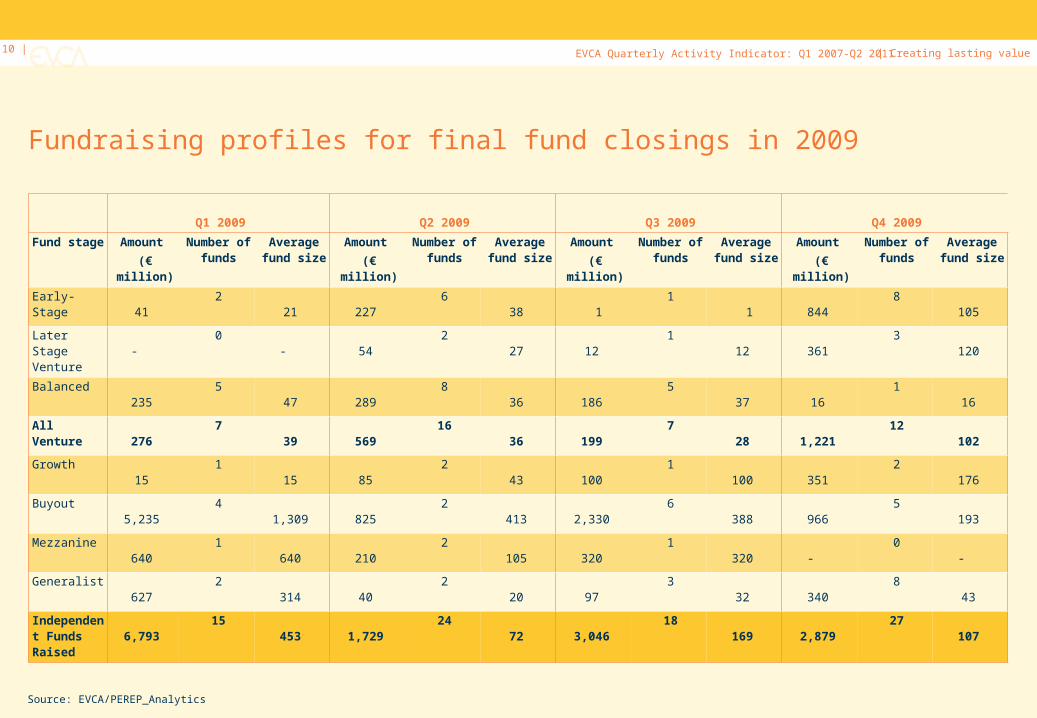
Fundraising profiles for final fund closings in 2009
Q1 2009 Q2 2009 Q3 2009 Q4 2009
Fund stage Amount
(€ million)
Number of funds
Average fund size
Amount
(€ million)
Number of funds
Average fund size
Amount
(€ million)
Number of funds
Average fund size
Amount
(€ million)
Number of funds
Average fund size
Early-Stage 41 2 21 227 6 38 1 1 1 844 8 105
Later Stage Venture
- 0 - 54 2 27 12 1 12 361 3 120
Balanced 235 5 47 289 8 36 186 5 37 16 1 16
All Venture
276 7 39 569 16 36 199 7 28 1,221 12 102
Growth 15 1 15 85 2 43 100 1 100 351 2 176
Buyout 5,235 4 1,309 825 2 413 2,330 6 388 966 5 193
Mezzanine 640 1 640 210 2 105 320 1 320 - 0 -
Generalist 627 2 314 40 2 20 97 3 32 340 8 43
Independent Funds Raised
6,793 15 453 1,729 24 72 3,046 18 169 2,879 27 107
Source: EVCA/PEREP_Analytics

| Creating lasting valueEVCA Quarterly Activity Indicator: Q1 2007-Q2 201111 |
Fundraising profiles for final fund closings in 2010
Q1 2010 Q2 2010 Q3 2010 Q4 2010
Fund stage Amount
(€ million)
Number of funds
Average fund size
Amount
(€ million)
Number of funds
Average fund size
Amount
(€ million)
Number of funds
Average fund size
Amount
(€ million)
Number of funds
Average fund size
Early-Stage 93 6 16 255 5 51 50 3 17 156 6 26
Later Stage Venture
8 1 8 2 1 2 167 1 167 144 3 48
Balanced 471 7 67 287 5 57 418 4 104 189 6 32
All Venture 573 14 41 543 11 49 634 8 79 489 15 33
Growth 1,268 3 423 20 1 20 162 1 162 - 0 -
Buyout 5,060 10 506 4,415 7 631 1,766 7 252 1,675 10 168
Mezzanine 23 1 23 681 2 340 - 0 - - 0 -
Generalist 312 3 104 366 5 73 138 6 23 60 2 30
Independent Funds Raised
7,236 31 233 6,025 26 232 2,700 22 123 2,225 27 82
Source: EVCA/PEREP_Analytics

| Creating lasting valueEVCA Quarterly Activity Indicator: Q1 2007-Q2 201112 |
Fundraising profiles for final fund closings in 2011
Source: EVCA/PEREP_Analytics
Q1 2011 Q2 2011
Fund stage Amount
(€ million)
Number of funds
Average fund size
Amount
(€ million)
Number of funds
Average fund size
Early-Stage 312 3 104 13 1 13 Later Stage Venture - 0 - 262 1 262 Balanced 6 1 6 552 3 184 All Venture 318 4 80 827 5 165 Growth - 0 - 872 4 218 Buyout 1,520 5 304 5,917 9 657 Mezzanine 850 1 850 - - - Generalist 463 3 154 360 2 180 Independent Funds Raised
3,151 13 242 7,976 20 399

| Creating lasting valueEVCA Quarterly Activity Indicator: Q1 2007-Q2 201113 |
100.0
106.4
118.3
100.1
81.3
89.0
98.6
48.9
30.626.5
30.9
51.3 49.2
58.564.0
75.4
50.2
59.0
0
20
40
60
80
100
120
Q1 Q2 Q3 Q4 Q1 Q2 Q3 Q4 Q1 Q2 Q3 Q4 Q1 Q2 Q3 Q4 Q1 Q2
Investments
Investments by amount – Quarterly evolutionIndex Q1 2007=100
Source: EVCA/PEREP_Analytics
2007 2008 2009 2010 2011

| Creating lasting valueEVCA Quarterly Activity Indicator: Q1 2007-Q2 201114 |
16.8
13.5
10.4 10.5
8.0
1.1
1.1
1.4
1.4
1.62.5
1.8
1.4
1.30.8
1.1
1.4 1.5
1.8
1.9
1.2
1.2
1.2
1.3
1.3
1.6
1.7
1.6
1.8
1.6
1.5
0.90.9
0.9
1.1 0.7
1.0
0.8
1.0
0.8
0.7
14.315.3
13.0
5.22.9 2.6 3.2
6.1 6.07.0
8.0
10.4
6.4
0
2
4
6
8
10
12
14
16
18
20
Q1 Q2 Q3 Q4 Q1 Q2 Q3 Q4 Q1 Q2 Q3 Q4 Q1 Q2 Q3 Q4 Q1 Q2
€ billion
Total venture
Growth
Buyout
European investments at €9.9bn in Q2 2011
Source: EVCA/PEREP_Analytics
2007 2008 2009 2010 2011
| Creating lasting valueEVCA Quarterly Activity Indicator: Q1 2007-Q2 201115 |
0%
20%
40%
60%
80%
100%
Q1 Q2 Q3 Q4 Q1 Q2 Q3 Q4 Q1 Q2 Q3 Q4 Q1 Q2 Q3 Q4 Q1 Q2
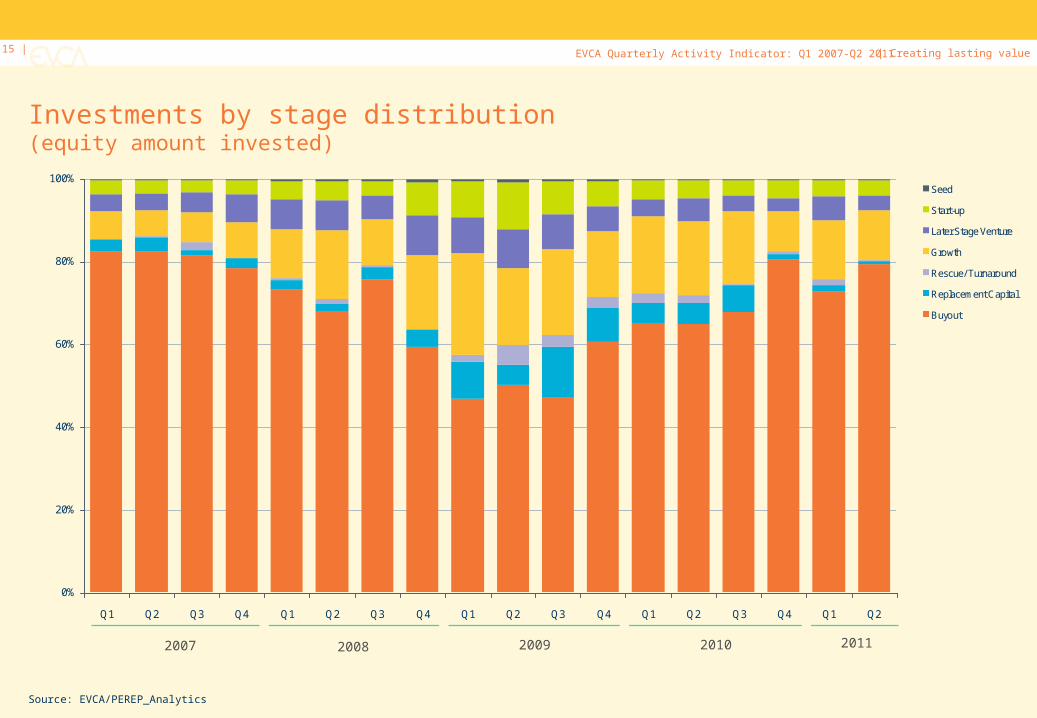
Seed
Start-up
Later Stage Venture
Growth
Rescue/ Turnaround
Replacement Capital
Buyout
Investments by stage distribution(equity amount invested)
Source: EVCA/PEREP_Analytics
2007 2008 2009 2010 2011

| Creating lasting valueEVCA Quarterly Activity Indicator: Q1 2007-Q2 201116 |
Investments by stage distribution(number of companies invested)
Source: EVCA/PEREP_Analytics
0%
20%
40%
60%
80%
100%
Q1 Q2 Q3 Q4 Q1 Q2 Q3 Q4 Q1 Q2 Q3 Q4 Q1 Q2 Q3 Q4 Q1 Q2
Seed
Start-up
Later Stage Venture
Growth
Rescue/ Turnaround
Replacement Capital
Buyout
2007 2008 2009 2010 2011

| Creating lasting valueEVCA Quarterly Activity Indicator: Q1 2007-Q2 201117 |
Buyouts split by size(equity value, bank leverage excluded)
Source: EVCA/PEREP_Analytics
1.3 1.1 1.6 1.6 1.1 1.3 1.2 0.8 0.5 0.7 0.6 0.6 0.7 0.7 0.8 0.9 0.6 0.8
6.85.7 5.1
6.2
4.35.3 5.2
2.8
0.8 1.0 1.52.5
1.72.5
3.4 3.63.1
3.8
2.64.0
2.8
3.3
2.1
2.21.8
0.6
0.4 0.20.3
1.61.7
1.4
1.62.6
1.2
1.9
3.13.8 6.5
2.0
2.41.3
4.3
0.6
0.6 0.40.0
0.4 1.31.7
1.5
3.1
1.2
1.4
0
2
4
6
8
10
12
14
16
18
Q1 Q2 Q3 Q4 Q1 Q2 Q3 Q4 Q1 Q2 Q3 Q4 Q1 Q2 Q3 Q4 Q1 Q2
€ billion
Mega
Large
Mid-market
Small
2007 2008 2009 2010 2011

| Creating lasting valueEVCA Quarterly Activity Indicator: Q1 2007-Q2 201118 |
Buyouts split by size(number of companies)
Source: EVCA/PEREP_Analytics
217 204
244 250
213 224 216180
137 148128 118 113
139 143 152
104 117
106115
100118
101113
113
51
1522
40 4837
62 6974
6265
11 17
11
12
9
9
8
9
3
21 1 7
7
78
11
53
6 1011
5
5
3 7
2
11 1
3
43
6
3
0
50
100
150
200
250
300
350
400
Q1 Q2 Q3 Q4 Q1 Q2 Q3 Q4 Q1 Q2 Q3 Q4 Q1 Q2 Q3 Q4 Q1 Q2
Mega
Large
Mid-market
Small
2007 2008 2009 2010 2011

| Creating lasting valueEVCA Quarterly Activity Indicator: Q1 2007-Q2 201119 |
Amount invested by sector in 2007All private equity
0.0 0.5 1.0 1.5 2.0 2.5 3.0 3.5
Unknown
Transportation
Real estate
Life sciences
Financial services
Energy and environment
Consumer services: Other
Consumer goods and retail
Construction
Computer and consumer electronics
Communications
Chemicals and materials
Business and industrial services
Business and industrial products
Agriculture
€ billion
Q4 2007
Q3 2007
Q2 2007
Q1 2007
Source: EVCA/PEREP_Analytics
| Creating lasting valueEVCA Quarterly Activity Indicator: Q1 2007-Q2 201120 |
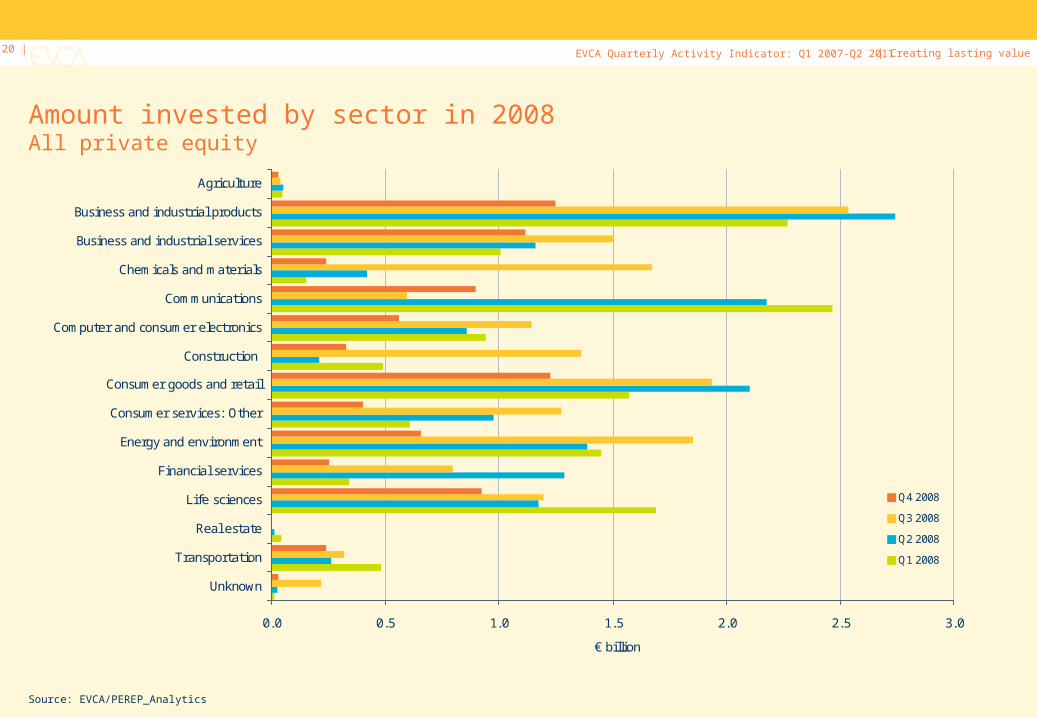
Amount invested by sector in 2008All private equity
0.0 0.5 1.0 1.5 2.0 2.5 3.0
Unknown
Transportation
Real estate
Life sciences
Financial services
Energy and environment
Consumer services: Other
Consumer goods and retail
Construction
Computer and consumer electronics
Communications
Chemicals and materials
Business and industrial services
Business and industrial products
Agriculture
€ billion
Q4 2008
Q3 2008
Q2 2008
Q1 2008
Source: EVCA/PEREP_Analytics

| Creating lasting valueEVCA Quarterly Activity Indicator: Q1 2007-Q2 201121 |
Amount invested by sector in 2009All private equity
0.0 0.2 0.4 0.6 0.8 1.0 1.2 1.4 1.6
Unknown
Transportation
Real estate
Life sciences
Financial services
Energy and environment
Consumer services: Other
Consumer goods and retail
Construction
Computer and consumer electronics
Communications
Chemicals and materials
Business and industrial services
Business and industrial products
Agriculture
€ billion
Q4 2009
Q3 2009
Q2 2009
Q1 2009
Source: EVCA/PEREP_Analytics

| Creating lasting valueEVCA Quarterly Activity Indicator: Q1 2007-Q2 201122 |
Amount invested by sector in 2010All private equity
0.0 0.5 1.0 1.5 2.0 2.5 3.0
Unknown
Transportation
Real estate
Life sciences
Financial services
Energy and environment
Consumer services: Other
Consumer goods and retail
Construction
Computer and consumer electronics
Communications
Chemicals and materials
Business and industrial services
Business and industrial products
Agriculture
€ billion
Q4 2010
Q3 2010
Q2 2010
Q1 2010
Source: EVCA/PEREP_Analytics

| Creating lasting valueEVCA Quarterly Activity Indicator: Q1 2007-Q2 201123 |
Amount invested by sector in 2011All private equity
Source: EVCA/PEREP_Analytics
0.0 0.2 0.4 0.6 0.8 1.0 1.2 1.4 1.6 1.8 2.0
Unknown
Transportation
Real estate
Life sciences
Financial services
Energy and environment
Consumer services: Other
Consumer goods and retail
Construction
Computer and consumer electronics
Communications
Chemicals and materials
Business and industrial services
Business and industrial products
Agriculture
€ billion
Q2 2011
Q1 2011

| Creating lasting valueEVCA Quarterly Activity Indicator: Q1 2007-Q2 201124 |
Amount invested by sector in 2007Venture capital
0 100 200 300 400 500 600
Unknown
Transportation
Real estate
Life sciences
Financial services
Energy and environment
Consumer services: Other
Consumer goods and retail
Construction
Computer and consumer electronics
Communications
Chemicals and materials
Business and industrial services
Business and industrial products
Agriculture
€ million
Q4 2007
Q3 2007
Q2 2007
Q1 2007
Source: EVCA/PEREP_Analytics

| Creating lasting valueEVCA Quarterly Activity Indicator: Q1 2007-Q2 201125 |
Amount invested by sector in 2008Venture capital
0 50 100 150 200 250 300 350 400
Unknown
Transportation
Real estate
Life sciences
Financial services
Energy and environment
Consumer services: Other
Consumer goods and retail
Construction
Computer and consumer electronics
Communications
Chemicals and materials
Business and industrial services
Business and industrial products
Agriculture
€ million
Q4 2008
Q3 2008
Q2 2008
Q1 2008
Source: EVCA/PEREP_Analytics

| Creating lasting valueEVCA Quarterly Activity Indicator: Q1 2007-Q2 201126 |
Amount invested by sector in 2009Venture capital
0 50 100 150 200 250 300 350 400
Unknown
Transportation
Real estate
Life sciences
Financial services
Energy and environment
Consumer services: Other
Consumer goods and retail
Construction
Computer and consumer electronics
Communications
Chemicals and materials
Business and industrial services
Business and industrial products
Agriculture
€ million
Q4 2009
Q3 2009
Q2 2009
Q1 2009
Source: EVCA/PEREP_Analytics

| Creating lasting valueEVCA Quarterly Activity Indicator: Q1 2007-Q2 201127 |
Amount invested by sector in 2010Venture capital
0 50 100 150 200 250 300 350
Unknown
Transportation
Real estate
Life sciences
Financial services
Energy and environment
Consumer services: Other
Consumer goods and retail
Construction
Computer and consumer electronics
Communications
Chemicals and materials
Business and industrial services
Business and industrial products
Agriculture
€ million
Q4 2010
Q3 2010
Q2 2010
Q1 2010
Source: EVCA/PEREP_Analytics

| Creating lasting valueEVCA Quarterly Activity Indicator: Q1 2007-Q2 201128 |
Amount invested by sector in 2011Venture capital
Source: EVCA/PEREP_Analytics
0 50 100 150 200 250 300
Unknown
Transportation
Real estate
Life sciences
Financial services
Energy and environment
Consumer services: Other
Consumer goods and retail
Construction
Computer and consumer electronics
Communications
Chemicals and materials
Business and industrial services
Business and industrial products
Agriculture
€ million
Q2 2011
Q1 2011

| Creating lasting valueEVCA Quarterly Activity Indicator: Q1 2007-Q2 201129 |
Amount invested by sector in 2007Buyout & growth
0 500 1,000 1,500 2,000 2,500 3,000
Unknown
Transportation
Real estate
Life sciences
Financial services
Energy and environment
Consumer services: Other
Consumer goods and retail
Construction
Computer and consumer electronics
Communications
Chemicals and materials
Business and industrial services
Business and industrial products
Agriculture
€ million
Q4 2007
Q3 2007
Q2 2007
Q1 2007
Source: EVCA/PEREP_Analytics

| Creating lasting valueEVCA Quarterly Activity Indicator: Q1 2007-Q2 201130 |
Amount invested by sector in 2008Buyout & growth
0 500 1,000 1,500 2,000 2,500
Unknown
Transportation
Real estate
Life sciences
Financial services
Energy and environment
Consumer services: Other
Consumer goods and retail
Construction
Computer and consumer electronics
Communications
Chemicals and materials
Business and industrial services
Business and industrial products
Agriculture
€ million
Q4 2008
Q3 2008
Q2 2008
Q1 2008
Source: EVCA/PEREP_Analytics

| Creating lasting valueEVCA Quarterly Activity Indicator: Q1 2007-Q2 201131 |
Amount invested by sector in 2009Buyout & growth
0 250 500 750 1,000 1,250 1,500
Unknown
Transportation
Real estate
Life sciences
Financial services
Energy and environment
Consumer services: Other
Consumer goods and retail
Construction
Computer and consumer electronics
Communications
Chemicals and materials
Business and industrial services
Business and industrial products
Agriculture
€ million
Q4 2009
Q3 2009
Q2 2009
Q1 2009
Source: EVCA/PEREP_Analytics

| Creating lasting valueEVCA Quarterly Activity Indicator: Q1 2007-Q2 201132 |
Amount invested by sector in 2010Buyout & growth
0 500 1,000 1,500 2,000 2,500 3,000
Unknown
Transportation
Real estate
Life sciences
Financial services
Energy and environment
Consumer services: Other
Consumer goods and retail
Construction
Computer and consumer electronics
Communications
Chemicals and materials
Business and industrial services
Business and industrial products
Agriculture
€ million
Q4 2010
Q3 2010
Q2 2010
Q1 2010
Source: EVCA/PEREP_Analytics

| Creating lasting valueEVCA Quarterly Activity Indicator: Q1 2007-Q2 201133 |
Amount invested by sector in 2011Buyout & growth
Source: EVCA/PEREP_Analytics
0 400 800 1,200 1,600 2,000
Unknown
Transportation
Real estate
Life sciences
Financial services
Energy and environment
Consumer services: Other
Consumer goods and retail
Construction
Computer and consumer electronics
Communications
Chemicals and materials
Business and industrial services
Business and industrial products
Agriculture
€ million
Q2 2011
Q1 2011

| Creating lasting valueEVCA Quarterly Activity Indicator: Q1 2007-Q2 201134 |
Divestment at cost - Evolution
Source: EVCA/PEREP_Analytics
8.3
6.0
6.8
5.8
3.5
4.4
3.6
2.52.2
1.8
3.1
4.44.7
5.0
4.1
5.2
6.8
4.1
0
1
2
3
4
5
6
7
8
9
Q1 Q2 Q3 Q4 Q1 Q2 Q3 Q4 Q1 Q2 Q3 Q4 Q1 Q2 Q3 Q4 Q1 Q2
€ billion
2007 2008 2009 2010 2011

| Creating lasting valueEVCA Quarterly Activity Indicator: Q1 2007-Q2 201135 |
Divestment at cost – Quarterly evolution
Index Q1 2007 = 100
Source: EVCA/PEREP_Analytics
0
20
40
60
80
100
120
Q1 Q2 Q3 Q4 Q1 Q2 Q3 Q4 Q1 Q2 Q3 Q4 Q1 Q2 Q3 Q4 Q1 Q2
2007 2008 2009 2010 2011

| Creating lasting valueEVCA Quarterly Activity Indicator: Q1 2007-Q2 201136 |
European private equity divestments – exit route trends(amount at cost divested)
Index Q1 2007 = 100
Source: EVCA/PEREP_Analytics
0
20
40
60
80
100
120
140
160
180
Q1 Q2 Q3 Q4 Q1 Q2 Q3 Q4 Q1 Q2 Q3 Q4 Q1 Q2 Q3 Q4 Q1 Q2
Trade sale
Sale to PE firms
Write-offs
Other
Total divestment
2007 2008 2009 2010 2011

| Creating lasting valueEVCA Quarterly Activity Indicator: Q1 2007-Q2 201137 |
Venture divestment at cost in 2007% of amount
28.2
38.5 37.9
21.1
1.8
17.7
9.9
13.8
17.0
18.3
7.8
4.1
6.5
11.9
9.6
19.8
1.4
1.6
2.0
2.517.7
1.3
10.0
1.8
9.0
3.2
3.7
21.7
1.3 5.32.45.7
4.2 2.3
11.44.8
9.8 10.50.22.5
0%
20%
40%
60%
80%
100%
Q1 2007 Q2 2007 Q3 2007 Q4 2007
Other means
Sale to Management (MBO)
Sale to Financial Institution
Sale to Another PE Player
Repayment of Principal Loans
Repayment of Silent Partnership
Write-Off
Sale of Quoted Equity
IPO
Trade Sale
Source: EVCA/PEREP_Analytics
| Creating lasting valueEVCA Quarterly Activity Indicator: Q1 2007-Q2 201138 |
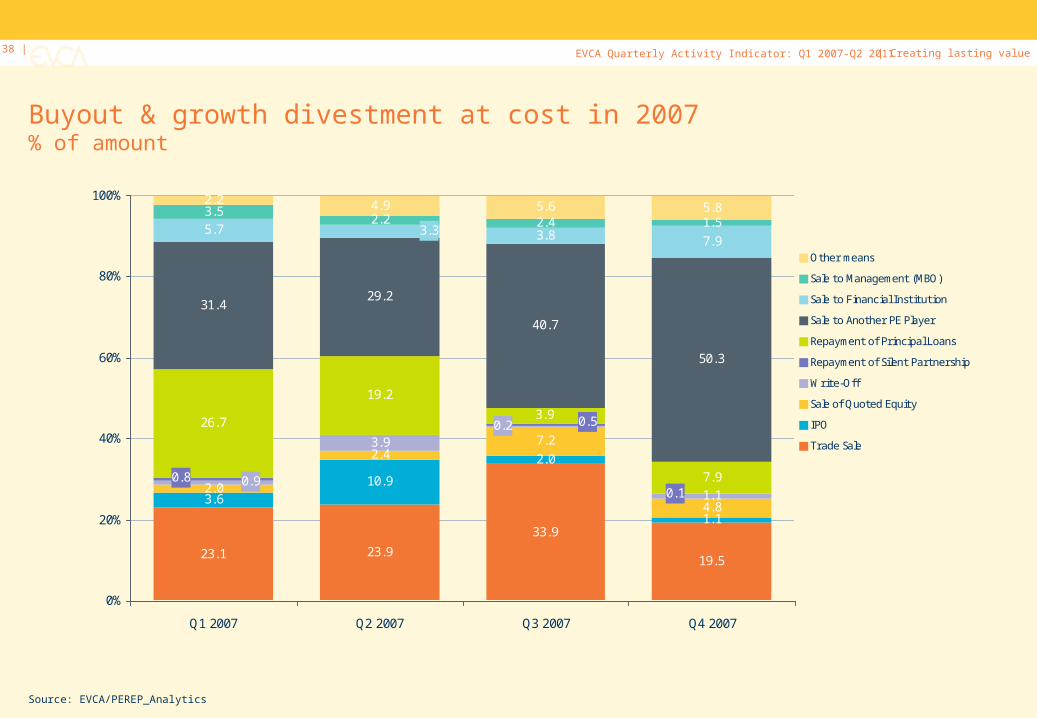
Buyout & growth divestment at cost in 2007% of amount
23.1 23.9
33.9
19.5
3.610.9
2.0
1.1
2.0
2.47.2
4.8
3.9
1.1
26.7
19.2
7.9
31.429.2
40.7
50.3
5.7 3.8 7.9
3.52.4 1.5
2.2 4.9 5.6 5.8
0.9
0.2
0.10.8
0.53.9
3.32.2
0%
20%
40%
60%
80%
100%
Q1 2007 Q2 2007 Q3 2007 Q4 2007
Other means
Sale to Management (MBO)
Sale to Financial Institution
Sale to Another PE Player
Repayment of Principal Loans
Repayment of Silent Partnership
Write-Off
Sale of Quoted Equity
IPO
Trade Sale
Source: EVCA/PEREP_Analytics
| Creating lasting valueEVCA Quarterly Activity Indicator: Q1 2007-Q2 201139 |
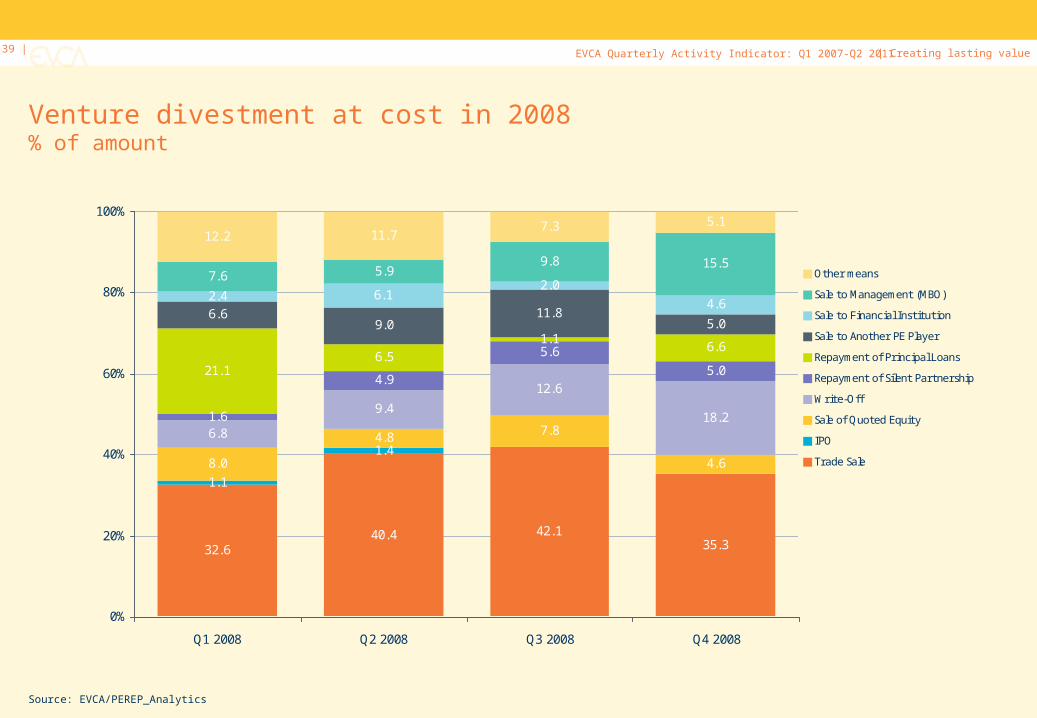
Venture divestment at cost in 2008% of amount
32.640.4 42.1
35.3
1.1
1.48.0
4.8 7.86.8
9.4
12.6
18.21.6
4.9
5.6
5.021.16.5
1.16.6
6.69.0
11.85.0
2.42.0
4.6
7.69.8 15.5
12.2 11.77.3 5.1
4.6
6.1
5.9
0%
20%
40%
60%
80%
100%
Q1 2008 Q2 2008 Q3 2008 Q4 2008
Other means
Sale to Management (MBO)
Sale to Financial Institution
Sale to Another PE Player
Repayment of Principal Loans
Repayment of Silent Partnership
Write-Off
Sale of Quoted Equity
IPO
Trade Sale
Source: EVCA/PEREP_Analytics

| Creating lasting valueEVCA Quarterly Activity Indicator: Q1 2007-Q2 201140 |
Buyout & growth divestment at cost in 2008% of amount
35.841.7
29.1
47.7
6.36.0
3.0
4.6
7.813.4
34.0
32.2
47.612.8
1.85.5
14.4
2.43.1
8.2
4.8 3.3 4.7
0.5
0.7
0.8
4.3
4.5
0.8
0.6
0.20.3
2.8
1.9
4.1
3.63.5
1.4
0%
20%
40%
60%
80%
100%
Q1 2008 Q2 2008 Q3 2008 Q4 2008
Other means
Sale to Management (MBO)
Sale to Financial Institution
Sale to Another PE Player
Repayment of Principal Loans
Repayment of Silent Partnership
Write-Off
Sale of Quoted Equity
IPO
Trade Sale
Source: EVCA/PEREP_Analytics

| Creating lasting valueEVCA Quarterly Activity Indicator: Q1 2007-Q2 201141 |
Venture divestment at cost in 2009% of amount
42.7
24.2 22.7
38.9
1.0
0.6
9.9
15.6 20.0
8.4
20.2
23.9 20.5
22.6
3.22.5
3.49.5
20.4
15.711.6
4.71.74.67.1
12.28.5
0.04
1.7 1.72.3 1.8
0.8
0.2
0.8
1.3
3.6
8.3
1.2
0%
20%
40%
60%
80%
100%
Q1 2009 Q2 2009 Q3 2009 Q4 2009
Other means
Sale to Management (MBO)
Sale to Financial Institution
Sale to Another PE Player
Repayment of Principal Loans
Repayment of Silent Partnership
Write-Off
Sale of Quoted Equity
IPO
Trade Sale
Source: EVCA/PEREP_Analytics

| Creating lasting valueEVCA Quarterly Activity Indicator: Q1 2007-Q2 201142 |
Buyout & growth divestment at cost in 2009% of amount
25.3
15.924.9
38.5
22.7
12.5
53.434.2
40.2
30.81.0
8.2
7.0
7.9
8.6
7.62.2 7.3
3.07.9 3.5 3.4
0.03
0.1
4.70.7
0.2
0.3
0.22.3
1.5
2.45.1
11.2
1.6 1.61.20.9
0%
20%
40%
60%
80%
100%
Q1 2009 Q2 2009 Q3 2009 Q4 2009
Other means
Sale to Management (MBO)
Sale to Financial Institution
Sale to Another PE Player
Repayment of Principal Loans
Repayment of Silent Partnership
Write-Off
Sale of Quoted Equity
IPO
Trade Sale
Source: EVCA/PEREP_Analytics

| Creating lasting valueEVCA Quarterly Activity Indicator: Q1 2007-Q2 201143 |
Venture divestment at cost in 2010% of amount
40.6 40.344.6
39.5
12.8 12.3
11.9
15.2
15.2 16.6 10.3 15.5
2.1 3.02.8
2.71.6
12.3 8.0
20.8 20.2
1.2 1.3
14.1
3.9 3.02.6 4.4
0.1
1.3
0.7
1.30.80.4
7.8
6.1
1.6 1.2
0%
20%
40%
60%
80%
100%
Q1 2010 Q2 2010 Q3 2010 Q4 2010
Other means
Sale to Management (MBO)
Sale to Financial Institution
Sale to Another PE Player
Repayment of Principal Loans
Repayment of Silent Partnership
Write-Off
Sale of Quoted Equity
IPO
Trade Sale
Source: EVCA/PEREP_Analytics
| Creating lasting valueEVCA Quarterly Activity Indicator: Q1 2007-Q2 201144 |
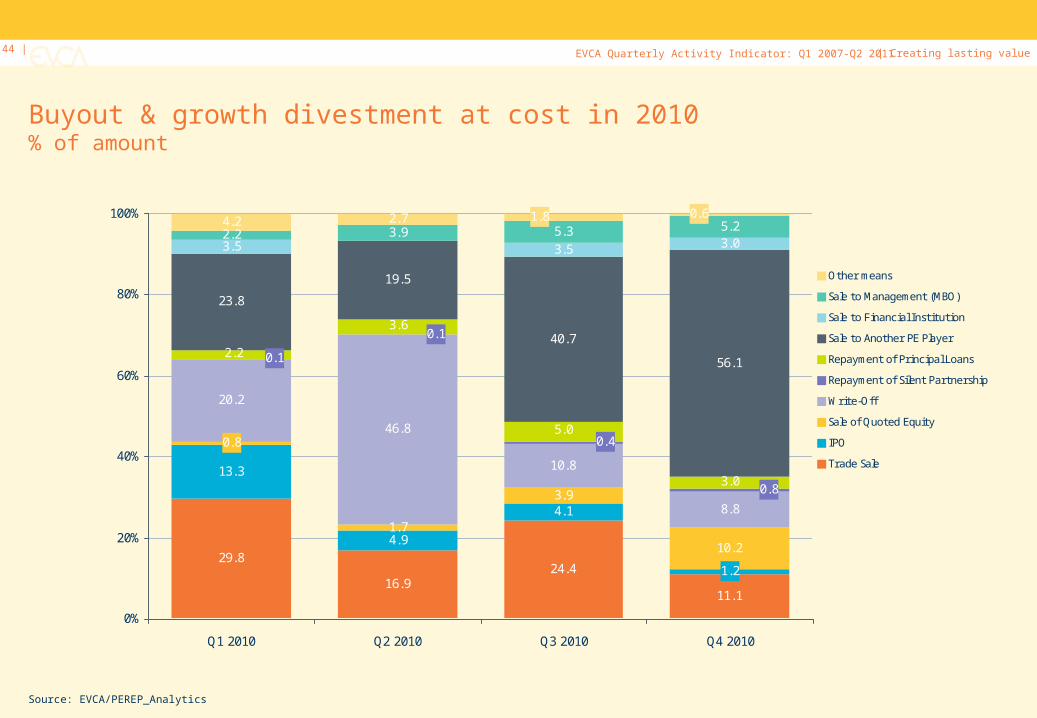
Buyout & growth divestment at cost in 2010% of amount
29.8
16.924.4
11.1
13.3
4.9
4.11.7
3.9
10.2
20.2
46.8
10.8
8.8
23.8
19.5
40.7
56.1
3.5 3.5 3.02.2 5.3 5.24.2 2.7
1.2
0.8
0.8
0.1
0.4
0.1
3.0
3.6
5.0
2.2
3.9
0.61.8
0%
20%
40%
60%
80%
100%
Q1 2010 Q2 2010 Q3 2010 Q4 2010
Other means
Sale to Management (MBO)
Sale to Financial Institution
Sale to Another PE Player
Repayment of Principal Loans
Repayment of Silent Partnership
Write-Off
Sale of Quoted Equity
IPO
Trade Sale
Source: EVCA/PEREP_Analytics
| Creating lasting valueEVCA Quarterly Activity Indicator: Q1 2007-Q2 201145 |
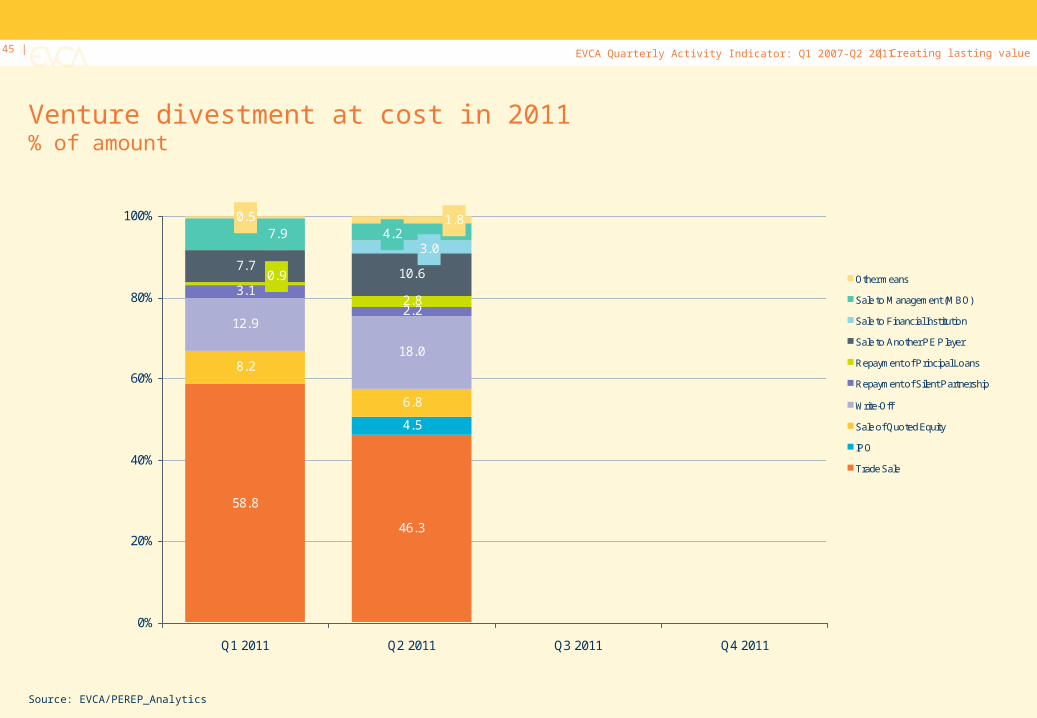
Venture divestment at cost in 2011% of amount
Source: EVCA/PEREP_Analytics
58.8
46.3
4.5
8.2
6.8
12.9
18.0
3.1
2.22.8
7.710.60.9
3.07.9 4.2
1.80.5
0%
20%
40%
60%
80%
100%
Q1 2011 Q2 2011 Q3 2011 Q4 2011
Other means
Sale to Management (MBO)
Sale to Financial Institution
Sale to Another PE Player
Repayment of Principal Loans
Repayment of Silent Partnership
Write-Off
Sale of Quoted Equity
IPO
Trade Sale

| Creating lasting valueEVCA Quarterly Activity Indicator: Q1 2007-Q2 201146 |
Buyout & growth divestment at cost in 2011% of amount
Source: EVCA/PEREP_Analytics
29.233.8
5.2
7.0
34.7
6.4
6.7
15.7
39.1
6.2 2.1
5.3
0.2
1.50.4
0.8
1.2 3.6 0.50.4
0%
20%
40%
60%
80%
100%
Q1 2011 Q2 2011 Q3 2011 Q4 2011
Other means
Sale to Management (MBO)
Sale to Financial Institution
Sale to Another PE Player
Repayment of Principal Loans
Repayment of Silent Partnership
Write-Off
Sale of Quoted Equity
IPO
Trade Sale
| Creating lasting valueEVCA Quarterly Activity Indicator: Q1 2007-Q2 201147 |
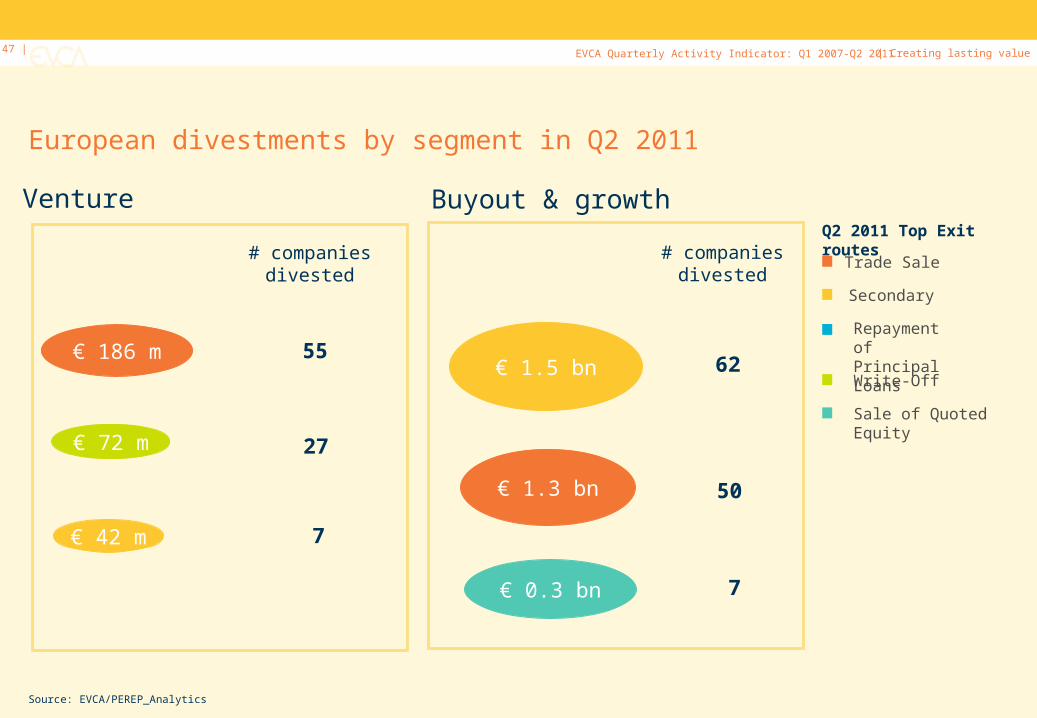
European divestments by segment in Q2 2011
Venture
€ 186 m
# companies divested
55
€ 72 m 27
€ 42 m 7
Buyout & growth
# companies divested
€ 1.3 bn
€ 1.5 bn
€ 0.3 bn
62
50
7
Q2 2011 Top Exit routes
Secondary
Trade Sale
Write-Off
Source: EVCA/PEREP_Analytics
Repayment of Principal Loans
Sale of Quoted Equity
| Creating lasting valueEVCA Quarterly Activity Indicator: Q1 2007-Q2 201148 |
Conclusions
Fundraising picked-up again in the second quarter of 2011, to €10.5bn, compared with €6.9bn raised in the first quarter of the year. The increase was primarily driven by an increase in growth capital fundraising from €0.3bn in Q1 to €3.6bn in Q2.
Investment value rose, from €8.4bn in Q1 2011 to €9.9bn in Q2 2011. Like in Q1 more than 1000 companies received investments in the second quarter.
Buyout investment (including replacement capital and rescue/turnaround) increased by 25% from Q1 2011, to €8bn. Growth capital investment again remained stable at €1.2bn. Venture capital investment decreased by 11% to €0.7bn.
Divestment at cost (excluding write-offs) fell in Q2 2011 to €4bn (€4.5bn in Q1 2011). More than 400 companies were exited. The amount written-off in Q2 2011 fell to €0.1bn (€2.3bn Q1 2011).
A total of 104 companies were exited via trade sale, for a total amount at cost of €1.4bn. Sales to another private equity firm came next with €1.5bn divested at cost from 67 companies.

| Creating lasting valueEVCA Quarterly Activity Indicator: Q1 2007-Q2 201149 |
EVCA European Private Equity and Venture Capital AssociationBastion Tower Place du Champs de Mars 5B – 1050 Brussels – Belgium
www.evca.euTel: +32 2 715 00 20