evaluation of the strategic staffing initiative · evaluation of the strategic staffing initiative...
TRANSCRIPT

REACH FURTHER.Global competitiveness starts here.
Center for Research & EvaluationOffice of Accountability
Evaluation of the Strategic Staffing InitiativeJanuary 2011


Evaluation of the Strategic Staffing Initiative In Charlotte-Mecklenburg Schools
January, 2011
Prepared by:
Jason A. SchoenebergerSenior Analyst, Center for Research & Evaluation, Charlotte-Mecklenburg Schools
Cheryl L. PulliamDirector, Public Education Research Institute at Queens, Queens University of Charlotte
Center for Research & Evaluation Office of Accountability
Charlotte-Mecklenburg Schools
For more information, contact: Center for Research & Evaluation
(980) 343-6242
©2011, Charlotte-Mecklenburg Schools
Dr. Christian FriendDirector of the Center
for Research and Evaluation
Dr. Lynne TingleExecutive Director of
Performance Management
Robert AvossaChief Accountability Officer
Dr. Peter GormanSuperintendent


TABLE OF CONTENTSExecutive Summary ....................................................................... 1
Introduction................................................................................... 4
Method ........................................................................................... 5
Results ............................................................................................ 8
Discussion .................................................................................... 68
References .................................................................................... 70
TABLESTable 1. Strategic Staffing Analytic Groupings by Cohort. ........6
Table 2. Strategic Staffing Schools and Composite Comparison 2009-10 Demographic Summary, by Cohort...............................8
Table 2 (cont.). Strategic Staffing Schools and Composite Comparison 2009-10 Race/Ethnicity Summary, by Cohort. .....9
Table 3. Mathematics Contrast Estimates for Analytical Groups 1 and 2. .......................................................... 24
Table 4. Reading Contrast Estimates for Analytical Groups 1 and 2. .......................................................... 25
Table 5. Mathematics Contrast Estimates for Analytical Groups 3 and 4. .......................................................... 26
Table 6. Reading Contrast Estimates for Analytical Groups 3 and 4. .......................................................... 27
Table 7. Mathematics Contrast Estimates for Analytical Groups 5 and 6. .......................................................... 28
Table 8. Reading Contrast Estimates for Analytical Groups 5 and 6. .......................................................... 29
Table 10. Cohort 1-Reading, Math & Science Proficiency for 2008-09 and 2009-10 by Teacher Type (NSS=Non-SS). .......... 31
Table 11. Cohort 2-Reading, Math & Science Proficiency for 2009-10 by Teacher Type (NSS=Non-SS) ........................... 32
Table 12. Cohort 1-Reading & Math Growth for 2008-09 and 2009-10 by Teacher Type (NSS=Non-SS). ......................... 32
Table 13. Cohort 2-Reading & Math Growth for 2009-10 by Teacher Type (NSS=Non-SS). ................................ 33
Table 9. Teacher Survey Response Rates by School and Cohort for 2008-09 and 2009-10. ....................................... 34
Table 11. Philosophy for Turning Around a School: Opinion at End of Year 2 and Year 1 .......................................... 46
Table 12. Organizational Changes Made by Principal at Strategic Staffing School: Comparing Year 1 and Year 2. ........ 51
Table 13. Principals’ Area of Focus by Year ............................... 52
Table 14. Principal Plans for the End of Their Third Year. ...... 53
Table 15. Number of Years as a Principal: Cohort 2 Compared to Cohort 1 First Year. .............................................. 54
Table 16. Number of Principal with Title I Experience: Cohort 2 Compared to Cohort 1 First Year. ............................. 54
Table 17. Leadership Styles of the Principals: Cohort 2 Compared to Cohort 1 First Year .............................. 56
Table 18. Leadership Team Members Brought to the SSI School ........................................................................... 56
Table 19. Philosophy for Turning a School Around: Cohort 2 Compared to Cohort 1 First Year .............................. 57
Table 20. Most Pressing Issues Noticed First When Beginning Principal at Strategic Staffing School: Cohort 2 Compared to Cohort 1 First Year .............................. 58
Table 21. First Action Taken When Beginning Principal at Strategic Staffing School: Cohort 2 Compared to Cohort 1 First Year ....................................................................... 60
Table 22. First-Year Initiatives Focused on the Instructional Program As Indicated by the Principals: Cohort 2 Compared to Cohort 1 First Year .............................. 62
Table 23. First-Year Initiatives Focused on the School Operations As Indicated by the Principals: Cohort 2 Compared to Cohort 1 First Year .............................. 64
Table 24. Other First-Year Initiatives As Indicated by the Principals: Cohort 2 Compared to Cohort 1 First Year .......... 65
Table 25. Focus by the Principals During the First Two Years .............................................................................. 66
Table 26. Biggest First-Year Challenges Faced by Principals ....................................................................... 67
Table 27. Cohort 2 Principals’ Plans for the End of Their Third Year ............................................................... 67

Figure 1. Cohort 1-School Level Reading Proficiency for 2007-08, 2008-09 and 2009-10. ............................................ 10Figure 2. Cohort 2-School Level Reading Proficiency for 2007-08, 2008-09 and 2009-10. ............................................ 11Figure 3. Cohort 1-School Level Mathematics Proficiency for 2007-08, 2008-09 and 2009-10. ............................................ 12Figure 4. Cohort 2-School Level Mathematics Proficiency for 2007-08, 2008-09 and 2009-10. ............................................ 13Figure 5. Cohort 1-School Level Science Proficiency for 2008-09 and 2009-10.............................................................. 14Figure 6. Cohort 2-School Level Science Proficiency for 2008-09 and 2009-10.............................................................. 15Figure 7. Cohort 1-School Level Reading Growth for 2008-09 and 2009-10.............................................................. 16Figure 8. Cohort 2-School Level Reading Growth for 2008-09 and 2009-10.............................................................. 17Figure 9. Cohort 1-School Level Math Growth for 2007-08, 2008-09 and 2009-10. ............................................ 18Figure 10. Cohort 2-School Level Math Growth for 2007-08, 2008-09 and 2009-10. ............................................ 19Figure 11. Cohort 1 & 2-School Level Algebra 1 Growth for 2007-08, 2008-09 and 2009-10. ............................................ 20Figure 12. Cohort 1-School Level Attendance Rates for 2007-08, 2008-09 and 2009-10. ............................................ 21Figure 13. Cohort 2-School Level Attendance Rates for 2007-08, 2008-09 and 2009-10. ............................................ 22Figure 14. Cohort 1-School Level Percent of Total Absences, by Type, for 2007-08, 2008-09 and 2009-10. ............................. 23Figure 15. Cohort 2-School Level Percent of Total Absences, by Type, for 2007-08, 2008-09 and 2009-10. ............................. 23Figure 16. Mathematics Profile Plot for Analytical Groups 1 and 2. .......................................................... 25
Figure 17. Reading Profile Plot for Analytical Groups 1 and 2. .......................................................... 26Figure 18. Mathematics Profile Plot for Analytical Groups 3 and 4. .......................................................... 27Figure 19. Reading Profile Plot for Analytical Groups 3 and 4. .......................................................... 28Figure 20. Mathematics Profile Plot for Analytical Groups 5 and 6. .......................................................... 29Figure 21. Reading Profile Plot for Analytical Groups 5 and 6. .......................................................... 30Figure 22. Cohort 1-Principal Standards Mean Scores for 2008-09 and 2009-10.............................................................. 35Figure 23. Cohort 2-Principal Standards Mean Scores for 2008-09 and 2009-10.............................................................. 36Figure 24. Cohort 1-Safety and Behavior: Consistency by Administration Mean Scores for 2008-09 and 2009-10. ......... 37Figure 25. Cohort 2-Safety and Behavior: Consistency by Administration Mean Scores for 2008-09 and 2009-10. ......... 38Figure 26. Cohort 1-Safety and Behavior: Consequences Mean Scores for 2008-09 and 2009-10. ..................................... 39Figure 27. Cohort 2-Safety and Behavior: Consequences Mean Scores for 2008-09 and 2009-10. ..................................... 40Figure 28. Cohort 1-Safety and Behavior: Expectations and Perceptions Mean Scores for 2008-09 and 2009-10. ................ 41Figure 29. Cohort 2-Safety and Behavior: Expectations and Perceptions Mean Scores for 2008-09 and 2009-10. ................ 42Figure 30. Cohort 1-Severity of School Problems Mean Scores for 2008-09 and 2009-10.............................................................. 43Figure 31. Cohort 2-Severity of School Problems Mean Scores for 2008-09 and 2009-10.............................................................. 44
FIGURES

January 2011 Evaluation of Strategic Staffing | 1
Office of Accountability | Center for Research and Evaluation
EXECUTIVE SUMMARYCharlotte-Mecklenburg Schools’ (CMS) Strategic Staffing (SS) initiative is founded upon the logic that strong leadership is a key ingredient necessary to effect change in low-performing schools. CMS created the SS initiative focusing on school instructional and operational leadership. In 2008, CMS selected seven schools to be part of its SS initiative. Each of the principals of these schools could bring an assistant principal, a behavior management technician, academic facilitators and up to five teachers to be part of his or her instructional and organizational management leadership team. A second cohort of seven SS schools underwent their initial year of change during the 2009-10 school year.
This is the second interim report, generated to report on the progress of the seven schools compris-ing Cohort 1 and the seven schools comprising Cohort 2. Quantitative and qualitative analyses were performed to determine trends for schools comprising Cohort 1 and initial results for schools from Cohort 2. Similar to the first interim report (Pulliam, Tingle & Schoeneberger, 2010), we sought to examine changes in student achievement and culture and to determine whether school outcomes in the first (Cohort 2) and second (Cohort 1) years were the result of differences in focus and initiatives put into place by the principal. We also investigated whether specific practices and policies a principal put into place were dependent upon his or her philosophy for turning around a school, his or her leader-ship style, and their own background.
The research questions posed around these concepts were:1. What is the impact of the SS initiative on student achievement, as measured by perfor-
mance on NC standardized assessments, including:a. School-level proficiencyb. School-level ABC growth measures
2. What is the impact of the SS initiative on student achievement, as measured by student attendance indicators aggregated to the school level?
3. What is the impact of the SS initiative on the culture of a school, as measured by student attendance indicators and teacher survey perceptions?
4. What impact did teachers recruited through the SS initiative have on student achieve-ment compared to non-SS teachers?
5. What are the policies and practices instituted at SS sites and how have these changed in year 2, as determined through principal interviews?
General quantitative conclusions include the following:• With respect to End-of-Grade (EOG) results across reading, math and science, SS schools
tended to show an increase in the percent of students attaining proficiency. Principals with the most directive leadership styles in their first year appeared to have larger gains in the percentage of students who were proficient on their end-of-grade tests.
• SS schools with higher percentages of proficient students than the other SS schools after becoming an SS school also had had a greater percentage prior to being named an SS school; those that were lower prior to being named an SS school tended to remain lower even after the first or second year.

2 | Evaluation of Strategic Staffing January 2011
Office of Accountability | Center for Research and Evaluation
• Schools that had a smaller number of faculty (where replacing five teachers represents a large percentage of staff) or high teacher turnover rates prior to a new principal’s arrival tended to have greater increases in proficiency and growth than schools where the five teachers represented a smaller percentage of the total staff.
• Based on ABC Growth measures, SS schools tended to show increases, though about half were unable to outpace the collective comparison schools. Principals with the most direc-tive leadership styles in their first year appeared to have larger growth gains, though the amount of growth tended to decline in year 2 for these same principals.
• Those schools with the largest percentage of proficient students tended to be the schools that showed declines in the amount of growth for the students.
• Rates of student attendance were generally good across all SS schools, with a few schools increasing/maintaining rates, and several outpacing the comparison schools.
• Across time, SS students were able to close the mathematics gap on a synthetic compari-son group in two out of three analyses. SS students were unable to close the reading gap.
• For Teacher Survey results, Westerly Hills and Sterling tended to have the highest means across constructs from Cohort 1, Paw Creek and Ashley Park tended to have the highest mean constructs scores in Cohort 2. In particular, Westerly Hills and Ashley Park exhib-ited the highest Principal Standards construct scores in 2009-10. These are indicative of general teacher satisfaction.
• In Cohort 2, the schools with the most dramatic changes in instructional methods increased student achievement and also saw the largest increase in Principal Standards mean scores. While this seems to be counterintuitive, upon closer examination, research-ers found these principals often eliminated many of the various reading and math programs being used and instead returned to teacher instruction using basic materials and creating supplemental materials to meet the needs of the students.
• The mean Principal Standard Scores still appear to indicate that the more distributive a principal is in his or her leadership style, the higher the scores. The one principal in Cohort 1 who tended to be more directive in year 2 than in year 1 did see a drop in her mean score but increased student proficiency and growth.
• The majority of the schools saw large increases in growth (particularly in math), indicat-ing that while moving closer to the comparison schools in proficiency, two years had not been long enough for these schools to catch up in every aspect.
• Comparisons based on student achievement between SS and non-SS teachers tended to reveal higher levels of performance for students instructed by SS teachers, but the pattern was neither consistent nor overwhelmingly significant. In some subjects within particu-lar schools, a consistent pattern can be noted and may be worth further investigation. Overall, these comparisons reveal trends similar to other analyses presented herein, where the unique factors facing each teacher in each school setting with their own students com-plicate understanding of the impact of the SS initiative as a whole.

January 2011 Evaluation of Strategic Staffing | 3
Office of Accountability | Center for Research and Evaluation
General qualitative conclusions include the following:
• SS schools are fragile, and each principal must choose a leadership style that aligns to the reform stage of the school. As such, it takes time to build authentic distributed leadership where trust and mutual respect among faculty and staff are fostered.
• Early successes are crucial in building relationships and sustainable buy-in with faculty, community, and students. These relationships are essential in raising and sustaining student achievement.
• Principals instituting a large number of initiatives and programs during the year reported higher levels of fatigue than those who tended emphasize their focus on only a few areas.

4 | Evaluation of Strategic Staffing January 2011
Office of Accountability | Center for Research and Evaluation
INTRODUCTIONEducation policymakers across the country continue to search for methods to improve student achieve-ment. Given the variability of estimated impacts within the education research literature, educators recognize that no singular strategy exists for turning a low performing school into a high performing school (Elmore, 2002; Malen, Croninger, Muncey, & Redmond-Jones, 2002). However, strong lead-ership is considered a key ingredient necessary to effect change (Camburn, Rowan, & Taylor, 2003; Elmore, R., 2000). Charlotte-Mecklenburg Schools’ (CMS) Strategic Staffing (SS) initiative is founded upon that logic: identifying key leadership and staff and placing them in low-performing schools most in need of assistance.
CMS created the SS initiative focusing on school instructional and operational leadership. In 2008, CMS selected seven schools to be part of its SS initiative. As part of the initiative, a principal who had been deemed highly successful was named to lead each of these seven schools. Each of these princi-pals, who began serving in those schools July 1, 2008, could bring an assistant principal, a behavior management technician, and academic facilitators to be part of his or her instructional and organiza-tional management leadership team. In addition to these individuals, the principal could bring up to five teachers who had demonstrated success in growing their students. Each principal, as well as the selected leaders and teachers, committed to three years at this school. Teachers who agreed to teach in a Strategic Staffing school received a $10,000 bonus for the first year and a $5,000 bonus for the next two years. Principals who relocated to a Strategic Staffing school received a 10% pay increase. In addition, to raise student achievement these principals were given more autonomy than most to put initiatives and policies in place. The second cohort of SS principals began their new positions in March 2009. They received the same incentives as the first cohort.
This is the second interim report, generated to report on the progress of the seven schools compris-ing Cohort 1 and the seven schools comprising Cohort 2. Quantitative and qualitative analyses were performed to determine trends for schools comprising Cohort 1 and initial results for schools from Cohort 2. Similar to the first interim report (Pulliam, Tingle & Schoeneberger, 2010), we sought to examine changes in student achievement and culture and to determine whether school outcomes in the first (Cohort 2) and second (Cohort 1) years were the result of differences in focus and initiatives put into place by the principal. We also investigated whether specific practices and policies a principal put into place were dependent upon his or her philosophy for turning around a school, his or her leader-ship style, and their own background. Determining these factors and efforts will help us contextualize long-term outcomes and sustainability for all Strategic Staffing schools.
Research Questions1. What is the impact of the SS initiative on student achievement, as measured by perfor-
mance on NC standardized assessments, including:a. School-level proficiencyb. School-level ABC growth measures
2. What is the impact of the SS initiative on student achievement, as measured by student attendance indicators aggregated to the school level?

January 2011 Evaluation of Strategic Staffing | 5
Office of Accountability | Center for Research and Evaluation
3. What is the impact of the SS initiative on the culture of a school, as measured by student attendance indicators and teacher survey perceptions?
4. What impact did teachers recruited through the SS initiative have on student achieve-ment compared to non-SS teachers?
5. What are the policies and practices instituted at SS sites and how have these changed in year 2, as determined through principal interviews?
METHODData UsedWe made use of both quantitative and qualitative methods to analyze the SS initiative. Included in the study were student standardized test scores, student attendance/suspension data and teacher survey results. A listing of all staff recruited to SS schools was obtained for matching against student records. In addition, information about the principals and their initiatives during the first and second years of leadership in these schools was gathered through individual interviews with each principal.
Participant School SelectionFor the Year-1 interim report, each of the seven SS Cohort-1 schools was paired with a similar school based on a matching routine taking into account student demographics and academic outcomes (test scores, attendance, etc.). This proved challenging, as the SS schools are unique in that they are the lowest performing schools in CMS. Further, many of the best potential matches were slated to become SS schools in subsequent cohorts. As such, many of the schools utilized as comparisons during the Year-1 report were not as comparable as we would have liked. During the presentation of Year-1 results to Executive Staff, leadership expressed concern over the identified comparison schools. In response to these concerns, the Center for Research & Evaluation (CRE) identified comparison schools for the first and second SS cohorts prior to conducting analyses. Executive Staff again expressed concern about assigning entire schools as comparison schools for the study. A suggestion was made to conduct a pro-pensity-based matching routine, whereby SS students from the first and second cohort schools would be individually matched to specific students attending a pool of identified comparison schools on a number of background demographic and behavioral variables (Rosenbaum & Rubin, 1983; Rosenbaum & Rubin, 1984; Rubin, 2004).
Propensity-matching involves predicting treatment membership (where control=0 or treatment=1) for a pool of students comprised of those students who we know received the treatment (attended a SS school) and students attending the identified comparison schools. This prediction is made based on a vector of covariates; specifically gender, race, Limited English Proficiency (LEP), Exceptional Child Status (EC), Gifted, grade-level, age, a flag denoting overage-for-grade, and a flag denoting whether the student had been retained-in-grade from the previous year. In addition, students’ attendance data (unexcused and excused absences, as well as out-of-school and in-school suspensions), days enrolled in school, and counts of student involvement in incidents and violent incidents were also included.

6 | Evaluation of Strategic Staffing January 2011
Office of Accountability | Center for Research and Evaluation
Finally, student test scores from the prior year (for those attending a SS school in 2008-09, this would be the 2007-08 school year) were included. Based on these data, a student’s predicted probability of being in the treatment group is generated. Then, each SS student is matched to a control student based on the predicted probability for the comparison student, as a student with a vector of data similar to the treatment student should have a similar predicted probability. Through this process, we hoped to create ‘similar’ matched groups.
Table 1 below shows the different analytic groupings that had to be created in order to efficiently prog-ress with the propensity-based matching procedure. In all, there were six types, where T = treatment (SS), C=control (attended a comparison school) and ‘ ‘ means a student did not attend a treatment or comparison school. For analytic purposes, matched groups 1 and 2 are analyzed together, where 1 is the treatment group (attended a SS school in the 2008-09 and 2009-10 school years) and 2 is the control group (attended a comparison school in both years). Groups 3 and 4 are also analyzed together, with group 3 serving as the treatment (comprised of students attending a SS school in 2009-10 only). Finally, groups 5 and 6 were analyzed together, where group 5 served as the treatment group (attending a SS school in 2008-09 only). In particular for groups 1 and 2, note that a student may have attended one SS (or comparison) school in 2008-09 and then transferred to a different SS (or comparison) school in 2009-10. Because the propensity matching procedure utilized a single record of data for each student, it was not possible to account for this type of mobility.
Table 1. Strategic Staffing Analytic Groupings by Cohort.
Experimental Group
Type 08-09 09-10
1 T T2 C C
3 C or ' ' T4 ' ' C
5 T C or ' '6 C ' '
The ability of the propensity-matching method to extract quasi-similar groups is dependent upon the quality of the potential comparison case pool. A large enough pool of potential matches, ostensibly possessing characteristics similar to cases in the treatment group is necessary from which to draw the matches. In the case of the SS evaluation, an ideal pool of potential students did not exist, as the majority of best-matching student already attend a SS school. Nearly 35% of all variables used in the matching routine were still significantly different after the propensity routine, suggesting that the matching worked less well than would normally be expected were an appropriate comparison pool available. Thus, we also present a number of the outcomes here by showing SS school-level results compared to an overall comparison group mean, calculated across the entire comparison school pool. The reader should note that these two methods result in two different sets of students being used for comparisons. As will be shown, trends across the different methods of analysis may not necessarily yield congruent conclusions.
January 2011 Evaluation of Strategic Staffing | 7
Office of Accountability | Center for Research and Evaluation
Data SourcesStudent demographic and achievement data for the 2007-08, 2008-09 and 2009-10 school years were obtained through the CMS data warehouse. Included in the data file for analysis were all student demo-graphic indicators (gender, race/ethnicity, LEP, EC statuses), end-of-grade (EOG) test scores in reading, mathematics and science, North Carolina ABC growth estimates, attendance information (unexcused and excused absences, as well as out-of-school and in-school suspensions), a school-to-school mobility indicator for each student and student-level incident information.
In addition, results from the annual CMS Teacher Survey for the last three years were obtained. Individual, yet anonymous, teacher data were obtained for staff assigned to the schools analyzed in this project. Individual data were summarized to represent several constructs identified during the processing of the Teacher Survey results: Principal leadership and performance, safety and behavior within the school, and the school environment as a whole. Analyses were conducted based on the sum-marized, construct form of the results. Throughout most of the survey, teachers indicated whether they strongly disagreed, disagreed, agreed, or strongly agreed with each statement. Degree of agreement was translated to a numerical equivalency ranging from strongly disagree being a 1 to strongly agree being a 4. One group of items had a 3-point scale (always, sometimes, and never) and another group of items had a 4 point scale that consisted of serious problem, moderate problem, minor problem, and not a problem at all. Response rates for the surveys in the years analyzed are presented in the results section.
Qualitative methodsWe interviewed each of the Strategic Staffing principals individually. These principals comprised both those in the first cohort of principals and those in the second cohort. In all cases, we sought to dis-cover what these fourteen principals believe are the key components in successfully turning around a low-performing school. Not only were they asked about their philosophy, but they were asked about specific actions they took instructionally and operationally to improve the learning and teaching envi-ronment and to increase student achievement. Results obtained from the second cohort of principals after their first year were compared to results obtained from the first cohort after their first year. The same questions were asked both years. In addition, results from the first cohort after their second year were compared to results after their first year to see how their actions had changed. Researchers also looked at how leadership styles evolved from one year to the next.

8 | Evaluation of Strategic Staffing January 2011
Office of Accountability | Center for Research and Evaluation
RESULTSThe following two tables display demographic summaries for the SS schools and the overall compari-son composite based on data from 2009-10 school year. Note however the differences with respect the Economically Disadvantaged column and the distribution of students across the various race/ethnicity categories. This provides our first indication of the difficulties faced in creating a synthetic comparison group via propensity-matching.
Table 2. Strategic Staffing Schools and Composite Comparison 2009-10 Demographic Summary, by Cohort.
Gender Economically Disadvantaged
LEP EC Gifted
Cohort 1 Male Female No Yes No Yes No Yes No Yes
Briarwood (n=337)
54.4% 45.6% 10.1% 89.9% 66.6% 33.4% 89.1% 10.9% 98.5% 1.5%
Bruns Ave (n=262)
52.2% 47.8% 5.7% 94.3% 91.7% 8.3% 87.4% 12.6% 98.2% 1.8%
Devonshire (n=271)
54.5% 45.5% 3.2% 96.8% 59.0% 41.0% 87.5% 12.5% 99.6% 0.4%
Reid Park (n=308) 48.9% 51.1% 5.1% 94.9% 95.8% 4.2% 86.2% 13.8% 99.3% 0.7%Sterling (n=236) 53.5% 46.5% 8.9% 91.1% 72.6% 27.4% 90.9% 9.1% 99.0% 1.0%Westerly Hills (n=168)
52.2% 47.8% 5.8% 94.2% 85.1% 14.9% 90.0% 10.0% 98.3% 1.7%
Ranson (n=1219) 49.7% 50.3% 21.9% 78.1% 87.8% 12.2% 88.2% 11.8% 95.1% 4.9%Cohort 2
Allenbrook (n=436)
49.3% 50.7% 5.0% 95.0% 82.8% 17.2% 86.9% 13.1% 98.4% 1.6%
Ashley Park (n=261)
47.9% 52.1% 7.0% 93.0% 94.3% 5.7% 80.1% 19.9% 99.6% 0.4%
Druid Hills (n=410)
56.1% 43.9% 7.2% 92.8% 89.8% 10.2% 83.2% 16.8% 99.5% 0.5%
Paw Creek (n=610)
53.4% 46.6% 28.7% 71.3% 82.3% 17.7% 85.6% 14.4% 96.9% 3.1%
Thomasboro (n=338)
46.2% 53.8% 4.9% 95.1% 81.1% 18.9% 87.9% 12.1% 99.4% 0.6%
Albemarle Mid (n=859)
52.2% 47.8% 17.3% 82.7% 65.1% 34.9% 88.5% 11.5% 94.8% 5.2%
Spaugh Mid (n=580)
52.8% 47.2% 7.1% 92.9% 89.5% 10.5% 82.9% 17.1% 97.9% 2.1%
Comparison (n=595)
51.4% 48.6% 19.7% 80.3% 75.1% 24.9% 88.4% 11.6% 96.9% 3.1%

January 2011 Evaluation of Strategic Staffing | 9
Office of Accountability | Center for Research and Evaluation
Table 2 (cont.). Strategic Staffing Schools and Composite Comparison 2009-10 Race/Ethnicity Summary, by Cohort.
Cohort 1 Asian African American Hispanic Native American Multi White
Briarwood (n=337) 3.0% 54.6% 35.7% 0.5% 3.0% 3.2%Bruns Ave (n=262) 2.0% 88.5% 6.5% 0.9% 2.0% 0.2%Devonshire (n=271) 3.4% 51.1% 42.2% 0.2% 1.7% 1.5%Reid Park (n=308) 2.6% 92.3% 2.2% 0.6% 1.7% 0.7%Sterling (n=236) 0.6% 52.9% 37.1% 1.5% 5.0% 2.9%Westerly Hills (n=168) 14.2% 74.4% 3.8% 0.7% 2.8% 4.2%Ranson (n=1219) 3.1% 74.9% 12.7% 1.0% 3.8% 4.5%
Cohort 2
Allenbrook (n=436) 12.4% 64.9% 14.0% 0.9% 4.8% 3.0%Ashley Park (n=261) 1.9% 87.7% 3.1% 0.8% 4.6% 1.9%Druid Hills (n=410) 3.4% 85.6% 6.6% 0.0% 3.9% 0.5%Paw Creek (n=610) 3.0% 54.1% 18.7% 0.8% 5.4% 18.0%Thomasboro (n=338) 11.8% 71.9% 8.9% 0.0% 3.8% 3.6%Albemarle Mid (n=859) 3.8% 52.6% 33.2% 0.0% 3.6% 6.8%Spaugh Mid (n=580) 6.7% 82.1% 5.5% 0.0% 1.9% 3.8%
Comparison (n=595) 5.2% 55.8% 25.9% 0.6% 3.9% 8.7%
ProficiencySchool-level student proficiency on EOG assessments was obtained for the last three years, including 2007-08 (prior to SS), 2008-09 (beginning of SS for Cohort 1 schools), and 2009-10 (beginning of SS for Cohort 2 schools). Stacked bar graphs were used to show school proficiency without retests (area below black line within each bar) and with retests included (area above black line). Note that for 2007-08, no retests were included at all. Note that the colored, horizontal lines ‘behind’ the bars represent the mean percent proficient (retests not included) for the pool of all comparison schools corresponding to the year (color) represented on the bottom axis. Thus, the green line represents the mean percent proficient for the 2009-10 school year. A separate graph was generated for each cohort of SS schools. Note that for Cohort 2 schools, SS principals spent the last three months of the 2008-09 school year at the SS school where they were placed for the 2009-10 school year. In some instances, principals worked to improve student achievement during these final three months. That said, when comparing results for Cohort 2 across time, the SS principal may have had some amount of influence on student performance during the 2008-09 testing period.

10 | Evaluation of Strategic Staffing January 2011
Office of Accountability | Center for Research and Evaluation
Figure 1 below shows the school level reading proficiency for all three years for the SS schools from Cohort 1. Thus, data from 2008-09 and 2009-10 represent the years these schools were SS schools, while the data for 2007-08 represent the year prior to becoming a SS school. Generally, across all schools, the percent proficient increased or maintained across the three years. We can also see, however, that only Sterling managed to attain a higher level of proficiency in 2009-10 compared to average of the compari-son schools in that same year.
Figure 1. Cohort 1-School Level Reading Proficiency for 2007-08, 2008-09 and 2009-10.

January 2011 Evaluation of Strategic Staffing | 11
Office of Accountability | Center for Research and Evaluation
Figure 2 below shows the school level Reading proficiency for all three years for the SS schools from Cohort 2. Thus, data from 2009-10 represents the year these schools were SS schools, while the data for 2007-08 and 2008-09 represent the years prior to becoming a SS school. Again, we can see that these schools generally improved across all three years. Allenbrook and Ashley Park appeared to show greater gains in 2009-10 compared to the two previous years, while Albemarle Middle, Druid Hills, and Paw Creek showed minimal gains in 2009-10. During this same time, Spaugh and Thomasboro appeared to maintain the amount of gain they achieved prior to becoming a SS school. Note that only Albemarle Middle and Paw Creek managed to attain proficiency levels higher than the comparison schools’ average once retests were taken into account. Without retests, no SS school outperformed the comparison school averages.
Figure 2. Cohort 2-School Level Reading Proficiency for 2007-08, 2008-09 and 2009-10.

12 | Evaluation of Strategic Staffing January 2011
Office of Accountability | Center for Research and Evaluation
Figure 3 below shows the school level mathematics proficiency for all three years for the SS schools from Cohort 1. Devonshire and Sterling appeared to have greater levels of performance for the two years they were participating SS schools when compared to the comparison reference lines. The remaining schools exhibited increases across all three years, but showed levels of proficiency below the average across the comparison schools.
Figure 3. Cohort 1-School Level Mathematics Proficiency for 2007-08, 2008-09 and 2009-10.

January 2011 Evaluation of Strategic Staffing | 13
Office of Accountability | Center for Research and Evaluation
Figure 4 below shows the school level mathematics proficiency for all three years for the SS schools from Cohort 2. No SS school managed to outperform the average of the comparison schools without taking retests into account, despite showing increases in proficiency across all three years.
Figure 4. Cohort 2-School Level Mathematics Proficiency for 2007-08, 2008-09 and 2009-10.

14 | Evaluation of Strategic Staffing January 2011
Office of Accountability | Center for Research and Evaluation
Figure 5 below shows the school level science proficiency for the last two years for the SS schools from Cohort 1. Each school showed some level of improvement in 2009-10 compared to their performance in 2008-09, though Devonshire, Ranson, and Westerly Hills showed the most dramatic increases. Only Devonshire (in both years) attained a proficiency level above that of the comparison schools.
Figure 5. Cohort 1-School Level Science Proficiency for 2008-09 and 2009-10.

January 2011 Evaluation of Strategic Staffing | 15
Office of Accountability | Center for Research and Evaluation
Figure 6 below shows the school level science proficiency for the last two years for the SS schools from Cohort 2. Each school showed some level of improvement in 2009-10 compared to their performance in 2008-09 (note that Thomasboro had a 0.00% pass rate on the first testing, but attained 27.1% after re-test). Ashley Park and Paw Creek showed the most dramatic increases, while Albemarle Mid (both years), and Paw Creek (2009-10) attained proficiency levels above that of the comparison schools.
Figure 6. Cohort 2-School Level Science Proficiency for 2008-09 and 2009-10.
GrowthNorth Carolina ABC growth values are calculated based on a simple growth formula that takes into account at least one year’s prior test score (retests not included) to predict the amount of ‘academic change’ a student should experience in the current school year. Then, the student’s actual performance is compared to their expected performance, yielding growth. For example, a student progressing at a typical rate would have a growth value of zero, where they performed as expected. Students with nega-tive growth values fell short of what was predicted; positive values indicate they out-performed the prediction. Student scores were aggregated to obtain school-level growth values for the last two years, including 2008-09 (beginning of SS for Cohort 1 schools) and 2009-10 (beginning of SS for Cohort 2 schools). Bar graphs were used to show growth, where colored horizontal lines represent the mean growth for the pool of all comparison schools corresponding to the year (color) represented on the bottom axis. A separate graph was generated for each Cohort of SS schools.

16 | Evaluation of Strategic Staffing January 2011
Office of Accountability | Center for Research and Evaluation
Figure 7. Cohort 1-School Level Reading Growth for 2008-09 and 2009-10.
Figure 7 above shows the school level reading growth for the last two years for the SS schools from Cohort 1. Five schools showed some level of improvement in 2009-10 compared to their performance in 2008-09, while two (Devonshire and Sterling) showed a decline in the most recent year. Briarwood and Ranson appeared to have the most dramatic increases in growth from 2008-09 to 2009-10. Four of the seven schools attained growth greater than the average across the pool of comparison schools in 2009-10 (in reference to the red horizontal line). Note the blue reference line representing the mean of the comparison schools is right near the 0.00 y-axis value.

January 2011 Evaluation of Strategic Staffing | 17
Office of Accountability | Center for Research and Evaluation
Figure 8 below shows the school level reading growth for the last two years for the SS schools from Cohort 2. Again, six schools showed some level of improvement in 2009-10 compared to their perfor-mance in 2008-09, while Druid Hills showed a decline in the most recent year. Ashley Park and Spaugh appeared to have the most dramatic increases in growth from 2008-09 to 2009-10. Three of the seven schools attained growth greater than the average across the pool of comparison schools in 2009-10 (in reference to the red horizontal line).
Figure 8. Cohort 2-School Level Reading Growth for 2008-09 and 2009-10.

18 | Evaluation of Strategic Staffing January 2011
Office of Accountability | Center for Research and Evaluation
Figure 9 below shows the school level mathematics growth for the last three years for the SS schools from Cohort 1. Six of the seven schools showed improvement from 2007-08 to 2008-09, while four of the seven showed improvement from 2008-09 to 2009-10. Briarwood and Devonshire appear to have showed the most dramatic changes across the three years, while the other schools growth attain-ment varied across the same time period. Four schools attained growth in 2007-08 and 2008-09 that outpaced the average of the comparison schools, while six schools attained growth greater than the comparison schools in 2009-10.
Figure 9. Cohort 1-School Level Math Growth for 2007-08, 2008-09 and 2009-10.

January 2011 Evaluation of Strategic Staffing | 19
Office of Accountability | Center for Research and Evaluation
Figure 10 below shows the school level mathematics growth for the last three years for the SS schools from Cohort 2. Six of the seven schools showed improvement from 2007-08 to 2008-09, while five of the seven showed improvement from 2008-09 to 2009-10. Ashley Park and Thomasboro appear to have showed the most dramatic changes across the three years, while the other schools growth attain-ment varied to some degree across the same time period. Two schools attained growth in 2007-08 that outpaced the average of the comparison schools, while only one did so in 2008-09 and four did so in 2009-10.
Figure 10. Cohort 2-School Level Math Growth for 2007-08, 2008-09 and 2009-10.

20 | Evaluation of Strategic Staffing January 2011
Office of Accountability | Center for Research and Evaluation
Figure 11 below shows the school level Algebra 1 growth for the last three years for the SS schools from Cohorts 1 and 2. Both Albemarle and Ranson showed similar patterns of growth over the last three years, with improvements in 2008-09 and subsequent declines in 2009-10. Note that Spaugh (a Cohort 2 SS school) did not have any Algebra 1 students. Albemarle managed growth values higher than the comparison schools in 2008-09 and 2009-10, while Ranson outpaced the comparison schools in 2008-09 only.
Figure 11. Cohort 1 & 2-School Level Algebra 1 Growth for 2007-08, 2008-09 and 2009-10.
AttendanceTo examine attendance as an outcome, data files were constructed where student absences and number of days enrolled attributed to each school attended in a particular year were compiled. In this way, a student’s rate of attendance for time only at a particular school can be isolated. These records were col-lapsed at the school level to examine the school-level mean rates of absence across the years in question.
Figure 12 below shows the school level attendance rates for the last three years for the SS schools from Cohort 1. The horizontal lines behind the bars represents the mean rates of attendance across all compari-son schools for the years presented (colors denote years). The error bars extending above and below the top of each bar represent the 95% confidence interval for the mean rate, and the number above the error bar is the mean attendance rate. Note the scale on the vertical axis, where the minimum value is set to 80%.

January 2011 Evaluation of Strategic Staffing | 21
Office of Accountability | Center for Research and Evaluation
Devonshire, Reid Park and Sterling either increased or maintained consistent levels of attendance across all three years, while attendance rates at the remaining schools showed greater levels of vari-ability. Only Devonshire and Sterling managed to outpace the comparison school means in both years as participating SS locations (in reference to the red and green lines).
Figure 12. Cohort 1-School Level Attendance Rates for 2007-08, 2008-09 and 2009-10.

22 | Evaluation of Strategic Staffing January 2011
Office of Accountability | Center for Research and Evaluation
Figure 13 below shows the school level attendance rates for the last three years for the SS schools from Cohort 2. Albemarle, Allenbrook, Druid Hills, Paw Creek and Thomasboro either increased or main-tained consistent levels of attendance across all three years, while attendance rates at the remaining schools showed greater levels of variability. Only Ashley Park, Paw Creek and Thomasboro managed to outpace the comparison school means in their SS year (in reference to the green horizontal line).
Figure 13. Cohort 2-School Level Attendance Rates for 2007-08, 2008-09 and 2009-10.

January 2011 Evaluation of Strategic Staffing | 23
Office of Accountability | Center for Research and Evaluation
Figure 14. Cohort 1-School Level Percent of Total Absences, by Type, for 2007-08, 2008-09 and 2009-10.
Figure 15. Cohort 2-School Level Percent of Total Absences, by Type, for 2007-08, 2008-09 and 2009-10.

24 | Evaluation of Strategic Staffing January 2011
Office of Accountability | Center for Research and Evaluation
Figures 14 and 15 above display the percent of total absences, by type of absence (excused, unexcused or out-of-school suspension) for each of the three years. Note that the school labeled ‘Comparison’ rep-resents the comparison school previously represented by reference lines. The comparison schools show a trend we would hope to see, with the red portion of the bar representing excused absences expanding over time while the unexcused and OSS portions of the bar decreasing over time. For Cohort 1, Reid Park and Sterling appear to mimic this profile best, while for Cohort 2 Albemarle, Allenbrook, Paw Creek and Thomasboro represent this profile the best. Also note the larger proportion of total absences accounted for by OSS at the middle schools in both graphs.
Repeated Measures AnalysisRepeated measures analyses were conducted to determine the trajectory of academic achievement for the comparison and SS students across time. Not only can the trajectory for each group be examined, but estimates for the two groups at each time point can be compared to determine inferential sig-nificance. The analyses were carried out for all three analytic groupings making use of standardized reading and mathematics achievement scores.
Table 3 below provides the contrast estimates generated from a repeated measures analysis of standard-ized mathematics scores, comparing the estimates for the SS and control groups at each time point (2007-08 the year prior to SS, 2008-09 the first SS year and 2009-10, the second SS year). Figure 16 displays the predicted values for the two groups across the three years. What we note here is that overall, both groups’ scores increased over time (the coefficient for time was significant) and that the SS group grew at a faster rate than did the comparison group (the coefficient for the interaction of time and treatment was significant). This phenomenon is confirmed by the contrast estimates, where we see significant (p<.05) estimates for the 2007-08 and 2008-09 years but the estimated difference decreased from -.16 to -.10. In 2009-10, the difference decreased even further to a non-significant -.03 between the SS and control groups. Essentially, the SS students managed to close the gap that existed between themselves and their comparison students.
Table 3. Mathematics Contrast Estimates for Analytical Groups 1 and 2.
Comparison Estimate p Lower Upper
CT vs SS at 07-08 -0.16 0.00 -0.22 -0.11CT vs SS at 08-09 -0.10 0.00 -0.15 -0.05CT vs SS at 09-10 -0.03 0.25 -0.09 0.02

January 2011 Evaluation of Strategic Staffing | 25
Office of Accountability | Center for Research and Evaluation
Figure 16. Mathematics Profile Plot for Analytical Groups 1 and 2.
Table 4 below provides the contrast estimates for standardized readings scores for the SS and control analytical groups 1 and 2. Figure 17 displays the predicted values for these same groups across the three years. The graph suggests that both groups’ academic trajectories did not change much across time. There was, however a significant overall difference between the SS and comparison students (p<.001). This phenomenon is confirmed by the contrast estimates, where we see significant differences in favor of the comparison group across all three years.
Table 4. Reading Contrast Estimates for Analytical Groups 1 and 2.
Comparison Estimate p Lower Upper
CT vs SS at 07-08 -0.12 0.00 -0.18 -0.06CT vs SS at 08-09 -0.13 0.00 -0.18 -0.07CT vs SS at 09-10 -0.13 0.00 -0.19 -0.08

26 | Evaluation of Strategic Staffing January 2011
Office of Accountability | Center for Research and Evaluation
Figure 17. Reading Profile Plot for Analytical Groups 1 and 2.
Table 5 below provides the contrast estimates for standardized mathematics scores for analytical groups 3 and 4. Figure 18 displays the predicted values for these same groups across the three years. The graph suggests that both groups’ academic trajectories changed across time (the time coefficient was signifi-cant). The contrast estimates below show that the two groups, despite growing over the three years, did not differ significantly at any point across those three years.
Table 5. Mathematics Contrast Estimates for Analytical Groups 3 and 4.
Comparison Estimate p Lower Upper
CT vs SS at 07-08 0.01 0.62 -0.03 0.05CT vs SS at 08-09 0.01 0.48 -0.02 0.05CT vs SS at 09-10 0.01 0.45 -0.02 0.05

January 2011 Evaluation of Strategic Staffing | 27
Office of Accountability | Center for Research and Evaluation
Figure 18. Mathematics Profile Plot for Analytical Groups 3 and 4.
Table 6 below provides the contrast estimates for standardized reading scores for analytical groups 3 and 4. Figure 19 displays the predicted values for these same groups across the three years. The graph suggests that both groups’ academic trajectories changed across time; however no significant effects were found including treatment. Thus, despite the mean predicted value for the comparison students appearing below that of the SS in 2007-08 and reversing by 2009-10, the differences between the groups across time were non-significant.
Table 6. Reading Contrast Estimates for Analytical Groups 3 and 4.
Comparison Estimate p Lower Upper
CT vs SS at 07-08 0.02 0.41 -0.02 0.06CT vs SS at 08-09 0.00 0.85 -0.03 0.04CT vs SS at 09-10 -0.01 0.61 -0.05 0.03

28 | Evaluation of Strategic Staffing January 2011
Office of Accountability | Center for Research and Evaluation
Figure 19. Reading Profile Plot for Analytical Groups 3 and 4.
Table 7 below provides the contrast estimates for standardized mathematics scores for analytical groups 5 and 6. Figure 20 displays the predicted values for these same groups across the both years, as these were students who were only in SS school in 2008-09. The graph suggests that both groups’ academic trajectories changed across time and the SS groups’ trajectory changed at a greater rate than did the comparison groups’ trajectory. Thus, the SS group ‘closed the gap’ on their comparison counterparts.
Table 7. Mathematics Contrast Estimates for Analytical Groups 5 and 6.
Comparison Estimate p Lower Upper
CT vs SS at 07-08 -0.12 0.00 -0.18 -0.07CT vs SS at 08-09 0.04 0.18 -0.02 0.09

January 2011 Evaluation of Strategic Staffing | 29
Office of Accountability | Center for Research and Evaluation
Figure 20. Mathematics Profile Plot for Analytical Groups 5 and 6.
Table 8 and Figure 21 display the contrast estimates for standardized readings scores for the SS and control analytical groups 5 and 6. The graph suggests that both groups’ academic trajectories did not change much across time and the SS group was significantly lower than the comparison group (p=.02). This phenomenon is confirmed by the contrast estimates, where we see significant differences in favor of the comparison group in 2007-08 (the standard error for the 2007-08 contrast estimate was smaller, yielding statistical significance while scores in 2008-09 exhibited more variability and a larger standard error, thus preventing statistical significance).
Table 8. Reading Contrast Estimates for Analytical Groups 5 and 6.
Comparison Estimate p Lower Upper
CT vs SS at 07-08 -0.13 0.00 -0.19 -0.07CT vs SS at 08-09 -0.01 0.80 -0.07 0.05

30 | Evaluation of Strategic Staffing January 2011
Office of Accountability | Center for Research and Evaluation
Figure 21. Reading Profile Plot for Analytical Groups 5 and 6.
Teacher ComparisonThe research question focused on a comparison of achievement for students instructed by SS teachers compared to non-SS teachers necessitated matching of a SS staff listing database to student records. A number of SS staff recruited to SS schools are in roles where matching students (and their test scores) are impossible, including Facilitators, K-2 Teachers and even Media specialists. All told, of the 69 staff members in the SS database only 57 were identifiable in a database linking teachers to students. Thus, the results presented next are based only on those staff able to be accurately linked to students. Further, the disaggregated results presented below do not necessarily aggregate to the total proficiency per-centages presented above. Longitudinal, school-level proficiency graphs beginning with Figure 1 were generated based on school-level data files provided by NCDPI. The figures that follow were generated by linking students to teachers using snapshot data files available in the CMS data warehouse. Thus, student mobility and attribution of test scores as accounted for by NCDPI are not perfectly replicable with current systems down to the student-to-teacher level. Nevertheless, the tables below provide a reasonable approximation of student performance separated by the two teacher groups. Note instances where estimated confidence intervals represented by the Lower and Upper columns fall outside realis-tic boundaries between zero and one. Data presented below are presented in decimal form to conserve space on the page. Cells highlighted in yellow represent statistically significant differences, as the 95% confidence intervals between NSS and SS groups do not overlap. The column labeled ‘n’ reflects the number of student records used in calculating the mean values.

January 2011 Evaluation of Strategic Staffing | 31
Office of Accountability | Center for Research and Evaluation
Table 10 shows, in general, that students instructed by Cohort-1 SS teachers attained a higher rate of math proficiency than students instructed by Non-SS teachers in 2008-09 and 2009-10. The same results for reading and science were a bit more mixed. Table 11 shows a similar pattern for Cohort-2 schools based only on 2009-10 proficiency rates.
Table 10. Cohort 1-Reading, Math & Science Proficiency for 2008-09 and 2009-10 by Teacher Type (NSS=Non-SS).
Math Reading
09 10 09 10
Subject Type n Lower Mean Upper n Lower Mean Upper n Lower Mean Upper n Lower Mean Upper
Briarwood NSS 243 0.5 0.56 0.63 238 0.59 0.65 0.71 243 0.35 0.42 0.48 238 0.43 0.49 0.56
SS 67 0.48 0.6 0.72 61 0.59 0.7 0.82 67 0.3 0.42 0.54 61 0.4 0.52 0.65
Devonshire NSS 184 0.7 0.77 0.83 164 0.78 0.84 0.89 184 0.46 0.53 0.61 164 0.5 0.57 0.65
SS 70 0.69 0.79 0.88 84 0.7 0.79 0.88 70 0.47 0.59 0.7 84 0.4 0.51 0.62
Bruns NSS 165 0.49 0.56 0.64 158 0.49 0.57 0.65 196 0.3 0.37 0.44 195 0.33 0.39 0.46
SS 71 0.46 0.58 0.7 73 0.62 0.73 0.83 40 0.2 0.35 0.5 36 0.36 0.53 0.7
Ranson NSS 762 0.56 0.59 0.63 660 0.51 0.55 0.58 1134 0.46 0.49 0.52 1137 0.48 0.51 0.54
SS 347 0.68 0.73 0.78 407 0.72 0.76 0.8 . . . . . . . .
Reid Park NSS 193 0.42 0.49 0.56 185 0.54 0.61 0.68 192 0.28 0.35 0.42 185 0.23 0.3 0.36
SS 90 0.32 0.42 0.53 66 0.52 0.64 0.76 90 0.25 0.36 0.46 66 0.33 0.45 0.58
Sterling NSS 145 0.73 0.8 0.87 143 0.72 0.79 0.86 145 0.43 0.51 0.59 144 0.57 0.65 0.73
SS 63 0.85 0.92 0.99 57 0.79 0.88 0.97 63 0.67 0.78 0.88 57 0.54 0.67 0.79
Westerly Hills NSS 74 0.38 0.5 0.62 64 0.45 0.58 0.7 74 0.32 0.43 0.55 64 0.25 0.38 0.5
SS 89 0.48 0.58 0.69 81 0.63 0.73 0.83 89 0.33 0.44 0.54 81 0.46 0.57 0.68
Table 10., continuedScience
09 10
Subject Type n Lower Mean Upper n Lower Mean Upper
Briarwood NSS 75 0.27 0.39 0.5 69 0.27 0.39 0.51
SS 20 -0.02 0.15 0.32 22 0.32 0.55 0.77
Devonshire NSS 61 0.35 0.48 0.6 45 0.73 0.84 0.95
SS 15 0.4 0.67 0.94 13 0.4 0.69 0.98
Bruns NSS 72 0.12 0.22 0.32 77 0.17 0.27 0.37
SS . . . . . . . .
Ranson NSS 370 0.28 0.32 0.37 387 0.53 0.58 0.63
SS . . . . . . . .
Reid Park NSS 76 0.12 0.21 0.3 68 0.14 0.25 0.36
SS 17 -0.07 0.06 0.18 21 -0.02 0.14 0.31
Sterling NSS 48 0 0.08 0.16 62 0.26 0.39 0.51
SS 16 0.51 0.75 0.99 . . . .
Westerly Hills NSS 35 0.15 0.31 0.48 12 -0.08 0.17 0.41
SS 18 -0.05 0.11 0.27 29 0.47 0.66 0.84

32 | Evaluation of Strategic Staffing January 2011
Office of Accountability | Center for Research and Evaluation
Table 11. Cohort 2-Reading, Math & Science Proficiency for 2009-10 by Teacher Type (NSS=Non-SS)
MATH READ SCI
Subject Type n Lower Mean Upper n Lower Mean Upper n Lower Mean Upper
Albemarle Mid NSS 624 0.71 0.74 0.78 672 0.52 0.56 0.59 263 0.61 0.67 0.73
SS 140 0.73 0.8 0.87 117 0.49 0.58 0.67 7 0.51 0.86 1.21
Allenbrook NSS 168 0.59 0.66 0.73 168 0.37 0.45 0.52 45 0.23 0.38 0.53
SS 37 0.61 0.76 0.9 37 0.34 0.51 0.68 21 0.11 0.33 0.55
Ashley Park NSS 58 0.49 0.62 0.75 58 0.28 0.41 0.54 22 0.32 0.55 0.77
SS 60 0.6 0.72 0.83 60 0.44 0.57 0.7 18 0.49 0.72 0.95
Druid Hills NSS 128 0.48 0.57 0.66 122 0.36 0.45 0.54 57 0.09 0.19 0.3
SS 50 0.34 0.48 0.62 50 0.24 0.38 0.52 . . . .
Paw Creek NSS 277 0.68 0.73 0.79 277 0.55 0.61 0.67 76 0.58 0.68 0.79
SS 48 0.62 0.75 0.88 48 0.51 0.65 0.79 25 0.35 0.56 0.77
Spaugh NSS 406 0.43 0.48 0.53 393 0.31 0.36 0.41 176 0.3 0.37 0.44
SS 113 0.69 0.77 0.85 124 0.27 0.35 0.44 . . . .
Thomasboro NSS 147 0.64 0.71 0.79 147 0.39 0.47 0.55 48 0.14 0.27 0.4
SS 14 0.13 0.43 0.73 14 -0.08 0.07 0.23 . . . .
Table 12. Cohort 1-Reading & Math Growth for 2008-09 and 2009-10 by Teacher Type (NSS=Non-SS).
Math Reading
09 10 09 10
Subject Type n Lower Mean Upper n Lower Mean Upper n Lower Mean Upper n Lower Mean Upper
Briarwood NSS 185 -0.1 -0.01 0.08 102 0.27 0.38 0.49 184 -0.22 -0.14 -0.06 101 -0.01 0.09 0.18
SS 47 0 0.17 0.33 30 0.37 0.57 0.76 46 -0.41 -0.22 -0.04 29 -0.1 0.07 0.25
Devonshire NSS 133 0.67 0.77 0.86 57 0.58 0.69 0.79 130 0.04 0.13 0.22 56 0 0.1 0.21
SS 54 0.58 0.74 0.91 47 0.49 0.62 0.76 52 0.09 0.24 0.39 47 0.02 0.13 0.24
Bruns NSS 122 0.13 0.22 0.32 83 0.22 0.33 0.44 141 -0.14 -0.05 0.04 109 -0.14 -0.06 0.03
SS 43 0.2 0.39 0.57 42 0.35 0.5 0.64 23 -0.39 -0.05 0.28 15 -0.23 0.15 0.52
Ranson NSS 613 0.1 0.14 0.18 510 -0.06 -0.01 0.03 910 -0.06 -0.03 0 921 0.05 0.08 0.11
SS 274 0.33 0.39 0.45 348 0.11 0.16 0.21 . . . . . . . .
Reid Park NSS 147 0.04 0.13 0.22 93 0.17 0.28 0.39 147 -0.27 -0.18 -0.09 93 -0.15 -0.05 0.06
SS 71 0 0.13 0.26 40 0.26 0.4 0.55 70 -0.3 -0.15 -0.01 40 -0.2 -0.03 0.13
Sterling NSS 109 0.5 0.61 0.71 85 0.12 0.23 0.33 109 0.1 0.21 0.32 84 -0.07 0.06 0.18
SS 53 0.66 0.8 0.94 0 . . . 53 0.1 0.26 0.42 0 . . .
Westerly Hills
NSS 68 -0.11 0.03 0.18 42 0.02 0.19 0.37 68 -0.27 -0.12 0.03 42 -0.35 -0.19 -0.03
SS 76 0.15 0.28 0.41 39 0.2 0.36 0.53 75 -0.25 -0.13 0 39 -0.15 0.04 0.23
January 2011 Evaluation of Strategic Staffing | 33
Office of Accountability | Center for Research and Evaluation
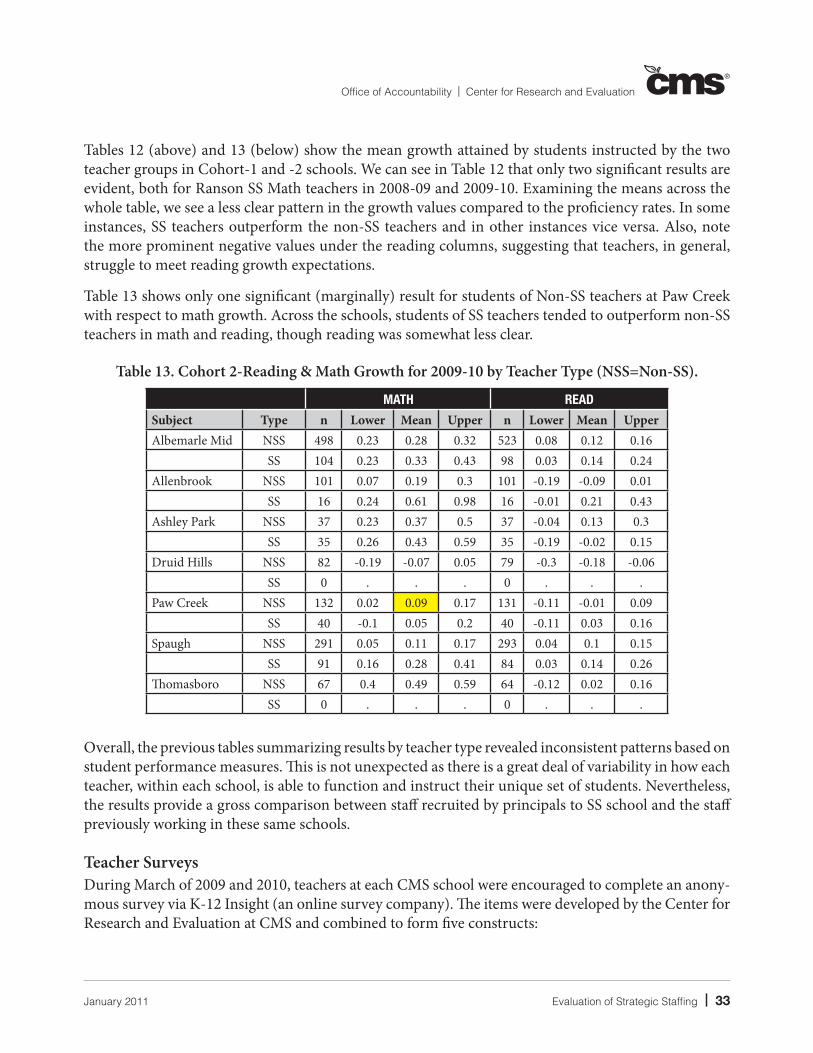
Tables 12 (above) and 13 (below) show the mean growth attained by students instructed by the two teacher groups in Cohort-1 and -2 schools. We can see in Table 12 that only two significant results are evident, both for Ranson SS Math teachers in 2008-09 and 2009-10. Examining the means across the whole table, we see a less clear pattern in the growth values compared to the proficiency rates. In some instances, SS teachers outperform the non-SS teachers and in other instances vice versa. Also, note the more prominent negative values under the reading columns, suggesting that teachers, in general, struggle to meet reading growth expectations.
Table 13 shows only one significant (marginally) result for students of Non-SS teachers at Paw Creek with respect to math growth. Across the schools, students of SS teachers tended to outperform non-SS teachers in math and reading, though reading was somewhat less clear.
Table 13. Cohort 2-Reading & Math Growth for 2009-10 by Teacher Type (NSS=Non-SS).
MATH READ
Subject Type n Lower Mean Upper n Lower Mean UpperAlbemarle Mid NSS 498 0.23 0.28 0.32 523 0.08 0.12 0.16
SS 104 0.23 0.33 0.43 98 0.03 0.14 0.24Allenbrook NSS 101 0.07 0.19 0.3 101 -0.19 -0.09 0.01
SS 16 0.24 0.61 0.98 16 -0.01 0.21 0.43Ashley Park NSS 37 0.23 0.37 0.5 37 -0.04 0.13 0.3
SS 35 0.26 0.43 0.59 35 -0.19 -0.02 0.15Druid Hills NSS 82 -0.19 -0.07 0.05 79 -0.3 -0.18 -0.06
SS 0 . . . 0 . . .Paw Creek NSS 132 0.02 0.09 0.17 131 -0.11 -0.01 0.09
SS 40 -0.1 0.05 0.2 40 -0.11 0.03 0.16Spaugh NSS 291 0.05 0.11 0.17 293 0.04 0.1 0.15
SS 91 0.16 0.28 0.41 84 0.03 0.14 0.26Thomasboro NSS 67 0.4 0.49 0.59 64 -0.12 0.02 0.16
SS 0 . . . 0 . . .
Overall, the previous tables summarizing results by teacher type revealed inconsistent patterns based on student performance measures. This is not unexpected as there is a great deal of variability in how each teacher, within each school, is able to function and instruct their unique set of students. Nevertheless, the results provide a gross comparison between staff recruited by principals to SS school and the staff previously working in these same schools.
Teacher SurveysDuring March of 2009 and 2010, teachers at each CMS school were encouraged to complete an anony-mous survey via K-12 Insight (an online survey company). The items were developed by the Center for Research and Evaluation at CMS and combined to form five constructs:

34 | Evaluation of Strategic Staffing January 2011
Office of Accountability | Center for Research and Evaluation
1) Principal Standards – Items were generated to align to the North Carolina standards for principal evaluations. On a 4-point Likert scale (Strongly Agree – Strongly Disagree), strongly agree equated to a 4, agree to a 3, disagree to a 2, and strongly disagree to a 1.
2) Safety and Behavior: Consistency by Administration– Items were created based on aspects of the CMS definition of a safe and orderly school. The 3-point scale included always, sometimes, and never.
3) Safety and Behavior: Consequences – Items were created based on aspects of the CMS definition of a safe and orderly school. As with the principal standards construct, a 4-point Likert scale, strongly agree to strongly disagree, was used.
4) Safety and Behavior: Expectations and Perceptions – Items were created based on aspects of the CMS definition of a safe and orderly school and perceptions of safety by the teachers. Strongly agree to strongly disagree was used (4-point scale).
5) School Problems – Items were created to provide context about certain problems each school may be facing. The scale had 4 points ranging from serious problem, moderate problem, minor problem, and not a problem at all. A 4 was assigned to not a problem at all, 3 was equal to minor problem, 2 equated to moderate problem, and 1 represented serious problem.
Overall the response rate for the entire district was 64% in 2008-09 and 74% in 2009-10. The following table shows the response rates for each of the SSI schools for cohorts 1 and 2. Focusing solely on the response rates for Cohort 2, where 2008-09 represents the year prior to becoming a SS school, we can see dramatic increases in teacher participation in the annual CMS Teacher Survey.
Table 9. Teacher Survey Response Rates by School and Cohort for 2008-09 and 2009-10.
Cohort 1 2008-09 2009-10 Cohort 2 2008-09 2009-10
Briarwood 59% 68% Allenbrook 41% 100%Bruns 72% 83% Ashley Park 61% 96%Devonshire 59% 51% Druid Hills 80% 83%Reid Park 78% 82% Paw Creek 57% 94%Sterling 98% 83% Thomasboro 29% 84%Westerly Hills 80% 100% Albemarle Mid 58% 59%Ranson 49% 52% Spaugh Mid 56% 82%
Principal standards. In the Principal Standards section, teachers completing the survey indicated their agreement with statements concerning their perceptions of whether the principal is an effective leader, is innovative in implementing needed changes, encourages faculty/staff to take leadership roles, empowers teach-ers to do what is necessary to improve student achievement, is able to resolve conflicts effectively, and has high expectations for students and staff. The results for this section of the survey are presented for Cohort 1 in Figure 22 and Cohort 2 in Figure 23. In each figure, the mean construct score is presented for both the 2008-09 and 2009-10 school years. The blue horizontal line behind the bars represents

January 2011 Evaluation of Strategic Staffing | 35
Office of Accountability | Center for Research and Evaluation
the mean construct score combined across all comparison schools for the 2008-09 year while the red horizontal line represents the 2009-10 school year. The error bars extending above and below the top of each bar represent the 95% confidence interval for the mean construct score, and the number above the error bar is the actual mean value. The principal with the highest mean score on the Principal Standards construct for 2009-10 was Westerly Hills. Given the 100% response rate at Westerly Hills, we are confident in this finding. Further, note that only Ranson failed to outpace the comparison school means during the second SS year.
Figure 22. Cohort 1-Principal Standards Mean Scores for 2008-09 and 2009-10.
Ashley Park attained the highest Principal Standards construct score from Cohort 2. Note that all SS schools managed to outpace the comparison schools’ composite mean in 2009-10 (the red horizontal line).

36 | Evaluation of Strategic Staffing January 2011
Office of Accountability | Center for Research and Evaluation
Figure 23. Cohort 2-Principal Standards Mean Scores for 2008-09 and 2009-10.
Safety and behavior: Consistency by administrators.In this section of the survey, teachers were asked to indicate how consistent the administrators have been in the way they handle safety and behavior issues, how quickly and consistently issues are handled, whether rules are consistently enforced, and whether security and/or resource officers are visible: always, sometimes, and never (3-point scale). The same formatting as described above applies to these and all subsequent graphs in this section.

January 2011 Evaluation of Strategic Staffing | 37
Office of Accountability | Center for Research and Evaluation
Figure 24. Cohort 1-Safety and Behavior: Consistency by Administration Mean Scores for 2008-09 and 2009-10.
Figure 24 above shows the mean Safety & Behavior: Consistency by Administration construct scores for the Cohort 1 schools. Westerly Hills attained the highest mean construct score, closely followed by Sterling. Both Briarwood and Devonshire showed declines in mean construct scores from 2008-09 to 2009-10. Only Ranson and Reid Park failed to outpace the comparison means in both years (the blue and red lines).

38 | Evaluation of Strategic Staffing January 2011
Office of Accountability | Center for Research and Evaluation
Figure 25. Cohort 2-Safety and Behavior: Consistency by Administration Mean Scores for 2008-09 and 2009-10.
Figure 25 above shows the mean Safety & Behavior: Consistency by Administration construct scores for the Cohort 2 schools. Both Albemarle and Druid Hills showed declines in mean construct scores from 2008-09 to 2009-10, and were the only locations not meeting or exceeding the mean comparison school construct score in 2009-10 (the red line).
Safety and behavior: Consequences. The statements concerning safety and behavior consequences include whether the consequences for behavior are known by the students and whether the consequences are handed out in a consistent manner. The scale ranged from strongly agree to strongly disagree (4-point scale).

January 2011 Evaluation of Strategic Staffing | 39
Office of Accountability | Center for Research and Evaluation
Figure 26. Cohort 1-Safety and Behavior: Consequences Mean Scores for 2008-09 and 2009-10.
Figure 26 above shows the mean Safety & Behavior: Consequences construct scores for the Cohort 1 schools. Westerly Hills attained the highest mean construct score, closely followed by Sterling. Only Devonshire showed a large decline in mean construct score from 2008-09 to 2009-10. Only Ranson failed to outpace the comparison means in both years (the blue and red lines), while Reid Park failed in 2008-09 only.

40 | Evaluation of Strategic Staffing January 2011
Office of Accountability | Center for Research and Evaluation
Figure 27. Cohort 2-Safety and Behavior: Consequences Mean Scores for 2008-09 and 2009-10.
Figure 27 above shows the mean Safety & Behavior: Consequences construct scores for the Cohort 2 schools. Paw Creek attained the highest mean construct score, closely followed by Ashley Park. Albemarle and Druid Hillls showed larger declines in mean construct score from 2008-09 to 2009-10. Albemarle and Druid Hills both failed to outpace the comparison mean in 2009-10 (the red line).
Safety and behavior: Expectations and perceptions. The statements concerning safety and behavior expectations and perceptions comprise topics con-cerning whether students know the expectations for their behavior, what should be done in case of an emergency, whether effective strategies are in place to catch students with weapons, and whether discipline policies in general are effective in curtailing unwanted behavior.

January 2011 Evaluation of Strategic Staffing | 41
Office of Accountability | Center for Research and Evaluation
Figure 28. Cohort 1-Safety and Behavior: Expectations and Perceptions Mean Scores for 2008-09 and 2009-10.
Figure 28 above shows the mean Safety & Behavior: Expectations and Perceptions construct scores for the Cohort 1 schools. Westerly Hills attained the highest mean construct score, closely followed by Briarwood. Reid Park and Ranson showed larger declines in mean construct score from 2008-09 to 2009-10. Devonshire, Ranson and Reid Park failed to outpace the comparison mean in 2009-10 (the red line), while Bruns, Devonshire, Ranson and Reid Park failed to do so in 2008-09.

42 | Evaluation of Strategic Staffing January 2011
Office of Accountability | Center for Research and Evaluation
Figure 29. Cohort 2-Safety and Behavior: Expectations and Perceptions Mean Scores for 2008-09 and 2009-10.
Figure 29 above shows the mean Safety & Behavior: Expectations and Perceptions construct scores for the Cohort 2 schools. Paw Creek attained the highest mean construct score, closely followed by Ashley Park. Only Albemarle showed a larger decline in mean construct score from 2008-09 to 2009-10 and failed to outpace the comparison mean in 2009-10 (the red line).
School problems. The section concerning school problems include statements about teacher and student absences, student tardies, student apathy, and whether teachers and students are shown respect by students. The responses ranged from serious problem to not a problem at all (4-point scale, serious problem = 1, not a problem at all = 4.

January 2011 Evaluation of Strategic Staffing | 43
Office of Accountability | Center for Research and Evaluation
Figure 30. Cohort 1-Severity of School Problems Mean Scores for 2008-09 and 2009-10.
Figure 30 above shows the mean School Problems construct scores for the Cohort 1 schools. Note that in this instance, the response string was coded so that serious problems would have lower construct scores and less serious problems would be represented by higher construct scores. Briarwood attained the highest mean construct score, closely followed by Westerly Hills. Ranson and Sterling showed larger declines in mean construct scores from 2008-09 to 2009-10. Bruns, Devonshire, Ranson and Reid Park failed to outpace the comparison mean in both 2008-09 and 2009-10 (the blue and red lines, respectively).

44 | Evaluation of Strategic Staffing January 2011
Office of Accountability | Center for Research and Evaluation
Figure 31 below shows the mean School Problems construct scores for the Cohort 2 schools. Paw Creek attained the highest mean construct score, followed by Ashley Park. Albemarle and Druid Hills showed larger declines in mean construct scores from 2008-09 to 2009-10. Albemarle, Allenbrook, Druid Hills, Spaugh and Thomasboro failed to outpace the comparison mean in 2009-10 (the red line).
Figure 31. Cohort 2-Severity of School Problems Mean Scores for 2008-09 and 2009-10.
Findings from the Principal InterviewsFrom July 14, 2010 through October 25, 2010, the researchers individually interviewed all fourteen principals comprising both the first and second cohorts of Strategic Staffing (SS) principals. For the Cohort 1 principals the researchers focused on differences in their second year experiences from their first year experiences. This included looking at how their leadership styles changed, as well as instruc-tional and operational changes. In addition, principals were asked about insights they had gained having now spent two years in the role as an SS principal and about what each would now like to do at the end of their three years.
The researchers asked the Cohort 2 principals about their experiences during their first year as an SS principal. These experiences included instructional as well as operational changes. Questions were asked about climate within their schools when they first arrived, as well as other conditions, and what had been their focus for change during this first year. Cohort 2 principals were asked the same questions

January 2011 Evaluation of Strategic Staffing | 45
Office of Accountability | Center for Research and Evaluation
as those asked of Cohort 1 principals at the end of their first year as an SS principal. The leadership style of each principal was also assessed. In addition, researchers looked at the past experiences for these principals in Cohort 2. Results for this Cohort 2 were compared to results found one year ago for Cohort 1 principals.
Leadership Styles: Year Two Experience for Cohort 1During their first year in SS schools, two principals in Cohort 1 had a definite directive leadership style, while three other principals distributed leadership responsibilities across their administrative team and their faculty. The other two individuals had indicated they typically had a distributive leadership style, but because of the urgencies within their schools, they needed to be directive for that first year.
For our analysis, directive style indicates the principal typically uses a top-down management style in leading the school; all major decisions are made by the principals with little to no input from the faculty. In some cases, the principal did consult with his or her leadership team.
Distributive style indicates the principal is inclusive in decision-making and shares responsibilities. In addition, teachers often bring to the principal almost fully developed plans for initiatives and then lead the implementation of these initiatives. The teachers then are responsible for the results. The principal also consults with classroom teachers or other staff members prior to making decisions. For example, in one school the decision was made by the faculty to departmentalize certain grade levels. In other schools, teachers are a major part of the hiring process of other teachers.
Directed distributive style indicates that the principal does bring teachers into some decision-making, but the principal still makes most major decisions or the principal sets all the guidelines for decision-making. For example, one principal let each teacher determine exactly what should comprise his or her professional development; however, the decision was made based upon individual teacher’s evaluation and discussions with the principal.
As indicated in Table 10, during their second year as an SS principal, there were some changes in lead-ership styles as described by the principals. In year two, the two individuals who had been classified as directed distributive, were now able to revert to their innate leadership styles: distributive. In one case, the principal was now able to be an effective “coach” to individual teachers, helping them to make key decisions by asking the right questions. In addition, while the two individuals who had been very directive in year one remained directive, both had softened significantly as they continued to move their faculty from being completely “dependent” on the principal to one that had a greater capacity for decision-making and having open and direct conversations.
In addition, almost all of these principals had “destabilized” the school’s environment and operations during their first year. However, all of these principals tended to be more of a “stabilizer” during year 2. Typically their efforts were focused on improving the quality of what had begun during year 1. As one principal put it, “I was trying to take out the roller-coaster ride we had during the first year.”
All seven of the principals did acknowledge that leadership styles had to evolve based on where a school is in the turnaround effort. Many were able to move from being so task-oriented to being more balanced in their leadership style by taking processes and relationships into account also.

46 | Evaluation of Strategic Staffing January 2011
Office of Accountability | Center for Research and Evaluation
Table 10. Leadership Styles of the Principals: Year 2 Style Compared to Year 1Leadership Style Number of
Principals: Year 1Number of
Principals: Year 2
Directive 2 5Distributive 3 2Directed Distributive 2
Philosophy for Turning Around a School after Year Two By the end of their second year, most of the principals acknowledged that turning around a school is a long-term process. Principals still believe improving the quality of teaching and having policies and structures in place to hold both adults and students accountable for increasing student achievement are essential. However, after two years, a new theme emerged as a key component in turning around a school: building the capacity of the teachers, a slow but necessary process.
For example, one of the principals indicated that she uses the approach of “let’s learn together” as opposed to her making many of the decisions. For example, during year one her single-gender classes had not been as successful as she had hoped. Instead of disbanding the concept or telling the faculty what they could do to improve, she suggested to the staff that they disband all the single gender classes except 3rd grade. In the 3rd grade there was one all girls class and there was one all boys class. Some of the schools most effective teachers were given these classes. The faculty observed teaching techniques and used actual data to track the progress of these students. Not only did the faculty learn effective strategies for teaching boys and teaching girls, they actually learned effective strategies for teaching any students – for her a key component to turning a school around. This principal had in fact put two of her best teachers teaching these single gender classes.
Table 11 indicates what these SS principals believed after both their first and a second year was most essential in turning around a school.
Table 11. Philosophy for Turning Around a School: Opinion at End of Year 2 and Year 1
What Is Most Important To Be Able To Turn a School Around
Number of Principals: Year 1
Number of Principals: Year 2
Setting high expectations for adults and students and holding them accountable
4 1
Establishing relationships and building teacher capacity 2 3Improving instruction within classroom 2 2Having fundamental policies and structures in place 3 1Build urgency in faculty and create energy 0 1Obtain buy-in from faculty/staff for your vision 0 1

January 2011 Evaluation of Strategic Staffing | 47
Office of Accountability | Center for Research and Evaluation
Staffing Issues in Year 2During year 2, principals focused on having effective teachers in the classroom. The principals felt like they now knew their faculty and what needed to be done to improve instruction. As a result, most of the staffing actions taken by these SS principals during their second year fell into one of three areas:
• Improving instruction in the classroom by placing teachers on action plans• Placing teachers in positions where they could be most successful• Being creative in filling positions
Placing teachers on action plans.Unlike year 1, all seven principals placed individuals on action plans in year 2. One principal placed six individuals on action plans, four principals placed three teachers on action plans, one placed one teacher on an action plan, and one placed one full-time teacher and a part-time teacher on action plans. In most cases, the teachers placed on actions plans had been at the school when the SS principal arrived.
Placing teachers in different positions.In addition to knowing who needed to improve instruction, these principals now felt like they knew in which grade level or subject(s) teachers would be most successful. For example:
• One principal knew her 5th grade scores were not where they should be after her first year. Thus for year 2, she changed the fifth-grade teachers’ grade level assignments so they were no longer teaching 5th graders.
• Another principal had a teacher who could not work with students. She moved that indi-vidual into a position where she worked only with adults.
• Another principal moved several of her 1st and 2nd grade teachers to kindergarten or to 4th or 5th grade. That same principal had some of her other teachers loop up with their students.
Creatively filling positions.For various reasons, several of these SS schools lost multiple teachers. Typically these teachers retired or had a spouse who was transferred from Charlotte. However, a couple of the schools lost faculty to other SS schools and one lost her SS Assistant Principal when he was named as a principal. Still another lost four of her teachers to KIPP schools in other cities.
Using their flexibility, several of these SS principals filled positions in a creative way. For example, one principal needed a reading specialist. When her art teacher left, she traded in the art position for a reading position. Now art is taught within each classroom. Others were able to creatively hire facilita-tors and technology experts.
A couple of these principals indicated they had difficulty getting the right teachers in place. In one case an individual who was on an action plan kept going out on extended sick leave. In another school, the psychologist and the talent development teacher needed to be replaced. In another case, human resources tried to send a teacher displaced from another school to her school; the principal knew that

48 | Evaluation of Strategic Staffing January 2011
Office of Accountability | Center for Research and Evaluation
would not be a good fit.
Instructional Changes Made in Year 2During year 2, principals focused on ensuring consistent, appropriate content being taught in the most effective way in every classroom. To do this, the principals:
• Built teacher capacity through planning and observing• Refined language arts and math instruction by supplementing existing programs and
adding leading edge technology
Building capacity through planning and observing.During their second year, most of the SS principals continued to have teachers collaboratively plan math and language arts instruction. These teachers continued to increase their ability to use data as the foundation for their planning. There were two changes noted in the planning process during this second year. First, more of the schools than during the first year focused on ensuring alignment to NC Standard Course of Study as well as curriculum mapping which included documenting the scope and sequence of what was being covered in every class on each grade level.
Planning and professional development also were expanded to increase the capacity of the faculty to discover problems of practice. One school began using the “Instructional Rounds” process. The principal and other members of the leadership team defined low math performance as the area to be addressed. The faculty, through a structured process, identified four potential issues. Ultimately, these four issues were narrowed to one: lack of active engagement by students. Next, the faculty spent time concretely describing what active engagement and a lack of active engagement would look like. Finally, the faculty members spent time observing each other’s classrooms looking for evidence of active engagement. The teachers then would get together to talk about what they had observed and what they had learned.
Another principal instituted “Instructional Talk-Throughs.” Here a group of teachers worked together on a single issue such as effectively differentiating instruction within the classroom. Together they read the latest research, talked about successful strategies, planned together ways to implement within their classrooms, and then they observed each other’s classrooms. The classroom host/hostess told the others prior to going into the classroom what they would be seeing and also asked them to observe one or two specific things, whether it was content, methods, grouping of students, or student engagement. After the classroom visit, the group reconvened to talk about what they had observed, what worked and what did not, and how they would implement what they had learned in their own classrooms.
Refining language arts and math instruction.All of the elementary SS principals supplemented Math Investigations during their second year, many using Kathy Richardson materials and others using teacher-designed materials. In the middle school, teachers began cross-teaching reading and math.
Many of the principals augmented their reading programs by adding more focus on vocabulary

January 2011 Evaluation of Strategic Staffing | 49
Office of Accountability | Center for Research and Evaluation
building and writing workshop. At least two of the schools added reading time during the school day. One school added a 30 minute period of time for re-looping/re-learning. In that school, all students, teachers, and administrators took part in small groups for intense instruction needed to improve defi-cient skills as indicated by common assessments which had been generated by the teachers. Teachers in that school even developed types of assessments for their youngest students. That same school also ability/skills grouped students in reading and math ensuring more whole instruction with students on the same level. These groups changed every three weeks based upon skills and knowledge shown to be deficient. Another principal added focus on areas being tested by ensuring every 4th grade student had 45 minutes a day in writing and every 5th grade student had one hour a day for science.
Several principals added clubs and before or after school time to help students with reading issues, whether these issues focused on vocabulary or fluency. One principal added some gender-based clubs to address issues specific to interests of girls (e.g., healthy living including weight issues) or boys (e.g., character traits of successful, prominent African American males).
Schools used a variety of methods to refine instructional practices. One school brought in Lauren Seidman, Response to Instruction Implementation Coordinator for CMS, to work with more than twenty teachers on effective literacy delivery. Others began using specific programs or expanded exist-ing programs to supplement literacy instruction. For example, two schools lengthened Accelerated Reader (AR) time and ensured the fidelity of the delivery of the program. Another school began using Worldly Wise to increase vocabulary, while another used Reading A to Z to supplement reading mate-rials. One school was part of the state’s pilot program for Reading 3-D and had earlier piloted the Burst program for early literacy intervention. Yet another began using Fisher and Frey’s Literacy for Life resources.
Still others sought to use different techniques to actively engage students in their learning. Two schools implemented the use of visual thinking tools (e.g., thinking maps and graphic organizers) to assist students in organizing and communicating thoughts and ideas. One school implemented Universal Design for Learning whereby students now used a variety of ways to show what they have learned.
Two schools sought to include technology to engage the students. One integrated SmartBoards to make instruction more effective and more relevant. In another school, students began to Skype with others in other CMS schools and even schools in other countries, used Wiki, and used SmartBoards in all classes. One school focused on science ensuring each student had the content presented to them, had lab time, and accessed Discovery Education through SmartBoard technology.
Professional Development During Year 2During their first year as SS principals, most provided extensive professional development concern-ing effective instruction. A lot of this professional development laid the foundation for work in year 2 to increase student achievement. Even though a couple of principals did send some faculty for pro-fessional development, such as to Harvard for Instructional Rounds training, typically professional development was delivered at the school by district experts or by someone on staff.

50 | Evaluation of Strategic Staffing January 2011
Office of Accountability | Center for Research and Evaluation
During their second year, principals still continued to provide most of their professional development in-house. Most of the professional development centered on one of the following:
• Increasing student engagement through effective instruction• Using data to improve student achievement• Addressing specific needs within the school or specific needs of the individual
Increasing student engagement through effective instruction.Most of the principals focused much of the professional development on classroom instruction and student engagement. For example, many offered specific professional development on differentiat-ing instruction, keeping both skill levels and learning styles in mind. One principal offered Universal Design for Learning to help teachers learn how to enable students to show what they have learned in a variety of ways. Another principal offered instruction on using high level questioning in the classroom.
Using data to improve student achievement.Almost all of the principals indicated they had continued helping teachers learn how to use data in planning and assessing effectiveness of instruction. Most of the faculties continued their work with data by having teachers collaboratively examine student work and by identifying problems of practice through “instructional walk-throughs.”
Addressing specific needs within the school or specific needs of the individual.Principals also offered professional development for specific areas. For example, many found that teachers were having difficulty implementing Math Investigations. As a result, they offered in-house professional development on how to implement Math Investigations effectively.
Because of the focus many put on incorporating technology into their instruction, several of the principals offered their teachers training on effectively integrating SmartBoards and Skype into their instruction. Other professional development offered included team-building sessions, working with children in poverty, and more structured planning.
Two of the principals specifically indicated that their professional development was individualized based upon the needs and interest of the teachers. For example, one had each teacher choose a pro-fessional learning community (PLC) in which they wanted to be a member: technology, diversity, thematic units, or cooperative learning. At the end of the year each “choice PLC” demonstrated to the entire faculty what they had learned. Another principal individualized professional development based upon strengths and weaknesses evident in the new teacher evaluation. Differentiation of instruction was selected for the majority of the faculty.
Organization Changes Made in Year 2During their second year as principals of these SS schools, these principals continued to refine how planning works in the schools. Many of them increased the amount of time devoted each week to col-laborative planning. In addition, several of them restructured planning so that a set amount each week

January 2011 Evaluation of Strategic Staffing | 51
Office of Accountability | Center for Research and Evaluation
was spent on literacy planning and a set amount a week on math planning. Many did still have their academic facilitators lead the planning, although in some cases, teacher capacity had been built enough to enable teachers to lead the sessions. All of the principals indicated that planning was centered on data – data from common assessments as well as data from student work. One principal set planning as follows: (1) 90 minute block one week for literacy planning and the next week for math, (2) another 40 minute block each week for analyzing data – either literacy or math data depending upon whether the next 90 minute planning would be focused on literacy or math.Master schedules changed to enable more time for reading and in some of the schools increased time was given to science and social studies. Literacy blocks were extended in elementary schools, and in one school a “flex day” schedule was instituted whereby only reading and math were taught that day enabling more extensive time to be spent for relearning and enrichment. One principal “shuffled” all teachers in all grades to form different teams from the year before in order to take advantage of inter- and intra-team strength and leadership capacities. All the schools that had instituted single gender classes the year before continued with those; two of these schools in fact expanded the number of single gender classes. In another case, the teachers had wanted to departmentalize the 5th grade; however due to several issues including teacher personalities the structure was not effective for the students and was discontinued mid-year.
Table 12 indicates the types of organizational changes made by these principals in their first and second years.
Table 12. Organizational Changes Made by Principal at Strategic Staffing School: Comparing Year 1 and Year 2.
Changes made Number of Principals: Year 1
Number of Principals: Year 2
Changed master schedule 6 5Restructured how teachers do planning 6 5Single gender classes (expanding) 2 2Reorganized how teachers were used in order to lower class sizes
1 0
Changed ESL and EC instruction to an inclusion model
1 1
Creation of an after school achievement blitz 1
Cultural Changes Occurring in Year 2The SS principals devoted a lot of time and effort to the culture of their schools during this second year. Most reported increased evidence of trust and mutual respect compared to year one. One attrib-uted this phenomenon to the fact that the faculty now comprised individuals who wanted to be there; another attributed it to the teachers now taking ownership for these transformational strategies. Many teachers in that school had taken on leadership roles partly due to the principal’s having to be absent from the school for an extended period of time. This principal believes true buy-in had occurred and that teachers were no longer acting merely out of compliance.For the most part, the principals did report much more collaboration by the teachers and many more data-driven decisions. Teachers were involved in vertical and thematic planning and were now requesting

52 | Evaluation of Strategic Staffing January 2011
Office of Accountability | Center for Research and Evaluation
more and more data to assist them in their planning. In addition, two of the principals incorporated setting of SMART Goals by teachers and students at the grade, class, and even student level.However, on the other hand, at least one of the principals indicated year two was extremely exhausting – in fact much more so than year one. This principal attributed part of that due to adrenalin kicking in for the first year and not the second. However, this individual felt exhaustion was largely due to so many of the teachers in that school still not being on board with using student data or having active professional learning communities.
Other Changes Occurring in Year 2In addition to instructional and organizational changes, several SS principals mentioned other changes they had implemented during the year. A couple of the principals began to address needs other than academics. For example, one principal began a Healthy Snacks program three days a week, while another put celebrations into place representing the customs of the many cultures represented within the school. Another principal really worked at improving communication with parents, including sim-plifying the report card which had been developed for that school.
Major Focus in Turnaround Efforts Indicated by Cohort 1 Principals at the End of Year 2Previous results indicated that SS principals during their first year had typically achieved whatever their major focus had been for the year, whether improving student achievement or changing the culture within the school. At the end of year one, each principal was asked what his or her focus had been for that year and what his or her focus would be for the coming year. At the end of year two, these princi-pals were asked the same questions. Table 13 summarizes what each SS principal said at the end of year one and year two. As noted in the table, during year two more principals focused on improving the quality of instruction than on any other area. At some point during our interview all the principals indicated a belief that excellence in instruction was key. In some cases the principal indicated more than one focus.
Table 13. Principals’ Area of Focus by YearNumber of Principals: Year 1 Number of Principals: Year 2*
1st Year Focus 2nd Year Focus 2nd Year Focus 3rd Year Focus
Discipline 2Quality of instruction 3 1 3 2Increased professionalism for staff 1Student achievement (Specifically reading in Year 2) 1 2 1 1Changing culture 2Higher expectations for adults and students 1Accountability for adults and students 1 1 1Student engagement in classroom 1Rigor of work done by students 1Increased capacity of teachers and administration 1 1Creation of collective ownership of transformation 1Quality of all work begun 2 1
* Question was not asked of one principal

January 2011 Evaluation of Strategic Staffing | 53
Office of Accountability | Center for Research and Evaluation
Future Plans Indicated after Year 2After each of their first two years, each principal in the first cohort of the SS initiative was asked what he or she would like to do at the end of the three years they had committed to that specific school. As noted in Table 14, several of the principals had somewhat altered what they believe they would like to do. Some of the changes may be attributed to difficult years a couple of the principals had due to family issues and due to trying to bring about such massive changes. Other changes may be attributed to the successes some of these principals had. Those principals now realized they would like to share how they were successful to other educational leaders in the district.
Table 14. Principal Plans for the End of Their Third Year.
What Would Like To Do Number of Principals: After Year 1
Number of Principals: After Year 2
Become the SS principal in another school 2 1Stay at present school 2Either move to another school or stay at present school
2 3
Do something else 2Unsure 1 1
Challenges and Successes Found During Year 2Several of these principals indicated that in many ways year 2 was more challenging than year 1. In par-ticular, one principal specifically said that “battle fatigue” really set in during the second year. Several told of the challenges in trying to implement so many transformational changes and often trying to implement them with so many teachers remaining who had either been loyal to the previous admin-istration or who merely had “hidden out” in the school for years. Pushback by faculty was tiring. A couple of the principals told us that the work became even harder with so much of the support person-nel, such as the family advocate, psychologist, and social workers, being taken from the school. In all the cases, these principals indicated that their biggest challenges centered on working with the “whole child.”
Almost all of the principals spoke about the vocabulary deficiencies of their students and the work their teachers were doing to increase their students’ working vocabulary. A couple principals indicated that it had been a challenge to get their parents and their surrounding community to believe that achieve-ment can improve and to have the urgency to support the students’ learning. In addition, some of the principals indicated that it had been a challenge to get effective teachers and support personnel in place.
On the other hand, all of the principals spoke of their many successes. All seven principals spoke of the improvement in the culture of the school. Even those who still had some dissension within their facul-ties talked about the collaboration that their teachers and staff are showing. Several specifically spoke about the willingness teachers now have to observe each other, plan together, and share ideas. Others talked about their faculty now buying into the transformation taking place, not merely complying with new strategies and procedures. Many of the principals talked about the increased capacity among their teachers and individuals on their administrative staff.

54 | Evaluation of Strategic Staffing January 2011
Office of Accountability | Center for Research and Evaluation
Insights by Strategically Staffed Principals after Year 2Throughout the conversations, all of the principals shared their insights after spending two years in these SS schools. The following are some of these insights:
• Title I schools and their students are fragile and their resources need to be protected.• The most successful teachers in these schools are those whose classroom style lies between
being empathetic and being very strict in holding students accountable.• An increased amount of time each day for reading and math instruction is crucial. In
addition, ImagineIt and Math Investigations textbooks by themselves are not enough. There must be other materials to supplement each of these.
• Giving students different tools for learning such as Lindamood Bell’s techniques of Visualization and Verbalization, is crucial. Children need material presented to them in several ways.
• It is extremely difficult and tiring to create effective, sustainable change, but that is what is absolutely necessary. Sustainable change is slow.
Cohort 2 Leadership ExperienceOverall the principals in the second cohort of SS principals were slightly younger than those in the first cohort and had less experience leading a Title I school. The number of years of experience as a principal and whether he or she had ever led a Title I school are indicated in Tables 15 and 16.
Table 15. Number of Years as a Principal: Cohort 2 Compared to Cohort 1 First Year.
Years of Experience as Principal
Number of Principals: Cohort 1
Number of Principals: Cohort 2
< 5 years 0 25-10 years 3 211-20 years 3 3> 20 years 1
Table 16. Number of Principal with Title I Experience: Cohort 2 Compared to Cohort 1 First Year.
Title I Experience? Number of Principals: Cohort 1
Number of Principals: Cohort 2
No 3 5Yes 4 2
Leadership Styles of Cohort 2 Strategically Staffed PrincipalsDuring our interviews each of the Cohort 2 principals was asked about his or her own leadership styles and was asked for some examples to illustrate the style. In addition, each interviewer listened for indi-cators throughout the conversation that would help in describing the leadership style. First principals were classified as directive, distributive, or directed distributive in their leading their faculties and staff.
Principals in Cohort 2 fell into each of these categories. For example, one principal classified as directive,

January 2011 Evaluation of Strategic Staffing | 55
Office of Accountability | Center for Research and Evaluation
immediately upon arriving at the school in March 2009, discontinued using Positive Behavioral Interventions and Supports (PBIS) believing it had been ineffective, even though the school had used this program for years. There was no input from the existing faculty and staff. Three of the principals were classified as distributive. As an example of this leadership style, one principal enabled her teachers within each grade level to determine curriculum, teacher schedules, and even determine how students will be taught when a teacher must be absent. In addition, there were a couple of principals classified as directed distributive. As an example, one principal believed she had strong teacher leaders in her school, but felt they needed “guide rails” particularly in this first year. As a result, she was very directive in telling her staff the specific “ends,” such as increasing reading time, but left the “means” totally up to the teachers.
As shown in Table 17, more of Cohort 2 principals felt they were “directive” in their leadership style than did their counterparts in Cohort 1. However, there were probably only two principals in this cohort who were as “top down” as the two in the first cohort. As was true in Cohort 1, these two indi-viduals had more experience as principals in Title I schools than others in that cohort. One of the principals in Cohort 2 described her leadership style as “I know what I am doing and would like others to get out of the way.” However, she quickly added that she believes in shared leadership, but at this point in their reform efforts there needed to be very directive leadership without the reforms being perceived as “leader-driven.” Another one of the principals was also very directive in eliminating poli-cies and procedures and in changing the way subjects were taught. Specifically she went from a more “traditional” way of teaching each subject separately to an inquiry-based methodology whereby all sub-jects are taught through social studies and science topics. While that principal did have a “right-hand” person assisting her in implementing her plan, this was her plan completely. In both of these cases, the principal was very “task-driven” and much lower in interpersonal relationships during this first year.
One of the individuals who described herself as directive in fact did have a directive leadership team, but she was very distributive in decision-making among members of this leadership team. The lead-ership team was comprised of herself, an assistant principal, and an academic facilitator. She truly gathered input from these individuals and while decisions were top-down driven, the decisions came from the entire leadership team.
In addition, principals’ leadership styles were categorized as being more transformational or transac-tional. The transformational principals had a vision that often required radical changes in the school and they were able to get others to follow them. Transactional principals typically managed the school and its activities. Often these activities centered on single actions to make the school run more effec-tively or efficiently; typically there were no philosophical changes in instruction or operations. In Cohort 2, the principals with the most experience as an administrator tended to come to their schools with a vision of what the school needed to become and typically the vision was very different from the present reality. Thus, these principals tended to be the most transformational as opposed to transac-tional. Whether transactional or transformational, the majority of these Cohort 2 principals did change their schools during the first year. One intended to “re-culture the school totally,” which she did, while two others radically changed the entire instructional model.

56 | Evaluation of Strategic Staffing January 2011
Office of Accountability | Center for Research and Evaluation
Table 17. Leadership Styles of the Principals: Cohort 2 Compared to Cohort 1 First Year
Leadership Style Number of Principals: Cohort 1
Number of Principals: Cohort 2
Directive 2 4Distributive 3 2Directed Distributive 2 1
Leadership Team Brought with Them by Cohort 2 PrincipalsEach principal was allowed to bring key leadership team members as well as five teachers with them to the school. As noted in Table 18, fewer in this second cohort than in the first cohort brought their assistant principal with them, but these principals instead brought a Dean of Students with them. Also, knowing it was essential to have a strong instructional leader in the school and someone sharing their philosophy, almost all brought an academic facilitator with them. Most brought teachers they already knew, and those who brought teachers from the district’s list indicated that in many cases they wish that they had been able to observe them prior to hiring them. While no principal doubted that some of those individuals were effective teachers in their former schools, several indicated that many of those teachers were not so effective in teaching children in poverty. As noted in the table, several of the prin-cipals chose positions other than classroom teachers as part of their five.
Table 18. Leadership Team Members Brought to the SSI School
Leadership Staff Number of Principals Bringing Specific Leadership Staff with Them:
Cohort 1
Number of Principals Bringing Specific Leadership Staff with Them:
Cohort 2
Assistant Principal 5 3Dean of Students 2Facilitator(s) 6 6Teachers they knew 4 5Teachers from list of high growth teach-ers in District
7 3
Behavior Management Technician 3 0Reading Specialist 0 1Technology/Media 0 1Financial Secretary 0 1
Philosophy for Turning Around a School Indicated by Cohort 2 Principals after Year 1The majority of the principals comprising the second cohort of SS principals indicated that improving instruction within the classrooms was paramount to turning a school around. This went hand-in-hand with their strong belief that having effective staff in the right places is crucial. In addition, three of the principals specifically indicated that it was essential to have not only a compelling common vision about effective instruction, student learning, and a strategic plan to get there, but also as one principal put it, “a faculty willing to put in the necessary time and energy to make the vision a reality.”

January 2011 Evaluation of Strategic Staffing | 57
Office of Accountability | Center for Research and Evaluation
Trust and leadership were mentioned by one principal as key components, and she was adamant that it was crucial for a principal to have some early successes in order to build that credibility and trust in her leadership.
As Table 19 shows, what Cohort 2 indicated was key in turning around a school differed from what the first cohort of principals indicated. That difference may be attributed to the second cohort’s being able to get into their schools in March 2009 prior to their first year beginning July 2009. Many in this cohort had already begun setting high standards from March through June. In addition, during those few months they had been able to observe classrooms and realize where effective instruction was sorely lacking.
Table 19. Philosophy for Turning a School Around: Cohort 2 Compared to Cohort 1 First Year
What Is Most Important To Be Able To Turn a School Around
Number of Principals: Cohort 1
Number of Principals: Cohort 2
Setting high expectations for adults and students and holding them accountable
4 2
Establishing relationships and building teacher capacity 2 0Improving instruction within classroom 2 4Having fundamental policies in place 3 0Having the right staff in place 0 4Having a shared vision among leadership and faculty/staff 0 2Providing great professional development 0 1Having an early success in improvement 0 1
Most Pressing Initial Issues Found by Cohort 2 PrincipalsFrom March, when these principals arrived in their schools, until June of that year, several issues became apparent. The majority of the principals found two themes emerging:
• Ineffective instruction and lack of student engagement in most classrooms• Extremely low morale in the school
Ineffective instruction and lack of student engagement.One principal said not only was there no alignment of instruction with the NCSCOS, but there was a “culture accepting of low expectations, little energy, and no urgency to improve.” Another principal stated that all instruction in her school was activity-based and often had little to no alignment with NCSCOS. Another principal stated that her school had become “a great place for ineffective teachers to hangout or hide.” And perhaps more alarming, one principal stated that as she observed classrooms she discovered not only was instructional content not in alignment with the NCSCOS, but was often inac-curate. Several of the principals stated that there was little true instruction occurring. In some schools, there was only a teacher in front of the room merely talking. In other schools there was extreme depen-dency on programs with one principal indicating the school had four or five different reading programs being implemented simultaneously, but none with fidelity.

58 | Evaluation of Strategic Staffing January 2011
Office of Accountability | Center for Research and Evaluation
Extremely low morale.While one principal found high morale when she came in March, the majority of the other principals found extremely low morale among the adults in the building. Some phrases heard were: “the school had a down-trodden feeling,” “there was a cloud of oppression hanging over the school,” “apathy was everywhere,” and “teachers operated purely in a compliance mode.” In one of the schools, the principal indicated that the school was being run by five or six adults with “hostile attitudes” who intimidated all others. It appeared the climate in these schools was not conducive to student learning.
There were other concerns noted by these principals, but not the same as those indicated by Cohort 1. As Table 20 indicates, as opposed to what the first cohort of principals stated, only two of Cohort 2 principals named lack of discipline as a major issue. However, one did say that she found more students in the halls than in the classroom, and that, even though at the time the school had a large population, the number of office referrals from September of that school year through February (3,000) was out of hand.
Most of the principals began trying to resolve a few of these issues during those first few months. Others used the time to assess what needed to be done beginning that summer and the next school year. One indicated that there were so many issues needing to be addressed that it felt like she was playing “Whack-A-Mole.” She determined that in those months she needed to develop her plan for the next year.
Table 20. Most Pressing Issues Noticed First When Beginning Principal at Strategic Staffing School: Cohort 2 Compared to Cohort 1 First Year
Issue Noticed Number of Principals: Cohort 1
Number of Principals: Cohort 2
Lack of discipline 4 2Too much emphasis on behavior – school’s major focus
2 1
Low student achievement 3 0Low expectations for students 2 1Ineffective instruction 2 5Adult culture of low morale and no urgency 2 4Too many programs 0 3Ineffective leadership 0 2Ineffective exceptional children’s program 1 0Lack of technology 0 1No policies 0 1Dirty and/or cluttered facility 1 2
* Others put individuals on Action Plans but did not indicate that as a first action upon becoming principal

January 2011 Evaluation of Strategic Staffing | 59
Office of Accountability | Center for Research and Evaluation
Initial Actions Taken by Cohort 2 PrincipalsAs stated above, most of the principals used the time they were in the schools from March until June as a time to assess and plan. During those months, many met individually with faculty and staff members to find out from them what they believed had worked and had not worked in the past. This helped the principals be able to “hit the road running” once school was over that June.
Because this cohort of principals had had time to observe teachers during those spring months, most knew where the weak spots were in instruction. Thus, for this cohort of principals many immediately set instructional expectations and placed individuals on action plans; the larger schools had as many as five to nine placed on action plans. Many more teachers were placed on action plans by the second cohort of principals than were by the first cohort of principals who did not get the opportunity to observe teaching prior to their year beginning.
Others immediately began putting into place strategies for strengthening instruction and assigning curriculum. One principal set up five weeks of workshops for the summer of 2009 focused entirely on what does effective teaching look like. Also, because there had been so much dependency on pro-grams, several of the principals first “took all those away.” One indicated that when she first came, she found that students were using computer software programs for over half of the day. She took away all those packaged programs and even stopped Accelerated Reading as it was not being used correctly or effectively. Another principal changed instruction from being textbook or program driven to “student needs” driven. This even meant she had teachers put away ImagineIT and Math Investigations books.
Several of the principals did say they began to ensure all their faculty and staff members understood expectations. At one of the first faculty meetings one principal explained her expectations for them and the students, and then she told them to “see the light or feel the fire.” She also quickly let them know if they wanted to be part of the journey she would provide them support needed. Another laid down her expectations saying, “Here is what I expect and I will monitor my expectations.” That principal also created a “Playbook for Academic Expectations” that was to be used by each teacher.
There appeared to be less emphasis on developing policies and procedures than there was with the first cohort of principals. Table 21 also indicates some did add technology and planned professional development. In addition, another problem noted by two principals was the condition of the school. While many more in Cohort 1 had taken early actions to resolve their facility issues, the second cohort principals who did raise facility issues noted the same issues as those noted by principals in the first cohort: these issues included clutter being everywhere and, in one of the older schools, having halls and rooms that were dirty, dark, and lacked resources. One of the two principals spent much of the summer cleaning out closets and moving offices and conference rooms to be able to use their facility more effectively. The other principal enlisted community support to have the building totally cleaned, have all the halls and some of the rooms painted a brighter, lighter color, have bookcases built and filled in every classroom, have the support services offices totally redone, and have a clothes and book bag closet totally stocked.

60 | Evaluation of Strategic Staffing January 2011
Office of Accountability | Center for Research and Evaluation
Table 21. First Action Taken When Beginning Principal at Strategic Staffing School: Cohort 2 Compared to Cohort 1 First Year
First Action Taken Number of Principals: Cohort 1
Number of Principals: Cohort 2
Added structure with policies and procedures
4 2
Focused on building relationships with faculty and staff
3 2
Set expectations for instruction including putting individuals on Action Plans*
0 3
Addressed curriculum and alignment issues
2 3
Provided needed professional development 3 1Added technology 0 1Addressed facilities issues 2 2
* Others put individuals on Action Plans but did not indicate that as a first action upon becoming principal
Instructional Actions Taken During Year 1 by Cohort 2 PrincipalsDuring the March to June 2009 timeframe, as noted above, the majority of these SS principals deter-mined ineffective instruction was a major issue within their schools. In fact, over 70% specifically noted ineffective instruction as one of the most pressing needs in their school. Thus, improving instruction quickly became one key focus area during this first year for Cohort 2. While both Cohort 1 and Cohort 2 used professional development to bring about instructional changes, as indicated in Table 21, other instructional changes brought about by Cohort 2 principals in their first year did not necessarily mirror changes made by Cohort 1.
Almost all of the principals indicated that instruction, assessments, and the NCSCOS were not aligned when they first came to the school. Several principals told about the same curriculum being taught in multiple grades, and a couple of principals indicated what was being taught was not part of the NCSCOS. As a result, all of the principals provided professional development aimed at improving instruction. Some of the professional development addressed specific parts of the instruction, such as how to effectively teach math using Math Investigations. Other professional development addressed more general issues such as classroom management and differentiation of instruction – two key ingre-dients in an effective classroom.
Several of the principals mentioned there had been low academic expectations for their students. As a result, one principal placed emphasis on engaging students through rigor and relevance. She had many students placed into Honors Class, placed all students in AVID classes, and incorporated Robert Marzano’s higher level questioning within each class.
Because of deficiencies in students’ reading and writing, many of these principals focused on non-fic-tion reading and writing and devoted much time to vocabulary building. A couple implemented Word Build and Writers Workshop. Another implemented “Text Talk” and another brought in Four Block

January 2011 Evaluation of Strategic Staffing | 61
Office of Accountability | Center for Research and Evaluation
Reading. In one school, all reading materials including science and social studies materials, stories, and even some books were rewritten by teachers and the facilitator to meet the various reading levels of students. In this way discussions about the materials could be held with all students.
Two of the principals totally transformed their instructional model by teaching everything including literacy and math through thematic units within science and social studies. One totally implemented the Big6 methodology which is an inquiry-based, problem-solving model.
Cohort 2 depended more on programs than the first cohort of SS principals. However, there were several who refused to incorporate any new programs since, as one principal said, “dependency on pro-grams inhibits building teacher capacity; programs become crutches for teachers.” In addition, Cohort 2 appeared to be more willing to change entire curriculums than Cohort 1.

62 | Evaluation of Strategic Staffing January 2011
Office of Accountability | Center for Research and Evaluation
Table 22. First-Year Initiatives Focused on the Instructional Program As Indicated by the Principals: Cohort 2 Compared to Cohort 1 First Year
Instructional Action Taken Number of Principals: Cohort 1
Number of Principals: Cohort 2
Brought in specific programs, some bought and some not1,2 3 7Provided extensive professional development to improve quality of instruction3,4
5 7
Used various intervention models: Intensive reading, Response to interven-tion and Pyramid of Support
2 1
Focused on non-fiction reading and writing 3Fully implemented Math Investigations 3Focused on ensuring aligning of instruction with grade level NCSCOS 2Integrated all subjects with all instruction occurring through science and social studies
2
Implemented Big6 methodology in all classes – inquiry-based instruction 1Gave common assessments and used results extensively in planning 4Examined all lesson plans to ensure effective plans 3Modeled effective lesson planning and instruction 2Created standards-based report card so parents have meaningful information about goals and objectives for quarter and year and where student is at that time
1
Created assessment tools for K-1 math 1Had teachers use fundamental CMS curriculum such as Accelerated Reader 1
1 programs indicated by Cohort 2 principals:• Word Build• Kathy Richardson math• Middle School math program• 4 Block• TextTalk• Lucy Caulkins Writers Workshop• AVID school wide
2 programs indicated by Cohort 1 principals:• Orton & Gillingham Reading Program• AIMSWeb and Maze Reading• STAR• Lucy Caulkins Writing Workshop• Kathy Richardson Math• Word Study for K-2• Think Maps school wide• AVID school wide
3 professional development indicated by Cohort 2 princi-pals, largely taught in-house by administration and faculty:
• Differentiation in instruction• Kagan Cooperative Learning• Book study: Ron Clark’s Essential 55• Curriculum Mapping• Effective reading instruction• Richard DuFour’s Professional Learning Community• Using data to improve instruction: Data Wise• Robert Marzano’s Instructional Strategies: Higher
Level Questioning• Inquiry-based learning – Big6 methodology• Teaching children in poverty• Effective science instruction• Effective Math Investigations instruction• Effective classroom management
4 professional development indicated by Cohort 1 princi-pals, taught in-house by administration and faculty as well as faculty and staff being sent to specific workshops:
• Effective instruction taught by experts• Love and Logic• Instructional Rounds• Universal Design for Learning

January 2011 Evaluation of Strategic Staffing | 63
Office of Accountability | Center for Research and Evaluation
Operational Actions Taken During the First Year by Cohort 2 PrincipalsIn order to bring about instructional changes, almost every Cohort 2 principal changed the way plan-ning occurred in their schools and all of them changed the master schedule. The amount of time in direct instruction often lengthened. Both middle school principals went to 90-minute blocks; some of the elementary school principals lengthened reading instruction time each day. For example, one implemented two periods a day for reading: one for ImagineIt and the other for Workshop where reading instruction was differentiated. In that case, reading blocks were scattered through the day with some students having ImagineIt first and others having Workshop first. This enabled the four Teaching Assistants in the school to be used most effectively.
Planning changed dramatically in these schools. One principal established 90 minutes a week collabor-ative planning for literacy, 45 minutes for collaborative math planning, and two individual 45-minute planning periods a week. Another changed planning so that every teacher had one 90-minute common planning period a week and a common 45-minute planning period the other four days in the week. For that school, planning also occurred on workdays, Saturdays, and Sundays. One principal changed her schedule to ensure that her specials teachers also had planning periods.
The way planning occurred became very structured in most of these schools. While all principals indicated their planning was data-driven, typically through the Data Wise process, some had specific planning days set aside just for analyzing data and understanding the implications of the results. Many had their facilitators actually set the agendas for every planning session and lead the meetings. One principal had her facilitator plan the agenda, send out pre-plan work to be done, and even download resources or links to resources on thumb drives. Then during the planning sessions, the teachers and facilitator would together create lesson plans ensuring they were aligned to the NCSCOS. The facili-tator recorded all these plans and then distributed them to the teachers. In another school, teacher leaders were able by second semester to set the agenda for planning and lead the teachers through the sessions. At that school, much of the common planning was set around professional journal articles based upon the students’ needs at the time.
In most of the schools, a structured lesson planning process was put into place that included a specified format for the planning and then structured observations of the instruction. However, unlike any of the other principals in either Cohort 1 or 2, one principal indicated she never looked at lesson plans, did not require them to be turned in, and did not perform any type of 3-minute walk throughs. Instead she felt she knew the quality of instruction and what student learning was occurring by informally being in the classrooms throughout the day. Any issues with instruction were handled on a one-to-one basis.
Another principal used some of her teaching positions to create a lead teacher model. These lead teach-ers served as coaches, analyzed all data, led planning, worked with small groups of students needing help, modeled effective teaching, and co-taught some of the classes.
As Table 23 indicates there were other operational changes made. For example, two of the principals changed how students changed classes and instructors during the day. At one middle school, to help eliminate many problems that occurred in the halls, students were now walked to their “specials.” In one of the elementary schools, to create stability and cut down on confusion, teachers moved from class

64 | Evaluation of Strategic Staffing January 2011
Office of Accountability | Center for Research and Evaluation
to class, but the students remained in one classroom throughout the day. Not only were there fewer discipline problems, but also having all teachers in a grade level interact with all students in that grade enabled teachers to truly know every student in his or her grade.
One middle school principal rearranged classrooms to more accurately reflect the middle school concept. No longer were core subject teachers within a grade level located throughout the school. Instead all 6th grade core teachers were on one hall, all 7th grade teachers were on another hall, and all 8th grade teachers were on a third hall. In addition, one elementary principal converted her school into “family units.” All teachers and students in kindergarten and first grade became one family; all 2nd and 3rd grade teachers and students formed another family, and all 4th and 5th grade teachers and students comprised a third family. Each family had seven adults in it: 2 certified teachers, an EC teacher and assistant, a teacher assistant, and Title I personnel. Each family was responsible for planning curricu-lum and scheduling, teaching together, and learning together.
Two of the principals did go to an inclusion model for their exceptional children and for their English as a Second Language instruction. Unlike Cohort 1, none of the principals mentioned beginning single gender classes.
Table 23. First-Year Initiatives Focused on the School Operations As Indicated by the Principals: Cohort 2 Compared to Cohort 1 First Year
Operational Action Taken Number of Principals: Cohort 1
Number of Principals: Cohort 2
Changed master schedule 6 7Restructured how teachers do planning 6 5Changed ESL and EC instruction to an inclusion model 1 2Reorganized how teachers were used 1 1Changed how students changed classes and instructors 2Changed class locations and/or set-up of grade levels 2Changed how Title I money is spent 2 0Single gender classes 2 0Creation of after school programs 1 0
Other Actions Taken During Year 1 by Cohort 2 PrincipalsAs noted above, several of the principals noticed a “defeated” atmosphere when they first came to their schools. Much of this centered on teachers and staff who were merely trying to survive and held out little hope for their students. However, many principals indicated that same attitude prevailed among parents and even community members. As a result, several of the principals had initiatives aimed specifically at raising expectations of parents and getting the community involved. One principal estab-lished Instructional Nights, created a newsletter that went out to every family, improved signage and announcements for upcoming events, and used ConnectEd more effectively. Two principals specifi-cally “reignited” community involvement including churches, civic groups, Parks and Recreation, and businesses in the community. Volunteer programs were revitalized. One principal said on several occa-sions she had 20-30 volunteers working in her school at one time.

January 2011 Evaluation of Strategic Staffing | 65
Office of Accountability | Center for Research and Evaluation
Several of the principals began clubs and other opportunities designed to increase school pride as well as individual confidence. For example, one middle school principal was able to provide opportunities for the band and Step Team to visit other schools. One elementary principal brought in Right Moves for Youth and also began clubs in art, chorus, and chess. Math Olympiad was begun as well as track opportunities for boys and girls.
As Table 24 indicates, two of the principals significantly increased the installation and use of technol-ogy within each classroom. Typically this included SmartBoards in each room and the use of online resources to assist in planning and increasing student engagement in learning.
One middle school principal and one elementary school principal began summer programs for their rising 3rd graders and 6th graders. Both principals believed this would give these students a head start both in academic skills and in leadership skills.
Table 24. Other First-Year Initiatives As Indicated by the Principals: Cohort 2 Compared to Cohort 1 First Year
Action Taken Number of Principals: Cohort 1
Number of Principals: Cohort 2
Increased use of technology in classroom, e.g. SmartBoards, online resources, etc.
2
Had facility cleaned and painted 5 1Worked with corporate partners to remodel part of school, have new bookcases built and stocked, signage etc. installed
1
Increased community, corporate and parent involvement in day to day operations of school
2 3
Began clubs, Step Team 1 2Introduced summer programs for rising 3rd graders and rising 6th graders
2
Made administration decisions more transparent and opened up principal’s door
3
Changed how rooms were used 1Increased focus on decreasing tardies and absences 2Converted school to uniform school 1Enforced dress code 1Created student pledge : respect, responsible, ready to learn 1Gave students more voice in what they wanted 1Provided workshops and incentives to encourage teachers to collaborate
2

66 | Evaluation of Strategic Staffing January 2011
Office of Accountability | Center for Research and Evaluation
Focus for Reform Initiated by Cohort 2 PrincipalsThe SS principals in Cohort 2 were asked to sum up what had been the single major focus during their first year at their schools. Then they were asked what the major focus would be for year 2. Table 25 summarizes the focus for each year. For comparison, answers given to these same questions asked of Cohort 1 principals after their first year are given. The total for each year often was more than seven since a couple of the principals gave more than one focus for a single year. As noted in the table, Cohort 1 principals appeared to have more focuses during their first year; yet throughout there was a strong focus on improving the quality of instruction.
Table 25. Focus by the Principals During the First Two Years
Number of Principals: Cohort 1 Number of Principals: Cohort 2
1st Year Focus 2nd Year Focus 1st Year Focus 2nd Year FocusDiscipline 2Quality of instruction 3 1 2 3Increased professionalism for staff 1Student achievement 1 2Changing culture 2 2Higher expectations for adults and students 1Accountability for adults and students 1 1 2Student engagement in classroom 1 1Rigor of work done by students 1 1Vertical curriculum alignment to NCSCOS 1 2Quality of all work begun 2
Challenges Faced by Cohort 2 Principals in Year OneAlmost all of the principals remained optimistic and energized by the progress made during their first year and were excited about the possibilities for year 2. However, as Table 26 indicates year one was not without challenges. Over half of the principals reported human resource challenges. These ranged from many of the principals indicating they felt too little support from human resources particularly during the reduction in force process and in other efforts to replace ineffective teachers. Others reported the extremely slow process in filling vacancies and the difficulty they had had since the transfer fair had not occurred that year. Many also cited the need to replace more than five teachers.
With a larger percentage of the faculty buying into the principal’s concepts from the beginning appeared to have made a positive difference both in student achievement and the overall culture of the school. Principals with a smaller number of faculty and for whom replacing five teachers represented a large percentage of the staff appeared to be able to make more progress in the turnaround efforts than those schools where the five teachers represented a smaller percentage of the total staff. This same effect was also seen in the schools that had had a large turnover of teachers enabling the principal to replace more than five teachers.

January 2011 Evaluation of Strategic Staffing | 67
Office of Accountability | Center for Research and Evaluation
Others who had not been part of an administrative team leading a Title I school previously cited Title I paperwork as a challenge, both because of the lack of familiarity and its time-consuming nature. Several of the principals had instituted massive changes and therefore reported their biggest challenges came from a need to prioritize as well as the physical and emotional exhaustion coming from these changes.
Table 26. Biggest First-Year Challenges Faced by Principals
Biggest Challenges Number of Principals: Cohort 2
Issues with and/or lack of support from Human Resources 4So many overwhelming tasks needing to be completed that it was hard to prioritize and created emotional and physical tiredness
2
Amount of Title I paperwork and lack of knowledge about what all had to be completed for Title I
1
Issues outside school walls – needs of children from generations of poverty
1
Eliminating apathy-getting community, parents, teachers, and students believing they can do it
1
Future Plans Indicated by Cohort 2 PrincipalsThese principals had completed only their first year of a three year commitment. But to better under-stand these individuals and their thought process, each was asked what he or she believed they would like to do at the end of the third year at this particular SS school. Several changes have occurred since these principals were asked the question. In one case shortly after the interview, one middle school principal was named an Area Superintendent in the District; in another case, one of the elementary school principals was moved to one of the District’s suburban elementary schools. In addition since our interviews, three of the elementary schools were chosen to be restructured to pre-K-8 schools. The choices indicated in Table 27 reflect what each of the principals said prior to these changes occurring.
Table 27. Cohort 2 Principals’ Plans for the End of Their Third Year
What Would Like To Do Number of Principals: Cohort 1
Number of Principals: Cohort 2
Become the SS principal in another school 2 1Stay at present school 2 4Either move to another school or stay at present school 2Move to a District position working with principals or in curriculum or retire
2
Unsure 1 0

68 | Evaluation of Strategic Staffing January 2011
Office of Accountability | Center for Research and Evaluation
Additional Insights by Cohort 2 PrincipalsDuring the course of the interviews, these principals opined about the SS initiatives, offering sugges-tions for increasing the probability for success and voicing some concerns. Many of these concerns and suggestions mirrored what had been heard during conversations with Cohort 1 principals.
• There appeared to be mixed opinion as to whether a school can be turned around in three years. While several of the principals indicated it would take closer to five years, one did suggest that were adequate resources given, the turnaround could be made in three years.
• One principal suggested that a SS cohort should be named every two years so that a school could receive extra resources (including replacing ineffective faculty/staff) for two years and not just one.
• There was concern that there was not enough succession planning for the end of the three years.
• There was concern that with the naming of so many SS schools that there may not be enough strong, effective leaders (administration as well as teachers) to go around.
DISCUSSIONOverall, the results presented here provide unclear conclusions about the efficacy of the SS initiative. Comparisons based on student achievement between SS and non-SS teachers tended to reveal higher levels of performance for students instructed by SS teachers, but the pattern was neither consistent nor overwhelmingly significant. What is clear, particularly stemming from the principal interviews, is that each school in need of assistance provided a unique set of challenges and opportunities, and that these issues could have been viewed differently dependent on the principal assigned to the school. As such, successful SS principals must adopt a leadership style capable of evolving depending on where the school is in its reform efforts. The principal must be able to assess what is needed and must have the skills to be able to adapt along with their school. Further, this adaptability must be maintained across time, as the development of authentic distributed leadership where teacher and staff trust and respect their leader can be a long, arduous process.When a principal comes into a school that has been extremely low performing, he or she may find individuals within the school reluctant to change or who have totally detached themselves from the school and the students. Several principals mentioned a general apathy exhibited by staff, necessi-tating a directive leadership style focused on key tasks necessary to effect change. In this sense, it is essential that the principal attain some early successes to build relationships and buy-in from stake-holders. Principals exercising this type of leadership style tended to have larger gains in proficiency and ABC Growth based on EOG assessments. Unfortunately, these same schools tended to show smaller gains in their second year, possibly due to a reduction in sustained energy and enthusiasm. Principals taking a directive approach were associated with lower mean constructs scores based on teacher survey responses compared to principals taking a distributive approach. Because of their different past experiences and because of the timing for the principal’s taking over the SS schools, specific actions taken during the first few months varied significantly. However, both

January 2011 Evaluation of Strategic Staffing | 69
Office of Accountability | Center for Research and Evaluation
cohorts of principals spent the majority of their first year changing the culture of the school. For Cohort 1 much of this culture change centered on improving expectations and accountability surrounding behaviors of students and adults, while simultaneously improving the facility itself. While improving student achievement was the goal for these principals, many felt behavior issues and expectations had to improve before any academic changes could be effective. Based on the examination of absence types, a number of schools did show improvement (reduction) in days lost due to out-of-school suspensions. Many of these principals were then focusing on academic improvement in year two. On the other hand, improving the quality of instruction was an ever present theme throughout conversations with Cohort 2 principals about their first year reform efforts. As a whole, these principals appeared to have fewer student behavioral issues, and those that did felt strongly that any behavioral issues they did have were due to students not being engaged in the classroom.One aspect that stood out in particular when examining the differences between principals from Cohort 1 and Cohort 2 was Cohort 2 principals’ ability to gain access to the school during the spring before they took over as principal. These extra three months allowed these individuals to better understand what they had to work with and how to proceed once they were in place. These principals showed an increased propensity to place teachers on action plans in an attempt to increase the quality of education. Further, these principals were able to have conversations with their faculty members about curriculum, teaching style, and planning habits. Cohort 1 principals were not afforded this opportunity, putting them at a disadvantage when they initially took over their respective schools.Challenges in turning around an elementary school are different from turning around a middle or high school. Having more faculty members as many of the middle and high schools as well as some of the elementary schools have makes changing culture and improving student achievement more difficult when only a small percentage of teachers are replaced. In addition and perhaps even more important, secondary students themselves bring so many more issues and challenges to the table. In this report while we separated quantitative results by schools, we categorized our findings based upon our inter-views with the principals without regard to whether it was an elementary or a middle school. As a result it is difficult to ascertain specific challenges for middle versus elementary schools or to see whether certain successful practices were more applicable to one level than the other. Part of the reason for this is because there were so few middle schools in these two cohorts, only three of the 14. For future analyses as we continue to add even more secondary schools to the SS initiative, we suggest separating interview results concerning challenges, what works and what does not, and any recommendations.In summary, principals tapped as SS principals face a difficult challenge: turn-around those schools in CMS most in need, all the while combating apathy, lack of community buy-in, less-than-desirable facilities, and students with multiple, developmental needs. Attempting to evaluate the efficacy of the SS initiative as a whole is further complicated by the unique characteristics each principal brings to their respective situation, and the extent to which the problems mentioned above are a part of the school culture where they are assigned. What we do know is that positive change is possible, as some SS schools are showing gains in proficiency and growth in a myriad of subjects. We also know that the successful SS principal must be adept at identifying the type of leadership necessary for a given situ-ation at a given time. This ability is paramount to guiding the school, and its stakeholders, through the turn-around process in a way which results in a school and community-based family of teachers, parents and students who believe student success is possible in any school.

70 | Evaluation of Strategic Staffing January 2011
Office of Accountability | Center for Research and Evaluation
REFERENCESCamburn, E., Rowan, B., & Taylor, J.E. (2003). Distributed leadership in schools: The case of ele-mentary schools adopting comprehensive school reform models. Educational Evaluation and Policy Analysis, 25, 347-373.
Elmore, R. (Winter 1999-2000). Building a new structure for leadership. American Federation of Teachers, 23, 16-23.
Malen, B., Croninger, R., Muncey, D., & Redmond-Jones, D. (2002). Reconstituting schools: “Testing” the “theory of action”. Educational Evaluation and Policy Analysis, 24, 113-132.
Pulliam, C., Tingle, L. & Schoeneberger, J. (2010). Effectiveness of Strategic Staffing schools: Year 1 – interim report. Report for Charlotte-Mecklenburg Schools, Charlotte, NC.
Rosenbaum, P. R. & Rubin, D. B. (1983). The central role of the propensity score in observational studies for causal effects. Biometrika, 70, 1, 41-55.
Rosenbaum, P. R. & Rubin, D. B. (1984). Reducing bias in observational studies using subclassifica-tion on the propensity score. Journal of the American Statistical Association, 79, 387, 516-524.
Rubin, D. (2004). Teaching Statistical Inference for Causal Effects in Experiments and Observational Studies. Journal of Educational and Behavioral Statistics, 29, 3, 343-367.


An Evaluation Report Prepared by the
CENTER FOR RESEARCH & EVALUATION OFFICE OF ACCOUNTABILITY
January 2011
In compliance with federal law, Charlotte-Mecklenburg Schools administers all education programs, employment activities and admissions without discrimination against any person
on the basis of gender, race, color, religion, national origin, age or disability.