evaluation of the seismic retrofitting of an unreinforced...
TRANSCRIPT
Contents lists available at ScienceDirect
Engineering Structures
journal homepage: www.elsevier.com/locate/engstruct
Evaluation of the seismic retrofitting of an unreinforced masonry buildingusing numerical modeling and ambient vibration measurements
Clotaire Michela,⁎, Amin Karbassib, Pierino Lestuzzib
a Swiss Federal Institute of Technology Zurich (ETHZ), Sonneggstrasse 5, 8092 Zürich, Switzerlandb Ecole Polytechnique Fédérale de Lausanne (EPFL), Station 18, CH-1015 Lausanne, Switzerland
A R T I C L E I N F O
Keywords:Seismic retrofittingUnreinforced masonry buildingsAmbient vibration measurementApplied element method modelingNonlinear time-history analysisDamage grade
A B S T R A C T
Ambient vibration measurements and 3-D nonlinear time-history numerical modeling are used to assess theretrofitting measures conducted in a 6-story unreinforced masonry building (URM) built in the end of the 19thcentury in Switzerland. Retrofitting measures were taken in order to improve the soundproofing and possibly theseismic performance of the building. Reinforced concrete (RC) footings were added under the walls and hor-izontal steel beams were added to link the walls together with a RC slab at each floor, though the wooden beamswere left in place. Several ambient vibration recordings were performed before, during and after the retrofittingwork in order to monitor the evolution of the dynamic behavior of the structure. Moreover, numerical modelsrepresenting the state of the building before and after the retrofit work have been developed to perform non-linear dynamic analyses using various ground motion records. The change in the modal vibration frequencies,mode shapes, and failure mechanism are presented and discussed in further details. According to ambient vi-bration measurements, the performed retrofitting resulted in an increase of about 25% of the fundamentalfrequency. From the results of both the numerical modeling and the ambient vibration measurements, it isconfirmed that the in-plane behavior of the slabs evolved from non-rigid floors with in-plane deformation torigid floors with diaphragm effects. The ambient vibration measurements show that the new stiff slabs could leadto torsion behavior in the building as the result of the diaphragm effect and to higher seismic demand. However,the numerical models show that the displacement capacity of the building increases as a result of those new stiffslabs. Consequently, higher deformation capacity, indicated by the inter-story drift values, on average, areobserved for all the damage grades in the post-retrofit state of the building. Finally, the overall seismic safety wasonly slightly improved.
1. Introduction
Since a large part of buildings around the World and especially inNorthern Europe, were built without or with insufficient seismic pro-visions, seismic assessment of existing buildings is a critical and endlessissue to be solved by earthquake engineering [1]. Cost-benefit ap-proaches for the assessment and retrofit of existing buildings in Swit-zerland started to be used on a day-to-day basis in 2004 with the Pre-standard SIA2018 [2]. This Pre-standard provides guidelines on themeasures to undertake to improve the seismic safety of a buildingtaking into account the seismic risk, and in case, if retrofitting measuresare commensurate. The results provided by the prescribed method are,however, quite rough, and the effects of an eventual retrofit needs to bemore finely quantified.
Different seismic retrofitting measures have been proposed for un-reinforced masonry (URM) buildings. Examples are: adding sandwich
columns to partition brick walls [3], jacketing of columns, addingstructural walls, and construction of a mat foundation [4], reinforcedcement jacketing of the main load carrying walls [5] and using Fiber-Reinforced Polymers [6,7]. The effect of those retrofitting measures hasbeen assessed using a variety of methods including Finite Element nu-merical modeling [1,8] and vibration measurements [9]. One of thecommon measures to retrofit existing URM buildings in Europe is tocreate composite slabs by adding a reinforced-concrete (RC) layer overthe existing wooden floor or even to replace it by a RC floor. Thismeasure is generally proposed to improve the comfort and the sound-proofing of the building, and is thought to be beneficial for the seismicbehavior, as well. As a result, the masonry walls are linked togethercreating a diaphragm effect, which also prevents out-of-plane collapseof the walls [10,11].
This paper presents the evaluation of the retrofitting measures on atypical residential building in Switzerland [12]. The studied building is
https://doi.org/10.1016/j.engstruct.2017.12.016Received 3 March 2017; Received in revised form 3 November 2017; Accepted 11 December 2017
⁎ Corresponding author.E-mail address: [email protected] (C. Michel).
Engineering Structures 158 (2018) 124–135
0141-0296/ © 2017 Elsevier Ltd. All rights reserved.
T
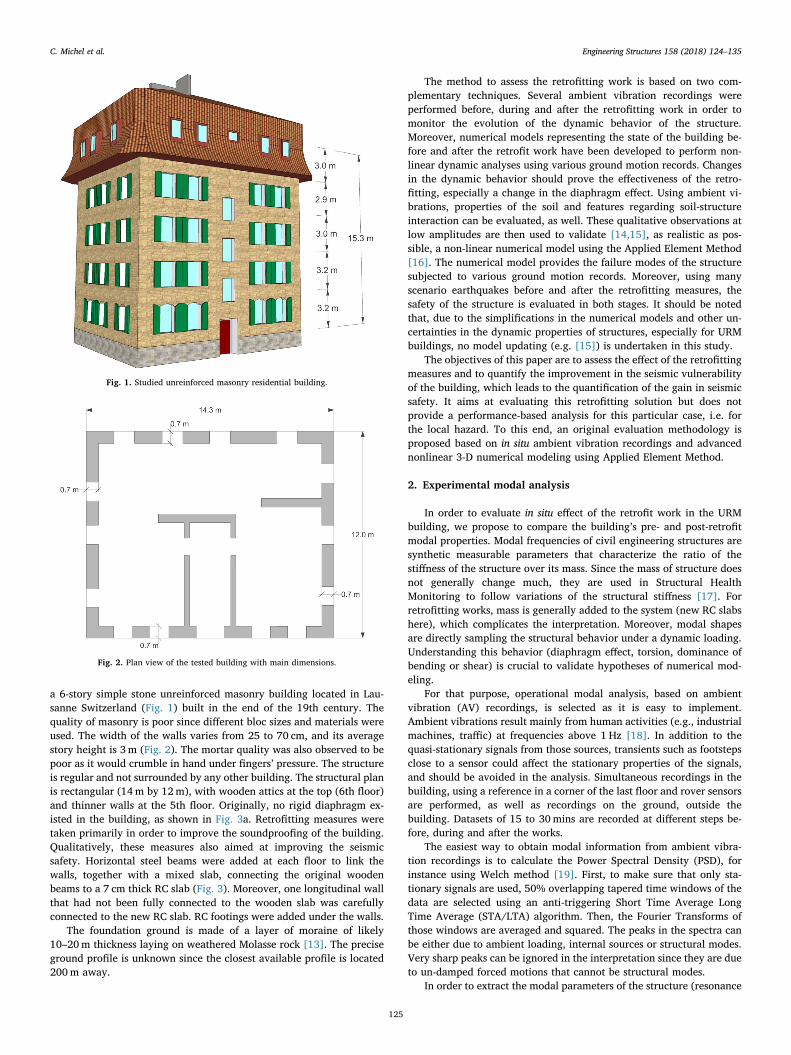
a 6-story simple stone unreinforced masonry building located in Lau-sanne Switzerland (Fig. 1) built in the end of the 19th century. Thequality of masonry is poor since different bloc sizes and materials wereused. The width of the walls varies from 25 to 70 cm, and its averagestory height is 3 m (Fig. 2). The mortar quality was also observed to bepoor as it would crumble in hand under fingers’ pressure. The structureis regular and not surrounded by any other building. The structural planis rectangular (14m by 12m), with wooden attics at the top (6th floor)and thinner walls at the 5th floor. Originally, no rigid diaphragm ex-isted in the building, as shown in Fig. 3a. Retrofitting measures weretaken primarily in order to improve the soundproofing of the building.Qualitatively, these measures also aimed at improving the seismicsafety. Horizontal steel beams were added at each floor to link thewalls, together with a mixed slab, connecting the original woodenbeams to a 7 cm thick RC slab (Fig. 3). Moreover, one longitudinal wallthat had not been fully connected to the wooden slab was carefullyconnected to the new RC slab. RC footings were added under the walls.
The foundation ground is made of a layer of moraine of likely10–20m thickness laying on weathered Molasse rock [13]. The preciseground profile is unknown since the closest available profile is located200m away.
The method to assess the retrofitting work is based on two com-plementary techniques. Several ambient vibration recordings wereperformed before, during and after the retrofitting work in order tomonitor the evolution of the dynamic behavior of the structure.Moreover, numerical models representing the state of the building be-fore and after the retrofit work have been developed to perform non-linear dynamic analyses using various ground motion records. Changesin the dynamic behavior should prove the effectiveness of the retro-fitting, especially a change in the diaphragm effect. Using ambient vi-brations, properties of the soil and features regarding soil-structureinteraction can be evaluated, as well. These qualitative observations atlow amplitudes are then used to validate [14,15], as realistic as pos-sible, a non-linear numerical model using the Applied Element Method[16]. The numerical model provides the failure modes of the structuresubjected to various ground motion records. Moreover, using manyscenario earthquakes before and after the retrofitting measures, thesafety of the structure is evaluated in both stages. It should be notedthat, due to the simplifications in the numerical models and other un-certainties in the dynamic properties of structures, especially for URMbuildings, no model updating (e.g. [15]) is undertaken in this study.
The objectives of this paper are to assess the effect of the retrofittingmeasures and to quantify the improvement in the seismic vulnerabilityof the building, which leads to the quantification of the gain in seismicsafety. It aims at evaluating this retrofitting solution but does notprovide a performance-based analysis for this particular case, i.e. forthe local hazard. To this end, an original evaluation methodology isproposed based on in situ ambient vibration recordings and advancednonlinear 3-D numerical modeling using Applied Element Method.
2. Experimental modal analysis
In order to evaluate in situ effect of the retrofit work in the URMbuilding, we propose to compare the building’s pre- and post-retrofitmodal properties. Modal frequencies of civil engineering structures aresynthetic measurable parameters that characterize the ratio of thestiffness of the structure over its mass. Since the mass of structure doesnot generally change much, they are used in Structural HealthMonitoring to follow variations of the structural stiffness [17]. Forretrofitting works, mass is generally added to the system (new RC slabshere), which complicates the interpretation. Moreover, modal shapesare directly sampling the structural behavior under a dynamic loading.Understanding this behavior (diaphragm effect, torsion, dominance ofbending or shear) is crucial to validate hypotheses of numerical mod-eling.
For that purpose, operational modal analysis, based on ambientvibration (AV) recordings, is selected as it is easy to implement.Ambient vibrations result mainly from human activities (e.g., industrialmachines, traffic) at frequencies above 1 Hz [18]. In addition to thequasi-stationary signals from those sources, transients such as footstepsclose to a sensor could affect the stationary properties of the signals,and should be avoided in the analysis. Simultaneous recordings in thebuilding, using a reference in a corner of the last floor and rover sensorsare performed, as well as recordings on the ground, outside thebuilding. Datasets of 15 to 30mins are recorded at different steps be-fore, during and after the works.
The easiest way to obtain modal information from ambient vibra-tion recordings is to calculate the Power Spectral Density (PSD), forinstance using Welch method [19]. First, to make sure that only sta-tionary signals are used, 50% overlapping tapered time windows of thedata are selected using an anti-triggering Short Time Average LongTime Average (STA/LTA) algorithm. Then, the Fourier Transforms ofthose windows are averaged and squared. The peaks in the spectra canbe either due to ambient loading, internal sources or structural modes.Very sharp peaks can be ignored in the interpretation since they are dueto un-damped forced motions that cannot be structural modes.
In order to extract the modal parameters of the structure (resonance
Fig. 1. Studied unreinforced masonry residential building.
Fig. 2. Plan view of the tested building with main dimensions.
C. Michel et al. Engineering Structures 158 (2018) 124–135
125
frequencies, damping ratios and modal shapes) from ambient vibrationrecordings, the Frequency Domain Decomposition (FDD) [20] and theEnhanced Frequency Domain Decomposition [21] techniques, alreadyextensively described and applied in the literature (e.g. [14,22]) areused in this paper. The proposed evaluation of the uncertainties on thepeak position in the spectrum just includes the uncertainties due to thewindowing process in the spectral estimation and no other possiblesources of uncertainty such as natural variability or error due to theprocessing method. The uncertainty in the damping ratios arises fromthe choice of the fitted window in the logarithmic decrement method.
Moreover, using the recording in free field, the Horizontal toVertical Spectral Ratios (HVSR) (e.g. [23]) can be used to detect theresonance frequencies of soil layers that may produce amplification ofthe ground motion. In this paper, the square root of the PSD spectra hasbeen smoothed using the Konno and Ohmachi procedure [24] with acoefficient b equal to 30.
2.1. Ambient vibration measurement settings
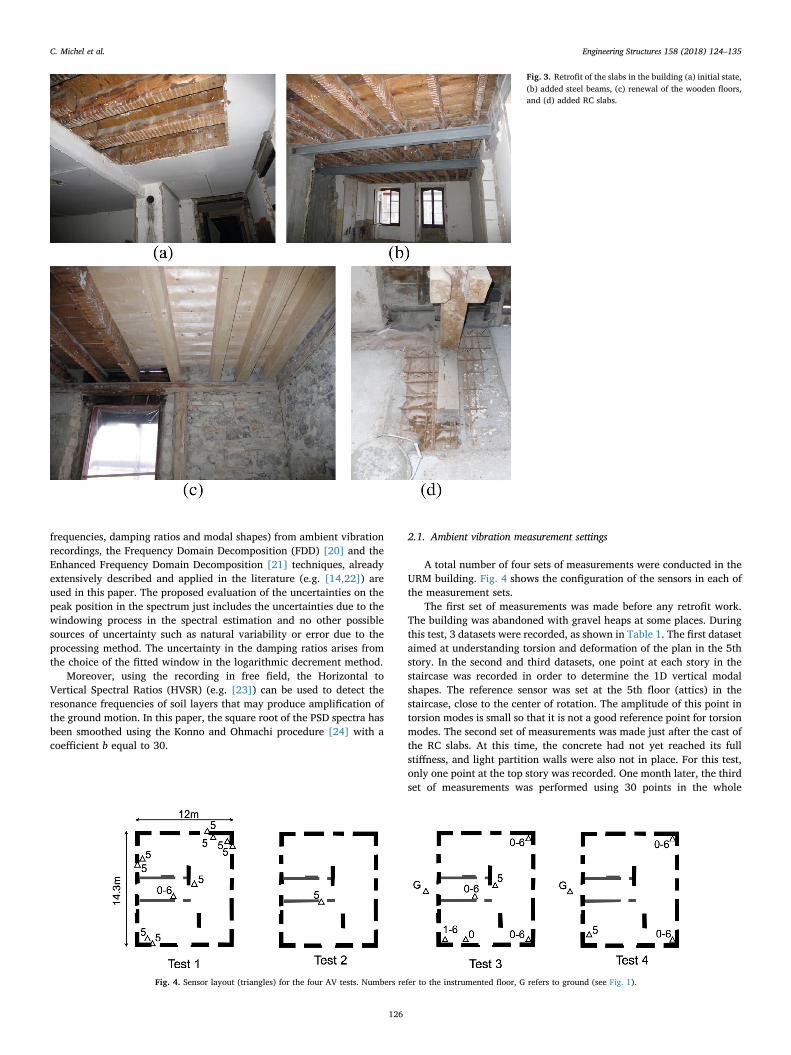
A total number of four sets of measurements were conducted in theURM building. Fig. 4 shows the configuration of the sensors in each ofthe measurement sets.
The first set of measurements was made before any retrofit work.The building was abandoned with gravel heaps at some places. Duringthis test, 3 datasets were recorded, as shown in Table 1. The first datasetaimed at understanding torsion and deformation of the plan in the 5thstory. In the second and third datasets, one point at each story in thestaircase was recorded in order to determine the 1D vertical modalshapes. The reference sensor was set at the 5th floor (attics) in thestaircase, close to the center of rotation. The amplitude of this point intorsion modes is small so that it is not a good reference point for torsionmodes. The second set of measurements was made just after the cast ofthe RC slabs. At this time, the concrete had not yet reached its fullstiffness, and light partition walls were also not in place. For this test,only one point at the top story was recorded. One month later, the thirdset of measurements was performed using 30 points in the whole
Fig. 3. Retrofit of the slabs in the building (a) initial state,(b) added steel beams, (c) renewal of the wooden floors,and (d) added RC slabs.
Fig. 4. Sensor layout (triangles) for the four AV tests. Numbers refer to the instrumented floor, G refers to ground (see Fig. 1).
C. Michel et al. Engineering Structures 158 (2018) 124–135
126
structure, including 3 at the basement to eventually estimate soil-structure interaction, and one free field point. The reference sensor forthis third set of measurements was set in a corner of the 5th floor. Fivemonths later, the fourth set of measurements was performed in 14points, including one in free field. At the time of this fourth test, all thepartition walls and new furniture was in place. The reference sensors atthe 5th floor and in free field were the same as those in the third test.
The signal of 6 Lennartz 3C 5 s seismometers was recorded using aCityShark 2 digitizer [25] for tests 1 and 3. In test 4, four Lennartz 3C 1ssensors were used. Test 2 was done with a GeoSIG GBV316 seismolo-gical station, which includes a 3C 4.5 Hz geophone and a digitizer.
2.2. Results from ambient vibration measurements
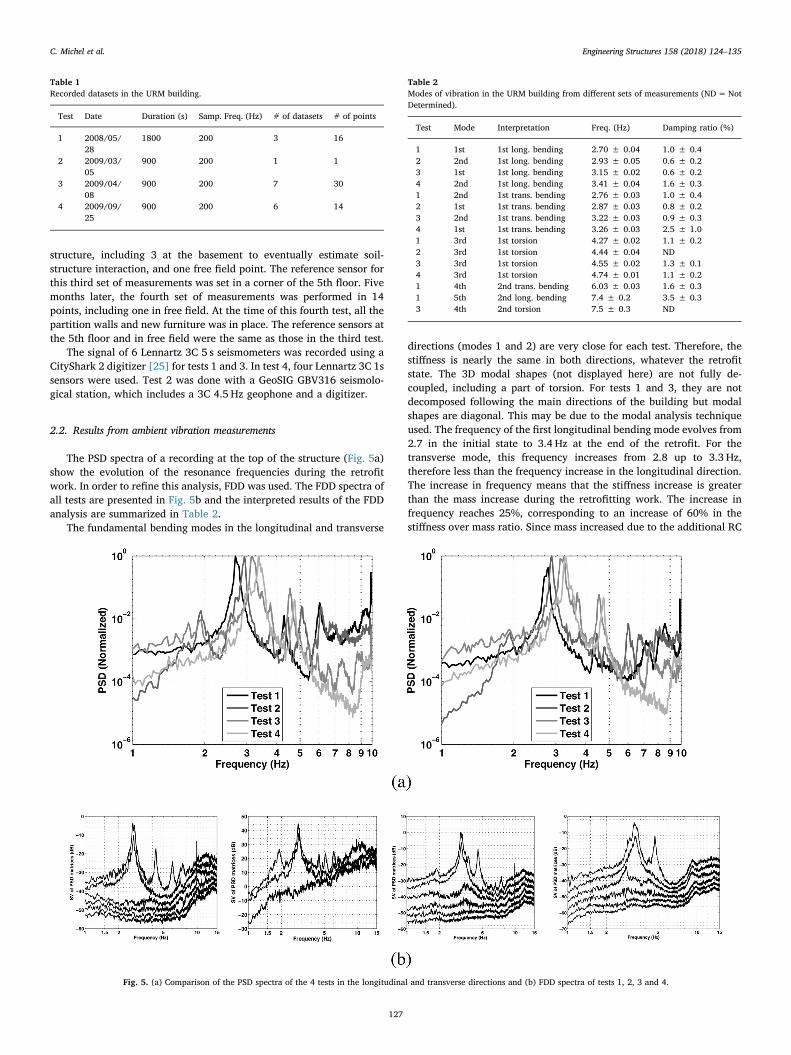
The PSD spectra of a recording at the top of the structure (Fig. 5a)show the evolution of the resonance frequencies during the retrofitwork. In order to refine this analysis, FDD was used. The FDD spectra ofall tests are presented in Fig. 5b and the interpreted results of the FDDanalysis are summarized in Table 2.
The fundamental bending modes in the longitudinal and transverse
directions (modes 1 and 2) are very close for each test. Therefore, thestiffness is nearly the same in both directions, whatever the retrofitstate. The 3D modal shapes (not displayed here) are not fully de-coupled, including a part of torsion. For tests 1 and 3, they are notdecomposed following the main directions of the building but modalshapes are diagonal. This may be due to the modal analysis techniqueused. The frequency of the first longitudinal bending mode evolves from2.7 in the initial state to 3.4 Hz at the end of the retrofit. For thetransverse mode, this frequency increases from 2.8 up to 3.3 Hz,therefore less than the frequency increase in the longitudinal direction.The increase in frequency means that the stiffness increase is greaterthan the mass increase during the retrofitting work. The increase infrequency reaches 25%, corresponding to an increase of 60% in thestiffness over mass ratio. Since mass increased due to the additional RC
Table 1Recorded datasets in the URM building.
Test Date Duration (s) Samp. Freq. (Hz) # of datasets # of points
1 2008/05/28
1800 200 3 16
2 2009/03/05
900 200 1 1
3 2009/04/08
900 200 7 30
4 2009/09/25
900 200 6 14
Fig. 5. (a) Comparison of the PSD spectra of the 4 tests in the longitudinal and transverse directions and (b) FDD spectra of tests 1, 2, 3 and 4.
Table 2Modes of vibration in the URM building from different sets of measurements (ND=NotDetermined).
Test Mode Interpretation Freq. (Hz) Damping ratio (%)
1 1st 1st long. bending 2.70 ± 0.04 1.0 ± 0.42 2nd 1st long. bending 2.93 ± 0.05 0.6 ± 0.23 1st 1st long. bending 3.15 ± 0.02 0.6 ± 0.24 2nd 1st long. bending 3.41 ± 0.04 1.6 ± 0.31 2nd 1st trans. bending 2.76 ± 0.03 1.0 ± 0.42 1st 1st trans. bending 2.87 ± 0.03 0.8 ± 0.23 2nd 1st trans. bending 3.22 ± 0.03 0.9 ± 0.34 1st 1st trans. bending 3.26 ± 0.03 2.5 ± 1.01 3rd 1st torsion 4.27 ± 0.02 1.1 ± 0.22 3rd 1st torsion 4.44 ± 0.04 ND3 3rd 1st torsion 4.55 ± 0.02 1.3 ± 0.14 3rd 1st torsion 4.74 ± 0.01 1.1 ± 0.21 4th 2nd trans. bending 6.03 ± 0.03 1.6 ± 0.31 5th 2nd long. bending 7.4 ± 0.2 3.5 ± 0.33 4th 2nd torsion 7.5 ± 0.3 ND
C. Michel et al. Engineering Structures 158 (2018) 124–135
127
slabs, stiffness increase is, therefore, even larger. This can be inter-preted as a loss of flexibility (bending) due to the diaphragm effect andto the connection of a longitudinal wall that was disconnected from thewooden slab in the initial state, allowing all walls to resist lateral loadstogether. A 16% frequency increase occurred while the new stiff slabswere already installed (between tests 2 and 4) corresponding to 35% inthe stiffness over mass ratio. If this period corresponds only to the in-stallation of non-structural elements, it probably mainly includes long-term stiffening of the concrete. Moreover, the longitudinal direction isclearly stiffer (10%) than the transverse one, which is interpreted as theconnection of the additional wall, only for the last test. It is thereforenot seen 1month after these works, but only 6months after, whichconfirms that long-term effects are involved. Only permanent mon-itoring would have allowed understanding these effects.
Although the uncertainties remain large, the damping ratio seemslarger for the final state (1.6 and 2.5% for the longitudinal and trans-verse directions, respectively) compared to the others (around 1%). Theinterpretation of damping ratio under ambient vibrations is howeverdifficult. One possible explanation is the increase of radiation dampingdue to the new foundation.
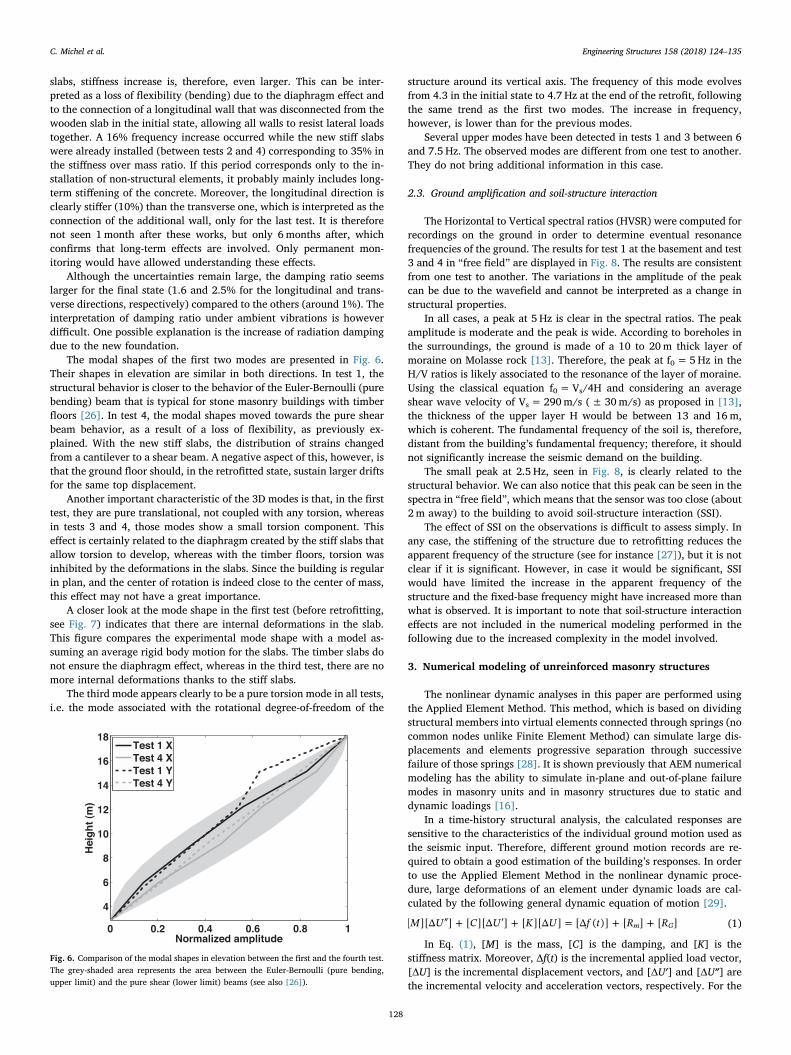
The modal shapes of the first two modes are presented in Fig. 6.Their shapes in elevation are similar in both directions. In test 1, thestructural behavior is closer to the behavior of the Euler-Bernoulli (purebending) beam that is typical for stone masonry buildings with timberfloors [26]. In test 4, the modal shapes moved towards the pure shearbeam behavior, as a result of a loss of flexibility, as previously ex-plained. With the new stiff slabs, the distribution of strains changedfrom a cantilever to a shear beam. A negative aspect of this, however, isthat the ground floor should, in the retrofitted state, sustain larger driftsfor the same top displacement.
Another important characteristic of the 3D modes is that, in the firsttest, they are pure translational, not coupled with any torsion, whereasin tests 3 and 4, those modes show a small torsion component. Thiseffect is certainly related to the diaphragm created by the stiff slabs thatallow torsion to develop, whereas with the timber floors, torsion wasinhibited by the deformations in the slabs. Since the building is regularin plan, and the center of rotation is indeed close to the center of mass,this effect may not have a great importance.
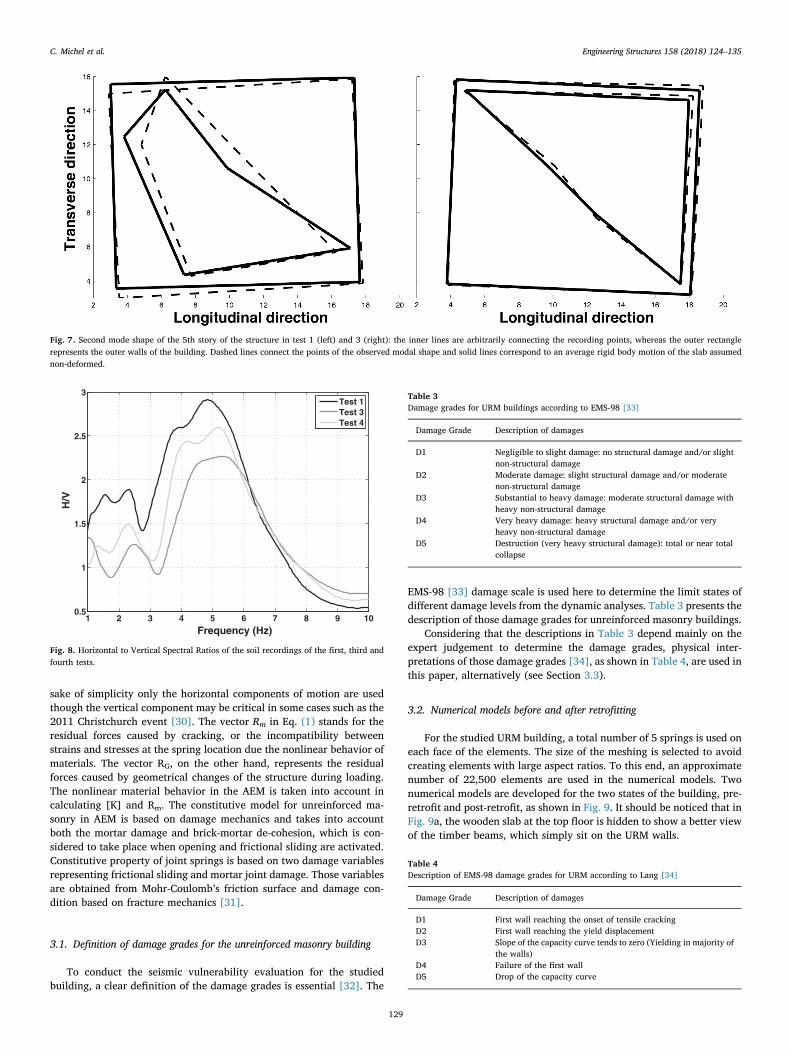
A closer look at the mode shape in the first test (before retrofitting,see Fig. 7) indicates that there are internal deformations in the slab.This figure compares the experimental mode shape with a model as-suming an average rigid body motion for the slabs. The timber slabs donot ensure the diaphragm effect, whereas in the third test, there are nomore internal deformations thanks to the stiff slabs.
The third mode appears clearly to be a pure torsion mode in all tests,i.e. the mode associated with the rotational degree-of-freedom of the
structure around its vertical axis. The frequency of this mode evolvesfrom 4.3 in the initial state to 4.7 Hz at the end of the retrofit, followingthe same trend as the first two modes. The increase in frequency,however, is lower than for the previous modes.
Several upper modes have been detected in tests 1 and 3 between 6and 7.5 Hz. The observed modes are different from one test to another.They do not bring additional information in this case.
2.3. Ground amplification and soil-structure interaction
The Horizontal to Vertical spectral ratios (HVSR) were computed forrecordings on the ground in order to determine eventual resonancefrequencies of the ground. The results for test 1 at the basement and test3 and 4 in “free field” are displayed in Fig. 8. The results are consistentfrom one test to another. The variations in the amplitude of the peakcan be due to the wavefield and cannot be interpreted as a change instructural properties.
In all cases, a peak at 5 Hz is clear in the spectral ratios. The peakamplitude is moderate and the peak is wide. According to boreholes inthe surroundings, the ground is made of a 10 to 20m thick layer ofmoraine on Molasse rock [13]. Therefore, the peak at f0= 5Hz in theH/V ratios is likely associated to the resonance of the layer of moraine.Using the classical equation f0=Vs/4H and considering an averageshear wave velocity of Vs= 290m/s (± 30m/s) as proposed in [13],the thickness of the upper layer H would be between 13 and 16m,which is coherent. The fundamental frequency of the soil is, therefore,distant from the building’s fundamental frequency; therefore, it shouldnot significantly increase the seismic demand on the building.
The small peak at 2.5 Hz, seen in Fig. 8, is clearly related to thestructural behavior. We can also notice that this peak can be seen in thespectra in “free field”, which means that the sensor was too close (about2m away) to the building to avoid soil-structure interaction (SSI).
The effect of SSI on the observations is difficult to assess simply. Inany case, the stiffening of the structure due to retrofitting reduces theapparent frequency of the structure (see for instance [27]), but it is notclear if it is significant. However, in case it would be significant, SSIwould have limited the increase in the apparent frequency of thestructure and the fixed-base frequency might have increased more thanwhat is observed. It is important to note that soil-structure interactioneffects are not included in the numerical modeling performed in thefollowing due to the increased complexity in the model involved.
3. Numerical modeling of unreinforced masonry structures
The nonlinear dynamic analyses in this paper are performed usingthe Applied Element Method. This method, which is based on dividingstructural members into virtual elements connected through springs (nocommon nodes unlike Finite Element Method) can simulate large dis-placements and elements progressive separation through successivefailure of those springs [28]. It is shown previously that AEM numericalmodeling has the ability to simulate in-plane and out-of-plane failuremodes in masonry units and in masonry structures due to static anddynamic loadings [16].
In a time-history structural analysis, the calculated responses aresensitive to the characteristics of the individual ground motion used asthe seismic input. Therefore, different ground motion records are re-quired to obtain a good estimation of the building’s responses. In orderto use the Applied Element Method in the nonlinear dynamic proce-dure, large deformations of an element under dynamic loads are cal-culated by the following general dynamic equation of motion [29].
″ + ′ + = + +M U C U K U f t R R[ ][Δ ] [ ][Δ ] [ ][Δ ] [Δ ( )] [ ] [ ]m G (1)
In Eq. (1), [M] is the mass, [C] is the damping, and [K] is thestiffness matrix. Moreover, Δƒ(t) is the incremental applied load vector,[ΔU] is the incremental displacement vectors, and [ΔU′] and [ΔU″] arethe incremental velocity and acceleration vectors, respectively. For the
Fig. 6. Comparison of the modal shapes in elevation between the first and the fourth test.The grey-shaded area represents the area between the Euler-Bernoulli (pure bending,upper limit) and the pure shear (lower limit) beams (see also [26]).
C. Michel et al. Engineering Structures 158 (2018) 124–135
128
sake of simplicity only the horizontal components of motion are usedthough the vertical component may be critical in some cases such as the2011 Christchurch event [30]. The vector Rm in Eq. (1) stands for theresidual forces caused by cracking, or the incompatibility betweenstrains and stresses at the spring location due the nonlinear behavior ofmaterials. The vector RG, on the other hand, represents the residualforces caused by geometrical changes of the structure during loading.The nonlinear material behavior in the AEM is taken into account incalculating [K] and Rm. The constitutive model for unreinforced ma-sonry in AEM is based on damage mechanics and takes into accountboth the mortar damage and brick-mortar de-cohesion, which is con-sidered to take place when opening and frictional sliding are activated.Constitutive property of joint springs is based on two damage variablesrepresenting frictional sliding and mortar joint damage. Those variablesare obtained from Mohr-Coulomb’s friction surface and damage con-dition based on fracture mechanics [31].
3.1. Definition of damage grades for the unreinforced masonry building
To conduct the seismic vulnerability evaluation for the studiedbuilding, a clear definition of the damage grades is essential [32]. The
EMS-98 [33] damage scale is used here to determine the limit states ofdifferent damage levels from the dynamic analyses. Table 3 presents thedescription of those damage grades for unreinforced masonry buildings.
Considering that the descriptions in Table 3 depend mainly on theexpert judgement to determine the damage grades, physical inter-pretations of those damage grades [34], as shown in Table 4, are used inthis paper, alternatively (see Section 3.3).
3.2. Numerical models before and after retrofitting
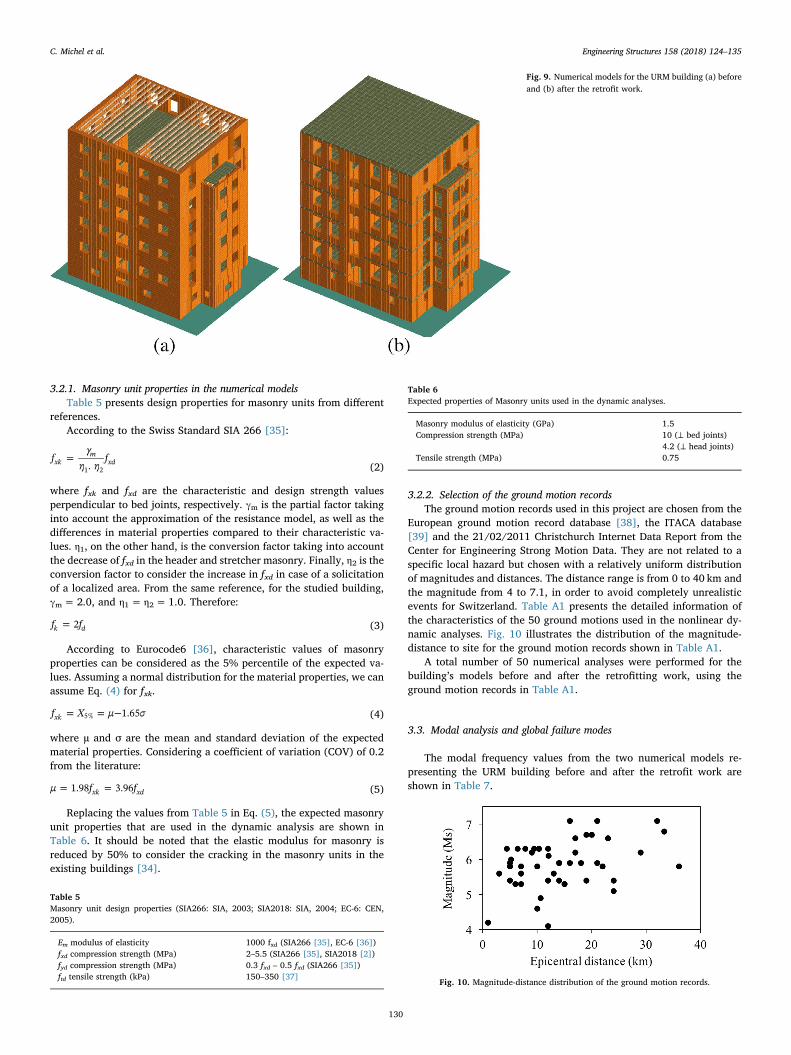
For the studied URM building, a total number of 5 springs is used oneach face of the elements. The size of the meshing is selected to avoidcreating elements with large aspect ratios. To this end, an approximatenumber of 22,500 elements are used in the numerical models. Twonumerical models are developed for the two states of the building, pre-retrofit and post-retrofit, as shown in Fig. 9. It should be noticed that inFig. 9a, the wooden slab at the top floor is hidden to show a better viewof the timber beams, which simply sit on the URM walls.
Fig. 7. Second mode shape of the 5th story of the structure in test 1 (left) and 3 (right): the inner lines are arbitrarily connecting the recording points, whereas the outer rectanglerepresents the outer walls of the building. Dashed lines connect the points of the observed modal shape and solid lines correspond to an average rigid body motion of the slab assumednon-deformed.
1 2 3 4 5 6 7 8 9 100.5
1
1.5
2
2.5
3
Frequency (Hz)
H/V
Test 1Test 3Test 4
Fig. 8. Horizontal to Vertical Spectral Ratios of the soil recordings of the first, third andfourth tests.
Table 3Damage grades for URM buildings according to EMS-98 [33]
Damage Grade Description of damages
D1 Negligible to slight damage: no structural damage and/or slightnon-structural damage
D2 Moderate damage: slight structural damage and/or moderatenon-structural damage
D3 Substantial to heavy damage: moderate structural damage withheavy non-structural damage
D4 Very heavy damage: heavy structural damage and/or veryheavy non-structural damage
D5 Destruction (very heavy structural damage): total or near totalcollapse
Table 4Description of EMS-98 damage grades for URM according to Lang [34]
Damage Grade Description of damages
D1 First wall reaching the onset of tensile crackingD2 First wall reaching the yield displacementD3 Slope of the capacity curve tends to zero (Yielding in majority of
the walls)D4 Failure of the first wallD5 Drop of the capacity curve
C. Michel et al. Engineering Structures 158 (2018) 124–135
129
3.2.1. Masonry unit properties in the numerical modelsTable 5 presents design properties for masonry units from different
references.According to the Swiss Standard SIA 266 [35]:
=fγ
η ηf
.xkm
xd1 2 (2)
where fxk and fxd are the characteristic and design strength valuesperpendicular to bed joints, respectively. γm is the partial factor takinginto account the approximation of the resistance model, as well as thedifferences in material properties compared to their characteristic va-lues. η1, on the other hand, is the conversion factor taking into accountthe decrease of fxd in the header and stretcher masonry. Finally, η2 is theconversion factor to consider the increase in fxd in case of a solicitationof a localized area. From the same reference, for the studied building,γm=2.0, and η1= η2= 1.0. Therefore:
=f f2k d (3)
According to Eurocode6 [36], characteristic values of masonryproperties can be considered as the 5% percentile of the expected va-lues. Assuming a normal distribution for the material properties, we canassume Eq. (4) for fxk.
= = −f X μ σ1.65xk 5% (4)
where µ and σ are the mean and standard deviation of the expectedmaterial properties. Considering a coefficient of variation (COV) of 0.2from the literature:
= =μ f f1.98 3.96xk xd (5)
Replacing the values from Table 5 in Eq. (5), the expected masonryunit properties that are used in the dynamic analysis are shown inTable 6. It should be noted that the elastic modulus for masonry isreduced by 50% to consider the cracking in the masonry units in theexisting buildings [34].
3.2.2. Selection of the ground motion recordsThe ground motion records used in this project are chosen from the
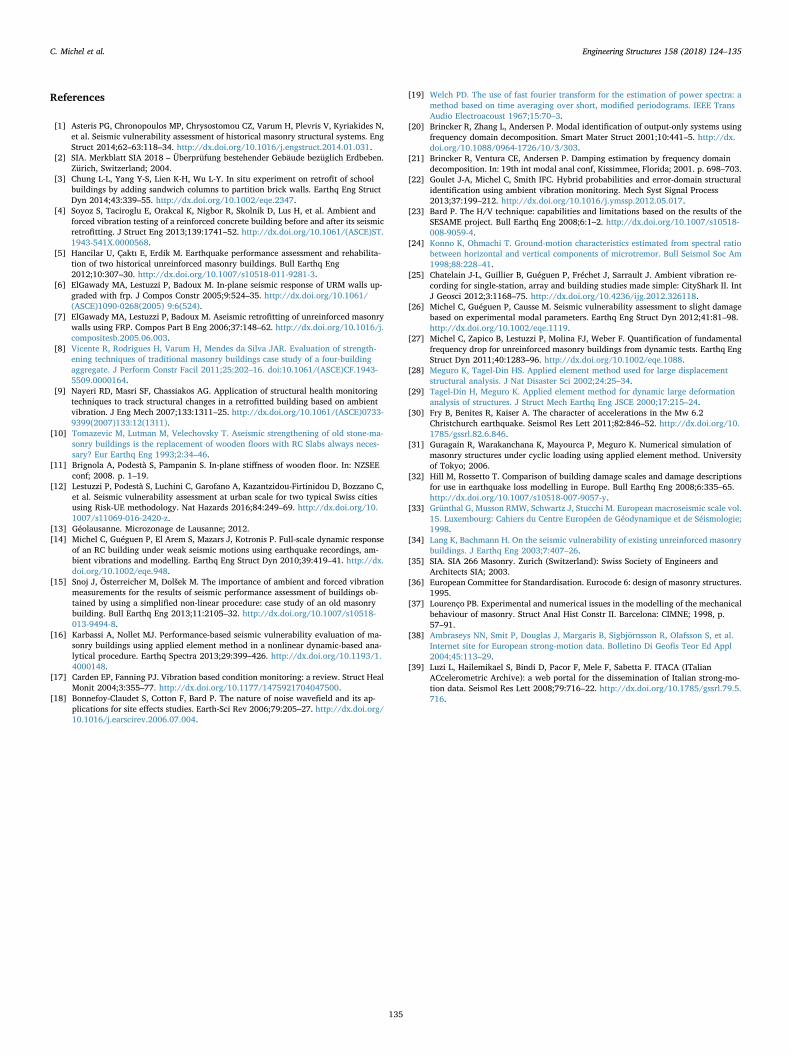
European ground motion record database [38], the ITACA database[39] and the 21/02/2011 Christchurch Internet Data Report from theCenter for Engineering Strong Motion Data. They are not related to aspecific local hazard but chosen with a relatively uniform distributionof magnitudes and distances. The distance range is from 0 to 40 km andthe magnitude from 4 to 7.1, in order to avoid completely unrealisticevents for Switzerland. Table A1 presents the detailed information ofthe characteristics of the 50 ground motions used in the nonlinear dy-namic analyses. Fig. 10 illustrates the distribution of the magnitude-distance to site for the ground motion records shown in Table A1.
A total number of 50 numerical analyses were performed for thebuilding’s models before and after the retrofitting work, using theground motion records in Table A1.
3.3. Modal analysis and global failure modes
The modal frequency values from the two numerical models re-presenting the URM building before and after the retrofit work areshown in Table 7.
Fig. 9. Numerical models for the URM building (a) beforeand (b) after the retrofit work.
Table 5Masonry unit design properties (SIA266: SIA, 2003; SIA2018: SIA, 2004; EC-6: CEN,2005).
Em modulus of elasticity 1000 fxd (SIA266 [35], EC-6 [36])fxd compression strength (MPa) 2–5.5 (SIA266 [35], SIA2018 [2])fyd compression strength (MPa) 0.3 fxd – 0.5 fxd (SIA266 [35])ftd tensile strength (kPa) 150–350 [37]
Table 6Expected properties of Masonry units used in the dynamic analyses.
Masonry modulus of elasticity (GPa) 1.5Compression strength (MPa) 10 (⊥ bed joints)
4.2 (⊥ head joints)Tensile strength (MPa) 0.75
Fig. 10. Magnitude-distance distribution of the ground motion records.
C. Michel et al. Engineering Structures 158 (2018) 124–135
130
As it is seen in this table, there is about 3% increase in the modalfrequency of the building in each direction. This small increase, in spiteof the installation of the stiff slabs, can be explained by the fact thatthere has been also an increase in the total mass because of those newslabs.
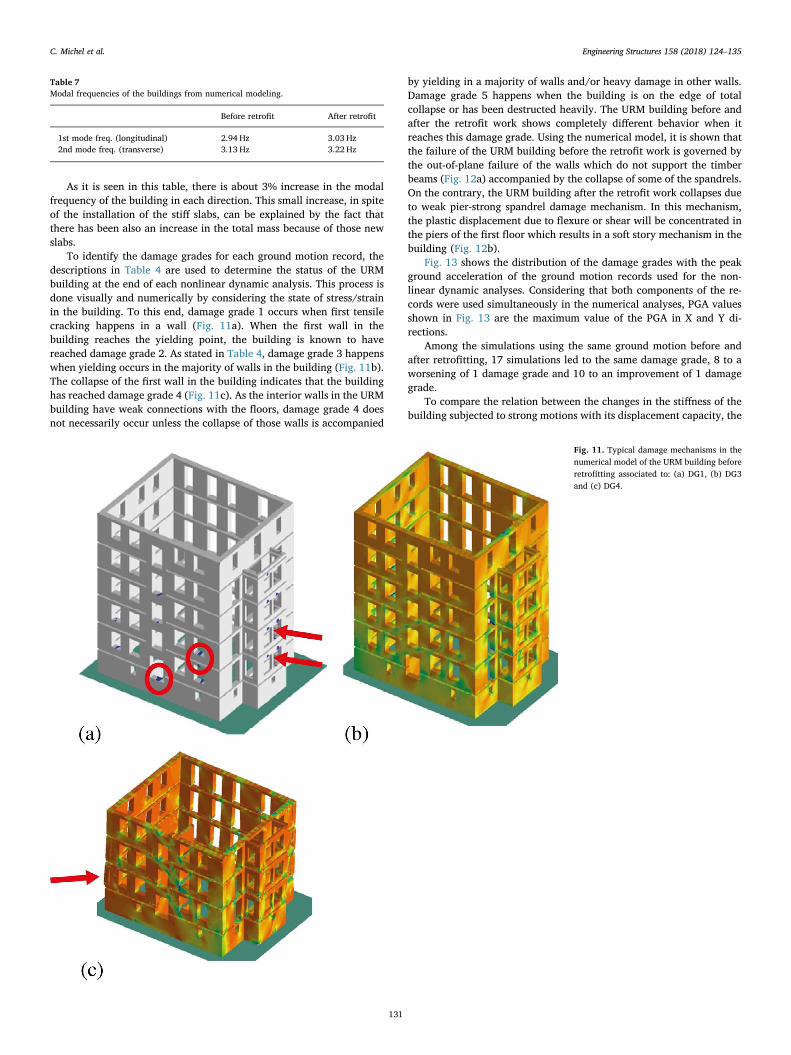
To identify the damage grades for each ground motion record, thedescriptions in Table 4 are used to determine the status of the URMbuilding at the end of each nonlinear dynamic analysis. This process isdone visually and numerically by considering the state of stress/strainin the building. To this end, damage grade 1 occurs when first tensilecracking happens in a wall (Fig. 11a). When the first wall in thebuilding reaches the yielding point, the building is known to havereached damage grade 2. As stated in Table 4, damage grade 3 happenswhen yielding occurs in the majority of walls in the building (Fig. 11b).The collapse of the first wall in the building indicates that the buildinghas reached damage grade 4 (Fig. 11c). As the interior walls in the URMbuilding have weak connections with the floors, damage grade 4 doesnot necessarily occur unless the collapse of those walls is accompanied
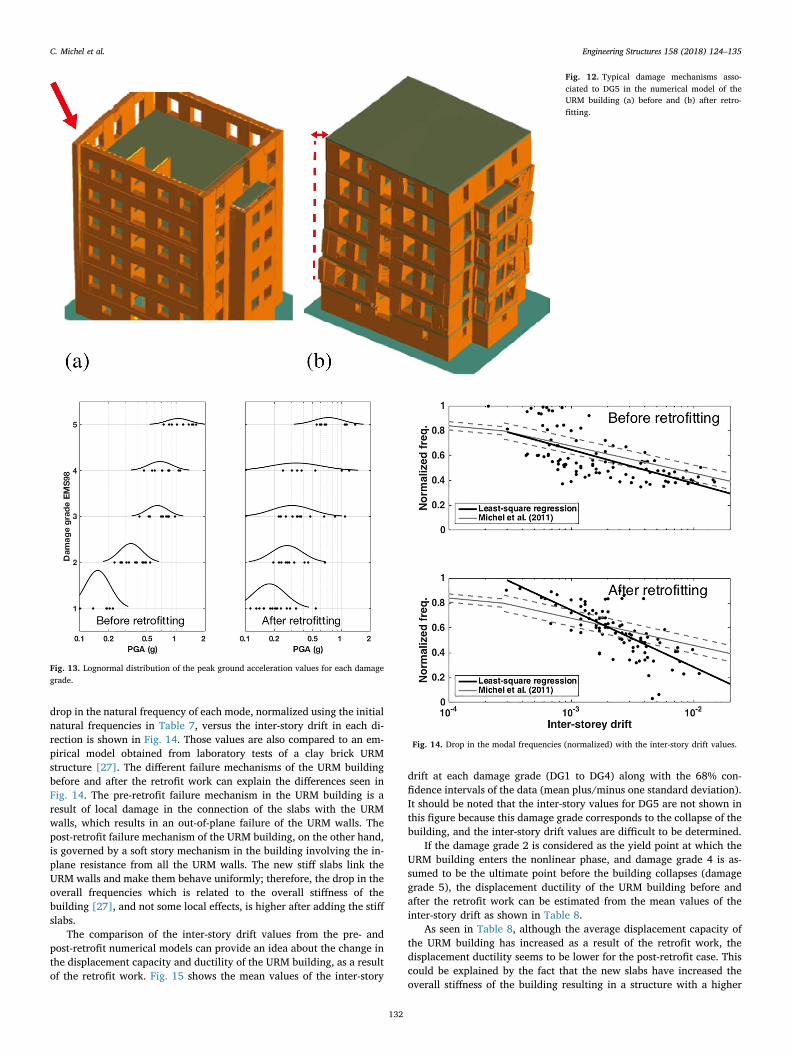
by yielding in a majority of walls and/or heavy damage in other walls.Damage grade 5 happens when the building is on the edge of totalcollapse or has been destructed heavily. The URM building before andafter the retrofit work shows completely different behavior when itreaches this damage grade. Using the numerical model, it is shown thatthe failure of the URM building before the retrofit work is governed bythe out-of-plane failure of the walls which do not support the timberbeams (Fig. 12a) accompanied by the collapse of some of the spandrels.On the contrary, the URM building after the retrofit work collapses dueto weak pier-strong spandrel damage mechanism. In this mechanism,the plastic displacement due to flexure or shear will be concentrated inthe piers of the first floor which results in a soft story mechanism in thebuilding (Fig. 12b).
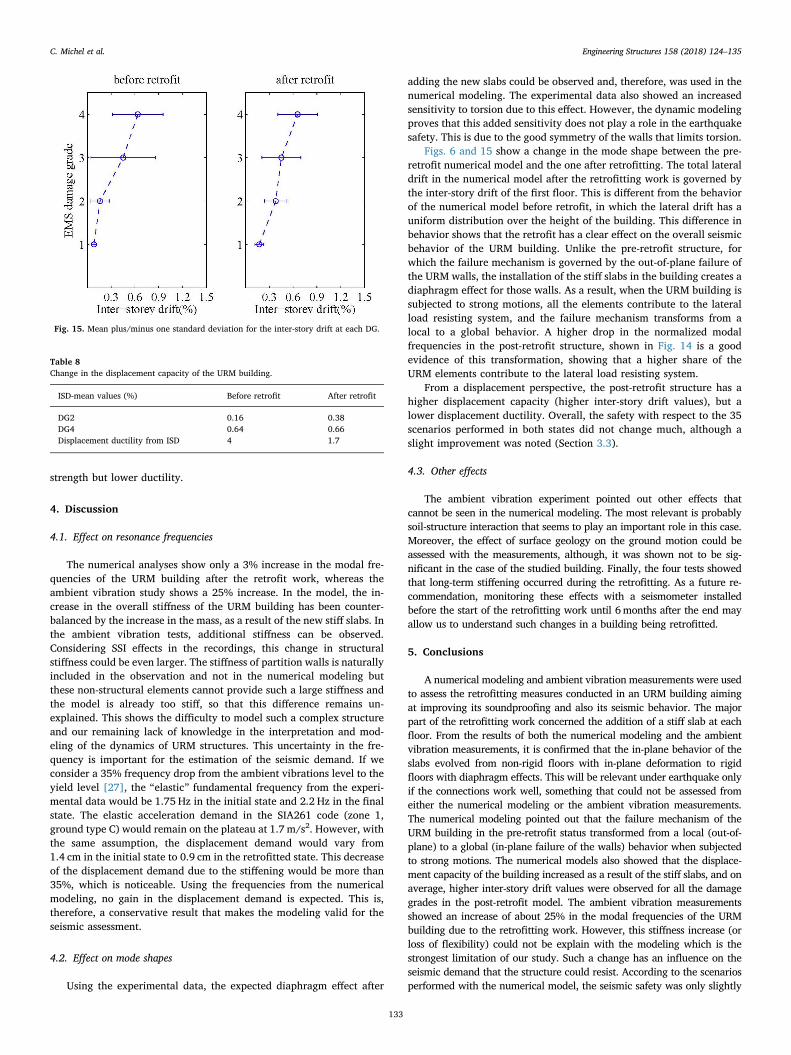
Fig. 13 shows the distribution of the damage grades with the peakground acceleration of the ground motion records used for the non-linear dynamic analyses. Considering that both components of the re-cords were used simultaneously in the numerical analyses, PGA valuesshown in Fig. 13 are the maximum value of the PGA in X and Y di-rections.
Among the simulations using the same ground motion before andafter retrofitting, 17 simulations led to the same damage grade, 8 to aworsening of 1 damage grade and 10 to an improvement of 1 damagegrade.
To compare the relation between the changes in the stiffness of thebuilding subjected to strong motions with its displacement capacity, the
Table 7Modal frequencies of the buildings from numerical modeling.
Before retrofit After retrofit
1st mode freq. (longitudinal) 2.94 Hz 3.03 Hz2nd mode freq. (transverse) 3.13 Hz 3.22 Hz
Fig. 11. Typical damage mechanisms in thenumerical model of the URM building beforeretrofitting associated to: (a) DG1, (b) DG3and (c) DG4.
C. Michel et al. Engineering Structures 158 (2018) 124–135
131
drop in the natural frequency of each mode, normalized using the initialnatural frequencies in Table 7, versus the inter-story drift in each di-rection is shown in Fig. 14. Those values are also compared to an em-pirical model obtained from laboratory tests of a clay brick URMstructure [27]. The different failure mechanisms of the URM buildingbefore and after the retrofit work can explain the differences seen inFig. 14. The pre-retrofit failure mechanism in the URM building is aresult of local damage in the connection of the slabs with the URMwalls, which results in an out-of-plane failure of the URM walls. Thepost-retrofit failure mechanism of the URM building, on the other hand,is governed by a soft story mechanism in the building involving the in-plane resistance from all the URM walls. The new stiff slabs link theURM walls and make them behave uniformly; therefore, the drop in theoverall frequencies which is related to the overall stiffness of thebuilding [27], and not some local effects, is higher after adding the stiffslabs.
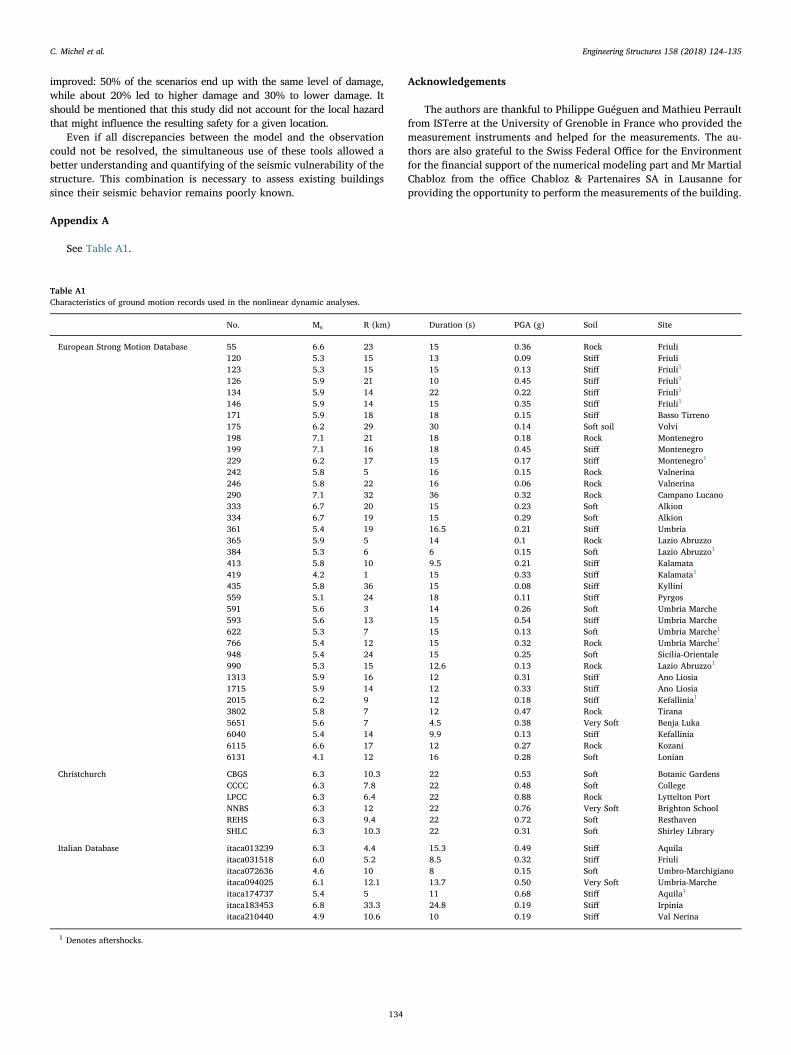
The comparison of the inter-story drift values from the pre- andpost-retrofit numerical models can provide an idea about the change inthe displacement capacity and ductility of the URM building, as a resultof the retrofit work. Fig. 15 shows the mean values of the inter-story
drift at each damage grade (DG1 to DG4) along with the 68% con-fidence intervals of the data (mean plus/minus one standard deviation).It should be noted that the inter-story values for DG5 are not shown inthis figure because this damage grade corresponds to the collapse of thebuilding, and the inter-story drift values are difficult to be determined.
If the damage grade 2 is considered as the yield point at which theURM building enters the nonlinear phase, and damage grade 4 is as-sumed to be the ultimate point before the building collapses (damagegrade 5), the displacement ductility of the URM building before andafter the retrofit work can be estimated from the mean values of theinter-story drift as shown in Table 8.
As seen in Table 8, although the average displacement capacity ofthe URM building has increased as a result of the retrofit work, thedisplacement ductility seems to be lower for the post-retrofit case. Thiscould be explained by the fact that the new slabs have increased theoverall stiffness of the building resulting in a structure with a higher
Fig. 12. Typical damage mechanisms asso-ciated to DG5 in the numerical model of theURM building (a) before and (b) after retro-fitting.
Fig. 13. Lognormal distribution of the peak ground acceleration values for each damagegrade.
Fig. 14. Drop in the modal frequencies (normalized) with the inter-story drift values.
C. Michel et al. Engineering Structures 158 (2018) 124–135
132
strength but lower ductility.
4. Discussion
4.1. Effect on resonance frequencies
The numerical analyses show only a 3% increase in the modal fre-quencies of the URM building after the retrofit work, whereas theambient vibration study shows a 25% increase. In the model, the in-crease in the overall stiffness of the URM building has been counter-balanced by the increase in the mass, as a result of the new stiff slabs. Inthe ambient vibration tests, additional stiffness can be observed.Considering SSI effects in the recordings, this change in structuralstiffness could be even larger. The stiffness of partition walls is naturallyincluded in the observation and not in the numerical modeling butthese non-structural elements cannot provide such a large stiffness andthe model is already too stiff, so that this difference remains un-explained. This shows the difficulty to model such a complex structureand our remaining lack of knowledge in the interpretation and mod-eling of the dynamics of URM structures. This uncertainty in the fre-quency is important for the estimation of the seismic demand. If weconsider a 35% frequency drop from the ambient vibrations level to theyield level [27], the “elastic” fundamental frequency from the experi-mental data would be 1.75 Hz in the initial state and 2.2 Hz in the finalstate. The elastic acceleration demand in the SIA261 code (zone 1,ground type C) would remain on the plateau at 1.7m/s2. However, withthe same assumption, the displacement demand would vary from1.4 cm in the initial state to 0.9 cm in the retrofitted state. This decreaseof the displacement demand due to the stiffening would be more than35%, which is noticeable. Using the frequencies from the numericalmodeling, no gain in the displacement demand is expected. This is,therefore, a conservative result that makes the modeling valid for theseismic assessment.
4.2. Effect on mode shapes
Using the experimental data, the expected diaphragm effect after
adding the new slabs could be observed and, therefore, was used in thenumerical modeling. The experimental data also showed an increasedsensitivity to torsion due to this effect. However, the dynamic modelingproves that this added sensitivity does not play a role in the earthquakesafety. This is due to the good symmetry of the walls that limits torsion.
Figs. 6 and 15 show a change in the mode shape between the pre-retrofit numerical model and the one after retrofitting. The total lateraldrift in the numerical model after the retrofitting work is governed bythe inter-story drift of the first floor. This is different from the behaviorof the numerical model before retrofit, in which the lateral drift has auniform distribution over the height of the building. This difference inbehavior shows that the retrofit has a clear effect on the overall seismicbehavior of the URM building. Unlike the pre-retrofit structure, forwhich the failure mechanism is governed by the out-of-plane failure ofthe URM walls, the installation of the stiff slabs in the building creates adiaphragm effect for those walls. As a result, when the URM building issubjected to strong motions, all the elements contribute to the lateralload resisting system, and the failure mechanism transforms from alocal to a global behavior. A higher drop in the normalized modalfrequencies in the post-retrofit structure, shown in Fig. 14 is a goodevidence of this transformation, showing that a higher share of theURM elements contribute to the lateral load resisting system.
From a displacement perspective, the post-retrofit structure has ahigher displacement capacity (higher inter-story drift values), but alower displacement ductility. Overall, the safety with respect to the 35scenarios performed in both states did not change much, although aslight improvement was noted (Section 3.3).
4.3. Other effects
The ambient vibration experiment pointed out other effects thatcannot be seen in the numerical modeling. The most relevant is probablysoil-structure interaction that seems to play an important role in this case.Moreover, the effect of surface geology on the ground motion could beassessed with the measurements, although, it was shown not to be sig-nificant in the case of the studied building. Finally, the four tests showedthat long-term stiffening occurred during the retrofitting. As a future re-commendation, monitoring these effects with a seismometer installedbefore the start of the retrofitting work until 6months after the end mayallow us to understand such changes in a building being retrofitted.
5. Conclusions
A numerical modeling and ambient vibration measurements were usedto assess the retrofitting measures conducted in an URM building aimingat improving its soundproofing and also its seismic behavior. The majorpart of the retrofitting work concerned the addition of a stiff slab at eachfloor. From the results of both the numerical modeling and the ambientvibration measurements, it is confirmed that the in-plane behavior of theslabs evolved from non-rigid floors with in-plane deformation to rigidfloors with diaphragm effects. This will be relevant under earthquake onlyif the connections work well, something that could not be assessed fromeither the numerical modeling or the ambient vibration measurements.The numerical modeling pointed out that the failure mechanism of theURM building in the pre-retrofit status transformed from a local (out-of-plane) to a global (in-plane failure of the walls) behavior when subjectedto strong motions. The numerical models also showed that the displace-ment capacity of the building increased as a result of the stiff slabs, and onaverage, higher inter-story drift values were observed for all the damagegrades in the post-retrofit model. The ambient vibration measurementsshowed an increase of about 25% in the modal frequencies of the URMbuilding due to the retrofitting work. However, this stiffness increase (orloss of flexibility) could not be explain with the modeling which is thestrongest limitation of our study. Such a change has an influence on theseismic demand that the structure could resist. According to the scenariosperformed with the numerical model, the seismic safety was only slightly
Fig. 15. Mean plus/minus one standard deviation for the inter-story drift at each DG.
Table 8Change in the displacement capacity of the URM building.
ISD-mean values (%) Before retrofit After retrofit
DG2 0.16 0.38DG4 0.64 0.66Displacement ductility from ISD 4 1.7
C. Michel et al. Engineering Structures 158 (2018) 124–135
133
improved: 50% of the scenarios end up with the same level of damage,while about 20% led to higher damage and 30% to lower damage. Itshould be mentioned that this study did not account for the local hazardthat might influence the resulting safety for a given location.
Even if all discrepancies between the model and the observationcould not be resolved, the simultaneous use of these tools allowed abetter understanding and quantifying of the seismic vulnerability of thestructure. This combination is necessary to assess existing buildingssince their seismic behavior remains poorly known.
Acknowledgements
The authors are thankful to Philippe Guéguen and Mathieu Perraultfrom ISTerre at the University of Grenoble in France who provided themeasurement instruments and helped for the measurements. The au-thors are also grateful to the Swiss Federal Office for the Environmentfor the financial support of the numerical modeling part and Mr MartialChabloz from the office Chabloz & Partenaires SA in Lausanne forproviding the opportunity to perform the measurements of the building.
Appendix A
See Table A1.
Table A1Characteristics of ground motion records used in the nonlinear dynamic analyses.
No. Ms R (km) Duration (s) PGA (g) Soil Site
European Strong Motion Database 55 6.6 23 15 0.36 Rock Friuli120 5.3 15 13 0.09 Stiff Friuli123 5.3 15 15 0.13 Stiff Friuli1
126 5.9 21 10 0.45 Stiff Friuli1
134 5.9 14 22 0.22 Stiff Friuli1
146 5.9 14 15 0.35 Stiff Friuli1
171 5.9 18 18 0.15 Stiff Basso Tirreno175 6.2 29 30 0.14 Soft soil Volvi198 7.1 21 18 0.18 Rock Montenegro199 7.1 16 18 0.45 Stiff Montenegro229 6.2 17 15 0.17 Stiff Montenegro1
242 5.8 5 16 0.15 Rock Valnerina246 5.8 22 16 0.06 Rock Valnerina290 7.1 32 36 0.32 Rock Campano Lucano333 6.7 20 15 0.23 Soft Alkion334 6.7 19 15 0.29 Soft Alkion361 5.4 19 16.5 0.21 Stiff Umbria365 5.9 5 14 0.1 Rock Lazio Abruzzo384 5.3 6 6 0.15 Soft Lazio Abruzzo1
413 5.8 10 9.5 0.21 Stiff Kalamata419 4.2 1 15 0.33 Stiff Kalamata1
435 5.8 36 15 0.08 Stiff Kyllini559 5.1 24 18 0.11 Stiff Pyrgos591 5.6 3 14 0.26 Soft Umbria Marche593 5.6 13 15 0.54 Stiff Umbria Marche622 5.3 7 15 0.13 Soft Umbria Marche1
766 5.4 12 15 0.32 Rock Umbria Marche1
948 5.4 24 15 0.25 Soft Sicilia-Orientale990 5.3 15 12.6 0.13 Rock Lazio Abruzzo1
1313 5.9 16 12 0.31 Stiff Ano Liosia1715 5.9 14 12 0.33 Stiff Ano Liosia2015 6.2 9 12 0.18 Stiff Kefallinia1
3802 5.8 7 12 0.47 Rock Tirana5651 5.6 7 4.5 0.38 Very Soft Benja Luka6040 5.4 14 9.9 0.13 Stiff Kefallinia6115 6.6 17 12 0.27 Rock Kozani6131 4.1 12 16 0.28 Soft Lonian
Christchurch CBGS 6.3 10.3 22 0.53 Soft Botanic GardensCCCC 6.3 7.8 22 0.48 Soft CollegeLPCC 6.3 6.4 22 0.88 Rock Lyttelton PortNNBS 6.3 12 22 0.76 Very Soft Brighton SchoolREHS 6.3 9.4 22 0.72 Soft ResthavenSHLC 6.3 10.3 22 0.31 Soft Shirley Library
Italian Database itaca013239 6.3 4.4 15.3 0.49 Stiff Aquilaitaca031518 6.0 5.2 8.5 0.32 Stiff Friuliitaca072636 4.6 10 8 0.15 Soft Umbro-Marchigianoitaca094025 6.1 12.1 13.7 0.50 Very Soft Umbria-Marcheitaca174737 5.4 5 11 0.68 Stiff Aquila1
itaca183453 6.8 33.3 24.8 0.19 Stiff Irpiniaitaca210440 4.9 10.6 10 0.19 Stiff Val Nerina
1 Denotes aftershocks.
C. Michel et al. Engineering Structures 158 (2018) 124–135
134
References
[1] Asteris PG, Chronopoulos MP, Chrysostomou CZ, Varum H, Plevris V, Kyriakides N,et al. Seismic vulnerability assessment of historical masonry structural systems. EngStruct 2014;62–63:118–34. http://dx.doi.org/10.1016/j.engstruct.2014.01.031.
[2] SIA. Merkblatt SIA 2018 – Überprüfung bestehender Gebäude bezüglich Erdbeben.Zürich, Switzerland; 2004.
[3] Chung L-L, Yang Y-S, Lien K-H, Wu L-Y. In situ experiment on retrofit of schoolbuildings by adding sandwich columns to partition brick walls. Earthq Eng StructDyn 2014;43:339–55. http://dx.doi.org/10.1002/eqe.2347.
[4] Soyoz S, Taciroglu E, Orakcal K, Nigbor R, Skolnik D, Lus H, et al. Ambient andforced vibration testing of a reinforced concrete building before and after its seismicretrofitting. J Struct Eng 2013;139:1741–52. http://dx.doi.org/10.1061/(ASCE)ST.1943-541X.0000568.
[5] Hancilar U, Çaktı E, Erdik M. Earthquake performance assessment and rehabilita-tion of two historical unreinforced masonry buildings. Bull Earthq Eng2012;10:307–30. http://dx.doi.org/10.1007/s10518-011-9281-3.
[6] ElGawady MA, Lestuzzi P, Badoux M. In-plane seismic response of URM walls up-graded with frp. J Compos Constr 2005;9:524–35. http://dx.doi.org/10.1061/(ASCE)1090-0268(2005) 9:6(524).
[7] ElGawady MA, Lestuzzi P, Badoux M. Aseismic retrofitting of unreinforced masonrywalls using FRP. Compos Part B Eng 2006;37:148–62. http://dx.doi.org/10.1016/j.compositesb.2005.06.003.
[8] Vicente R, Rodrigues H, Varum H, Mendes da Silva JAR. Evaluation of strength-ening techniques of traditional masonry buildings case study of a four-buildingaggregate. J Perform Constr Facil 2011;25:202–16. doi:10.1061/(ASCE)CF.1943-5509.0000164.
[9] Nayeri RD, Masri SF, Chassiakos AG. Application of structural health monitoringtechniques to track structural changes in a retrofitted building based on ambientvibration. J Eng Mech 2007;133:1311–25. http://dx.doi.org/10.1061/(ASCE)0733-9399(2007)133:12(1311).
[10] Tomazevic M, Lutman M, Velechovsky T. Aseismic strengthening of old stone-ma-sonry buildings is the replacement of wooden floors with RC Slabs always neces-sary? Eur Earthq Eng 1993;2:34–46.
[11] Brignola A, Podestà S, Pampanin S. In-plane stiffness of wooden floor. In: NZSEEconf; 2008. p. 1–19.
[12] Lestuzzi P, Podestà S, Luchini C, Garofano A, Kazantzidou-Firtinidou D, Bozzano C,et al. Seismic vulnerability assessment at urban scale for two typical Swiss citiesusing Risk-UE methodology. Nat Hazards 2016;84:249–69. http://dx.doi.org/10.1007/s11069-016-2420-z.
[13] Géolausanne. Microzonage de Lausanne; 2012.[14] Michel C, Guéguen P, El Arem S, Mazars J, Kotronis P. Full-scale dynamic response
of an RC building under weak seismic motions using earthquake recordings, am-bient vibrations and modelling. Earthq Eng Struct Dyn 2010;39:419–41. http://dx.doi.org/10.1002/eqe.948.
[15] Snoj J, Österreicher M, Dolšek M. The importance of ambient and forced vibrationmeasurements for the results of seismic performance assessment of buildings ob-tained by using a simplified non-linear procedure: case study of an old masonrybuilding. Bull Earthq Eng 2013;11:2105–32. http://dx.doi.org/10.1007/s10518-013-9494-8.
[16] Karbassi A, Nollet MJ. Performance-based seismic vulnerability evaluation of ma-sonry buildings using applied element method in a nonlinear dynamic-based ana-lytical procedure. Earthq Spectra 2013;29:399–426. http://dx.doi.org/10.1193/1.4000148.
[17] Carden EP, Fanning PJ. Vibration based condition monitoring: a review. Struct HealMonit 2004;3:355–77. http://dx.doi.org/10.1177/1475921704047500.
[18] Bonnefoy-Claudet S, Cotton F, Bard P. The nature of noise wavefield and its ap-plications for site effects studies. Earth-Sci Rev 2006;79:205–27. http://dx.doi.org/10.1016/j.earscirev.2006.07.004.
[19] Welch PD. The use of fast fourier transform for the estimation of power spectra: amethod based on time averaging over short, modified periodograms. IEEE TransAudio Electroacoust 1967;15:70–3.
[20] Brincker R, Zhang L, Andersen P. Modal identification of output-only systems usingfrequency domain decomposition. Smart Mater Struct 2001;10:441–5. http://dx.doi.org/10.1088/0964-1726/10/3/303.
[21] Brincker R, Ventura CE, Andersen P. Damping estimation by frequency domaindecomposition. In: 19th int modal anal conf, Kissimmee, Florida; 2001. p. 698–703.
[22] Goulet J-A, Michel C, Smith IFC. Hybrid probabilities and error-domain structuralidentification using ambient vibration monitoring. Mech Syst Signal Process2013;37:199–212. http://dx.doi.org/10.1016/j.ymssp.2012.05.017.
[23] Bard P. The H/V technique: capabilities and limitations based on the results of theSESAME project. Bull Earthq Eng 2008;6:1–2. http://dx.doi.org/10.1007/s10518-008-9059-4.
[24] Konno K, Ohmachi T. Ground-motion characteristics estimated from spectral ratiobetween horizontal and vertical components of microtremor. Bull Seismol Soc Am1998;88:228–41.
[25] Chatelain J-L, Guillier B, Guéguen P, Fréchet J, Sarrault J. Ambient vibration re-cording for single-station, array and building studies made simple: CityShark II. IntJ Geosci 2012;3:1168–75. http://dx.doi.org/10.4236/ijg.2012.326118.
[26] Michel C, Guéguen P, Causse M. Seismic vulnerability assessment to slight damagebased on experimental modal parameters. Earthq Eng Struct Dyn 2012;41:81–98.http://dx.doi.org/10.1002/eqe.1119.
[27] Michel C, Zapico B, Lestuzzi P, Molina FJ, Weber F. Quantification of fundamentalfrequency drop for unreinforced masonry buildings from dynamic tests. Earthq EngStruct Dyn 2011;40:1283–96. http://dx.doi.org/10.1002/eqe.1088.
[28] Meguro K, Tagel-Din HS. Applied element method used for large displacementstructural analysis. J Nat Disaster Sci 2002;24:25–34.
[29] Tagel-Din H, Meguro K. Applied element method for dynamic large deformationanalysis of structures. J Struct Mech Earthq Eng JSCE 2000;17:215–24.
[30] Fry B, Benites R, Kaiser A. The character of accelerations in the Mw 6.2Christchurch earthquake. Seismol Res Lett 2011;82:846–52. http://dx.doi.org/10.1785/gssrl.82.6.846.
[31] Guragain R, Warakanchana K, Mayourca P, Meguro K. Numerical simulation ofmasonry structures under cyclic loading using applied element method. Universityof Tokyo; 2006.
[32] Hill M, Rossetto T. Comparison of building damage scales and damage descriptionsfor use in earthquake loss modelling in Europe. Bull Earthq Eng 2008;6:335–65.http://dx.doi.org/10.1007/s10518-007-9057-y.
[33] Grünthal G, Musson RMW, Schwartz J, Stucchi M. European macroseismic scale vol.15. Luxembourg: Cahiers du Centre Européen de Géodynamique et de Séismologie;1998.
[34] Lang K, Bachmann H. On the seismic vulnerability of existing unreinforced masonrybuildings. J Earthq Eng 2003;7:407–26.
[35] SIA. SIA 266 Masonry. Zurich (Switzerland): Swiss Society of Engineers andArchitects SIA; 2003.
[36] European Committee for Standardisation. Eurocode 6: design of masonry structures.1995.
[37] Lourenço PB. Experimental and numerical issues in the modelling of the mechanicalbehaviour of masonry. Struct Anal Hist Constr II. Barcelona: CIMNE; 1998, p.57–91.
[38] Ambraseys NN, Smit P, Douglas J, Margaris B, Sigbjörnsson R, Olafsson S, et al.Internet site for European strong-motion data. Bolletino Di Geofis Teor Ed Appl2004;45:113–29.
[39] Luzi L, Hailemikael S, Bindi D, Pacor F, Mele F, Sabetta F. ITACA (ITalianACcelerometric Archive): a web portal for the dissemination of Italian strong-mo-tion data. Seismol Res Lett 2008;79:716–22. http://dx.doi.org/10.1785/gssrl.79.5.716.
C. Michel et al. Engineering Structures 158 (2018) 124–135
135