evaluation of the financial situation in the firm and
TRANSCRIPT

VYSOKÉ UČENÍ TECHNICKÉ V BRNĚBRNO UNIVERSITY OF TECHNOLOGY
FAKULTA PODNIKATELSKÁÚSTAV EKONOMIKY
FACULTY OF BUSINESS AND MANAGEMENTINSTITUTE OF ECONOMICS
EVALUATION OF THE FINANCIAL SITUATION INTHE FIRM AND PROPOSALS TOITS IMPROVEMENT
HODNOCENÍ FINANČNÍ SITUACE PODNIKU A NÁVRHY NA JEJÍ ZLEPŠENÍ
DIPLOMOVÁ PRÁCEMASTER'S THESIS
AUTOR PRÁCE Bc. HANA HRADÍLKOVÁAUTHOR
VEDOUCÍ PRÁCE doc. Ing. JAN SOLAŘ, CSc.SUPERVISOR
BRNO 2009
brought to you by COREView metadata, citation and similar papers at core.ac.uk
provided by Digital library of Brno University of Technology

Brno University of Technology Academic year: 2008/2009Faculty of Business and Management Institute of Economics
MASTER'S THESIS ASSIGNMENT
Hradílková Hana, Bc.
European Business and Finance (6208T150)
Pursuant to Act. No. 111/1998 Coll., on Higher Education Institutions, and in accordance withthe Rules for Studies and Examinations of the Brno University of Technology an Dean’sDirective on Realization of Bachelor and Master Degree Programs, the director of the Institute ofis submitting you a master's thesis of the following title:
Evaluation of the Financial Situation in the Firm and Proposals toits Improvement
In the Czech language:
Hodnocení finanční situace podniku a návrhy na její zlepšení
Instructions:
IntroductionDefinition of Problem and Aims of ThesisTheoretical Base of ThesisAnalysis of Problem and Current SituationProposed Solution, Contribution of Proposed SolutionConclusionReferencesAppendices
Pursuant to section 60 of Act No. 121/2000 Coll., as subsequently amended (hereinafter referred to as "Copyright
Act") this thesis is a "schoolwork" and its use complies to the legal regime of the Copyright Act. Quotations hereof
are permitted upon prior consent of the Faculty of Business and Management of Brno University of Technology.
Before any external use of this thesis it is strictly required to conclude a "License Agreement" pursuant to the
Copyright Act.

Literature / Sources:
ALEXANDER, C. Market models: a guide to financial data analysis. Chichester: John Wiley &Sons, 2001. 494 s. ISBN 0-471-89975-5.BERNSTEIN, L. A. Analysis of financial statements. New York: McGraw-Hill, 2000. 784 s.ISBN 0-07-094504-7.FRIDSON, M. Financial statement analysis: a practitioner’s guide. New York: John Wiley &Sons, 2002. 396 s. ISBN 0-471-40915-4.WHITE, G. I. The analysis and use of financial statements. Hoboken: John Wiley & Sons, 2003.767 s. ISBN 0-471-37594-2.
The supervisor of master's thesis: doc. Ing. Jan Solař, CSc.
Submission deadline master's thesis is given by the Schedule of the Academic year 2008/2009.
L.S.
_______________________________ _______________________________Ing. Martin Slezák doc. RNDr. Anna Putnová, Ph.D., MBA
Director of the Institute Dean of the Faculty
Brno, 24.08.2009

Annotation
The master’s thesis evaluates the financial situation of the company VODNÍ DÍLA-
TBD Inc. with use of selected methods of financial analysis during the period
2004-2008. The thesis proposes possible solutions and measures to improve the
financial situation of this company in coming years.
Anotace
Tato diplomová práce hodnotí finanční situaci společnosti VODNÍ DÍLA-TBD a.s.
s využitím vybraných metod finanční analýzy v období let 2004-2008. Práce navrhuje
možná řešení a opatření vedoucích ke zlepšení finanční situace této společnosti
v následujících letech.
Key words
Financial analysis, financial ratios, profitability, liquidity, activity, insolvency
Klí čová slova
Finanční analýza, finanční ukazatele, rentabilita, likvidita, aktivita, zadluženost

Bibliographic Citation
HRADÍLKOVÁ, H. Hodnocení finanční situace podniku a návrhy na její
zlepšení. Brno: Vysoké učení technické v Brně, Fakulta podnikatelská, 2009. 80 s.
Vedoucí diplomové práce doc. Ing. Jan Solař, CSc.

Declaration
I hereby declare that this master’s thesis has been written by myself without any
external unauthorised help, that it has been neither presented to any institution for
evaluation nor previously published in its entirety or in parts. All used information
sources are properly cited including complete reference to the original work.
Brno, 22nd August 2009 …………………………….. Signature

Acknowledgement
First of all I would like to thank my supervising tutor doc. Ing. Jan Solař, CSc. and Ing.
Ondřej Žižlavský for their abundant help and their prolific suggestions. I also thank
Ing. Jiří Hodák, a manager of department in Brno of the company VODNÍ DÍLA-TBD
Inc., for giving valuable information, consultations and for his obliging approach.

CONTENT
INTRODUCTION ............................................................................................................ 9
1 DEFINITION OF PROBLEM AND AIMS OF THESIS ........................................... 11
1.1 Introduction of the Company................................................................................ 11
1.1.1 History ........................................................................................................... 12
1.1.2 Activities........................................................................................................ 12
1.1.3 Organizational Structure ................................................................................ 15
1.1.4 Porter’s Five Forces Analysis ........................................................................ 16
1.1.5 SWOT Analysis ............................................................................................. 17
1.1.6 Analyses Results ............................................................................................ 19
1.2 Aims of Thesis ...................................................................................................... 19
2 THEORETICAL BASE OF THESIS ..........................................................................20
2.1 Financial Analysis................................................................................................. 20
2.1.1 Methods of Financial Analysis ...................................................................... 21
2.1.2 Sources of Financial Analysis........................................................................ 22
2.1.3 Users of Financial Analysis ........................................................................... 23
2.1.4 Financial Ratios ............................................................................................. 24
2.2 Absolute Ratios..................................................................................................... 25
2.2.1 Horizontal Analysis ....................................................................................... 25
2.2.2 Vertical Analysis............................................................................................ 25
2.3 Proportion Ratios .................................................................................................. 26
2.3.1 Profitability Ratios......................................................................................... 26
2.3.2 Efficiency Ratios............................................................................................ 27
2.3.3 Liquidity Ratios ............................................................................................. 30
2.3.4 Solvency Ratios ............................................................................................. 32
2.4 Differential Ratios................................................................................................. 34
2.4.1 Net Working Capital ...................................................................................... 34
2.4.2 Net Quick Assets ........................................................................................... 35
2.4.3 Net Cash Assets ............................................................................................. 35
2.5 Cash Flow Analysis .............................................................................................. 35
2.6 System of Ratios ................................................................................................... 37

2.6.1 Pyramidal Analysis ........................................................................................ 37
2.6.2 Altman Z-Score.............................................................................................. 37
2.6.3 Index IN05 ..................................................................................................... 38
2.6.4 Quick Test...................................................................................................... 39
3 ANALYSIS OF PROBLEM AND CURRENT SITUATION.................................... 41
3.1 Absolute Ratio Analysis ....................................................................................... 41
3.1.1 Horizontal Analysis ....................................................................................... 42
3.1.2 Vertical Analysis............................................................................................ 48
3.1.3 Verification of Golden Rules......................................................................... 49
3.2 Proportion Ratios Analysis ................................................................................... 51
3.2.1 Profitability Ratios Analysis.......................................................................... 51
3.2.2 Efficiency Ratios Analysis............................................................................. 52
3.2.3 Liquidity Ratios Analysis .............................................................................. 53
3.2.4 Solvency Ratios Analysis .............................................................................. 54
3.3 Differential Ratios Analysis.................................................................................. 56
3.4 Cash Flow Analysis .............................................................................................. 57
3.5 System of Ratios ................................................................................................... 59
4 PROPOSED SOLUTION AND ITS CONTRIBUTION ............................................ 60
4.1 Summary of Financial Analysis Results............................................................... 60
4.1.1 Evaluation of Assets and Liabilities Trend.................................................... 60
4.1.2 Evaluation of Income Statement Trend ......................................................... 61
4.1.3 Evaluation of Cash Flow Trend ..................................................................... 61
4.1.4 Evaluation of Liquidity and Profitability.......................................................62
4.2 Proposed Solution and Recommendation ............................................................. 63
4.3 Evaluation of Contribution of Proposed Solution................................................. 68
CONCLUSION............................................................................................................... 69
REFERENCES ............................................................................................................... 70
LIST OF TABLES.......................................................................................................... 72
LIST OF GRAPHS ......................................................................................................... 72
LIST OF FIGURES ........................................................................................................ 73
LIST OF APPENDICES................................................................................................. 73

9
INTRODUCTION
The financial crisis is a recent theme that influences life of individuals, companies and
countries as well. Specialists and investors are interested in reasons of the financial
crisis and its development and impacts in next years. At this time, it is necessary to
monitor development of enterprises and economy as a whole.
According to CTK (Czech News Agency) the worst is most likely over for the Czech
economy and the fall in GDP or in industrial production should already be slower than
at the beginning of the year. On the other hand, a significant improvement can hardly be
expected in case of unemployment, which will keep growing. The stability and the
quality of home economy decide how big losses it suffers. (17)
Every economical subject who wants to be successful on the market has to continuously
analyse its activity and reached results. Every decision in the company has to be adapted
to changes in the way, that company can maintain or increase status on the market and
can be able to compete. It is necessary to optimise the volume of production, inventory,
structure of financing and personnel according to changes in market environment. The
basic aim of every company is long time maximization of company’s market value.
Finances are important part of every enterprise. To monitor a development of
management results, financial stability, profitability and liquidity are used for financial
analyses of situation. The analysis gives an overview of financial and property situation
of company, its causes and gives impulses for financial management and decision-
making.
The content of my master’s thesis is to carry out an analysis of financial management of
a selected company. This means a complex examination of current financial and
economical situation of the company, which is VODNÍ DÍLA-TBD a. s. (VD-TBD
a.s.) in this case.
The thesis is divided into several thematic parts. In the first part there are the problems
defined and stated the aims of thesis and information about the analysed company. This
includes introduction of the company, its focus, history, activities and organizational
structure. SWOT analysis and Porter’s analysis of the company are done as well.

10
The second part contains theoretical base from literature. Theory describes a financial
analysis, its relevance and methods. Probably the most widely used financial analysis
technique is ratio analysis, the analysis of relationships between two or more line items
on the financial statement. For a purpose of the thesis are used absolute, proportion, and
differential ratios. Vertical and horizontal analyses show comparison of analysed data
with data from previous accounting year. The cash flow analysis is an important tool for
managing liquidity. Systems of ratios are calculated to determine a financial health and
trustworthiness of the company.
The third part of the thesis is focused on analysis of the problem and current situation
with help of calculation of selected financial analysis ratios during the period 2004 –
2008. The summary of financial analysis and proposed solution and its contribution are
contained in the fourth part.

11
1 DEFINITION OF PROBLEM AND AIMS OF THESIS
The first chapter is focused on a definition of primary and secondary aims of the thesis.
There is an introduction of the company where is the financial analysis done. It
describes basic facts about company, its history, activities and organizational structure,
the book value of equity and composition of shareholders. With help of SWOT analysis
are shown company’s strengths, weaknesses, opportunities and threads. Porter’s five
analysis deals with company’s environment and industry the company belongs to.
1.1 Introduction of the Company
VODNÍ DÍLA-TBD a. s. (Dam Safety Surveillance and Supervision) is an engineering
and consulting company, which provides technical and safety supervision over
waterworks in the Czech Republic.
Trade Name: VODNÍ DÍLA-TBD a. s.
Place of Business: Praha 1, Hybernská 40, postcode 110 00
Registration Number: 492 41 648
Entry Date: 6th October 1993
Legal Form: Incorporated
Subject of Enterprise: Technical and safety supervision, see further
Equity Capital: 10,600,000 CZK
Principal Shareholders: Mainly recent and former employees
Figure 1 The Logo of the Company Source: Company’s in-house material
The company monitors and evaluates the technical conditions of waterworks,
emphasizing safety and reliability, and eliminates possible failures and their
consequences. Its activity also helps to anticipate all kinds of failures, which results to
avoiding the economical losses on the waterworks itself and in the downstream area as
well. The main goal is to prevent and mitigate risks resulting from possible dam
failures.
12
1.1.1 History
The incorporated company VD-TBD a. s. was founded in 1993 by privatisation of a
state enterprise Vodohospodářský rozvoj a výstavba (Water Development and Works).
The Central water authority to do dam safety surveillance and supervision after winning
public competition entrusted the company in 1994. The Ministry of Agriculture
authorised the company to do dam safety supervision for all categories and to make
references for waterworks categorization.
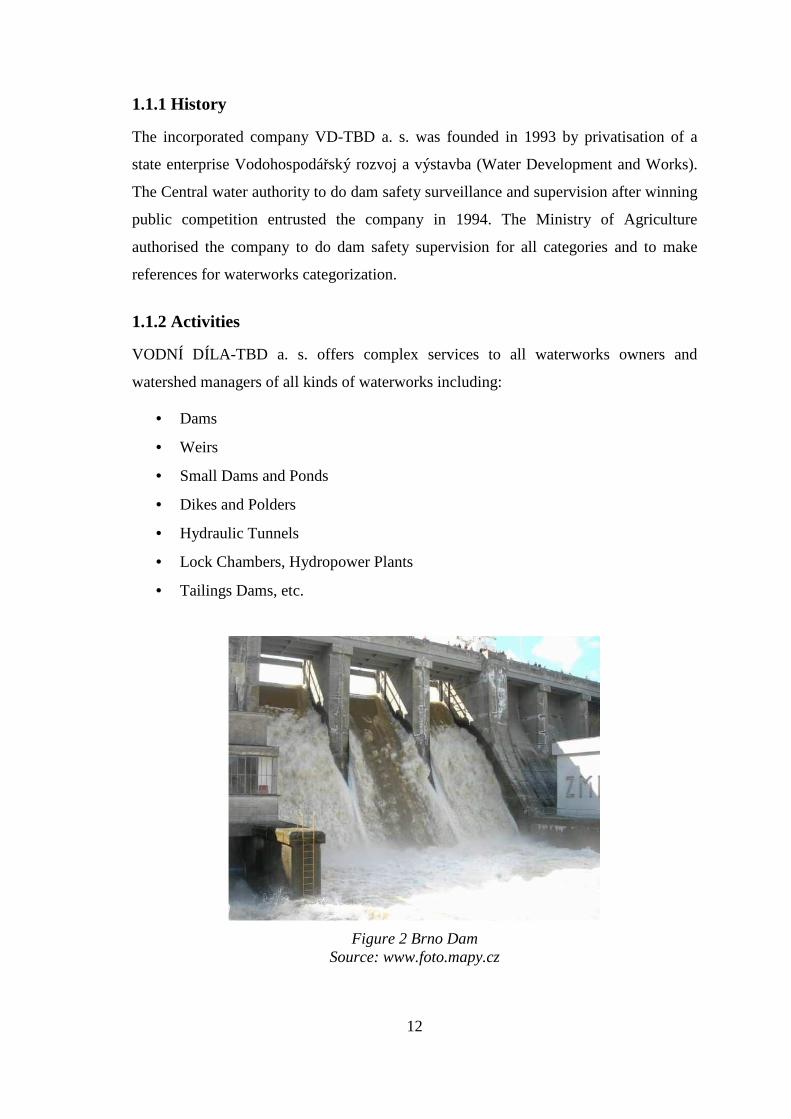
1.1.2 Activities
VODNÍ DÍLA-TBD a. s. offers complex services to all waterworks owners and
watershed managers of all kinds of waterworks including:
• Dams
• Weirs
• Small Dams and Ponds
• Dikes and Polders
• Hydraulic Tunnels
• Lock Chambers, Hydropower Plants
• Tailings Dams, etc.
Figure 2 Brno Dam Source: www.foto.mapy.cz
13
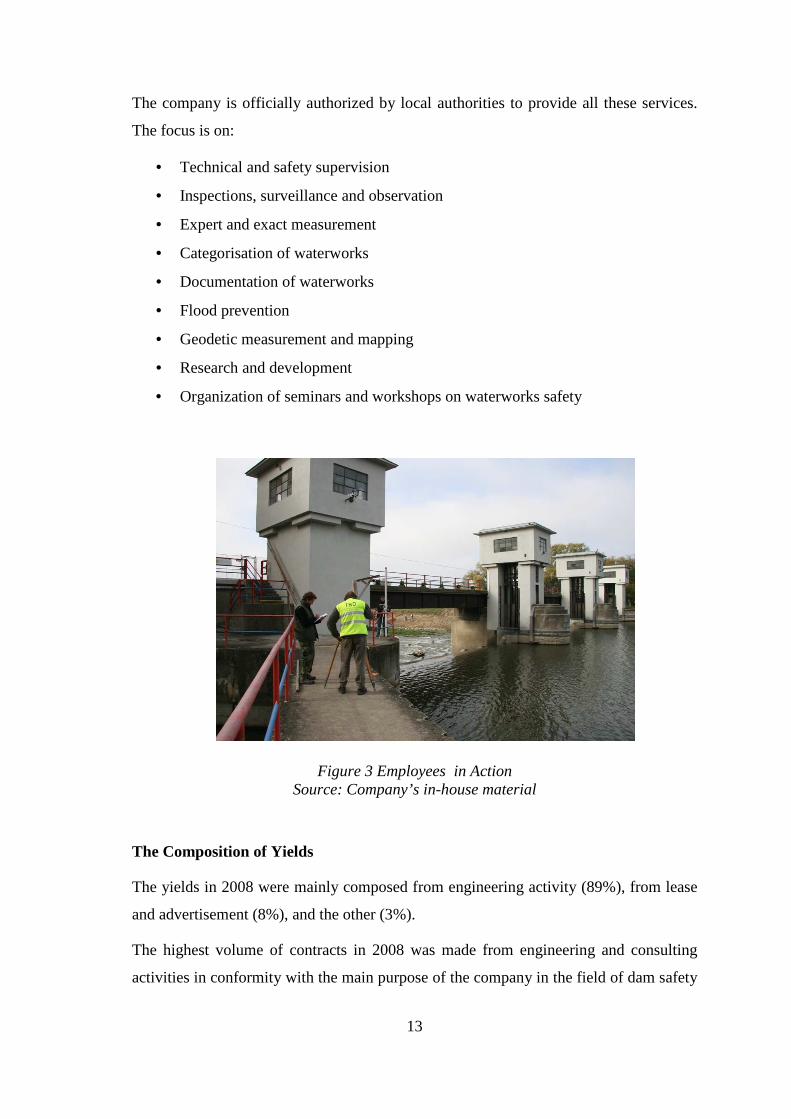
The company is officially authorized by local authorities to provide all these services.
The focus is on:
• Technical and safety supervision
• Inspections, surveillance and observation
• Expert and exact measurement
• Categorisation of waterworks
• Documentation of waterworks
• Flood prevention
• Geodetic measurement and mapping
• Research and development
• Organization of seminars and workshops on waterworks safety
Figure 3 Employees in Action Source: Company’s in-house material
The Composition of Yields
The yields in 2008 were mainly composed from engineering activity (89%), from lease
and advertisement (8%), and the other (3%).
The highest volume of contracts in 2008 was made from engineering and consulting
activities in conformity with the main purpose of the company in the field of dam safety

14
and technical and safety supervision. The company carried on technical and safety
supervision for 279 waterworks in 2008.
Engineering activity89%
Other 3%
Lease and Ad8%
Figure 4 The Composition of Yields
Source: Company’s in-house material
The Book Value of Equity
The company’s book value equity was 2,650,000 CZK at the moment of foundation of
the company. It was composed by investments of founders – shareholders of the
company. The book value of equity was increased to 5,300,000 CZK in 1999 on base of
general assembly decision from owners’ sources. The next increase was in 2004 to
10,600,000 CZK from owners’ sources again. The last increase approved by general
assembly to 21,200,000 CZK was realized in the summer of this year (2009).
Shareholders
The company was founded in 1993 by 66 shareholders who held 265 shares with
nominal value of 10,000 CZK. In 2009 is the general meeting represented by 69
shareholders who hold 265 shares with nominal value of 80,000 CZK. The composition
of shareholders is following: 33 shareholders are employees of the company and they
hold 160 shares (60.4%), the rest 36 external shareholders, including former and retired
employees holding 105 shares (39.6%).
15
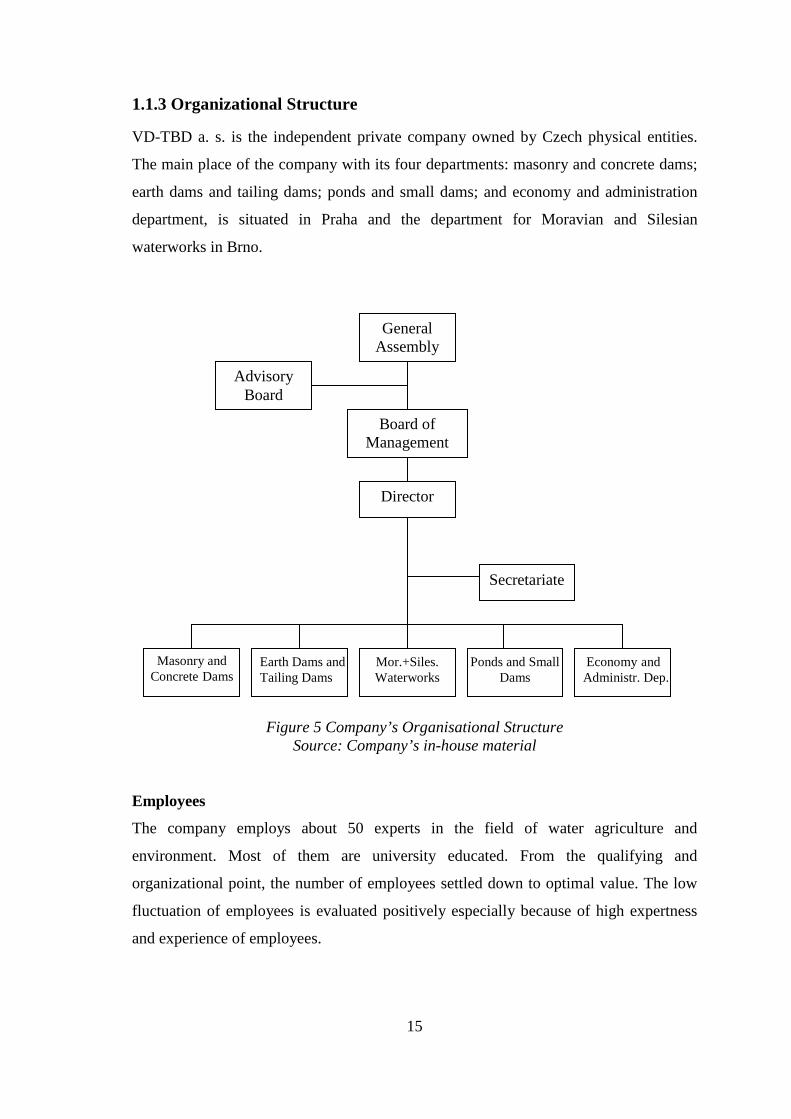
1.1.3 Organizational Structure
VD-TBD a. s. is the independent private company owned by Czech physical entities.
The main place of the company with its four departments: masonry and concrete dams;
earth dams and tailing dams; ponds and small dams; and economy and administration
department, is situated in Praha and the department for Moravian and Silesian
waterworks in Brno.
Figure 5 Company’s Organisational Structure Source: Company’s in-house material
Employees
The company employs about 50 experts in the field of water agriculture and
environment. Most of them are university educated. From the qualifying and
organizational point, the number of employees settled down to optimal value. The low
fluctuation of employees is evaluated positively especially because of high expertness
and experience of employees.
Earth Dams and Tailing Dams
Mor.+Siles. Waterworks
Ponds and Small Dams
Economy and Administr. Dep.
Masonry and Concrete Dams
Advisory Board
General Assembly
Board of Management
Director
Secretariate
16
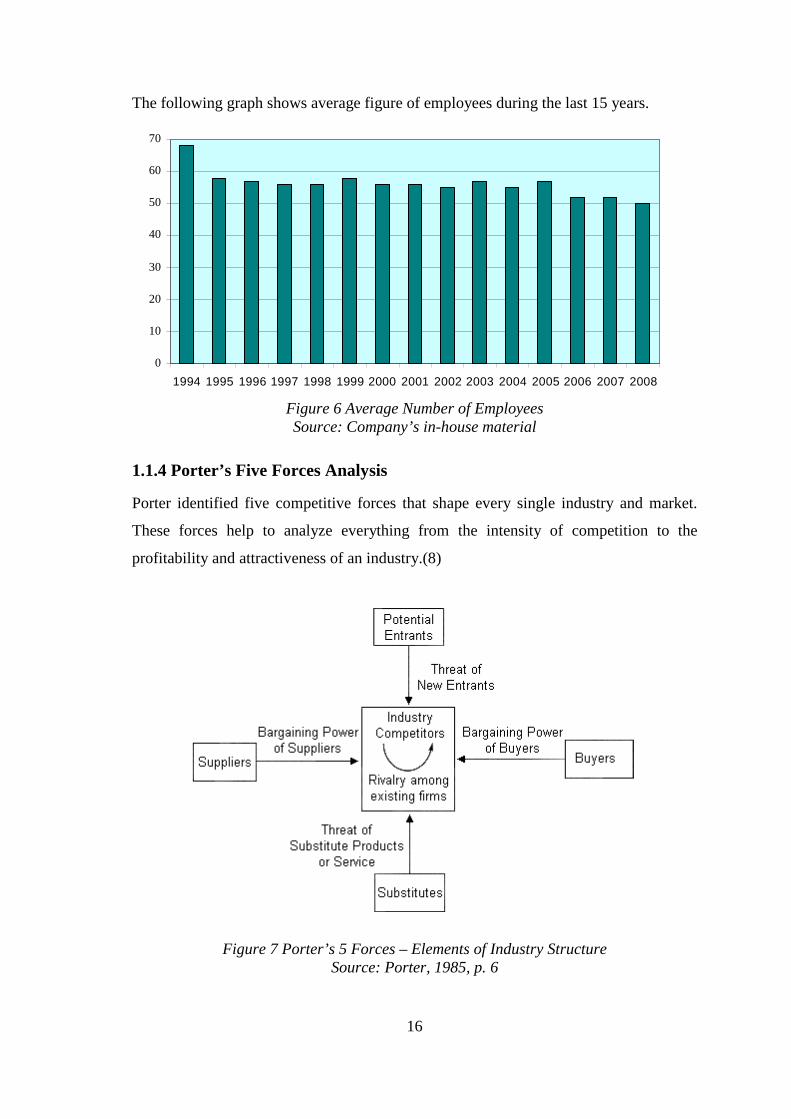
The following graph shows average figure of employees during the last 15 years.
0
10
20
30
40
50
60
70
1994 1995 1996 1997 1998 1999 2000 2001 2002 2003 2004 2005 2006 2007 2008
Figure 6 Average Number of Employees Source: Company’s in-house material
1.1.4 Porter’s Five Forces Analysis
Porter identified five competitive forces that shape every single industry and market.
These forces help to analyze everything from the intensity of competition to the
profitability and attractiveness of an industry.(8)
Figure 7 Porter’s 5 Forces – Elements of Industry Structure Source: Porter, 1985, p. 6
17
VD-TBD a. s. is the independent private company owned by Czech physical entities. It
has no connection to production, operation nor supplier enterprises.
Threat of New Entrants
• Authorization by Ministry of Agriculture of the Czech Republic
• High specialization requirements
• Exclusive contracts
Rivalry among Existing Firms
• None, the only one company with authorization for technical and safety
supervision and categorization of water works
• Only at the level of the other activities
Threat of Substitute Products or Service
• Irreplaceable, no substitutes
Bargaining Power of Buyers
• Owners of waterworks – no bargaining power, duty of technical and safety
supervision is given by Water Act
• Only at the level of other activities
Bargaining Power of Suppliers
• No connection to suppliers
1.1.5 SWOT Analysis
A swot analysis is used to highlight and identify company’s strengths, weaknesses,
opportunities and threats. It brings together the results of the analysis of the firm
(internal), the environmental analysis (external).
The aim is to match the optimum firm’s resources with the environment in order to gain
sustainable competitive advantage. It is possible by building on a firm’s strengths,
reducing weaknesses, exploiting opportunities or countering threats.
It is important to look at strengths and weaknesses in the context of opportunities and
threats. Strengths matter only if you can use them to exploit an opportunity or counter a
threat.

18
Similarly, a weakness is problematic if it relates to a threat. Thus an external factor can
be an opportunity or a threat. A firm must use resources to acquire the strengths that are
necessary to exploit the opportunity. (4)
Strengths
• Exclusive contracts
• Authorization by Ministry of Agriculture
• The duty of technical and safety supervision is given by Water Act
• Specialization of the company
• Expertness and experience of employees
• Loyalty of employees
• Member of ICOLD (International Committee on Large Dams)
Weaknesses
• Needfulness of the authorization by Ministry of Agriculture
• Needfulness of expertness employees
• Prices of contracts
• Outdated way of employees´ thinking
Opportunities
• Arrange contracts for higher price
• Extended education of employees (foreign languages, higher qualification)
• Gaining contracts from foreign countries
• Prepare for case of losing authorization (other possibilities of working in the
field of water structures)
Threats
• Losing of specialists
• Possibility of loss of the authorization by Ministry of Agriculture
• Possibility that the authorization by Ministry of Agriculture will be given to
another company as well
• Possibility of Water Act change in the meaning of technical and safety
supervision

19
1.1.6 Analyses Results
VODNÍ DÍLA–TBD a. s. is the unique independent private company. To exercise its
activities of technical and safety supervision, the company is highly specialized and has
the authorization by Ministry of Agriculture. This authorization is the main strength of
the company, it creates a big barrier for new entrants, on the other hand, the possibility
of its loss is the main threat. How to deal with loss of the authorization can be seen as
an opportunity to find other possibilities of working in the field of water structures.
Due to the authorisation, there is no rivalry, no competitors at the level of dam safety.
The services are so unique that they are not irreplaceable and have no substitutes. The
company has no connection to production, operation nor suppliers companies. Buyers,
the owners or operators, have no bargaining power, because they have duty to perform
technical and safety supervision by Water Act.
1.2 Aims of Thesis
The primary aim of the thesis is:
• To evaluate a financial situation of company VODNÍ DÍLA–TBD a. s. and
propose measures for improving the situation
The secondary aims are following:
• To introduce the company VODNÍ DÍLA–TBD a. s.
• To do a SWOT and Porter’s five analysis of the company
• To do an literature overview of given problematic
• To apply gained theoretical knowledge to concrete enterprise
• To do the financial analysis of current situation
• To do a vertical analysis and horizontal analysis
• To calculate proportion and differential ratios
• To do cash flow analysis
• To calculate Altman Z-Score, Index IN05, Quick test
Financial statement analysis is a judgment process. One of the primary objectives is to
identify major changes in trends, their relationships and what is the most important, why
this changes happened.
20
2 THEORETICAL BASE OF THESIS
The second chapter is focused on the theoretical base of the thesis. There is an
introduction of financial analysis, description of methods that are consequently used in
the chapter three and description of sources and users of financial analysis. The main
part is dedicated to the chosen financial ratios.
2.1 Financial Analysis
Generally there are two basic approaches to financial analysis. The first one is
fundamental analysis, where analyses are done on base of wide knowledge of mutual
connection between economic and non-economic phenomena and on base of experience
of specialist and their estimation, and on base of trends.
The second type is called technical analysis, which uses mathematic, statistic,
econometric and other algorithm methods to work with economic data and assess
results. Both of methods are mutually complement to each other.
The following text considers the technical analysis, which is a necessary tool for
financial management of companies in the field of market economies.
The process of financial analysis contains:
• Collection of entry data needed for analysis
• Choose of right analysis methods in connection to its aim
• Elaboration of analysis
• Calculation of indicators
• Comparison with branch’s averages
• Time trend analysis
• Analysis of relation among indicators
• Interpretation of results
• Suggestion of measures for financial planning and management (16)
21
The main aim of financial analysis is to find financial health of company and forestall
weak sides of financial management of company, which could lead to the problems in
the future. Besides the weak sides it is necessary to specify the strong sides that
company can use as a base of its business in the future. Financial analysis serves as a
background for budget control, calculation, etc. (15)
Financial analysis is used mainly for:
1) Economic decision and assessment of a level of company’s management; and
value and creditworthiness of creditor
2) Financial assessment of situation, it means to assess financial efficiency (profitability
and activity); financial position (liquidity, solvency, insolvency, financial stability)
2.1.1 Methods of Financial Analysis
There are a lot of methods used in financial analysis. From the point of complexity and
deep of analysis the division is following:
• Fundamental technical analysis methods
• Higher financial analysis methods
For purposes of thesis are more closely described only fundamental methods which are
mentioned in next chapters in more detail.
Fundamental Methods
Fundamental methods of financial analysis use basic arithmetic operation with
indicators. The main advantages are simplicity, speed, and unpretentiousness to
calculate.
Fundamental methods of financial analysis are divided into following categories and
subcategorises:
• Absolute ratios analysis
• Proportion ratios analysis
• Differential ratios analysis
• Cash flow analysis
• System of ratios analysis (12)

22
Higher Methods
Higher methods of financial analysis are based on more complicated mathematic
procedures and cogitation. The division is following:
1. Mathematic-statistic methods
• Punctual estimation
• Statistic tests
• Empiric distribution function
• Colleration coefficients
• Regression simulation
2. Non-statistic methods
• Expert systems
• Fuzzy sets
• Methods based on uncertain data theory (12)
2.1.2 Sources of Financial Analysis
The main source to set financial analysis are basic financial statements. The balance
sheet, the income statement and the cash flow statement contain basic information about
analysed company and its activities, they record move of company’s finances in every
form and phase of company’s activity. It is necessary that statement truly reflects the
real situation of the company.
The Balance Sheet
The balance sheet, prepared on the specific date, records the categories and amounts of
assets employed by the company and the offsetting liabilities incurred to lenders and
owners. The recorded value of the total assets invested in the business at any point in
time must be matched precisely with the recorded liabilities and owners’ equity
supporting these assets.
The Income Statement
The income statement reflects the effect of management’s operating decision on
business performance and the resulting accounting profit or loss for the owners of the
company over a specified period of time. The profit or loss calculated in the statement

23
increases or decreases owner’s equity. The income statement displays the revenues
recognized for a specific period, and the costs and expenses charged against these
revenues.
The Cash Flow Statement
The cash flow statement is the statement that captures both the current operating results
and the accompanying changes in the balance sheet. It gives a dynamic picture of the
changes in cash which resulting from the decisions made during a given period. The
user can judge the magnitude and relationships of these cash movements. (6)
2.1.3 Users of Financial Analysis
Information considering financial health of company and its management are object of
interest for many subjects that are in connection with the company.
Figure 8 is an overall summary of the users of statement analysis, their primary goals,
and the underlying objectives they are seeking to accomplish in order to meet those
goals.
Figure 8 Users of Financial Statements Analysis Source: Tempte, p. 75
There is another group of users who wants to know about financial situation of
company. They are in external position to company, but their decision is addicted to
knowledge about financial health of company. They are called as external group of
users and among them especially belong: suppliers, buyers, competitors and state. (13)
User of Financial Statement Analysis
Primary Goal
Objectives
Equity investors
Valuation
Profitability Risk analysis Growth analysis
Creditors
Ability to repay debt
Liquidity Solvency
Management
Efficiency
Profitability Solvency Operating performance
24
2.1.4 Financial Ratios
Financial analysis is a methodology used to provide relevant information for decision-
making. The main source of this information is published financial statements. Various
accounts from statements are evaluated in relation to each other to form performance
indicators. These financial indicators are known as financial ratios and are compared to
established standards from the firm or other firms from the industry. Financial ratios are
more convenient to interpret than financial statement accounts because financial ratios
represent “relationships” between various items from financial statements. (11)
Ratios constitute the main tools of conventional financial analysis and some of them are
particularly relevant to the prediction of economic events. Financial ratios provide a
valuable tool, which measures the progress against internal goals that were
predetermined, against a certain competitor, or against the overall industry. In addition,
tracking various ratios over time is a powerful way how to identify trends as they
develop. The calculation of business ratios is straightforward, but the value of them lies
in their interpretation. (5)
Next subchapter defines following ratios:
• Absolute Ratios
- Horizontal and vertical analysis
• Proportion Ratios
- Profitability, efficiency,
- Liquidity, solvency
• Differential Ratios
- Net working capital
- Net quick assets
- Net cash assets
• Cash flow analysis
• System of Ratios
- Altman Z-Score
- Index IN05
- Quick test
25
2.2 Absolute Ratios
Absolute ratios analysis includes horizontal and vertical analysis. Absolute ratios come
directly from company’s financial statements. Analysed data are compared with data
from previous accounting year.
2.2.1 Horizontal Analysis
Horizontal analysis is also known as comparative analysis. This analysis is conducted
by setting consecutive balance sheet, income statement or statement of cash flow side-
by-side. Then changes are review in individual categories on a year-to-year or multiyear
basis.
The most important item revealed by comparative financial statement analysis is trend.
Direction, speed and extent of a trend are revealed thanks to a comparison of statements
over several years. The horizontal financial statements analysis is done by a new
formulation amount of each item as a percentage. Such percentages are calculated by
selecting a base year and assign a weight of 100 to the amount of each item in the base
year statement. Thereafter, the amounts of similar items or groups of items in prior or
subsequent financial statements are expressed as a percentage of the base year amount.
The resulting figures are called index numbers or trend ratios. (3)
2.2.2 Vertical Analysis
Vertical analysis is a method of financial statement analysis in which each entry for
each of the three major categories of accounts (assets, liabilities and equities) in a
balance sheet is represented as a proportion of the total account. The main advantage is
that the balance sheets of businesses of all sizes can be easily compared. Easier is also
to see relative annual changes in one business. Vertical analysis contrasts with
horizontal analysis, which uses one year's worth of entries as a baseline while every
other year represents differences in terms of changes to that baseline.
An analyst can compare the percentage mark-up of asset items and how they have been
financed. The strategies may include increase or decrease the holding of certain assets.
The analyst may observe the trend of the assets and liabilities over several years as
well. (3)
26
2.3 Proportion Ratios
2.3.1 Profitability Ratios
Profitability ratios are the financial statement ratios, which focus on how well a
business is performing in terms of profit. The profitability ratios portray the ability of
the firm to efficiently use the capital committed by stockholders and lenders to generate
revenues in excess of expenses. These ratios are consequently of interest to both
stockholders and bondholders. However, it is important to note that many factors can
influence these ratios, including changes in price, volume, or expenses, as well the
purchase of assets or the borrowing of money. (11)
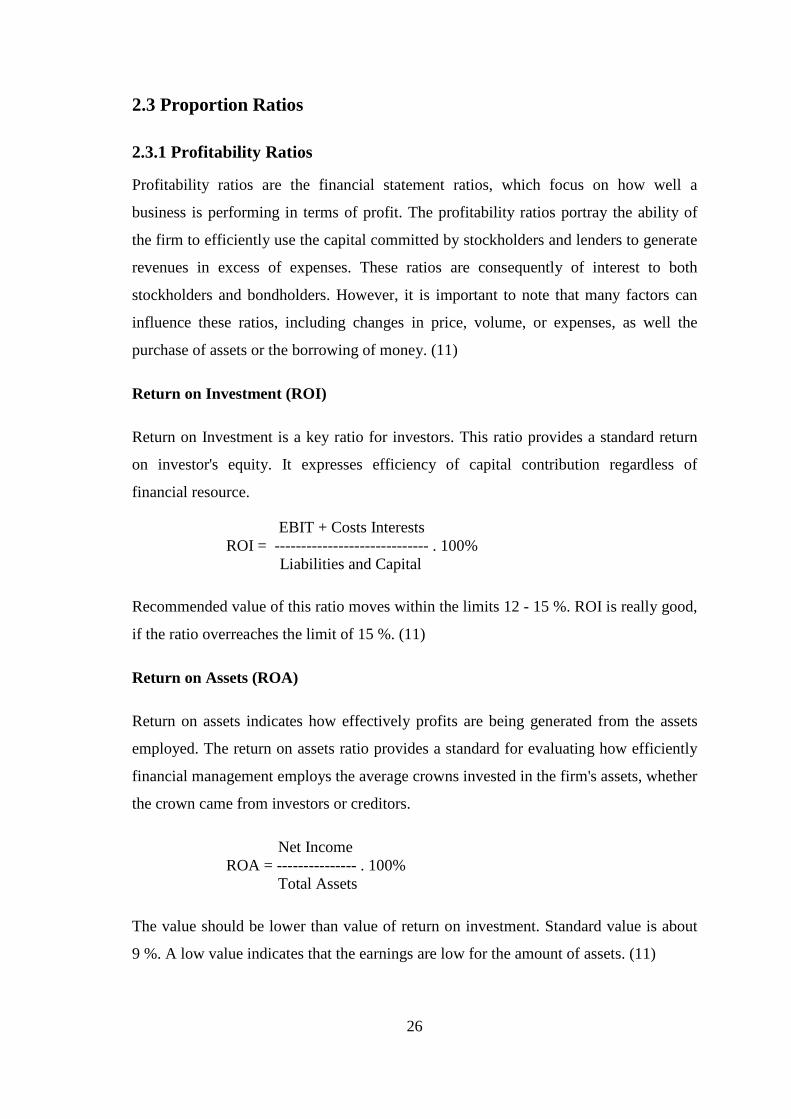
Return on Investment (ROI)
Return on Investment is a key ratio for investors. This ratio provides a standard return
on investor's equity. It expresses efficiency of capital contribution regardless of
financial resource.
EBIT + Costs Interests ROI = ----------------------------- . 100% Liabilities and Capital
Recommended value of this ratio moves within the limits 12 - 15 %. ROI is really good,
if the ratio overreaches the limit of 15 %. (11)
Return on Assets (ROA)
Return on assets indicates how effectively profits are being generated from the assets
employed. The return on assets ratio provides a standard for evaluating how efficiently
financial management employs the average crowns invested in the firm's assets, whether
the crown came from investors or creditors.
Net Income ROA = --------------- . 100% Total Assets
The value should be lower than value of return on investment. Standard value is about
9 %. A low value indicates that the earnings are low for the amount of assets. (11)

27
Return on Equity (ROE) Another common measure of profitability is the return on owners’ equity (ROE), which
is the ratio of net income to owners’ equity. The owners find out if their capital brings
sufficient yield. (13)
Net Income ROE = ------------------ . 100% Owners' Equity
The standard value of this ratio is 10 %. and at the same time ROE should be higher
than ROA (ROE > ROA).
Return on Sales (ROS)
Return on sales is a company’s operating profit or loss expresses as a percentage of total
sales for a given period, typically a year.
Net Income ROS = -------------- . 100% Sales
This ratio has its limits, since it sheds no light on the overall cost of sales or the four
factors that contribute to it: materials, labour, production overheads, and administrative
and selling overheads. Although ROS is another tool used to analyse profitability, it is
perhaps a better indicator of efficiency. (13)
2.3.2 Efficiency Ratios
Efficiency ratios measure how effectively a business uses and controls its assets. They
are intended to convey various aspects of operational efficiency. If a company has more
assets than it is necessary, needless costs and lower profit is creating. On the other side,
if the company has a lack of assets, business opportunities and yields are loosing. These
ratios show how quickly the company is collecting money for its credit sales or how
many times inventory turns over in a given time period. This information helps
management decide whether the company’s credit terms are appropriate and whether its
purchasing efforts are handled in an efficient manner. (11)
28
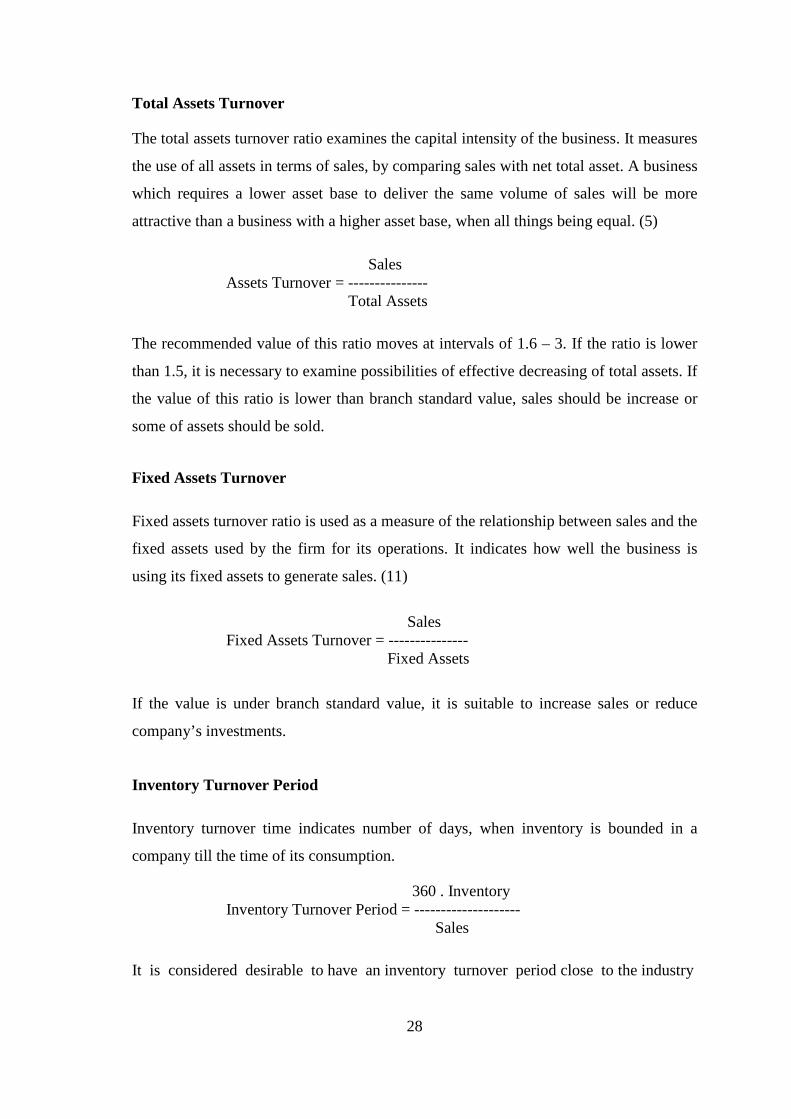
Total Assets Turnover
The total assets turnover ratio examines the capital intensity of the business. It measures
the use of all assets in terms of sales, by comparing sales with net total asset. A business
which requires a lower asset base to deliver the same volume of sales will be more
attractive than a business with a higher asset base, when all things being equal. (5)
Sales Assets Turnover = --------------- Total Assets
The recommended value of this ratio moves at intervals of 1.6 – 3. If the ratio is lower
than 1.5, it is necessary to examine possibilities of effective decreasing of total assets. If
the value of this ratio is lower than branch standard value, sales should be increase or
some of assets should be sold.
Fixed Assets Turnover
Fixed assets turnover ratio is used as a measure of the relationship between sales and the
fixed assets used by the firm for its operations. It indicates how well the business is
using its fixed assets to generate sales. (11)
Sales
Fixed Assets Turnover = --------------- Fixed Assets
If the value is under branch standard value, it is suitable to increase sales or reduce
company’s investments.
Inventory Turnover Period
Inventory turnover time indicates number of days, when inventory is bounded in a
company till the time of its consumption.
360 . Inventory Inventory Turnover Period = --------------------
Sales
It is considered desirable to have an inventory turnover period close to the industry

29
norm. A turnover period that is too high might mean that too much capital is tied up in
inventory and it could mean that the inventory is obsolete. A processing period that is
too low might indicate that the company has inadequate stock on hand, which could
adversely impact sales. (14)
Receivables Turnover Period
Receivables turnover period is the average number of days it takes for the company’s
customers to pay their bills. It measures how quickly credit sales are collected. It is an
indicator of the efficiency in the collection efforts of accounts receivable. (11)
360 . Receivables Receivables Turnover Period = ---------------------
Sales
Recommended period of receivables turnover is 36 days. A steady or declining average
collection period is attractive because this indicates that the firm’s collection efforts are
not worsening. It is usually desirable to have a receivables turnover period close to the
industry standard. A period that is too high might mean that customers are too slow in
paying their bills, which means too much capital is tied up in assets. On the contrary,
when this period is too low, it might indicate that the company’s credit policy is too
strict, which could hamper sales. (13)
Payables Turnover Period
Payables turnover period is the average amount of time it takes the company to pay its
bills.
360 . Payables Payables Turnover Period = ----------------- Sales
If a company has a below-average industry period it may be able to slow payments and
improve its cash conversion rate and working capital requirements. If a company is
above the industry average it may indicate liquidity problems for the firm. Payables
turnover period should be longer than receivables turnover period. (13)

30
2.3.3 Liquidity Ratios
Liquidity ratios are used to assess the ability of the company to pay its current
obligations. They relate to the availability of cash and other assets to cover accounts
payable, short-term debt, and other liabilities. All small businesses require a certain
degree of liquidity in order to pay their bills on time. Start-up and very young
companies are often not very liquid. If liquidity in mature companies is low, it can
indicate poor management or a need for additional capital. Liquidity may vary due to
seasonality, the timing of sales, and the state of the economy. Liquidity ratios are of
prime interest to short-term lenders and help small business owners with useful limits
regulate borrowing and spending. (11)
Current Ratio
The current ratio examines the ability of the business to meet short-term debts. It is
difficult to provide guidance on what the appropriate level for the current ratio should
be in any one industry. Current assets are composed mainly of cash, short-term
marketable securities, accounts receivable, inventories, and prepaid expenses. Current
liabilities are composed mainly of accounts payable, dividends, taxes payable, and
short-term bank loans. (11)
Current Assets Current Ratio = -------------------------------------------------
Current Liabilities + Current Bank Loans
The generally acceptable current ratio lies between 1.5 – 2.5. If the ratio is less than 1 it
means that the company’s liquidity is low and the company may not be able to pay its
bills on time. Anything above 2.5 would be regarded as robust and it means that the
company has money in cash or safe investments that could be put to better use in the
business.
High current ratios are needed for companies that have difficulty borrowing on short-
term notice. The best benchmarks will come from other businesses within the sector. (4)
31
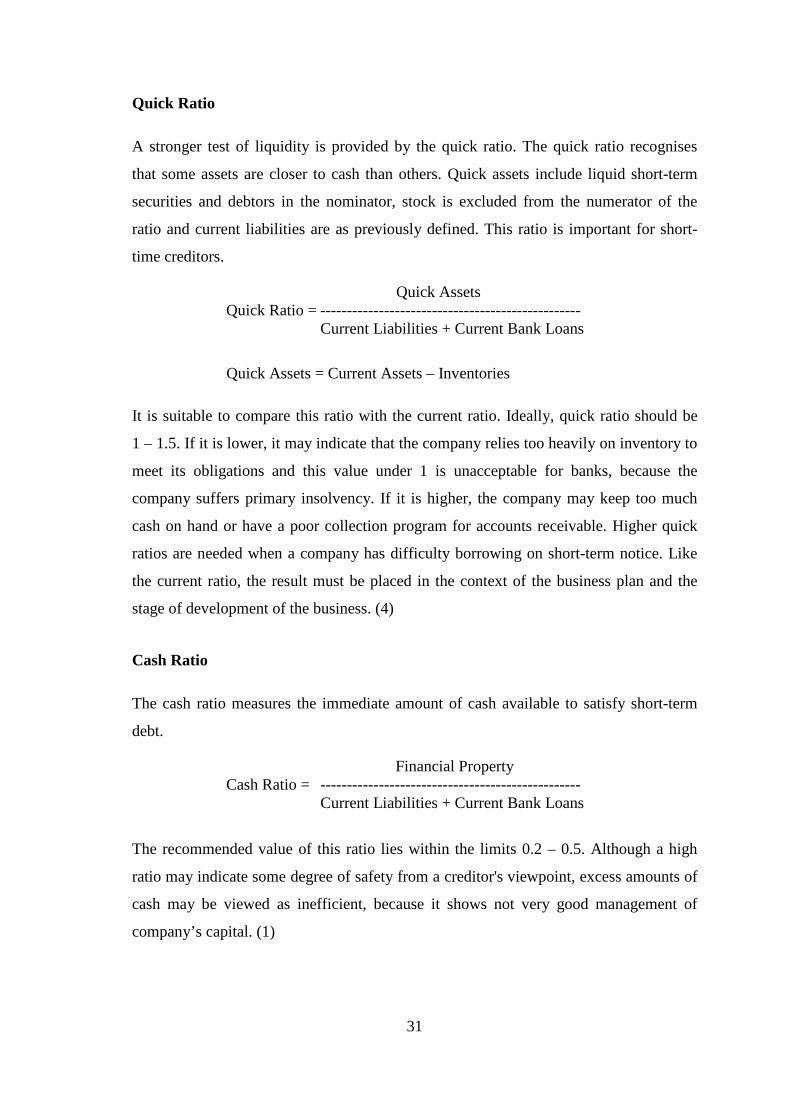
Quick Ratio
A stronger test of liquidity is provided by the quick ratio. The quick ratio recognises
that some assets are closer to cash than others. Quick assets include liquid short-term
securities and debtors in the nominator, stock is excluded from the numerator of the
ratio and current liabilities are as previously defined. This ratio is important for short-
time creditors.
Quick Assets Quick Ratio = ------------------------------------------------- Current Liabilities + Current Bank Loans
Quick Assets = Current Assets – Inventories
It is suitable to compare this ratio with the current ratio. Ideally, quick ratio should be
1 – 1.5. If it is lower, it may indicate that the company relies too heavily on inventory to
meet its obligations and this value under 1 is unacceptable for banks, because the
company suffers primary insolvency. If it is higher, the company may keep too much
cash on hand or have a poor collection program for accounts receivable. Higher quick
ratios are needed when a company has difficulty borrowing on short-term notice. Like
the current ratio, the result must be placed in the context of the business plan and the
stage of development of the business. (4)
Cash Ratio
The cash ratio measures the immediate amount of cash available to satisfy short-term
debt.
Financial Property Cash Ratio = ------------------------------------------------- Current Liabilities + Current Bank Loans
The recommended value of this ratio lies within the limits 0.2 – 0.5. Although a high
ratio may indicate some degree of safety from a creditor's viewpoint, excess amounts of
cash may be viewed as inefficient, because it shows not very good management of
company’s capital. (1)

32
2.3.4 Solvency Ratios
Solvency ratios are measures to assess a company’s ability to meet its long-term
obligations and thereby remain solvent and avoid bankruptcy. They also tell investors
how the company has been financed (debt or equity) and whether that is changing over
time. The term insolvency means that company to finance its assets uses liabilities. The
main motive of financing its activities by liabilities is relatively lower price in
comparison with owners’ equity. These ratios measure the extent the company is
financed by liabilities. By looking at these ratios, it helps to assess company’s level of
debt and decide whether this level is appropriate. (2)
Debt Ratio
The debt ratio compares a company’s total debt to its total assets. It gives a general idea
to the amount of leverage being used by a company. A low percentage means that the
company is less dependent on leverage, i.e., money borrowed from and/or owed to
others. The lower the percentage, the less leverage a company is using and the stronger
its equity position.
Total Liabilities Debt Ratio = -------------------- . 100%
Total Assets
In general, the higher the ratio, the more risk that company is considered to have taken
on. But the higher ratio does not have to be valuated in negative way, relationship
concerns with the price of liabilities and owners’ equity. Creditors prefer low value;
owners need higher leverage to multiply their profits. The recommended value of thr
ratio moves from 30 – 70 %.
Division of the debt ratio:
0.3……….low
0.3 – 0.5…average
0.5 – 0.7…high
0.7……….risky

33
Self-Financing Ratio
The self-financing ratio expresses a extent of insolvency of owners’ equity. The ratio is
a supplement to the debt ratio and the sum of these ratios has to be equal to 1. Both
ratios inform about financial structure of company.
Owners’ Equity Self-Financing Ratio = ---------------------. 100%
Total Assets
The recommended value of this ratio should be higher than 0.5. The minimum is 0.3.
Interest Coverage
This ratio measures company’s ability to pay its interest charges. It says, how many
times profit surpasses interest expenses. Debt providers will often look at interest cover
in conjunction with gearing ratios. (2)
EBIT Interest Coverage = ---------------------
Interest Expenses
If the ratio was equal to 1, it would mean that the company is capable to pay interests,
even though has no profit. Bank standards recommend having value of this ratio 3. But
values from 6 to 8 mean financial healthy company as well.
Long – Term and Current Insolvency
Long – term insolvency expresses, which part of assets is financed by long – term debts.
It helps to find optimal proportion of long and short – term borrowed capital. Current
insolvency compares short – term capital to total assets. (2)
Borrowed Capital Long – Term Insolvency = ------------------------
Total Assets
Short –Term Capital Current Insolvency = ------------------------
Total Assets
34
2.4 Differential Ratios
To do an analysis of company’s financial situation, the differential ratios are used as
well. They are called as funds of financial resources. The most used are ratios of net
working capital, net quick assets and net cash assets. These differential ratios come
from presumption, that part of current assets of company is financed by long-term total
assets. (8)
2.4.1 Net Working Capital
Net working capital is the most used ratio of differential ratios. It presents a part of
current assets that are covered by long-term sources. Thanks to its long-term is net
working capital used for eventual financial ups downs.
Net working capital is possible to calculate according following formulas, where the
first one is considering as an investor approach and the second one is a managerial
approach:
Net Working Capital = Long Term Capital – Long Term Assets
Or
Net Working Capital = Current Assets – Short-Term Liabilities
The difference between assets and short-term liabilities influences among others
solvency of company. The positive value of net working capital means that company
has a good financial background and it is liquid. The higher value of net working
capital, the higher ability of company to pay its liabilities. On the contrary the negative
value of net working capital means so-called unfounded debt. To increase net working
capital it is necessary to increase current assets or decrease short-term liabilities of
company. (8)
The disadvantage of calculation of net working capital is possible elements included in
current assets, for example unenforceable or hard unenforceable credits, unsaleable
reserves of finished products and also too high reserves. The ratio of net working capital
is influenced by method of appreciation as well. (12)

35
2.4.2 Net Quick Assets
The second ratio from differential ratios is net quick assets ratio. It is used to monitor
immediate liquidity because it presents the difference between available cash and short-
term liability fallen due.
Net Quick Assets = Available Cash – Liability Fallen Due
To calculate the highest level of liquidity, we have to include only cash and money on
bank accounts into available cash. Immediate liabilities fallen due are liabilities payable
to current date or older. The net quick assets ratio is not influenced by any method of
appreciation, but it is easily influenced by move of payments (retention or earlier
realization of payments).
2.4.3 Net Cash Assets
The net cash assets ratio or the net cash-receivables financial funds ratio presents a
compromise between net working capital ratio and net quick assets ratio. To calculate
the net cash assets ratio it is necessary to cut out less liquid items (i.e. stock, non-liquid
receivables).
Net Cash Assets = (Current Assets – Stock) – Short-Term Liabilities
2.5 Cash Flow Analysis
Cash flow presents the real movement of company’s cash. It is a real flow of money
(inflow and outflow of money) within certain period. The cash flow statement informs
about result of increasing or decreasing of money to a certain date.
Cash flow analysis is an important tool for managing liquidity, because it is necessary to
consider the fact, that there is a time disharmony between costs and expenses and
between yields and incomes. Incomes from operation and economic processes are
recorded at the moment of realization of payments in accounting. There is a difference
between movement of tangible items and their financial formulation (i.e. purchase
goods on business credit).

36
Cash flow statement is possible to set on basis of balance sheet and income statement.
They are divided into three categories:
• Operational cash flow
• Investment cash flow
• Financial cash flow
Cash increases when debts and owners’ equity increases (borrowing from creditors) or
when assets decrease (sale of fixed or current assets). Otherwise cash decreases when
debts decrease (payments of credit) or when assets increase (purchase of fixed or
current assets). The purpose of cash flow statement is to give information about
company’s ability to create cash and information about using cash as well.
There are two approaches leading to calculate cash flow:
• Direct method
• Indirect method
Direct Method
The direct method is called method based on monitoring real incomes and expenses.
This method comes directly from changes of cash, which are caused by economic
transactions. The disadvantage of this method is a fact that there are no accounts for
incomes and expenses in accounting. To find out incomes and expenses is then
problematic.
Indirect Method
The indirect method is mostly used in practise. It comes from income statement, rather
from income from operations, which is consequently transformed into cash. The indirect
method reposes upon profit removal of non-cash items and of balance changes that are
the difference between flows of incomes and expenses and between yields and costs.
There are well-arranged differences between profit and cash flow. (12)

37
2.6 System of Ratios
There are many proportion or other ratios to do a financial analysis of situation in a
company. But their disadvantage leans on giving information only about certain area of
company’s activities. That is why system of ratios is used to do an overall financial
analysis.
System of ratios are divided into:
• Hierarchal arranged system of ratios
o Pyramidal analysis
• General evaluation models of financial situation
o Models of value
o Models of bankruptcy
2.6.1 Pyramidal Analysis
Pyramidal analysis serves to identify logical and economical connection among ratios
and their resolution. The keynote of pyramidal analysis is gradual resolution of the peak
ratio to partial ratios, which serve to identification and to quantification of influence of
partial ratios to the peak ratio (i.e. Dupont’s resolution of ROE). (12)
2.6.2 Altman Z-Score
The Altman Z-Score belongs to the group of bankruptcy model. It is a quantitative
balance-sheet method of determining a company’s financial health. The Altman Z-Score
is a measure of a company’s health and likelihood of bankruptcy. Several key ratios are
used in the formulation of an Altman Z-Score Value. New version of formula from
1983 is usable in Czech condition as well.
Altman’s model comes from five ratios, which are measured and put together into one
ratio. The model completes the financial analysis of company’s situation. The formula
is following:
Z = 0.717 x1+ 0.847 x2 + 3.107 x3 + 0.42 x4 + 0.998 x5

38
where:
Working Capital Current Assets - Current Liabilities x1 = -------------------- = ------------------------------------------ Total Assets Total Assets
Retained Earnings x2 = ---------------------- Total Assets Earnings Before Interest and Taxes x3 = ------------------------------------------ Total Assets Book Value of Equity x4 = -------------------------- Total Liabilities
Sales x5 = -------------- Total Assets
Zones of Discrimination:
Z > 2.9.............“Safe” Zone: The company is safe, based on these financial figures.
1.2 < Z < 2.9...“Grey” Zone: This zone is an area where one should exercise caution.
Z < 1.2............“Distress” Zone: Probability of financial embarrassment is very high.
2.6.3 Index IN05
On the same principle as Altman’s Z-score is founded index IN05 as well. Altman’s
model was used broadly after 1990 and was often criticised for unsuitability for Czech
conditions. That is why Neumaier couple begun to develop IN models. Index IN05 has
from the time point of view the lowest limitations and it is at the good level. This index
is called trustworthiness of Czech enterprise as well. Index IN05 includes profitability,
liquidity, activity and solvency ratios.
IN05 = 0.13 x1 + 0.04 x2 + 3.97 x3 + 0.21 x4 + 0.09 x5
39
where:
Total Assets
x1 = -------------- Total Liabilities Earnings Before Interest and Taxes x2 = ------------------------------------------- Interest Expense Earnings Before Interest and Taxes x3 = ------------------------------------------- Total Assets Earnings x4 = --------------- Total Assets Current Assets x5 = ----------------------------------------------------- Current Liabilities + Short-Term Bank Loan
Zones of Discrimination:
IN05 > 1.6 ................ The company makes a value.
0.9 < IN05 ≤ 1.6........ “Grey zone” of nondescript outcomes.
IN05 ≤ 0.9 ................ The company is going to a bankruptcy.
2.6.4 Quick Test
Quick test enables to analyse the company very fast and exactly. To make this test well-
balanced, four proportion indicators were used (profitability, liquidity, capital power
and insolvency).
Owners’ Equity Self-Financing Coeficient = ------------------- Total Assets Current Liabilities + Long-Term Liabilities – Financial Property Cash-Flow Pay-off = ----------------------------------------------------------------------------- Running Cash Flow

40
Self-financing coeficient shows how the company is able to cover its needs by own
sources. Cash-flow pay-off ratio informs about the time needed to pay its liabilities.
These two ratios characterise the financial stability of the company. The following two
ratios analyse yield situation of the company.
Running Cash Flow Cash Flow in Percent from Sales = ----------------------------
Sales
EBIT Return on Assets (ROA) = ---------------
Total Assets
Each ratio has its degree scale. According to these scales, evaluations on basis of
arithmetical average for the area of financial stability and performance are counted and
consenquently evaluation of the whole company is done.
Ratio Excellent (1)
Very Good (2)
Good (3)
Bad (4)
Threatened by Insolvency (5)
Self-Financing Ratio > 30% > 20% > 10% > 0% Negative CF Pay-off < 3 years < 5 years < 12 years > 12 years > 30 years CF in % from Sales > 10% > 8% > 5% > 0% Negative ROA > 15% >12% >8% > 0% Negative
Figure 9 Ratio Degree Scale Source: Own processing

41
3 ANALYSIS OF PROBLEM AND CURRENT SITUATION
In the chapter three there is the complex financial analysis of company’s situation done.
All ratios introduced in previous chapter are calculated. Financial statements from the
period 2004-2008 are used.
3.1 Absolute Ratio Analysis
As mentioned in theoretical part, absolute ratio analysis comes directly from data
contained in financial statements – the balance sheet and income statement.
The balance sheet shows state of assets and liabilities on the certain date, mostly on the
last day of calendar year. The balance sheet records assets of company – what company
owns and claims on one side and liabilities on the second side. Liabilities show how are
the assets financed.
While the balance sheet is the statement on the certain date, the income statement shows
a flow of money for a certain period. The income statement gives an overview of costs
and yields of company. The difference between yields and costs is the profit or the loss.
It is possible to examine if the company asserts so-called balance rules in its activity.
These rules are recommendations that the management should follow with the aim to
reach long-term balance and stability in financial field (7):
• The gold rule of financing – it is suitable to harmonise time duration of
property parts with time duration of financial sources. Fixed assets are financed
by owners’equity or long-term liabilities.
• The gold rule of risk equilibration – own sources should be higher than
foreign liabilities or should be equal at least.
• The gold pari rule – fixed assets and own sources are equal only occasionally
considering that company uses foreign sources as well.
• The gold proportion rule – the rate of investments increasing neither should be
higher than the rate of sales growing, neither during the short-time period.
42
3.1.1 Horizontal Analysis
Horizontal Analysis of Balance Sheet
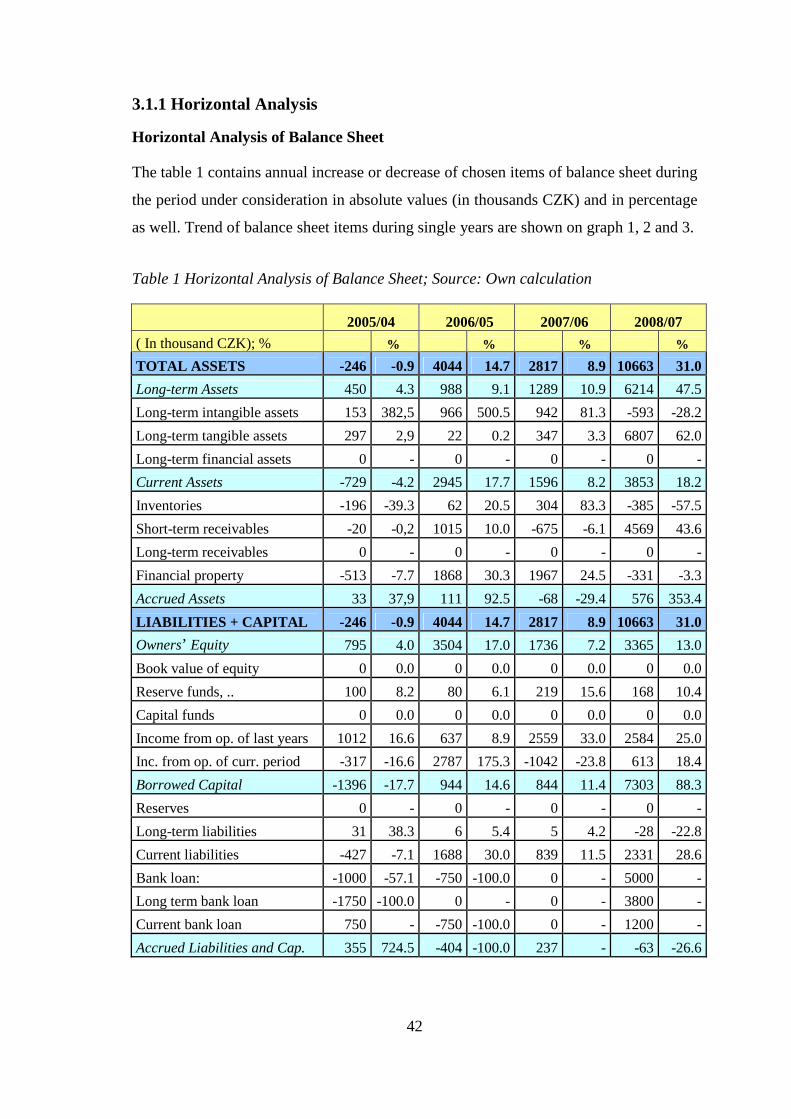
The table 1 contains annual increase or decrease of chosen items of balance sheet during
the period under consideration in absolute values (in thousands CZK) and in percentage
as well. Trend of balance sheet items during single years are shown on graph 1, 2 and 3.
Table 1 Horizontal Analysis of Balance Sheet; Source: Own calculation
2005/04 2006/05 2007/06 2008/07
( In thousand CZK); % % % % %
TOTAL ASSETS -246 -0.9 4044 14.7 2817 8.9 10663 31.0
Long-term Assets 450 4.3 988 9.1 1289 10.9 6214 47.5
Long-term intangible assets 153 382,5 966 500.5 942 81.3 -593 -28.2
Long-term tangible assets 297 2,9 22 0.2 347 3.3 6807 62.0
Long-term financial assets 0 - 0 - 0 - 0 -
Current Assets -729 -4.2 2945 17.7 1596 8.2 3853 18.2
Inventories -196 -39.3 62 20.5 304 83.3 -385 -57.5
Short-term receivables -20 -0,2 1015 10.0 -675 -6.1 4569 43.6
Long-term receivables 0 - 0 - 0 - 0 -
Financial property -513 -7.7 1868 30.3 1967 24.5 -331 -3.3
Accrued Assets 33 37,9 111 92.5 -68 -29.4 576 353.4
LIABILITIES + CAPITAL -246 -0.9 4044 14.7 2817 8.9 10663 31.0
Owners’ Equity 795 4.0 3504 17.0 1736 7.2 3365 13.0
Book value of equity 0 0.0 0 0.0 0 0.0 0 0.0
Reserve funds, .. 100 8.2 80 6.1 219 15.6 168 10.4
Capital funds 0 0.0 0 0.0 0 0.0 0 0.0
Income from op. of last years 1012 16.6 637 8.9 2559 33.0 2584 25.0
Inc. from op. of curr. period -317 -16.6 2787 175.3 -1042 -23.8 613 18.4
Borrowed Capital -1396 -17.7 944 14.6 844 11.4 7303 88.3
Reserves 0 - 0 - 0 - 0 -
Long-term liabilities 31 38.3 6 5.4 5 4.2 -28 -22.8
Current liabilities -427 -7.1 1688 30.0 839 11.5 2331 28.6
Bank loan: -1000 -57.1 -750 -100.0 0 - 5000 -
Long term bank loan -1750 -100.0 0 - 0 - 3800 -
Current bank loan 750 - -750 -100.0 0 - 1200 -
Accrued Liabilities and Cap. 355 724.5 -404 -100.0 237 - -63 -26.6
43
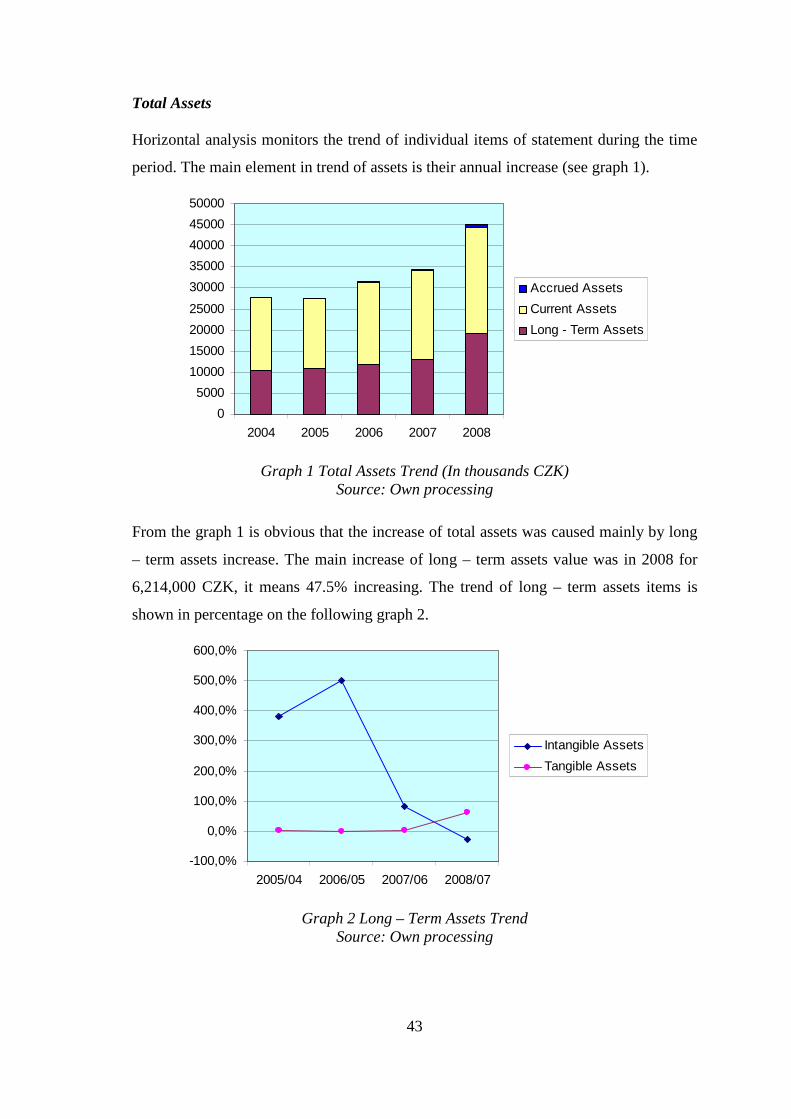
Total Assets
Horizontal analysis monitors the trend of individual items of statement during the time
period. The main element in trend of assets is their annual increase (see graph 1).
0
5000
10000
15000
20000
25000
30000
35000
40000
45000
50000
2004 2005 2006 2007 2008
Accrued Assets
Current Assets
Long - Term Assets
Graph 1 Total Assets Trend (In thousands CZK) Source: Own processing
From the graph 1 is obvious that the increase of total assets was caused mainly by long
– term assets increase. The main increase of long – term assets value was in 2008 for
6,214,000 CZK, it means 47.5% increasing. The trend of long – term assets items is
shown in percentage on the following graph 2.
-100,0%
0,0%
100,0%
200,0%
300,0%
400,0%
500,0%
600,0%
2005/04 2006/05 2007/06 2008/07
Intangible Assets
Tangible Assets
Graph 2 Long – Term Assets Trend Source: Own processing
44
Long – term assets are divided into long – term intangible, tangible and financial
assets. There was no long – term financial assets. Long – term intangible assets were
increasing during the period 2004 – 2006 and then were gradually decreasing. In 2007
new information system HIFIS and economic program POHODA were implemented.
Long – term tangible assets were approximately constant till 2008 when the
construction of new building in Brno began. The value of unfinished long – term
tangible assets increased from 258,000 CZK in 2007 to 7,191,000 CZK in 2008.
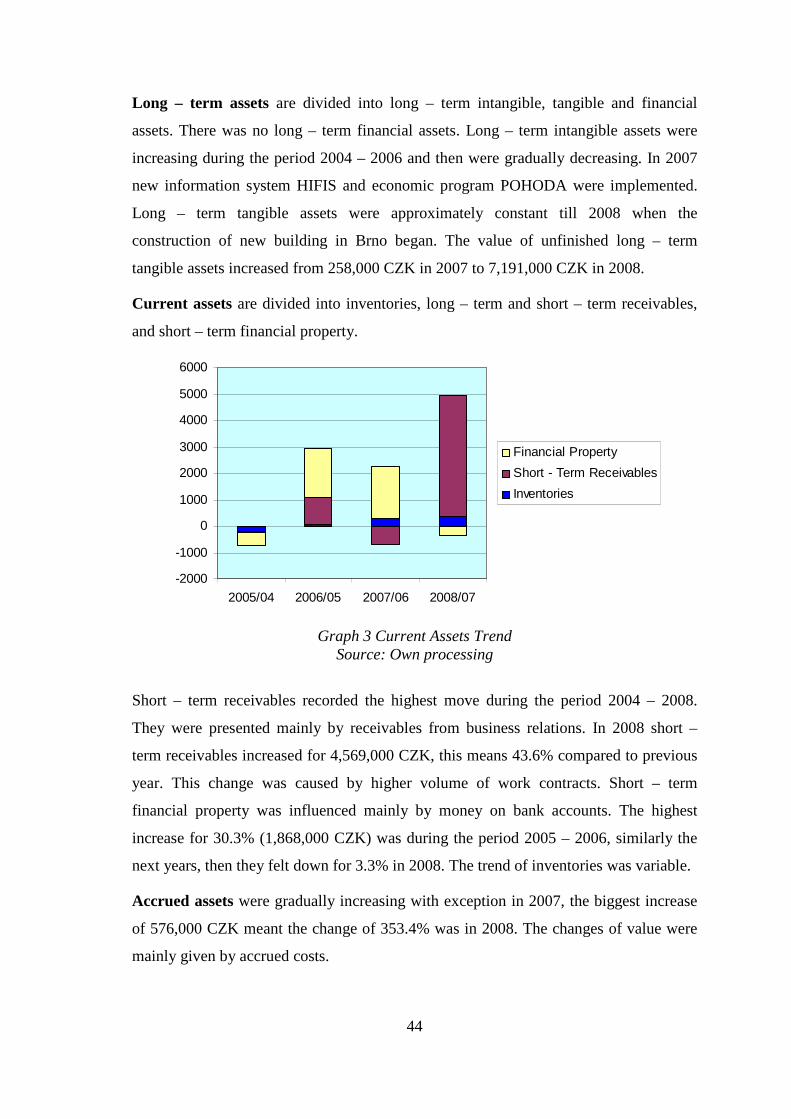
Current assets are divided into inventories, long – term and short – term receivables,
and short – term financial property.
-2000
-1000
0
1000
2000
3000
4000
5000
6000
2005/04 2006/05 2007/06 2008/07
Financial Property
Short - Term Receivables
Inventories
Graph 3 Current Assets Trend Source: Own processing
Short – term receivables recorded the highest move during the period 2004 – 2008.
They were presented mainly by receivables from business relations. In 2008 short –
term receivables increased for 4,569,000 CZK, this means 43.6% compared to previous
year. This change was caused by higher volume of work contracts. Short – term
financial property was influenced mainly by money on bank accounts. The highest
increase for 30.3% (1,868,000 CZK) was during the period 2005 – 2006, similarly the
next years, then they felt down for 3.3% in 2008. The trend of inventories was variable.
Accrued assets were gradually increasing with exception in 2007, the biggest increase
of 576,000 CZK meant the change of 353.4% was in 2008. The changes of value were
mainly given by accrued costs.
45
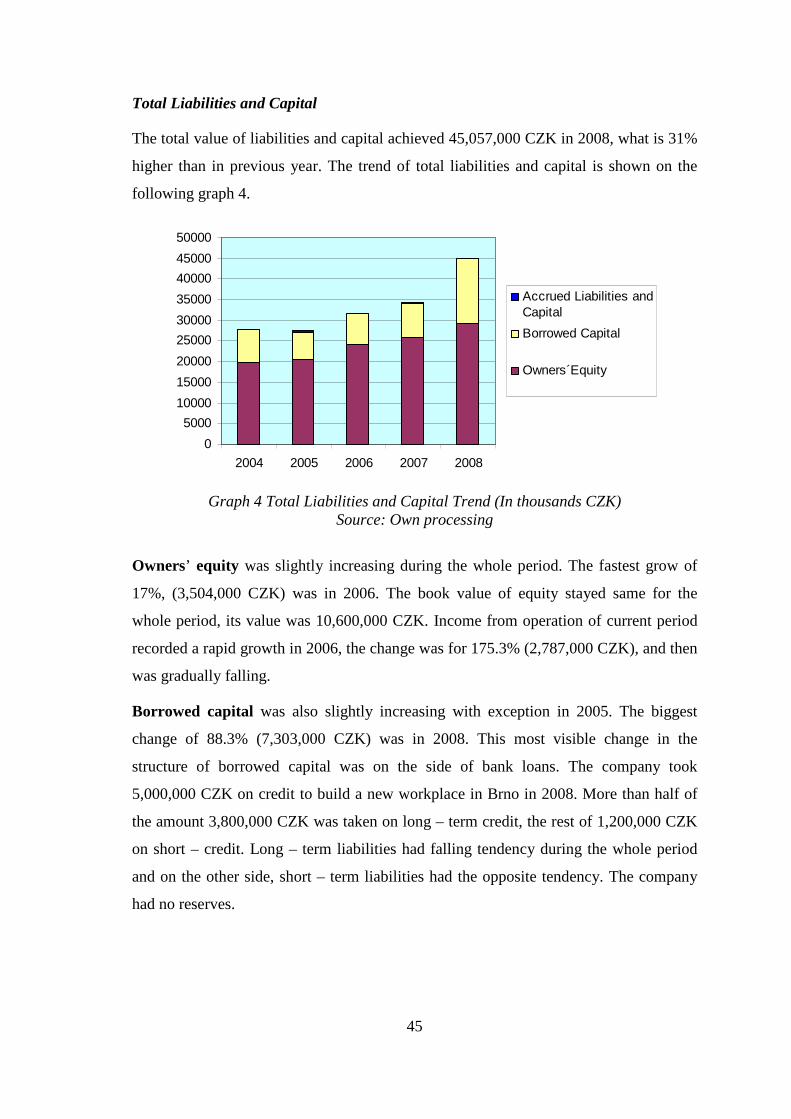
Total Liabilities and Capital
The total value of liabilities and capital achieved 45,057,000 CZK in 2008, what is 31%
higher than in previous year. The trend of total liabilities and capital is shown on the
following graph 4.
0
5000
10000
15000
20000
25000
30000
35000
40000
45000
50000
2004 2005 2006 2007 2008
Accrued Liabilities andCapital
Borrowed Capital
Owners´Equity
Graph 4 Total Liabilities and Capital Trend (In thousands CZK) Source: Own processing
Owners’ equity was slightly increasing during the whole period. The fastest grow of
17%, (3,504,000 CZK) was in 2006. The book value of equity stayed same for the
whole period, its value was 10,600,000 CZK. Income from operation of current period
recorded a rapid growth in 2006, the change was for 175.3% (2,787,000 CZK), and then
was gradually falling.
Borrowed capital was also slightly increasing with exception in 2005. The biggest
change of 88.3% (7,303,000 CZK) was in 2008. This most visible change in the
structure of borrowed capital was on the side of bank loans. The company took
5,000,000 CZK on credit to build a new workplace in Brno in 2008. More than half of
the amount 3,800,000 CZK was taken on long – term credit, the rest of 1,200,000 CZK
on short – credit. Long – term liabilities had falling tendency during the whole period
and on the other side, short – term liabilities had the opposite tendency. The company
had no reserves.
46
0
2000
4000
6000
8000
10000
12000
14000
16000
18000
2004 2005 2006 2007 2008
Bank Loan
Current Liabilities
Long - Term Liabilities
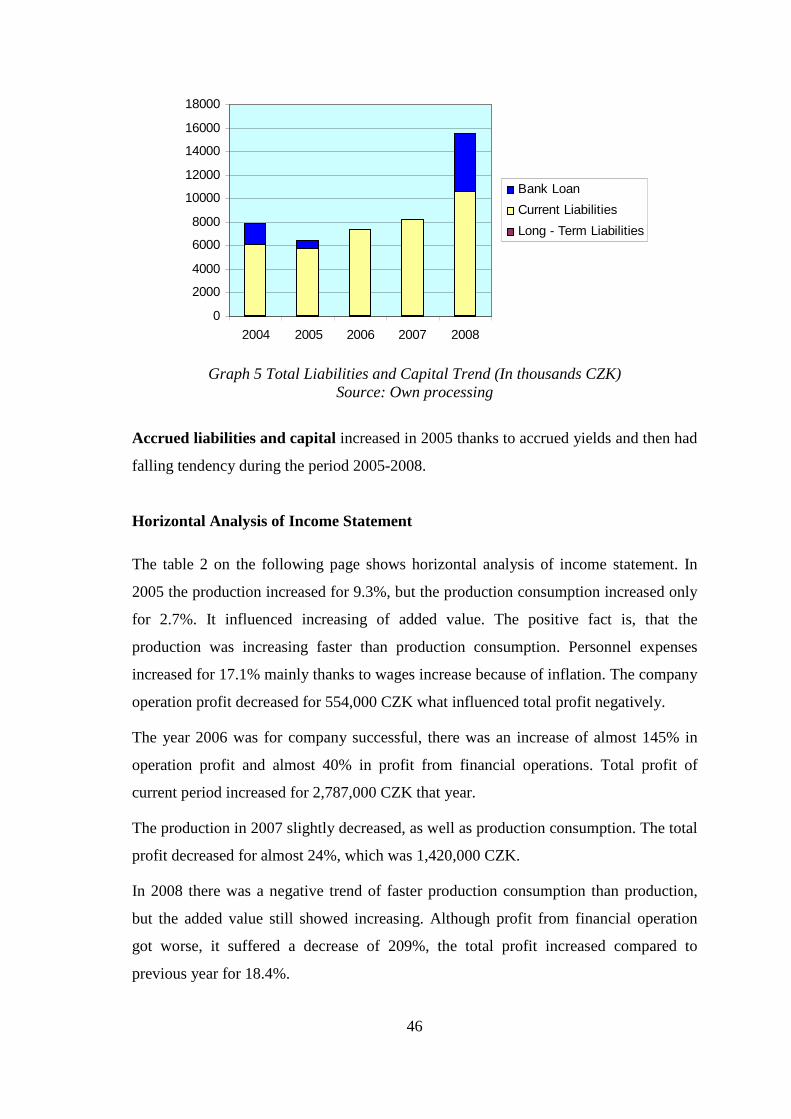
Graph 5 Total Liabilities and Capital Trend (In thousands CZK) Source: Own processing
Accrued liabilities and capital increased in 2005 thanks to accrued yields and then had
falling tendency during the period 2005-2008.
Horizontal Analysis of Income Statement
The table 2 on the following page shows horizontal analysis of income statement. In
2005 the production increased for 9.3%, but the production consumption increased only
for 2.7%. It influenced increasing of added value. The positive fact is, that the
production was increasing faster than production consumption. Personnel expenses
increased for 17.1% mainly thanks to wages increase because of inflation. The company
operation profit decreased for 554,000 CZK what influenced total profit negatively.
The year 2006 was for company successful, there was an increase of almost 145% in
operation profit and almost 40% in profit from financial operations. Total profit of
current period increased for 2,787,000 CZK that year.
The production in 2007 slightly decreased, as well as production consumption. The total
profit decreased for almost 24%, which was 1,420,000 CZK.
In 2008 there was a negative trend of faster production consumption than production,
but the added value still showed increasing. Although profit from financial operation
got worse, it suffered a decrease of 209%, the total profit increased compared to
previous year for 18.4%.

47
Table 2 Horizontal Analysis of Income Statement; Source: Own calculation
The following graph shows a trend of added value and chosen profits. Operation profit
from extraordinary activity had zero values during the period with exception in 2004. It
caused that operation profit from ordinary activity and profit of current accounting
period were in the following years equal.
2005/04 2006/05 2007/06 2008/07
(In thousand CZK); % % % % %
Revenues from sold goods -11 -100 0 - 0 - 0 -
Expenses on sold goods -11 -100 0 - 0 - 0 -
Sale margin 0 - 0 - 0 - 0 -
Production 4057 9.3 868 1.8 -1817 -3.7 6524 13.9
Rev. from own products,services 4416 10.1 626 1.3 -2114 -4.3 7231 15.5
Change in invent.of own product -411 -196.7 244 -120.8 281 669 -700 -216.7 Production consumption 363 2.7 -451 -3.3 -3125 -23.7 1952 19.4 Consumption of mat. and energy 712 33.6 -955 -33.7 -249 -13.3 573 35.2
Services -349 -3.1 504 4.7 -2876 -25.4 1379 16.4 Added value 3694 12.1 1319 3.9 1308 3.7 4572 12.4
Personnel expenses 4424 17.1 -1898 -6.3 2452 8.6 3335 10.8
Deprec. of int. and tan. assets -31 -2.3 -158 -12.1 -8 -0.7 482 42.2
Rev.from disposals of fix.as.,mat 1 1.3 -31 -39.7 54 114.9 -74 -73.3
Other operating revenues -178 -100 152 - 12 7.9 737 449.4
Other operating expenses -1546 -89.9 182 105.2 10 2.8 287 78.6
Operating profit / loss -554 -18.5 3538 144.6 -1361 -22.7 589 12.7
Other financial revenues 123 - -25 -20.3 -98 -100 2 -
Other financial expenses 252 536,2 -73 -24.4 -177 -78.3 11 22.4
Profit/loss from finan. operations -101 -71.1 99 40.7 99 68.8 -94 -208.9
Income tax on ordinary income -252 -29.1 850 138.7 -220 -15 -118 -9.5
Op. profit / loss ordinary activity -403 -20.2 2787 175.3 -1042 -23.8 613 18.4
Extraordinery revenues 0 - 0 - 0 - 0 -
Extraordinery expenses -86 -100 0 - 0 - 0 -
Income tax on extraord. income 0 - 0 - 0 - 0 -
Op. profit/loss extraord. activity 86 100 0 - 0 - 0 -
Profit/loss of current acc. period -317 -16.6 2787 175.3 -1042 -23.8 613 18.4
Profit/loss before tax -569 -20.5 3637 165.1 -1262 -21.6 495 10.8

48
-5000
0
5000
10000
15000
20000
25000
30000
35000
40000
45000
2004 2005 2006 2007 2008
Added Value
Operating Profit / Loss
Operating Profit / LossOrdinary Activity
Operating profit/lossextraordinary activity
Profit/Loss of CurrentAccounting Period
Graph 6 Income Statement Trend (In thousands CZK) Source: Own processing
3.1.2 Vertical Analysis
Vertical Analysis of Balance Sheet
Vertical analysis observes the percentual representation of single items of assets and
liabilities on total. As a 100% base was used total assets/ total liabilities and capital.
Around 60% of assets are current assets. From the closer point of view, the main part of
current assets (30-37%) is created by short – term receivables. Indispensable item was
financial property with overall proportion of approximately 25% on total assets.
Table 3 Vertical Analysis of Total Assets; Source: Own calculation
(In thousand CZK) 2004 2005 2006 2007 2008
TOTAL ASSETS 100.0% 100.0% 100.0% 100.0% 100.0%
Long-term Assets 37.3% 39.2% 37.3% 38.0% 42.8%
Long-term intangible assets 0.1% 0.7% 3.7% 6.1% 3.3%
Long-term tangible assets 37.1% 38.5% 33.7% 31.9% 39.5%
Long-term financial assets 0.0% 0.0% 0.0% 0.0% 0.0%
Current Assets 62.4% 60.3% 61.9% 61.5% 55.5%
Inventories 1.8% 1.1% 1.2% 1.9% 0.6%
Short-term receivables 36.6% 36.8% 35.3% 30.5% 33.4%
Long-term receivables 0.0% 0.0% 0.0% 0.0% 0.0%
Financial property 24.1% 22.4% 25.5% 29.1% 21.5%
Accrued Assets 0.3% 0.4% 0.7% 0.5% 1.6%

49
In the table 4 is done vertical analysis of total liabilities and capital of the company. The
proportion of owners’ equity was approximately around 70%. The biggest item of
owners’ equity was made by book value of equity (35%) and by income from
operations of last years (25%). Borrowed capital was approximately 25% of total
liabilities and capital and was made mainly by current liabilities (23%). In 2004 and
2008 the company took a long – term bank loan that influenced the proportion of
borrowed capital on total liabilities and capital.
Table 4 Vertical Analysis of Total Liabilities and Capital; Source: Own calculation
3.1.3 Verification of Golden Rules
• The gold balance rule
The gold balance rule contains two conditions. The first one demands covering of long -
term (fixed) assets by long - term sources, which are summary of owners´equity, long-
term liabilities and long - term bank loans. The second one says that current sources
should not be bounded to current assets, but current assets should be covered by current
sources.
(In thousand CZK) 2004 2005 2006 2007 2008
LIABILITIES AND CAPITAL 100.0% 100.0% 100.0% 100.0% 100.0%
Owners’Equity 71.5% 75.0% 76.5% 75.3% 64.9%
Book value of equity 38.2% 38.5% 33.6% 30.8% 23.5%
Reserve funds, … 4.4% 4.8% 4.4% 4.7% 4.0%
Capital funds 0.1% 0.1% 0.1% 0.0% 0.0%
Income from op. of last years 22.0% 25.9% 24.6% 30.0% 28.6%
Income from op. of current period 6.9% 5.8% 13.9% 9.7% 8.8%
Borrowed Capital 28.4% 23.5% 23.5% 24.0% 34.6%
Reserves 0.0% 0.0% 0.0% 0.0% 0.0%
Long -term liabilities 0.3% 0.4% 0.4% 0.4% 0.2%
Current Liabilities 21.8% 20.4% 23.1% 23.7% 23.3%
Bank loan: 6.3% 2.7% 0.0% 0.0% 11.1%
Long term bank loan 6.3% 0.0% 0.0% 0.0% 8.4%
Current bank loan 0.0% 2.7% 0.0% 0.0% 2.7%
Accrued Liabilities and Capital 0.2% 1.5% 0.0% 0.7% 0.4%

50
Table5 The Gold Balance Rule (In thousands CZK); Source: Own processing
The first condition was fulfilled absolutely. Long – term assets were covered by long –
term sources approximately twice than it is recommended. They were not covered by
risky short – term sources which could lead to insolvency, i.e. if sales suddenly
decrease. The second condition was fulfilled only to approximately 40%. Current
sources were bounded to current assets in case of 60%.
• The gold rule of risk equilibration
According to the gold rule of risk equilibration, that owners’ equity should be higher
than borrowed capital was this rule absolutely fulfilled.
Table 6 The Gold Rule of Risk Equilibration (In thousands CZK); Source: Own processing
Year Owners’ Equity
Borrowed Capital
2004 19852 > 7878
2005 20647 > 6482
2006 24151 > 7426
2007 25887 > 8270
2008 29252 > 15573
• The gold pari rule
The gold pari rule demands covering of long - term assets by owners’ equity. This
means quite conservative and careful approach that allows usage of financing by long -
term borrowed capital. In practise is not often kept, as well as in case of the company.
• The gold proportion rule
The rate of investments increasing was higher than the rate of sales growing, with
exception in 2007.
Year Long-term
Assets Long-term Sources
2004 10349 < 21683
2005 10799 < 20759 2006 11787 < 24269
2007 13076 < 26010
2008 19290 < 33147
Year Current Assets
Current Sources
2004 17343 > 6047
2005 16614 > 6370 2006 19559 > 7308
2007 21155 > 8147
2008 25008 > 11678

51
3.2 Proportion Ratios Analysis
All ratios mentioned in the theoretical part are step by step calculated within the frame
of proportion ratios analysis.
3.2.1 Profitability Ratios Analysis
Profitability ratios measure relation between profit and capital. The higher are values of
profitability ratios, the better is company’s management of invested sources.
Table 7 Profitability Ratios Analysis; Source: Own calculation
2004 2005 2006 2007 2008
ROI 10.4% 8.3% 18.6% 13.3% 11.5%
ROA 6.9% 5.8% 13.9% 9.7% 8.8%
ROE 9.6% 7.7% 18.1% 12.9% 13.5%
ROS 4.3% 3.3% 9.0% 7.1% 7.3%
Return On Investment (ROI)
Recommended values of this ratio lie in the interval of 12% - 15%. In 2004 and 2005
company reached very weak results. The most effective management of the company
was in 2006, when the value was over 18 %. It is desirable to have the highest values
and growing tendency.
Return On Assets (ROA)
The standard value of this ratio is about 9%. The company’s value was moving under
the recommended value in 2004 and 2005. In 2006 the value increased more than twice,
it means the company used its property more effectively. The next years the value
maintained around 9%.
Return On Equity (ROE)
Generally good value of this ratio is about 10%. The best year was 2006 again because
of high net income reached this year, the value was around 18%. The other years can be
evaluated positively with exception of 2005, when the value was under the standard.

52
Return On Sales (ROS)
The higher is the value, the better is the situation for the company. This ratio shows how
many hellers of profit fall on 1 CZK of sales. The values in 2004 and 2005 were
gradually falling down till 2006 when the value tripled. The next years the values
maintained around 7%. If the values are lower than average, it signals either relatively
low prices or too high costs.
3.2.2 Efficiency Ratios Analysis
Efficiency ratios evaluate how effectively the company uses its assets. The higher are
the values of ratio, the higher is the efficiency of using company’s property.
Table 8 Efficiency Ratio Analysis I; Source: Own calculation
2004 2005 2006 2007 2008 Assets Turnover 1.6 1.7 1.5 1.4 1.2 Fixed Assets Turnover 4.2 4.5 4.1 3.6 2.8
Assets Turnover
The recommended value of this ratio moves at intervals of 1.6 – 3. The company’s
ratios were lower than 1.5 during the period 2006 – 2008. It is necessary to examine
possibilities of effective decreasing of total assets. Sales should be increased or some of
assets should be sold.
Fixed Assets Turnover
Fixed assets turnover was decreasing during the period 2004 – 2008 with exception in
2005. Lower values signals that it is necessary to increase industrial production, but in
this case, it is a signal for management to shorten investments.
Table 9 Efficiency Ratio Analysis II; Source: Own calculation
(In days) 2004 2005 2006 2007 2008 Inventory Turnover Period 4 2 3 5 2 Receivables Turnover Period 77 70 81 79 97 Payables Turnover Period 10 18 17 7 14

53
Inventory Turnover Period
Inventory was bounded to the company till its sale on average of 3 days. The values
were generally low because the values of inventory were low. The inventory turnover
period was decreasing during the period with exception in 2007.
Receivables Turnover Period
This period varied from 70 to 97 days. The company should attempt to decrease this
period to have money as soon as possible available to use. The increase in 2008 was
caused by huge increasing of receivables from business relation. The company should
observe this ratio and avoid to the next potential increasing. It is suitable to compare
this ratio with current due date and if the value is higher than due date, the company
should think about arrangements to quicken the time of receivables cash – ins. The time
of receivables due date varies from 14 to 90 days according to a contract, it means that
subscribers paid late and the company should think about mentioned arrangements.
Payables Turnover Period
This period varied from 7 to 18 days. The values were very low and it means that the
company paid its liabilities earlier that it is common. For instance in 2008 the value was
14 days, in comparison with receivables turnover period, it is very negative. The
company paid to its suppliers on the average in 14 days, but waited for its money from
customers 97 days. During this period the company can suffer insolvency.
3.2.3 Liquidity Ratios Analysis
Permanent solvency ability belongs among basic conditions of successful existence of
the company. It is necessary that company ensure sufficient amount of money to
transform them into cash in case of necessity.
Table 10 Liquidity Ratios Analysis; Source: Own calculation
2004 2005 2006 2007 2008 Current Ratio 2.2 2.6 2.7 2.6 2.1 Quick Ratio 2.2 2.6 2.6 2.5 2.1 Cash Ratio 0.9 1.0 1.1 1.2 0.8

54
Current Ratio
Recommended value moves from 1.5 to 2.5. The company’s values were mainly closer
or a little above to the higher border of recommended values. This means, that risk of
insolvency was low and the company had sufficient liquid instruments to cover its
liabilities fallen due. In the ratio is included also stock, which is the least liquid, that is
why it is not very suitable to maintain much money in stock.
Quick Ratio
Ideally, this ratio should be 1 - 1.5. The calculated values were much more higher.
Quick ratio does not included stock. Compared to current ratio, there is almost no
difference. It means that company had not oversize stock, but it had a high volume of
current assets in liquid form, which shows lower risk of insolvency, however assets give
not high yield.
Cash Ratio
The company’s values moved high above recommended values which lie between 0,2
and 0.5. That means the company was able to pay its liabilities fallen due on time.
Excess amounts of cash may be viewed as inefficient, because it shows not very good
management of company’s capital.
3.2.4 Solvency Ratios Analysis
Thanks to solvency ratios, it is possible to calculate the proportion between owners´ and
borrowed capital.
Table 11 Solvency Ratio Analysis; Source: Own calculation
2004 2005 2006 2007 2008 Debt Ratio 28.4% 23.5% 23.5% 24.0% 34.6% Self-Financing Ratio 71.5% 75.0% 76.5% 75.3% 64.9% Interest Coverage 23.3 31.9 324.4 - 58.3 Long-Term Insolvency 0.0% 0.0% 0.0% 0.0% 8.4% Current Insolvency 28.1% 23.1% 23.1% 23.7% 25.9%

55
Debt Ratio
The debt ratio presents the proportion between owners’ equity and total liabilities. The
high value of this ratio means high indebtedness of company and the high risk of
creditors who prefer the low value of debt ratio. The debt ratio moved around 25%
during the period 2004 – 2007. In 2008 increased to the value of almost 35% when
borrowed capital thanks to bank loan markedly increased.
Self – Financing Ratio
The sum of debt ratio and self – financing ratio should be equal almost to 100% (other
liabilities). The company financed its property from 70% on average by its sources.
From the point of using borrowed capital is the company’s risk very low. The company
should think about financing its activities by higher proportion of borrowed capital,
because financing by own capital is more expensive than by borrowed capital.
Interest Coverage
Interest coverage informs about how many times the profit is higher than interest
expenses. The recommended minimum value of 3 was fulfilled, the values were even
much more times multiplied.
Long – Term and Current Insolvency
The values of long – term borrowed capital were very low, so the values of long – term
insolvency were equal almost to zero during the period 2004 - 2007. The most of
borrowed capital was made by short – term borrowed capital. That is the reason why the
values of current insolvency were almost equal as debt ratio values.
The opposite situation was in 2008, when the long – term insolvency increased to
almost 9% because of bank loan taken to build the new workplace in Brno.

56
3.3 Differential Ratios Analysis
In the following table 12 are calculated the values of differential ratios of the company
during the period 2004 - 2008.
Table 12 Differential Ratios; Source: Own calculation
(In thousands CZK) 2004 2005 2006 2007 2008
Net Working Capital 11,296 10,994 12,251 13,008 14,530
Net Cash Assets 10,797 10,691 11,886 12,339 14,246
Net working capital informs about solvency of the company or if the company is able
to pay its liability fallen due on time. High value of net working capital decreases
financial risk and tells about financial stability of the company. On the next graph is
shown that the value was annually increasing with small exception in 2005. This is
evaluated positively from the financial stability point of view.
0
5000
10000
15000
20000
2004 2005 2006 2007 2008
Net Working Capital
Net Cash Assets
Graph 7 Differential Ratios Trend Source: Own processing
Net cash assets had similar trend as net working capital. The value was annually
increasing, but with small exception in 2005. To calculate the net cash assets ratio is
necessary to cut out less liquid items.
Net quick assets ratio informs about current liquidity of receivables fallen due. It is not
calculated because I do not know the value of liability fallen due. If I included all short
– term liabilities into the ratio, it would change predicative ability of this ratio.

57
3.4 Cash Flow Analysis
Cash flow shows real movement of cash during the certain period. There is a time
disharmony between costs and expenses and between yields and incomes. Profit/loss is
the difference between yields and costs, but not all have to be included.
Table 13 Cash Flow Analysis; Source: Company’s material
(In thousands CZK) 2005 2006 2007 2008 Balance of cash at the beginning of period 6686 6173 8041 10008 Cash flows from running activities Profit/loss from running activities 2203 4603 4578 5073 Adjustments by non-cash operations 1677 477 1527 1845 Depreciation of fixed assets 1334 1259 1212 1798 Change in balance of adjustments, reserves 300 -751 379 -19 Profit from sales of fixed assets -24 -47 -60 -15 Revenue from dividends and shares in profit 0 0 0 0 Accounted for interest expense 67 16 -4 81 Net cash flow from running act. Before work.capital 3880 5080 6105 6918 Change in non-cash items of working capital -1059 1107 1588 -971 Change in balance of receivables -78 -856 557 -5327 Change in balance of short-term payables -1328 2025 1335 3971 Change in balance of inventory 347 -62 -304 385 Change in balance of current liquid assets 0 0 0 0 Net cash flow from running activities before taxation 2821 6187 7693 5947 Interests paid -69 -18 0 -87 Interests received 2 2 4 6 Income tax for running activities -712 -1313 -1739 -1565 Income and expense on unusual items 0 0 0 0 Net cash flow from running activities 2042 4858 5958 4301 Cash flows from investing activities Expense on fixed assets acquisition -1811 -2164 -2457 -7864 Income from fixed assets sales 51 47 60 15 Loans to related parties 0 0 0 0 Net cash flow from investing activities -1760 -2117 -2397 -7849 Cash flows from financing activities Change in bal. of long or short-term payables 0 0 5 3800 Impact of changes in equity on cash -795 -873 -1599 -583 Loss coverage by partners 0 0 0 0 Direct debit fund payments 0 0 0 0 Dividends paid or shares in profit -795 -873 -1599 -583 Net cash flow from financing activities -795 -873 -1594 3217 Net increase/decrease in cash on hand -513 1868 1967 -331 Balance of cash at the end of period 6173 8041 10008 9677

58
The net cash values from running activities were increasing during the period, which
can be evaluated positively. In 2008 the value slightly decreased because of receivables
increasing. This influenced the value of working capital negatively. It is a typical
demonstration of the beginning of financial crisis. Net cash flow from running activities
includes cash flows, which come from basic company’s activities. It shows if the
company is able to create cash flows from usual business transaction. The value should
be positive and the company should constantly increase net cash flow from running
activities.
The net cash values from investing activities were gradually increasing and in 2008
reached almost 8 mil. CZK. The biggest investment in 2008 was building of the new
workplace in Brno of total value of 8 mil. CZK.
The net cash values from financing activities are mainly influenced by dividends paid
or shares in profit during the period. In 2008 the company took a long – term loan of 3.8
mil. CZK what influenced the cash flow values from financing activity heavily.
The overall value of net cash flow is a summary of foregoing three cash flows. The
overall values were considerably fluctuating. In 2005 and 2008 were negative and in
2006 and 2007 were shown positive values. The negative value in 2005 is given mainly
by increasing of short – term payables. This trend was broken during next years and the
values of net cash flow were positive with exception in 2008 when the value decreased
and was negative thanks to high investment into fixed assets.
-10000
-8000
-6000
-4000
-2000
0
2000
4000
6000
8000
2005 2006 2007 2008
CF from RunningActivities
CF from InvestingActivities
CF from FinancingActivities
Overall CF
Graph 8 Cash Flow Trend Source: Own processing

59
3.5 System of Ratios
The last part of analysis of the company’s financial situation refers to chosen models of
total evaluation of financial level, Altman Z-score, Index IN05 and Quick test.
The following table contains item “grey zone” as well. If the values flow in this zone,
the company is not threaten to a bankruptcy. It is threaten, if the values are under the
border. The values higher than upper border show good company´s financial situation.
Table 14 System of Ratios; Source: Own calculation
The Altman Z - score values were higher than upper border of grey zone till 2006, it
means that the company´s financial situation was good. The values from two last years
lie in the interval, it is not so bad, but the company is not so strong as it used to be.
According to the index IN05 the values were with exception of 2007 much more higher
than the upper border of grey zone. The company was prosperity and created value. In
2006 was the value extremely bigger than in other years. It was caused by higher
earnings before interest and taxes and by lower interest expenses that year.
Table 15 Quick Test; Source: Own calculation
Ratio 2004 2005 2006 2007 2008 Self-Financing Ratio 71% 75% 76% 75% 65% Evaluation 1 1 1 1 1 CF Pay-off 0,4 -0,2 -0,1 -0,3 0,2 Evaluation 1 1 1 1 1 Evaluation of Fin. Stab. 1 1 1 1 1 CF in % from Sales -3,6% 4,2% 9,9% 12,7% 7,9% Evaluation - 4 2 1 3 ROA 6,9% 5,8% 13,9% 9,7% 8,8% Evaluation 4 4 2 3 3 Evaluaion of Yield Sit. 4 4 2 2 3 Overall Evaluation 2,5 2,5 1,5 1,5 2
From the results of this indicator the company is clasified as very good. Financial
situation of the company was excellent, but yield situation was a bit more worse, that
was why the overall evaluation of the company moves around mark 2.
Ratio "Grey Zone“ 2004 2005 2006 2007 2008 Altman Z - Score 1.20 – 2.90 2.93 3.18 3.20 2.84 2.32 Index IN05 0.9 – 1.6 2.32 2.75 14.83 1.59 3.60

60
4 PROPOSED SOLUTION AND ITS CONTRIBUTION
At the beginning of the last chapter I would like to repeat and summarize the results of
financial analysis done in the company needed for recommendation and proposed
solution, which follow this summary.
4.1 Summary of Financial Analysis Results
Financial analysis of the financial situation was done on basis of the accounting
statements from the period 2004 – 2008. From the overall point of view the business
activity of the company seems to be successful. In some areas of financial analysis were
reached very good results, some results were average or weak.
The following part is divided into single areas of business management, which are
evaluated and alerted their weaknesses.
4.1.1 Evaluation of Assets and Liabilities Trend
Total assets featured by growth. The biggest change of 31% of total assets was in 2008
thanks to increasing of long - term tangible assets, when the construction of a new
workplace for department in Brno started. Around 60% of assets were current assets.
From closer point of view, the main part of current assets (30-37%) were made by
short – term receivables.
Concerning activity ratios, total assets turnover ratios were lower than recommended
interval. The period of receivables turnover varied from 70 to 97 days. The time of
receivables due date was from 14 to 90 days, it means that subscribers paid late. On the
other side, payables turnover period values were very low. The company paid its
liabilities earlier that it is common. The company can suffer insolvency and should deal
with suppliers for a longer term of expiration.
The company was financed by owners’ equity from almost 70%, and according to the
gold rule of risk equilibration owners’equity was higher than borrowed capital. The
company took 5,000,000 CZK on credit to build a new workplace in Brno in 2008.
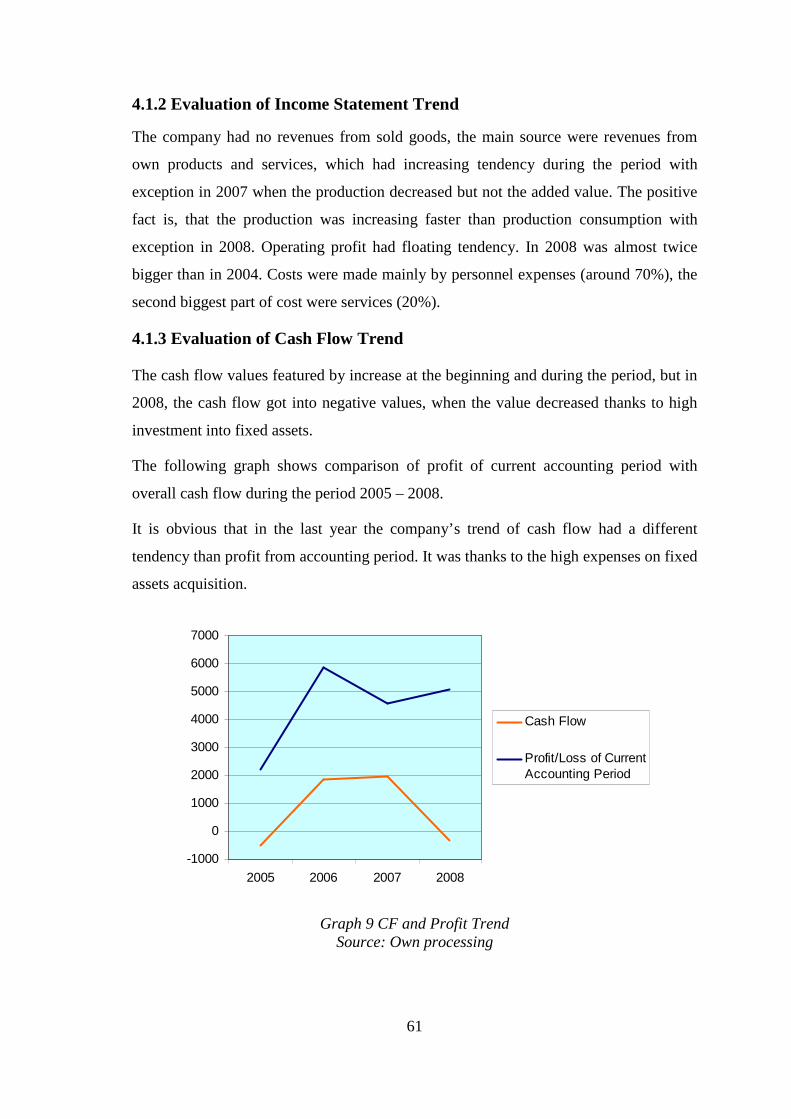
61
4.1.2 Evaluation of Income Statement Trend
The company had no revenues from sold goods, the main source were revenues from
own products and services, which had increasing tendency during the period with
exception in 2007 when the production decreased but not the added value. The positive
fact is, that the production was increasing faster than production consumption with
exception in 2008. Operating profit had floating tendency. In 2008 was almost twice
bigger than in 2004. Costs were made mainly by personnel expenses (around 70%), the
second biggest part of cost were services (20%).
4.1.3 Evaluation of Cash Flow Trend
The cash flow values featured by increase at the beginning and during the period, but in
2008, the cash flow got into negative values, when the value decreased thanks to high
investment into fixed assets.
The following graph shows comparison of profit of current accounting period with
overall cash flow during the period 2005 – 2008.
It is obvious that in the last year the company’s trend of cash flow had a different
tendency than profit from accounting period. It was thanks to the high expenses on fixed
assets acquisition.
-1000
0
1000
2000
3000
4000
5000
6000
7000
2005 2006 2007 2008
Cash Flow
Profit/Loss of CurrentAccounting Period
Graph 9 CF and Profit Trend Source: Own processing

62
4.1.4 Evaluation of Liquidity and Profitability
All liquidity ratios were mainly inside or above the recommended interval. Risk of
insolvency was low and the company had sufficient liquid instruments to cover its
liabilities fallen due. Compared to quick ratio, there was almost no difference. It means
that company had not oversize stock, but it had a high volume of current assets in liquid
form, which shows lower risk of insolvency, however assets give not high yield. The
company was able to pay its liabilities fallen due on time. But excess amounts of cash
can be inefficient for the company.
From the point of profitability, the company was not such successful at the beginning of
the period. The first two years the values were under the recommended standard. But in
2006 this trend changed and the values were much more higher than recommended
values. The following two years values gradually decreased to their standard. The worst
trend showed return on sales ratio. The low values signal either relatively low prices or
too high costs.
0,0%
2,0%
4,0%
6,0%
8,0%
10,0%
12,0%
14,0%
16,0%
18,0%
20,0%
2004 2005 2006 2007 2008
ROI
ROA
ROE
ROS
Graph 10 Profitability Ratio Trend Source: Own processing

63
4.2 Proposed Solution and Recommendation
On the basis of done financial analysis of the company VD – TBD a. s., which records
not only the trend of management of the company, but it enables to find out causes of
decline or improvement of the financial situation as well. It finds out areas, where is
necessary the focus of the company and propose measurement to their improvement and
ensure the next development of business activity.
The financial situation of analysed company is good, no bigger problems were found,
which would threaten the company seriously. Especially the year 2006 was full of
improvement of financial results for the company.
It is obvious, that the company VD – TBD a. s. is a strong and stabile company, which
has solid bases for its business activity and there are no financial problems leading to a
bankruptcy in the near future.
Despite of the good situation of the company and previous facts, I suppose the
improvement for the following areas:
• Financing
• Assets
• Receivables
• Opportunities and Threads
• Employees
Financing Arrangements
From done financial analysis ensued, that the results are good, some of them are even
higher that recommended values. For example solvency ratios show that the financing
of the company is from 70% by its sources. The trend has decreasing tendency for now,
it means that the company is less and less financed by its sources. But if the total
insolvency would decrease in the next years, it means that the proportion of borrowed
capital would decrease, the company would decrease rentability of its capital through
the financial leverage, what is not suitable.

64
The company should think about financing its activities by higher proportion of
borrowed capital, because financing by own capital, as it is known, is more expensive
than by borrowed capital. The company should take this fact on mind during the next
decision – making.
Assets Arrangements
Concerning efficiency ratios, which evaluate how effectively the company uses its
assets, total assets turnover ratios are lower than recommended interval. It is necessary
to examine possibilities of effective decreasing of total assets. Sales should be increase
or some of assets should be sold. Lower values of fixed assets ratio due to investment
into long – term property signal that it is necessary to increase production or to shorten
investments. The higher are the values of the ratio, the higher is the efficiency of using
company’s property.
According to liquidity ratios, especially the quick ratio shows that the company has not
oversize stock, but it has a high volume of current assets in liquid form, which shows
lower risk of insolvency, however assets give not high yield. Cash ratio shows that the
company is able to pay its liabilities fallen due on time. Excess amounts of cash may be
viewed as inefficient, because it shows not very good management of company’s
capital. The company should think about better and effective investing of its money.
Return on investments had during the period very low values with exception in 2006. It
is desirable to have higher values and growing tendency of this ratio. Return on sales
values were also not so high during the period with exception in 2006 again. It signals
relatively low prices or too high costs.
Price increasing is a sensitive topic during the recent time. The advantage of the
company is that it is authorised by Ministry and it is the only one company entrusted to
do technical and safety supervision. I think that price increasing is possible, but it
depends on management, on their experience and relationships with customers. The
other possibility was that costs were too high. Costs were made mainly by personnel
expenses (around 70%), the second biggest part of cost were services (20%). After the
consultation with manager, even though the personnel expenses are high especially
thanks to wages and salaries, they correspond to the level of experience and knowledge
of employees.

65
Management of Receivables
From the activity analysis came some drawbacks in the field of management of
receivables. Receivables from business relation increased annually. The time of
receivables in the company varied from 14 to 90 days according to the customer and
contract, but from the analysis ensued that the company’s period of receivables cash -
ins varied from 70 to 97 days. The company should attempt to decrease this period to
have money as soon as possible available to use. The company should observe this
period and avoid to the next potential increasing.
The higher time to pay receivables is given to the bigger customers for bigger contracts,
especially contracts with watersheds, the time is up to 90 days. There are no problems
with paying receivables late. Some problems are with medium or small customers, who
have approximately 30 days to pay receivables to the company. The company should
focus on these problematic customers, even though the amount of receivable is not so
high compared with contracts with watersheds.
The company had really significant business deficit. The main reason was in imbalabce
between mature of liabilities and receivables detrimental the company. The biggest
cutomers demand a long time to pay off their liabilities (ussually 2 – 3 months). The
business deficit is the difference between receivables and paybles turnover period.
0
10
20
30
40
50
60
70
80
90
100
2004 2005 2006 2007 2008
ReceivablesTurnover Period
Payables TurnoverPeriod
Business Deficit
Graph 11 Business Deficit Source: Own processing

66
The business deficit moved from 52 to 83 days, what is for the company not suitable.
This deficit can cause significant decreases of cash flow during the year. The values
were so high because the biggest customers, mainly state enterprises, demand 3 months
for invoices payment.
Table 16 Business Deficit; Source: Own calculation
Ratio 2004 2005 2006 2007 2008 Receivables Turnover Period 77 70 81 79 97
Payables Turnover Period 10 18 17 7 14
Business Deficit 67 52 64 72 83
In 2008 the total sales increased for 17%, but the receivables from business relations
increased for 42%. Because of recent financial crisis, it is possible to assume, that
customers will lengthen out the term of expiration in the near future and there is a risk
as well, that customers will be not able or they will not have the will to pay the
receivables. In that case, the company could suffer insolvency.
This problem could be solved with higher interest of the person who works on the
project. Because he is often the only person who gets in touch with the customer. He
can thanks to friendly relationship with customer deal about paying the receivables on
time.
The preventive solution of non-payment of receivables could be setting suitable selling
condition or the decision to whom give the business credit and for how long, or what
sanction are in the case of non-fulfilment of a contract. Because the business credit has
no interest and it freezes money for the company and money are not available to use.
There are different arrangements that the company can use to quicker the period of
receivables cash-ins. For example shorten of length of business credit. But to afford the
business credit is considered as a competitive advantage and its shortage could have
maybe the negative influence.
The next solution of reducing the risk of non-payment of receivables could be setting of
the credit limit, which the company is willing to offer. This is suitable especially when
the contract is big.

67
Factoring could be the another arrangement to solve this problem. There are two forms
of factoring. Regression factoring, when the factoring company has the right of the back
transfer in case of non-payment of the receivables. Or non-regression factoring, when
the factor assumes the risk of non-payment of the receivables.
Opportunities and Threads for the Company
The authorization to do technical and safety supervision given by Ministry of
Agriculture is the main strength of the company, it creates a big barrier for new entrants,
but on the other hand, the possibility of its loss is the main threat. The company should
find the way how to deal with loss of the authorization, to find other possibilities of
working in the field of water structures or to gain more contracts from foreign countries.
In the case of given the authorisation to another company as well, learn how to fight
with competition.
Motivation of Employees
As mentioned earlier, among strong side of the company belongs loyalty of employees
and concerning low fluctuation of them. The company should struggles for maintaining
of key employees as a essential. Especially qualified employees with long - time
experience and knowledge are for the company indispensable. The loss of these
employees and their possible working for another company would mean the loss of
works contracts.
The company could use the situation of financial crisis to its own advantage. It could
employ workers, who were redundant or their wage was reduced in consequence of the
financial crisis. It could be a financial burden for the company at this moment, but the
right choose of employee could be very valuable in the future. During the crisis and
high unemployment is higher offer of qualified workers. New employee could beside
his experience bring new customers to the company as well.

68
4.3 Evaluation of Contribution of Proposed Solution
Above mentioned arrangements concern areas, where were found weaknesses or
deficiencies on basis of the financial analysis done in the company VD - TBD a. s. I
believe, that proposed solution and recommendation contribute to the improvement of
the financial situation in the analysed company.
Even though the financial situation of the company is good, it is necessary to pay
attention to management of receivables. Proposed solution leading to shorten the time of
receivables cash-ins and their overall management will in case of implementation have
positive influence on overall financial situation of the company. The quicker time of
receivables cash-ins of the company will decrease the risk of non-payment of
receivables and the company will have to use money to invest for instance to growth of
the company, to quicker the turnover or to valuation of suitable financial product.
Qualified, hardworking and satisfied employee is for the company probably the most
valuable and the most important. Employees are those, who create by their work activity
value of the company. They are a huge contribution for the company. Gaining of next
qualified and hardworking employee will be a big contribution for the company. It will
influence increasing of the activities and overall management of the company.

69
CONCLUSION
The point of financial analysis is, that it gives information on base of evaluation and
comparison of previous data necessary to use in next decision-making. The aim of
financial analysis is to evaluate the financial health of the company, detect eventual
weaknesses, which could lead to financial problems. Financial analysis gives an
overview of company’s management, its quality or flow of capital.
The essence of this master’s thesis was the evaluation of the financial situation of the
company VD-TBD a. s on basis of the financial statements from the period 2004 –2008.
Porter’s analysis, SWOT analysis and a complex financial analysis of the company
focused on the analysis of items from balance sheet, income statement and cash flow
statement, proportion, differential and system of ratios analyses were done.
VODNÍ DÍLA-TBD a. s. is an engineering and consulting company, which provides
technical and safety supervision over waterworks in the Czech Republic. The company
monitors and evaluates the technical conditions of waterworks, emphasizing safety and
reliability, and eliminates possible failures and their consequences. It has no connection
to production, operation nor supplier enterprises. Its employees are highly specialized
and loyal to the company.
The overall management of the company seems to be good. The year 2006 reached
record values in management of the company. In some areas the company reached very
good results, other were average, some of them, like management of receivables were
weak.
The aim of the master’s thesis was on basis of done financial analysis propose
arrangement leading to reducing or elimination of founded weaknesses. It was alerted to
problem areas and arrangements leading to its improvement were proposed. This should
lead to improvement of overall financial situation.
I believe that this master’s thesis will be for the company’s management contribution in
the financial and other field. Information coming from done analyses can be for the
company inspiration and can serve for future decision – making for the company’s
management.

70
REFERENCES
1 ALEXANDER, C. Market models: a guide to financial data analysis.
Chichester: John Wiley & Sons, 2001. 494 s. ISBN 0-471-89975-5.
2 BERNSTEIN, L. A. Analysis of financial statements. New York: McGraw-Hill,
2000. 784 s. ISBN 0-07-094504-7.
3 FRIDSON, M. Financial statement analysis: a practitioner’s guide. New York:
John Wiley & Sons, 2002. 396 s. ISBN 0-471-40915-4.
4 FRIEND, G. Guide to Business Planning. London: Profile Books Limited,
2004. 281 s. ISBN 1-861-97474-4.
5 GILL, J. O. Financial Basics Of Small Business Success. New York: Crisp
Learning, 1993. 235 s. ISBN 1-560-52167-8.
6 HELFERT, E. A. Techniques of Financial Analysis. New York: McGraw-Hill,
2002. 570 s. ISBN 8-172-24067-8.
7 KISLINGEROVÁ, E. and HNILICA, J. Finanční analýza: krok za krokem.
Praha: C.H. Beck, 2005. 137 s. ISBN 8-071-79321-3.
8 KONEČNÝ, M. Finanční analýza a plánování. Brno: Zdeněk Novotný, 2006.
83 s. ISBN 80-7355-061-X.
9 PORTER, M. E. Competitive Advantage. New York: Free Press, 2004. 557 s.
ISBN 0-743-26087-2.
10 PROCTOR, O. S. Building financial models with Microsoft Excel a guide for
business professionals. Hoboken, NJ: Wiley, 2004. 347 s. ISBN 0-471-66103-1.
11 RIAHI-BELKAOUI, A. Financial Analysis and the Predictability of Important
Economic Events. Westport: Greenwood Publishing Group, Incorporated, 1998.
219 s. ISBN 1-567-20164-4.
12 SEDLÁČEK, J. Účetní data v rukou manažera. Brno: Computer Press, 2001.
212 s. ISBN 80-7226-562-8.
13 TEMTE, A. Financial Statement Analysis. Chicago: Dearborn Trade, A Kaplan
Professional Company, 2005. 683 s. ISBN 1-419-52897-1.
14 THOMSETT, M. C. Annual Reports 101: What the Numbers and the Fine Print
Can Reveal about the True Health of a Company. New York: American
Management Association, 2007. 242 s. ISBN 0-814-47367-9.

71
15 VANCE, D. Financial Analysis & Decision Making: Tools and Techniques to
Solve Financial Problems and Make Effective Business Decisions. New York:
McGraw-Hill, 2002. 411 s. 0-071-40665-4.
16 WHITE, G. I. The analysis and use of financial statements. Hoboken: John
Wiley & Sons, 2003. 767 s. ISBN 0-471-37594-2.
Other sources:
17 CTK, The worst is probably over for Czech economy. [online], available from:
http://www.financninoviny.cz/financni-krize/analyzy/zpravy/analytici-ceska-
ekonomika-ma-zrejme-nejhorsi-za-sebou/385280?id=385301, [citation from
13.7.2009]
18 PAZOUREK, V. Potopená loď. [online], available from
http://foto.mapy.cz/88814-Potopena-lod, [10.7.2009]
19 PAZOUREK, V. Brněnská přehrada. [online], available from
http://foto.mapy.cz/11833-Brnenska-prehrada, [10.7.2009]
20 VODNÍ DÍLA–TBD a.s. Výroční zpráva. 2004, 2005, 2006, 2007, 2008.

72
LIST OF TABLES
Table 1 Horizontal Analysis of Balance Sheet
Table 2 Horizontal Analysis of Income Statement
Table 3 Vertical Analysis of Total Assets
Table 4 Vertical Analysis of Total Liabilities and Capital
Table 5 The Gold Balance Rule
Table 6 The Gold Rule of Risk Equilibration
Table 7 Profitability Ratios Analysis
Table 8 Efficiency Ratio Analysis I
Table 9 Efficiency Ratio Analysis II
Table 10 Liquidity Ratios Analysis
Table 11 Solvency Ratio Analysis
Table 12 Differential Ratios
Table 13 Cash Flow Analysis
Table 14 System of Ratios
Table 15 Quick Test
Table 16 Business Deficit
LIST OF GRAPHS
Graph 1 Total Assets Trend
Graph 2 Long – Term Assets Trend
Graph 3 Current Assets Trend
Graph 4 Total Liabilities and Capital Trend
Graph 5 Total Liabilities and Capital Trend
Graph 6 Income Statement Trend
Graph 7 Differential Ratios Trend
Graph 8 Cash Flow Trend
Graph 9 CF and Profit Trend
Graph 10 Profitability Ratio Trend
Graph 11 Business Deficit
73
LIST OF FIGURES
Figure 1 The Logo of the Company
Figure 2 Brno Dam
Figure 3 Employees in Action
Figure 4 The Composition of Yields
Figure 5 Company’s Organisational Structure
Figure 6 Average Number of Employees
Figure 7 Porter’s 5 Forces – Elements of Industry Structure
Figure 8 Users of Financial Statements Analysis
Figure 9 Ratio Degree Scale
LIST OF APPENDICES
Appendix 1 Balance Sheet (assets) VD-TBD a. s 2004 - 2008
Appendix 2 Balance Sheer (liabilities and capital) VD-TBD a. s. 2004 - 2008
Appendix 3 Income Statement VD-TBD a. s. 2004 - 2008
Appendix 4 Cash Flow Statement VD-TBD a. s. 2004 - 2008
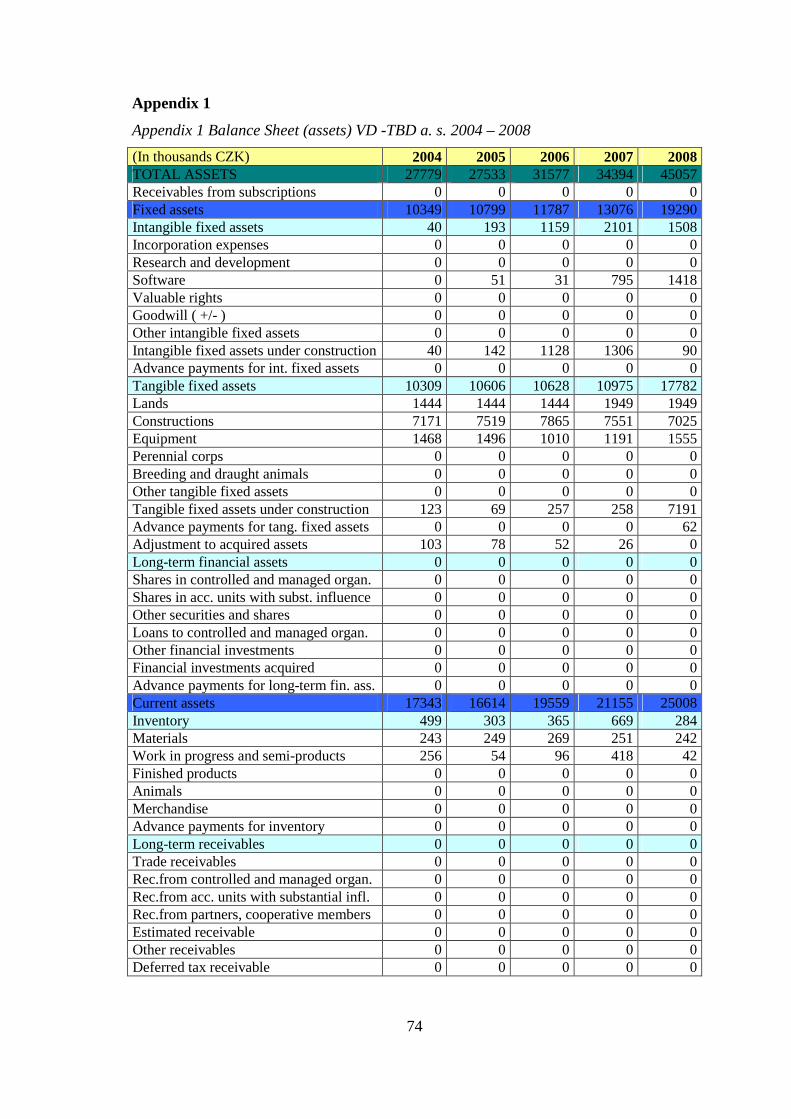
74
Appendix 1
Appendix 1 Balance Sheet (assets) VD -TBD a. s. 2004 – 2008
(In thousands CZK) 2004 2005 2006 2007 2008 TOTAL ASSETS 27779 27533 31577 34394 45057 Receivables from subscriptions 0 0 0 0 0 Fixed assets 10349 10799 11787 13076 19290 Intangible fixed assets 40 193 1159 2101 1508 Incorporation expenses 0 0 0 0 0 Research and development 0 0 0 0 0 Software 0 51 31 795 1418 Valuable rights 0 0 0 0 0 Goodwill ( +/- ) 0 0 0 0 0 Other intangible fixed assets 0 0 0 0 0 Intangible fixed assets under construction 40 142 1128 1306 90 Advance payments for int. fixed assets 0 0 0 0 0 Tangible fixed assets 10309 10606 10628 10975 17782 Lands 1444 1444 1444 1949 1949 Constructions 7171 7519 7865 7551 7025 Equipment 1468 1496 1010 1191 1555 Perennial corps 0 0 0 0 0 Breeding and draught animals 0 0 0 0 0 Other tangible fixed assets 0 0 0 0 0 Tangible fixed assets under construction 123 69 257 258 7191 Advance payments for tang. fixed assets 0 0 0 0 62 Adjustment to acquired assets 103 78 52 26 0 Long-term financial assets 0 0 0 0 0 Shares in controlled and managed organ. 0 0 0 0 0 Shares in acc. units with subst. influence 0 0 0 0 0 Other securities and shares 0 0 0 0 0 Loans to controlled and managed organ. 0 0 0 0 0 Other financial investments 0 0 0 0 0 Financial investments acquired 0 0 0 0 0 Advance payments for long-term fin. ass. 0 0 0 0 0 Current assets 17343 16614 19559 21155 25008 Inventory 499 303 365 669 284 Materials 243 249 269 251 242 Work in progress and semi-products 256 54 96 418 42 Finished products 0 0 0 0 0 Animals 0 0 0 0 0 Merchandise 0 0 0 0 0 Advance payments for inventory 0 0 0 0 0 Long-term receivables 0 0 0 0 0 Trade receivables 0 0 0 0 0 Rec.from controlled and managed organ. 0 0 0 0 0 Rec.from acc. units with substantial infl. 0 0 0 0 0 Rec.from partners, cooperative members 0 0 0 0 0 Estimated receivable 0 0 0 0 0 Other receivables 0 0 0 0 0 Deferred tax receivable 0 0 0 0 0

75
Short-term receivables 10158 10138 11153 10478 15047 Trade receivables 9339 9328 10960 10177 14491 Rec.from controlled and managed organ. 0 0 0 0 0 Rec.from acc.units with substantial infl. 0 0 0 0 0 Rec.from partners, cooperative members 0 0 0 0 0 Rec.from soc. security and health insur. 0 0 0 0 0 Due from state - tax receivable 446 576 0 0 194 Short-term deposits given 110 85 193 91 113 Estimated receivable 250 149 0 210 254 Other receivables 13 0 0 0 -5 Short-term financial assets 6686 6173 8041 10008 9677 Cash 24 25 99 120 89 Bank accounts 6662 6148 7942 9888 9588 Short-term sec. and ownership interests 0 0 0 0 0 Short-term financial assets acquired 0 0 0 0 0 Accruals 87 120 231 163 759 Deferred expenses 87 120 22 163 739 Complex deferred costs 0 0 0 0 0 Deferred income 0 0 209 0 20

76
Appendix 2
Appendix 2 Balance Sheet (liabilities and capital) VD-TBD a. s. 2004 – 2008
(In thousands CZK) 2004 2005 2006 2007 2008 TOTAL LIABILITIES 27779 27533 31577 34394 45057 Equity 19852 20647 24151 25887 29252 Registered capital 10600 10600 10600 10600 10600 Registered capital 10600 10600 10600 10600 10600 Company’s own shares and interests (-) 0 0 0 0 0 Changes of registered capital ( +/- ) 0 0 0 0 0 Capital funds 16 16 16 16 16 Share premium 0 0 0 0 0 Other capital funds 16 16 16 16 16 Dif.from revaluation of assets and liab. 0 0 0 0 0 Differences from revaluation in transform. 0 0 0 0 0 Reserve funds, statutory reserve account 1220 1320 1400 1619 1787 Legal reserve fund / indivisible fund 1220 1320 1400 1619 1787 Statutory and other funds 0 0 0 0 0 Profit / loss - previous year 6109 7121 7758 10317 12901 Retained earnings from previous years 6109 7121 7758 10317 12901 Accumulated losses from previous years 0 0 0 0 0 Profit / loss - current year (+/-) 1907 1590 4377 3335 3948 Other sources 7878 6482 7426 8270 15573 Reserves 0 0 0 0 0 Res. under special statutory regulations 0 0 0 0 0 Res. for pension and similar payables 0 0 0 0 0 Income tax reserves 0 0 0 0 0 Other reserves 0 0 0 0 0 Long-term payables 81 112 118 123 95 Trade payables 0 0 0 0 0 Pay. to controlled and managed organ. 0 0 0 0 0 Pay. to acc. units with substant.influence 0 0 0 0 0 Pay. from partners, cooperative members 0 0 0 0 0 Long-term advances received 0 0 0 0 0 Issues bonds 0 0 0 0 0 Long-term notes payables 0 0 0 0 0 Estimated payables 0 0 0 0 0 Other payables 0 0 0 0 0 Deferred tax liability 81 112 118 123 95 Short-term payables 81 5620 7308 8147 10478 Trade payables 6047 2398 2247 963 2112 Pay. to controlled and managed organ. 1198 0 0 0 0 Pay. to acc. units with substant. influence 0 0 0 0 0 Pay. from partners, cooperative members 0 75 0 0 0 Payroll 47 1084 1165 2317 3231 Pay. to social securities and health insur. 1563 670 703 1409 2011 Due from state - tax liab. and subsidies 990 1194 2401 2865 2440 Short-term deposits received 1867 114 609 416 567 Issues bonds 139 0 0 0 0 Estimated payables 0 85 183 136 99

77
Other payables 191 0 0 41 18 Bank loans and fin. accommodations 52 750 0 0 5000 Long-term bank loans 1750 0 0 0 3800 Short-term bank loans 0 750 0 0 1200 Short-term accommodations 1750 0 0 0 0 Accruals 0 404 0 237 232 Accrued expenses 49 47 0 0 58 Deferred revenues 49 357 0 237 174

78
Appendix 3
Appendix 3 Income Statement VD-TBD a. s. 2004 – 2008
(In thousand CZK) 2004 2005 2006 2007 2008 Revenues from sold goods 11 0 0 0 0
Expenses on sold goods 11 0 0 0 0
Sale margin 0 0 0 0 0
Production 43810 47867 48735 46918 53442
Rev. from own products and services 43601 48017 48643 46529 53760
Change in inventory of own products 209 -202 42 323 -377
Capitalisation 0 52 50 66 59
Production consumption 13268 13631 13180 10055 12007
Consumption of material and energy 2122 2834 1879 1630 2203
Services 11146 10797 11301 8425 9804
Added value 30542 34236 35555 36863 41435
Personnel expenses 25895 30319 28421 30873 34208
Wages and salaries 18095 21303 19912 21664 24035
Remuneration of board members 0 0 144 246 246
Social security expens. and health insur. 6256 7359 6904 7438 8382
Other social expenses 1544 1657 1461 1525 1545
Taxes and fees 56 68 61 51 56
Depreciations of intang. and tang. assets 1339 1308 1150 1142 1624
Rev. from disposals of fixed assets, mat. 77 78 47 101 27
Revenues from disposals of fixed assets 60 51 44 60 15
Revenues from disposals of materials 17 27 3 41 12
Net book value of disposed fix.ass.,mat. 39 27 0 0 0
Net book value of sold fixed assets 39 27 0 0 0
Net book value of sold material 0 0 0 0 0 Change in operating reserves and adjustments and complex deferred costs -1251 -27 -217 74 611
Other operating revenues 178 0 152 164 901
Other operating expenses 1719 173 355 365 652
Transfer of operating revenues 0 0 0 0
Transfer of operating expenses 0 0 0 0
Operating Profit / Loss 3000 2446 5984 4623 5212
Revenues from sales of securities 0 0 0 0 0
Sold securities and ownership interests 0 0 0 0 0
Revenues from long-term financial assets 0 0 0 0 0
Revenues from shares 0 0 0 0 0
Revenues from others securities 0 0 0 0 0
Rev. from other long-term fin. assets 0 0 0 0 48547
Rev. from short-term financial assets 0 0 0 0 0
Expenses associated with fin. assets 0 0 0 0 0 Rev. from reval. of securities and derivat. 0 0 0 0 0 Cost of reval. of securities, derivatives 0 0 0 0 20
Change in fin. reserves and adjustments 0 0 0 0 1

79
Interest revenues 24 2 2 4 6 Interest expenses 119 69 18 0 87 Other financial revenues 0 123 98 0 2 Other financial expenses 47 299 226 49 60
Transfer of financial revenues 0 0 0 0 0
Transfer of financial expenses 0 0 0 0 0
Profit/loss from financial operations -142 -243 -144 -45 -139
Income tax on ordinary income 865 613 1463 1243 1125
Due tax 889 582 1457 1238 1154
Tax deferred -24 31 6 5 -29
Operating Profit / Loss Ordinary Activity 1993 1590 4377 3335 3948
Extraordinary revenues 0 0 0 0 0
Extraordinary expenses 86 0 0 0 0
Income tax on extraordinary income 0 0 0 0 0
Due tax 0 0 0 0 0
Tax deferred 0 0 0 0 0
Operating profit/loss extraordinary activity -86 0 0 0 0
Transfer profit (loss) to partners 0 0 0 0 0
Profit/Loss of Current Accounting Period 1907 1590 4377 3335 3948
Profit/loss before tax 2772 2203 5840 4578 5073

80
Appendix 4
Appendix 4 Cash Flow Statement VD-TBD a. s. 2004 – 2008
(In thousands CZK) 2004 2005 2006 2007 2008 Balance of cash at the begin. of period 11678 6686 6173 8041 10008 Cash flows from running activities Acc. profit/loss from running.act.bef. tax. 2858 2203 4603 4578 5073 Adjustments by non-cash operations 1223 1677 477 1527 1845 Depreciation of fixed assets and 2706 1334 1259 1212 1798 Change in balance of adjustments, reserv. -1557 300 -751 379 -19 Profit from sales of fixed assets -21 -24 -47 -60 -15 Rev. from dividends and shares in profit 0 0 0 0 0 Accounted for interest expense 95 67 16 -4 81 Net CF from run.act.bef. tax., work.cap. 4081 3880 5080 6105 6918 Change in non-cash items of work.capital -3750 -1059 1107 1588 -971 Change in balance of rec.from run.act. -1131 -78 -856 557 -5327 Change in balance of short-term payables -2403 -1328 2025 1335 3971 Change in balance of inventory -216 347 -62 -304 385 Change in balance of current liquid ass. 0 0 0 0 0 Net CF from r.act.bef.tax.,extraord.items 331 2821 6187 7693 5947 Interests paid excl. of interest capitaliz. -119 -69 -18 0 -87 Interests received 24 2 2 4 6 Income tax for running activities -1723 -712 -1313 -1739 -1565 Inc.and exp.on extra.items, incl.inc.tax -86 0 0 0 0 Net cash flow from running activities -1573 2042 4858 5958 4301 Cash flows from investing activities Expense on fixed assets acquisition -2153 -1811 -2164 -2457 -7864 Income from fixed assets sales 60 51 47 60 15 Loans to related parties 0 0 0 0 0 Net cash flow from investing activities -2093 -1760 -2117 -2397 -7849 Cash flows from financing activities Change in balance of payables 0 0 0 5 3800 Impact of changes in equity on cash -1326 -795 -873 -1599 -583 Increase in cash on hand 0 0 0 0 0 Payment of share in equity to partners 0 0 0 0 0 Other contrib.of cash by partners 0 0 0 0 0 Loss coverage by partners 0 0 0 0 0 Direct debit fund payments 0 0 0 0 0 Dividends paid,shares in profit, incl. tax. -1326 -795 -873 -1599 -583 Net cash flow from financing activities -1326 -795 -873 -1594 3217 Net increase/decrease in cash on hand -4992 -513 1868 1967 -331 Balance of cash at the end of period 6686 6173 8041 10008 9677