evaluation of physical work capacity and leg muscle...
TRANSCRIPT

LUND UNIVERSITY
PO Box 117221 00 Lund+46 46-222 00 00
Evaluation of physical work capacity and leg muscle fatigue during exhaustive stairascending evacuation
Halder, Amitava
Published: 2017-04-27
Document VersionPublisher's PDF, also known as Version of record
Link to publication
Citation for published version (APA):Halder, A. (2017). Evaluation of physical work capacity and leg muscle fatigue during exhaustive stair ascendingevacuation Lund: Printed in Sweden by Media-Tryck, Lund University
General rightsCopyright and moral rights for the publications made accessible in the public portal are retained by the authorsand/or other copyright owners and it is a condition of accessing publications that users recognise and abide by thelegal requirements associated with these rights.
• Users may download and print one copy of any publication from the public portal for the purpose of privatestudy or research. • You may not further distribute the material or use it for any profit-making activity or commercial gain • You may freely distribute the URL identifying the publication in the public portal

Take down policyIf you believe that this document breaches copyright please contact us providing details, and we will removeaccess to the work immediately and investigate your claim.
Download date: 05. Jul. 2018

am
itav
a h
ald
er
Evaluation of physical work capacity and leg m
uscle fatigue during exhaustive stair ascending evacuation 2017
978
9177
5331
77
Division of Ergonomics and Aerosol TechnologyDepartment of Design Sciences
Faculty of Engineering ISBN 978-91-7753-317-7
Evaluation of physical work capacity and leg muscle fatigue during exhaustive stair ascending evacuationamitava halder | divsion of ergonomics and aerosol technology
dePartment of design sciences | faculty of engineering | lund university
Are you aware of your current stair climbing capacity? You may be required to make long and non-stop stair ascents during evacuations in case of fires, earthqu-akes, or subway emergencies. Physical exhaustion in-cluding muscle fatigue and cardiorespiratory constra-ints, human behaviour and mental performance can influence the prospects of a person’s successful evacuation upwards in long flights of stairs. This the-sis describes and compares human stair ascending capacities and physiological limitations using two different strategies: a) a self-preferred pace in the field in two buildings and on an escalator, and b) a controlled pace in the laboratory on a stair machine. In the self-p pace referred ascents, the oxygen uptake (VO2) and heart rate (HR) of the subjects reached 89 to 95% and 89 to 96%, respectively, of the human
maximum capacities reported in large databases. In the controlled ascents, the VO2 and HR reached 94 and 97%, respectively, of the subjects’ maximal capacities during ascending at 90% of their maximum capacity related step rate. The average VO2 highest reached 39-41 mL·kg-1·min-1 at the self-preferred pace and 44 mL·kg-1·min-1 during ascending at 90% of maximum capacity related step rates. The study developed and validated a method that shows changes of both electromyographic amplitudes and frequ-encies. The method consists of muscle activity interpretation squares (MAIS) in which muscle activity rate changes (MARC) are used for assessing leg muscle fatigue during stair ascents. The subjects needed to reduce their ascending speeds to a tolerable rate in order to prevent fatigue and thus delay exhaustion so that they could reach the top of the buildings and escalator. The results of the controlled pace at 90% subject’s maximal capacity infer that leg muscle fatigue significantly contributes, in conjunction with car-diorespiratory limitations, to constrain human stair ascending durations and the essential oxygen uptake for performance. The MARC points during different climbing periods enable the interpretation of muscle activity in both stair ascent strategies. MARC and MAIS can be useful for interpreting muscle activity changes over time during dynamic tasks.
1
Evaluation of physical work capacity and leg muscle fatigue during
exhaustive stair ascending evacuation
Amitava Halder

2
Cover photo by Johan Norén
Copyright © Amitava Halder
Division of Ergonomics and Aerosol Technology Department of Design Sciences Faculty of Engineering, Lund University SE- 223 62 Sweden ISBN 978-91-7753-317-7 (print) ISBN 978-91-7753-318-4 (pdf) Printed in Sweden by Media-Tryck, Lund University Lund 2017

3
Evaluation of physical work capacity and leg muscle fatigue during
exhaustive stair ascending evacuation
Amitava Halder
LICENTIATE DISSERTATION by due permission of the Faculty of Engineering, Lund University, Sweden.
To be defended on Wednesday 17th May 2017 at 10:00 in DC: 243, level 2, Ingvar Kamprad Design Centre, Lund University.
Faculty opponent Dr. Juha Oksa
Ph.D., Adjunct Professor, Senior Research Scientist, Finnish Institute of Occupational Health, Oulu, Finland.
Faculty examiner Dr. Ingrid Svensson
Ph.D., Associate Professor, Department of Biomedical Engineering, Faculty of Engineering, Lund University, Sweden.
4
LUND UNIVERSITY Division of Ergonomics and Aerosol Technology Department of Design Sciences
Licentiate Dissertation
Amitava Halder Date of issue
Evaluation of physical work capacity and leg muscle fatigue during exhaustive stair ascending evacuation
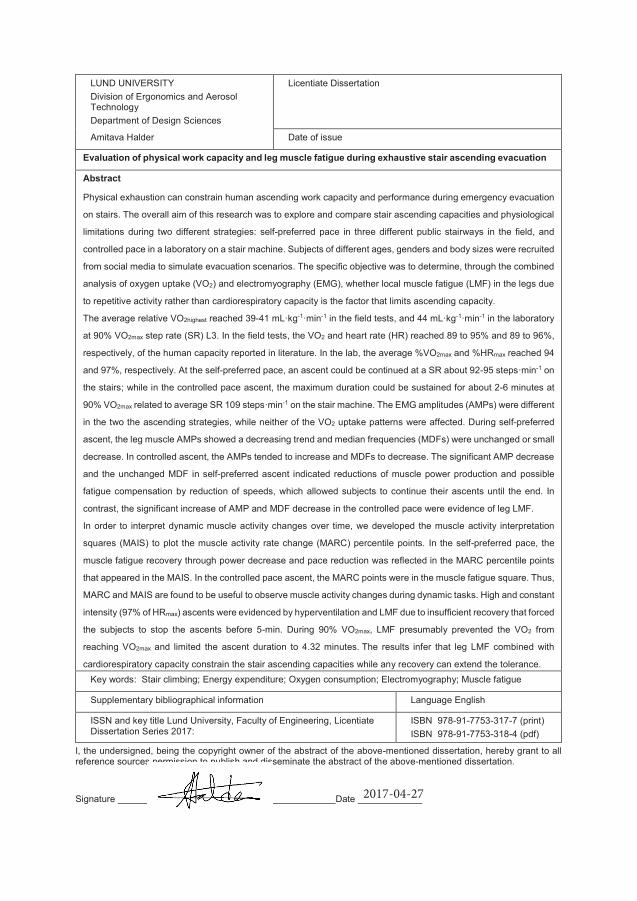
Abstract
Physical exhaustion can constrain human ascending work capacity and performance during emergency evacuation
on stairs. The overall aim of this research was to explore and compare stair ascending capacities and physiological
limitations during two different strategies: self-preferred pace in three different public stairways in the field, and
controlled pace in a laboratory on a stair machine. Subjects of different ages, genders and body sizes were recruited
from social media to simulate evacuation scenarios. The specific objective was to determine, through the combined
analysis of oxygen uptake (VO2) and electromyography (EMG), whether local muscle fatigue (LMF) in the legs due
to repetitive activity rather than cardiorespiratory capacity is the factor that limits ascending capacity.
The average relative VO2highest reached 39-41 mL·kg-1·min-1 in the field tests, and 44 mL·kg-1·min-1 in the laboratory
at 90% VO2max step rate (SR) L3. In the field tests, the VO2 and heart rate (HR) reached 89 to 95% and 89 to 96%,
respectively, of the human capacity reported in literature. In the lab, the average %VO2max and %HRmax reached 94
and 97%, respectively. At the self-preferred pace, an ascent could be continued at a SR about 92-95 steps·min-1 on
the stairs; while in the controlled pace ascent, the maximum duration could be sustained for about 2-6 minutes at
90% VO2max related to average SR 109 steps·min-1 on the stair machine. The EMG amplitudes (AMPs) were different
in the two the ascending strategies, while neither of the VO2 uptake patterns were affected. During self-preferred
ascent, the leg muscle AMPs showed a decreasing trend and median frequencies (MDFs) were unchanged or small
decrease. In controlled ascent, the AMPs tended to increase and MDFs to decrease. The significant AMP decrease
and the unchanged MDF in self-preferred ascent indicated reductions of muscle power production and possible
fatigue compensation by reduction of speeds, which allowed subjects to continue their ascents until the end. In
contrast, the significant increase of AMP and MDF decrease in the controlled pace were evidence of leg LMF.
In order to interpret dynamic muscle activity changes over time, we developed the muscle activity interpretation
squares (MAIS) to plot the muscle activity rate change (MARC) percentile points. In the self-preferred pace, the
muscle fatigue recovery through power decrease and pace reduction was reflected in the MARC percentile points
that appeared in the MAIS. In the controlled pace ascent, the MARC points were in the muscle fatigue square. Thus,
MARC and MAIS are found to be useful to observe muscle activity changes during dynamic tasks. High and constant
intensity (97% of HRmax) ascents were evidenced by hyperventilation and LMF due to insufficient recovery that forced
the subjects to stop the ascents before 5-min. During 90% VO2max, LMF presumably prevented the VO2 from
reaching VO2max and limited the ascent duration to 4.32 minutes. The results infer that leg LMF combined with
cardiorespiratory capacity constrain the stair ascending capacities while any recovery can extend the tolerance. Key words: Stair climbing; Energy expenditure; Oxygen consumption; Electromyography; Muscle fatigue
Supplementary bibliographical information Language English
ISSN and key title Lund University, Faculty of Engineering, Licentiate Dissertation Series 2017:
ISBN 978-91-7753-317-7 (print) ISBN 978-91-7753-318-4 (pdf)
I, the undersigned, being the copyright owner of the abstract of the above-mentioned dissertation, hereby grant to all reference sources permission to publish and disseminate the abstract of the above-mentioned dissertation.
Signature Date 2017-04-27

5
Dedicated to
My heavenly “Father” and beloved “Mother”

6

7
Content
Content ..................................................................................................................... 7
Research papers included in this thesis ........................................................ 10
List of other publications.............................................................................. 11 Journal papers written as main author ................................................. 11 Journal papers as co-author ................................................................. 11 Conference papers as main author ....................................................... 11 Conference papers as co-author ........................................................... 12
List of figures ............................................................................................... 13
List of tables ................................................................................................. 13
Abbreviations ............................................................................................... 14
1 Introduction ....................................................................................................... 16
1.1 Physiological parameters and limitations during exertion ..................... 16 1.1.1 Aerobic (endurance) and anaerobic capacity .............................. 17 1.1.2 Oxygen uptake (VO2) and maximal oxygen uptake (VO2max) .... 17 1.1.3 Heart rate (HR) relationship with workload and energy demand ............................................................................................................. 18 1.1.4 Relationship between oxygen uptake (VO2) and lactate threshold (LT) and ventilatory threshold (VT) ................................................... 19 1.1.5 Cardiac output ............................................................................ 20 1.1.6 Muscle activity and electromyography (EMG) ......................... 21
1.2 Background to emergency evacuation ................................................... 22 1.2.1 Evacuation in ascending stairways ............................................. 22 1.2.2 Self-preferred ascent ................................................................... 23 1.2.3 Controlled ascent ........................................................................ 24
2 Aims and objectives ........................................................................................... 25
3 Methods .............................................................................................................. 26
3.1 Muscle activity interpretation ................................................................. 26 3.1.1 Muscle activity rate change (MARC) ........................................ 26 3.1.2 Muscle activity interpretation squares (MAIS) ......................... 26
3.2 Ethical considerations ............................................................................ 27
3.3 Participants ............................................................................................. 27

8
3.3.1 Field tests .................................................................................... 28 3.3.2 Laboratory experiments .............................................................. 29
3.4 Instrumentations and subject preparations ............................................. 29 3.4.1 Heart rate (HR) and oxygen uptake (VO2) ................................ 29 3.4.2 Electromyography (EMG) ......................................................... 30 3.4.3 Other measurements ................................................................... 31
3.5 Experimental procedures ........................................................................ 31 3.5.1 Field tests .................................................................................... 31 3.5.2 Stair characteristics ..................................................................... 32 3.5.3 Laboratory experiments .............................................................. 33
3.6 Data analysis .......................................................................................... 35 3.6.1 EMG data processing and normalization .................................... 35 3.6.2 Calculations and statistics ........................................................... 35
4 Results ................................................................................................................ 37
4.1 Physical work capacity during stair ascending ....................................... 37
4.2 Oxygen uptake (VO2) ............................................................................ 39
4.3 Muscle activity ....................................................................................... 41 4.3.1 Electromyographic (EMG) activities during stair ascension ...... 41 4.3.2 Muscle activity rate change (MARC) in muscle activity interpretation squares (MAIS) ............................................................ 44
4.4 Correlations ............................................................................................ 46 4.4.1 Correlations between AMP and ascending speed ....................... 46 4.4.2 Correlations between MDF and ascending speed ....................... 47 4.4.3 Correlations between VO2 and AMP .......................................... 47 4.4.4 Correlations between VO2 and MDF .......................................... 48 4.4.5 Correlations between VO2 and heart rate (HR) ......................... 48
5 Discussion .......................................................................................................... 49
5.1 Ascending duration (AD) and step rate (SR) ........................................ 49
5.2 Oxygen uptake (VO2) and heart rate (HR) ............................................ 50
5.3 Metabolic rate (M) ................................................................................ 52
5.4 Muscle EMG amplitude (AMP) and median frequency (MDF) ........... 52
5.5 Muscle activity and oxygen uptake (VO2) ............................................ 53
5.6 Muscle activity rate change (MARC) in muscle activity interpretation squares (MAIS) ........................................................................................... 55
5.7 Overall comparisons between self-preferred and controlled step rate (SR) .... ......................................................................................................... 56
5.8 Limitations and recommendations ......................................................... 58
5.9 Societal relevance of stair ascending work capacity .............................. 59

9
6 Conclusions......................................................................................................... 60
7 Acknowledgement .............................................................................................. 61
8 References .......................................................................................................... 63

10
Research papers included in this thesis
Paper I
Kuklane, K., Halder, A. 2016. A model to estimate vertical speed of ascending evacuation from maximal work capacity data. Safety Science, 89, 369-378.
Paper II
Halder, A., Kuklane, K., Miller, M., Gao, C., Delin, M., Norén, J., and Fridolf. K. 2017. Limitations of oxygen uptake and leg muscle activity during ascending evacuation in stairways. Applied Ergonomics. (Under review).
Paper III
Halder, A., Gao, C., Miller, M., and Kuklane, K. 2017. Oxygen uptake and muscle activity limitations during ascending on a stair machine. Ergonomics. (Under review).
In Paper I, a wide range of databases with human physical capacity information and results from field tests (Paper II) enabled the development of a physiological model of ascending evacuation. The model is related to the maximal physical capacity of healthy individuals. Based on the first 19 subjects, a new prediction model was developed and validated on the last six subjects in the laboratory experiments (Paper III). The prediction equation of the step rate (SR) in steps·min-1 was: SR = -108.8633+2.0121*VO2max+1.3289*%VO2max
The vertical displacement (Vdisp) is calculated as follows:
Vdisp = -21.7727+0.4024*VO2max+0.2658*%VO2max (R2= 0.915).
Accurate fitness estimations of the target populations are needed in order to allow a broad utilization of the prediction. In other words, validation in the field with different stairways configurations, loads carried, age groups, etc., would improve the model as a planning tool. For further details about the results and discussion, readers are referred to the individual papers (Papers I-III). This thesis is part of a project, related to fire engineering and evacuation behaviour (Ronchi et al. 2015; Delin et al. 2016; Arias et al. 2016). Particularly, this thesis summarizes stair ascending physical workloads by analysing the VO2 and the EMG of lower limb muscles in order to determine and compare work capacities and physiological limitations between self-preferred ascents in the field and controlled ascents experiments in the laboratory.
11
List of other publications
Journal papers written as main author
Halder, A., Gao C., Miller M., 2014. Effects of cooling on ankle muscle strength, gait ground reaction forces and electromyography. Journal of Sports Medicine. DOI:10.1155/2014/520124.
Halder, A., Gao, C., 2014. Muscle cooling and performance: A review. European Journal of Sport Medicine. 2(1), 39-48.
Journal papers as co-author
Delin, M., Norén, J., Ronchi, E., Kuklane, K., Halder, A., Fridolf, K., 2016. Ascending stair evacuation: walking speed as a function of height. Fire and Materials. DOI: 10.1002/fam.2410.
Gao, C., Lin Li-Yen, Halder, A., Kuklane, K., Holmér, I., 2015. Validation of ASTM F2732 and comparison with ISO 11079 with respect to comfort temperature ratings for cold protective clothing. Applied Ergonomics. DOI: 10.1016/j.apergo.2014.07.002.
Conference papers as main author
Halder, A., Miller, M., Gao, C., Kuklane, K., 2017. Dynamic work induced muscle activity rate change (MARC) and fatigue evaluation in muscle activity interpretation squares (MAIS). Nordic Ergonomic Society (NES), Lund, Sweden.
Halder, A., Kuklane, K., 2016. Estimation of vertical displacement during ascending evacuation. Pedestrian and Evacuation Dynamics (PED), Hefei, China.
Halder, A., Kuklane, K., Miller, M., Gao, C., Noren, J., Delin, M., Lundgren, K., Fridolf, K., 2015. Energy costs and leg muscle activities in ascending stairs. European Congress of Sports Science, Malmö, Sweden.
Halder, A., Gao C., Miller M., 2015. Effects of cooling on muscle function and duration of stance phase during gait. 16th International Conference on Environmental Ergonomics (ICEE). Portsmouth, United Kingdom. 4(Suppl 1):A47. DOI: 10.1186/2046-7648-4-S1-A47.
Halder, A., Gao C., Miller M., 2013. Effects of cooling on ankle muscle maximum performances, gait ground reaction forces and electromyography (EMG). 15th

12
International Conference on Environmental Ergonomics (ICEE), Queensland, New Zealand.
Conference papers as co-author
Arias, S., Ronchi, E., Norén, J., Delin, M., Kuklane, K., Halder, A., Fridolf, K., 2016. An experiment on ascending evacuation on a long, stationary escalator, 14th International Conference and Exhibition on Fire Science and Engineering (Interflam), Windsor, United Kingdom.
Delin, M., Norén, J., Fridolf, K., Kuklane, K., Halder, A., Lundgren, K-L., & Månsson, S., 2015. Ascending evacuation - Walking speed in stairs as a function of height. 6th International Human Behaviour in Fire Symposium, Cambridge, United Kingdom.
Norén, J., Delin, M., Fridolf, K., Kuklane, K., Lundgren, K., Ronchi, E., Arias, S., Halder. A., 2015. Ascending stair evacuation - effects of fatigue, walking speed & human behavior. 6th International Human Behaviour in Fire Symposium, Cambridge, United Kingdom.
Gao, C., Lin, L-Y., Halder, A., Kuklane, K., 2015. Cold-induced vasodilation during continuous exercise in the extreme cold air (-30.6 °c). 16th International Conference on Environmental Ergonomics (ICEE). Portsmouth, United Kingdom. 4(Suppl 1):A58. DOI:10.1186/2046-7648-4-S1-A58.
Kuklane, K., Vanggaard, L., Smolander, J., Halder, A., Lundgren, K., Gao, C., Viik, J., Alametsä, J., 2015. Response patterns in finger and central body skin temperatures under mild whole body cooling in an elderly and in a young male - a pre-study. 15th International Conference on Environmental Ergonomics (ICEE). Portsmouth, United Kingdom. 4(Suppl 1):A32. DOI:10.1186/2046-7648-4-S1-A32.
Kuklane, K., Butt, M.S., Halder, A., Gao, C., 2015. The colder is warmer? A pre-study for wear trials of a reference clothing ensemble for EN 342 and EN 14058 for thermal manikin calibration. 15th International Conference on Environmental Ergonomics (ICEE). Portsmouth, United Kingdom. 4(Suppl 1):A161. DOI:10.1186/2046-7648-4-S1-A161.
Vanggaard, L., Halder, A., Kuklane, K., 2015. The "AVA - organ". 15th International Conference on Environmental Ergonomics (ICEE). Portsmouth, United Kingdom. 4(Suppl 1):A95. DOI:10.1186/2046-7648-4-S1-A95.
Gao, C., Halder, A., Svensson, I., Gard, G., Nikoleris, G., Andersson, P-E., Magnusson, M., 2014. Using a walkway with adjustable inclination to measure and assess slip and fall risks, International Conference on Achieving Sustainable Construction Health and Safety (W099), Lund, Sweden.

13
Kuklane K., Halder, A., Kownacki, K-L., Gao, C., Östberg, M., Skintemo, L., Grou, A., Törnqvist, J., Ganlöv, K., Åström, M. 2016. Evaluation of BARRIER® EasyWarm on healthy volunteers in three different climates. 7th European Conference on Protective Clothing (ECPC), Izmir, Turkey.
Alametsä, J., Kuklane, K., Smolander, J., Vanggaard, L., Halder, A., Kownacki, K-L., Gao, C., Viik, J., 2015. Age‐related circulatory responses to whole body cooling: observations by heart rate variability. In: Finnish Journal of eHealth and eWelfare.
Kownacki, K-L., Kuklane K., Jakobsson, K., Gao, C., Dal, M., Granér, S., Linninge, C., Dahlqvist, C., Halder, A., 2015. What is the role of traditional fermented foods to prevent heat stress at work? 31st International Conference on Occupational Health (ICOH), Seoul, Korea.
List of figures
Figure 1: Muscle activity interpretation squares (MAIS) Figure 2: Stair ascents in four settings Figure 3: Oxygen uptake (VO2) patterns during stair ascents Figure 4: Muscle EMG amplitude (AMP) changes Figure 5: Muscle EMG median frequency (MDF) changes Figure 6: Muscle activity interpretation squares (MAIS)
List of tables
Table 1: Participants Table 2: Characteristics of the three building stairways Table 3: Laboratory experiments of ascending levels on the StairMaster Table 4: Stair ascending capacity comparisons Table 5: Pearson’s correlation coefficient, “r”

14
Abbreviations
AD Ascending duration
AMP Amplitude
AS Ascending speed (m·s-1)
ATP Adenosine tri-phosphate
BLa− Blood lactate (mmol·l-1)
BSA Body surface area (ADu m-2)
CP Critical Power
CPET Cardiopulmonary exercise testing
CRC Cardiorespiratory capacity
EMG Electromyography
FFT Fast Fourier Transform
GL Gastrocnemius lateralis
GM Gastrocnemius medialis
GTX Graded exercise testing
HR Heart rate (b·min-1)
HRmax Maximum heart rate reached during maximal aerobic capacity test (b·min-1)
HRhighest Maximum heart rate during stair ascending test (b·min-1)
HRmean stable Average heart rate that had reached relatively stable state after the initial growth (b·min-1)
LMF Local muscle fatigue
LT Lactate threshold
MAIS Muscle activity interpretation squares
MARC Muscle activity rate change
MDF Median frequency (Hz)
MNF Mean frequency (Hz)
MUAPs Motor unit actions potentials
MVC Maximum voluntary contractions
Mmean Average metabolic rate (W·m-2)

15
Mmean stable Average metabolic rate that had reached relatively
stable state after the initial growth (W·m-2)
Mhighest Maximum metabolic rate during stair ascending test (W·m-2)
RF Rectus femoris
RP Resting planes
RMS Root mean square
RPE Rating of perceived exertion
SE Stationary escalator
SR Step rate per minute (steps·min-1)
Vdisp Vertical displacement (m)
Vheight reached Calculated vertical velocity reached (m·min-1)
VL Vastus lateralis
VM Vastus medialis
VO2 Oxygen uptake (L·min-1, mL·min-1·kg-1)
VO2highest Maximum oxygen uptake during stair ascending test
VO2max Maximum oxygen uptake during maximal aerobic capacity test (L·min-1, mL·min-1·kg-1)
VO2mean stable Average oxygen uptakes that had reached relatively stable state after the initial growth
VT Ventilatory threshold
%HRmax The percentage of HRhighest during stair-ascending test relative to VO2max
%VO2max The percentage of VO2highest during stair ascending test relative to VO2max
13F Thirteen floors
31F Thirty-one floors

16
1 Introduction
Human physical work capacity and physiological limitations are serious concerns in daily activities, particularly in challenging conditions. We expect to perform our activities smoothly in most daily life situations. Moreover, the physical challenges to our declining musculoskeletal system with age can increase the risks associated with daily tasks. High demand alters the working patterns of our muscles and joints. This leaves little reserve capacity, and an unexpected situation can result in injuries (Samuel et al. 2011). Stairs are frequently encountered obstacles in daily living, and climbing them requires a high range of joint motion and muscle strength even for healthy people (Riener, Rabuffetti, and Frigo 2002; Rantanen et al. 1994). These demands are higher during stair ascending than descending (Andriacchi et al. 1980; McFadyen and Winter 1988). Our cardiorespiratory and musculoskeletal systems work at a higher intensity during stair climbing than level walking (Shiomi 1994; Nadeau, McFadyen, and Malouin 2003). The International Standard Organization (ISO) has classified stair climbing as a very high activity in terms of its metabolic rate of about 290 W.m-2 (ISO 2004). Stair ascending offers a spontaneous evaluation of our work capacity and functional capacity in real life situations. It is regarded as one of the most strenuous and challenging activities of the general population (Johnson, Cooper, and Edwards 1977; Nightingale, Pourkazemi, and Hiller 2014).
1.1 Physiological parameters and limitations during exertion
Humans are not like machines. Skeletal muscles are limited to produce continuous and cyclic force production within a certain period. The cardiac functions involving muscles are also unable to meet the oxygen demand during high aerobic activities for long duration. Stair ascending is such a demanding task for the leg muscles to perform (Macdonald et al. 2007), and it requires an extra capacity and endurance to carry the whole body weight against the gravity. Scientists are keen to explore the performance and challenges of these demanding tasks. Sustaining the high energy production for long periods depends on several factors including individual physical fitness, oxygen uptake capacity, lactate tolerance, and economy of the activity (Per-Olof et al. 2003; McArdle, Katch, and Katch 2015).

17
1.1.1 Aerobic (endurance) and anaerobic capacity
Endurance of a physical activity involves the ability to perform cardiovascular exercise for an extended duration. A prolonged activity, such as ascending stairs requires sustained and repeated muscle contractions. In order to maintain these muscular contractions in a continuous ascent, our bodies need to provide sustained energy. Adequate energy provision means supplying enough oxygen for the muscular work. This is accomplished by adenosine tri-phosphate (ATP) production through metabolic pathways, which include the phosphagen system (production of ATP from creatine phosphate), glycolysis (glucose breakdown), and mitochondrial respiration (aerobic metabolism) (McArdle, Katch, and Katch 2015). The phosphagen and glycolysis pathways are only capable of energy production for a short duration (from seconds to a few minutes) and it is anaerobic.The energy requirement for the muscles can no longer be met anaerobically when the muscle has already used its ATP and creatine phosphate stocks in forced situations. Consequently, ATP regeneration for longer duration must be accomplished through aerobic processes or mitochondrial respiration. Mitochondrial respiration means continuous oxygen availability to the active muscle cells for proper functioning. Proper functioning refers to an activity that is below or equal to the threshold for longer duration in an individual self-preferred situation. Aerobic energy production requires the transportation of oxygen from ambient air. Oxygen is extracted from the inspired air and binds haemoglobin in the red blood cells through pulmonary diffusion in the alveolar capillaries of the lung. Then oxygenated blood is transported to the target tissues or muscle mitochondria via circulation (Costill, Wilmore, and Kenney 2012 ).
1.1.2 Oxygen uptake (VO2) and maximal oxygen uptake (VO2max)
An indication of work capacity and an estimation of energy expenditure can be achieved by measuring VO2 values during work at different maximal and near maximal intensities (Dorman and Havenith 2009). Maximal aerobic capacity or oxygen uptake (VO2max) is a measure of cardiorespiratory fitness that is widely used in exercise physiology (Bassett and Howley 2000). VO2max refers to the upper limit (highest plateau) in the oxygen uptake attained physiologically during gold standard graded exercise testing (GTX). GTX increases the exercise intensity systematically and linearly until the individual is unable to tolerate the workload. It allows to perceive the correlation between exercise workload and human integrated cardiorespiratory, musculoskeletal, and neuropsychological systems. VO2peak or VO2highest is the maximum amount that can be consumed by the body during intensive exercise that is not always maximal. In order to increase the reliability and

18
validity of the intensity of a task, an undefined combination of standardized criteria must be met including the following: VO2 plateau, estimated HRmax, respiratory exchange ratio (RER), blood lactate, and Borg’s rating of perceived exertion (RPE) scale 6-20 (Beltz et al. 2016). The ability of the cardiorespiratory system to transport oxygen to the working muscles is the central component of VO2max. In contrast, the ability of the working muscle to utilize oxygen that is transported by the cardiorespiratory system is the peripheral component of VO2max (Robergs and Roberts 1997). The central component is considered as the main limitation of high intensity exercise. However, the physiological limitations are different between the intensities of work below and higher levels to the threshold for a prolonged activity. The threshold is defined as where an activity can be managed for about eight hours (Stegemann 1981).
A European reference database reported the key human physiological factors for people of both genders and between 20 and 90 years of age. The reported VO2max
for healthy men and women were 54.4 (8.4) and 43.0 (7.7) mL·min-1·kg-1
respectively; and the corresponding HRmax was 196 (10) and 194 (9) b·min-1, respectively, with a subsequent reduction of approximately 3.5 mL·min-1·kg-1 and 6 b·min-1 per decade. Sex difference for VO2max was p<0.001 and for HRmax was p< 0.05 (Loe et al. 2013). An average VO2max of about 40 mL·min-1·kg-1 and is considered as a limit to avoid a life threating situation for fit people involved in firefighting tasks (Ben-Ezra and Verstraete 1988). Moreover, the required VO2max for the firefighters’ relative fitness is reported to be about 49 mL·min-1·kg-1 (Davis et al. 1982). The energy expenditure or metabolic rate of about 475 W·m-2 (≈70 % of VO2max) is suggested to be maintained at work for about 15-20 min and at 600 W·m-2 (≈90 % of VO2max) for about 5 min (Holmer and Gavhed 2007).
1.1.3 Heart rate (HR) relationship with workload and energy demand
Energy metabolism is needed for the work not for the workload itself. Workload is the deciding factor for HR adjustment and the threshold for prolonged work. An unlimited amount of aerobic work can be done, which refers to muscular factors. If the same amount of high intensity work is managed by involving a lower amount of muscle mass, then heart rate rises continuously and the work will sooner be interrupted by exhaustion. Moreover, high HR is proportional to the oxygen uptake. If the workload increases gradually, then the definite workload is reached at which HR leaves the linear steady state of VO2. Oxygen debt is created during both a constantly high and a progressivly increasing workload, while activities must be stopped due to fatigue and exhaustion (Stegemann 1981). The heart rate behaviour during aerobic and partially anaerobic work differs above the threshold for prolonged activity. During light physical work or below the threshold for prolonged
19
activity, HR raises sharply to a certain level after which it stabilizes (Stegemann 1981). At that point, HR reaches a workload where the demand can be maintained for a subsequent amount of time (2-3 min). Very high activity levels for a short time (a few minutes) engage the limited anaerobic energy yielding processes. The oxygen transporting process is relatively slow at the onset and it takes a couple of minutes before the rate of oxygen uptake matches the demand (Costill, Wilmore, and Kenney 2012 ; Whipp and Wasserman 1972).
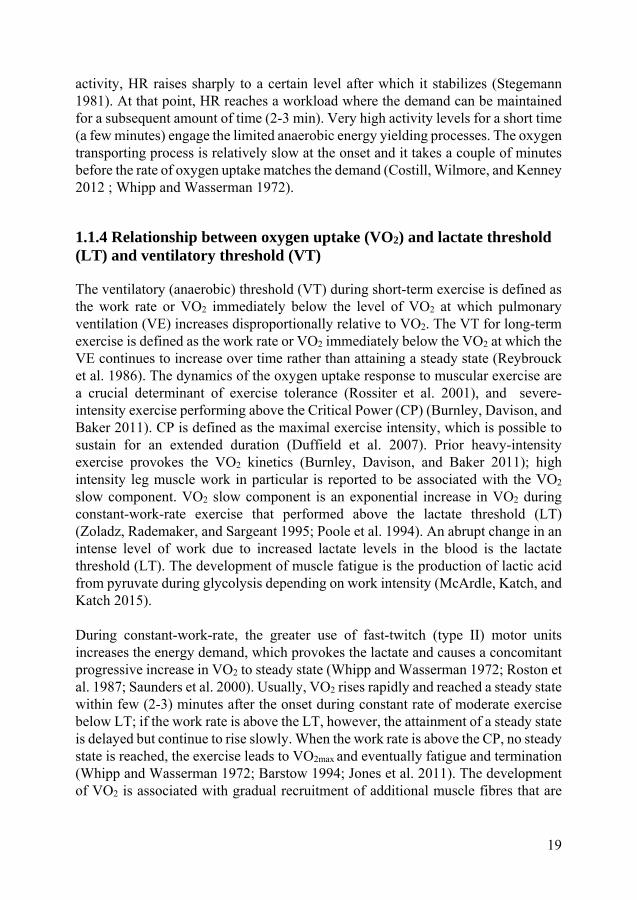
1.1.4 Relationship between oxygen uptake (VO2) and lactate threshold (LT) and ventilatory threshold (VT)
The ventilatory (anaerobic) threshold (VT) during short-term exercise is defined as the work rate or VO2 immediately below the level of VO2 at which pulmonary ventilation (VE) increases disproportionally relative to VO2. The VT for long-term exercise is defined as the work rate or VO2 immediately below the VO2 at which the VE continues to increase over time rather than attaining a steady state (Reybrouck et al. 1986). The dynamics of the oxygen uptake response to muscular exercise are a crucial determinant of exercise tolerance (Rossiter et al. 2001), and severe-intensity exercise performing above the Critical Power (CP) (Burnley, Davison, and Baker 2011). CP is defined as the maximal exercise intensity, which is possible to sustain for an extended duration (Duffield et al. 2007). Prior heavy-intensity exercise provokes the VO2 kinetics (Burnley, Davison, and Baker 2011); high intensity leg muscle work in particular is reported to be associated with the VO2
slow component. VO2 slow component is an exponential increase in VO2 during constant-work-rate exercise that performed above the lactate threshold (LT) (Zoladz, Rademaker, and Sargeant 1995; Poole et al. 1994). An abrupt change in an intense level of work due to increased lactate levels in the blood is the lactate threshold (LT). The development of muscle fatigue is the production of lactic acid from pyruvate during glycolysis depending on work intensity (McArdle, Katch, and Katch 2015). During constant-work-rate, the greater use of fast-twitch (type II) motor units increases the energy demand, which provokes the lactate and causes a concomitant progressive increase in VO2 to steady state (Whipp and Wasserman 1972; Roston et al. 1987; Saunders et al. 2000). Usually, VO2 rises rapidly and reached a steady state within few (2-3) minutes after the onset during constant rate of moderate exercise below LT; if the work rate is above the LT, however, the attainment of a steady state is delayed but continue to rise slowly. When the work rate is above the CP, no steady state is reached, the exercise leads to VO2max and eventually fatigue and termination (Whipp and Wasserman 1972; Barstow 1994; Jones et al. 2011). The development of VO2 is associated with gradual recruitment of additional muscle fibres that are

20
presumed to have lower efficiencies. The recruitment of additional fibres is not always necessary during high-intensity exercises, and a progressive loss of muscle contractile efficiency is associated with the fatigue process resulting the equivalent durational VO2 slow component and exercise tolerance (Jones et al. 2007; Vanhatalo et al. 2011; Zoladz et al. 2008; Cannon et al. 2011). Moreover, the work rate changes within the severe intensity domain that increases the amount of work and tolerance (Dekerle et al. 2015). The work intensity reduction is obvious after a certain level, if it takes place in a self-controlled situation. Work pace reduction is crucial for fatigue recovery and for minimizing the energy demand that decreases the load on the cardiorespiratory system. VT is reached at exercise intensities between 50 and 75 % of VO2max, but this depends on individual anaerobiosis and lactate tolerance (Roston et al. 1987; Whipp and Wasserman 1972). The observed VO2 slow component (plateau) is the main VO2max criterion after the initial rapid increase and steady state while high levels of blood lactate (BLa−) ≥8.0-10.0 mmol·l-1 is one of the secondary VO2max criterion (Howley, Bassett, and Welch 1995; Beltz et al. 2016). The higher probability of observing plateau in breath-by-breath (81%), 15s (91 %), and 30s (89 %) than 60s (59 %) (Astorino 2009). A BLa− value between 15-25 mmol·l-1 was also observed in post exercise, 3-8 minutes (Goodwin et al. 2007). The lactate concentration neither increase significantly at the end of all four bouts of 3-min long isometric effort during rowing simulating task (Vogiatzis et al. 1996) nor during 40 m high building stair ascending (Johnson, Cooper, and Edwards 1977). This suggests that BLa− is not important in predicting performances for short (2-3 min) durations. Moreover, RER value ≥1.15 is used as a secondary criterion for attaining VO2max. RER is the product of the CO2 produced in metabolism divided by the O2 consumed, and it reflects the balance between bicarbonate buffering and hydrogen ion accumulation (Howley, Bassett, and Welch 1995). It is an indicator of muscle’s oxidative capacity to get energy (Ramos-Jiménez et al. 2008). In addition, RPE ≥ 17 or 18 is used commonly to assume the attainment of VO2max.
1.1.5 Cardiac output
Cardiac output is defined as the product of heart rate and stroke volume, namely the amount of blood pumped by the heart per minute. In fact, some researchers have concluded that 70-85 % of the limitation in VO2max can be attributed to maximal cardiac output (Cerretelli and DiPrampero 1987). Maximal HR is much more dependent on a person’s age: it decreases as one increases in age and fitness, but it is quite stable and remains unchanged with endurance training. Having the high variability, estimated HRmax is often used as a secondary criterion to VO2max. Stroke volume is the amount of blood pumped per heart beat, which increases substantially

21
from endurance training. Cardiac output is identified as one of the main limiting factors for oxygen supply and VO2max (Bassett and Howley 2000). An activity above the threshold for long duration work and high heart rate create a constant peripheral resistance and cardiac output. High intensity activity reduces stroke volume and the work will be terminated due to severe exhaustion (Stegemann 1981).
1.1.6 Muscle activity and electromyography (EMG)
Muscle power is considered as an important physical capability, strength and weakness of movements (Kraemer and Newton 1994). Stair ascending places a high demand on the thigh muscles, reaching a maximal isometric capacity (Samuel et al. 2011). Repetitive exertions performed over a sustained period of time lead to fatigue, which is believed to be the precursor of musculoskeletal disorders (MSDs). Identification of fatigue is crucial for ergonomists in order to prevent workplace injuries, illnesses and MSDs. MSDs are widespread throughout the world and are associated with enormous financial and societal costs, which are the second greatest cause of global disability (Horton 2012). Evidence suggests that musculoskeletal disorders may result from fatigue failure processes (Gallagher and Schall 2017). It is essential that accurate assessment methods for muscle fatigue are available.
Surface EMG is a preferred and frequently used method to assess muscle activity. Even though it has several limitations due to its high precision, non-invasiveness, and unobtrusiveness (Chowdhury and Nimbarte 2015) to register the motor unit action potentials (MUAPs) delivering from the anterior horn cells of the spinal cord. The measurement of muscle activity can be an important physiological parameter and indicator of neuromuscular fatigue to evaluate performance (Hanon et al. 1998). EMG muscle activity provides an estimation of forces by observing the amplitudes (AMP), and examines the source spectrum to assess the signals’ frequency ranges and density. The relationship between EMG amplitude (AMP) (e.g., root-mean-square) and muscle force production (or torque about a joint) is often linear but not always. However, this is only when the muscle is activated isometrically at the same length across different intensities. There is often a curvilinear component to it (Christensen et al. 1995; Zoladz, Rademaker, and Sargeant 1995).
Muscle fatigue analysis is complicated during dynamic exertions compared with static muscular exertion. During dynamic exertion, continuous change in body posture changes the joint range of motion, length of muscle fibres, and the number of active motor units. Therefore, the magnitude and direction of muscular force application changes together with nerve conduction velocity (Merletti, Knaflitz, and De Luca 1990). Muscle fatigue can be analysed using conduction velocity as well (Farina 2006). The study of neuromuscular fatigue is carried out with mean (MNF), median frequency (MDF), and the estimated power of the spectrum using the Fast

22
Fast Fourier Transform (FFT). A shift in the MNF or MDF toward lower values or an increase in the power of the low frequency and a decrease in the power of high frequency components have been identified as indicators of muscle fatigue (Eberstein and Beattie 1985). Fatigue index (FI) was also used to define the level of fatigue during repetitive task. FI consists of a ratio between muscle activity changes during maximum voluntary contractions (MVC) and AMP at the beginning and end of the work (Oksa, Ducharme, and Rintamäki 2002).
1.2 Background to emergency evacuation
1.2.1 Evacuation in ascending stairways
Modern cities and high-rise structures are built with underground facilities for global corporations and increasing transportation demands. Stairs are often used as the only means of rapid urgent egress during evacuation from these structures. Generally, descending stairs are the main form of evacuation in high-rise buildings (Peacock, Averill, and Kuligowski 2010). However, long duration and non-stop ascending may be required in vertical distances in the case of evacuation restrictions at lower levels for example, fires, earthquakes, subway emergencies and other accidents. Long stairway ascents to reach a safe refuge location from deep underground can be physically challenging (Lam et al. 2014; Ronchi et al. 2015). Physical exhaustion constrains a person’s capacity to ascend and his or her performance during evacuation in emergencies.
The major concerns in the field of evacuation research are physiological limitations, maximum ascending capacities and durations. Sufficient cardiorespiratory capacity (CRC) and repetitive movements of limb muscles are required for continuous stair ascension (Xu, Yang, and Yang 2015). The workload of cardiorespiratory system is prominent in meeting the increasing demands of the working muscles. Generally, CRC is believed to be the main indicator of human physiological limitations; limits that constrain a person’s capacity in terms of maximum upward speed to a given height and in terms of duration. However, local muscle fatigue (LMF) is another factor caused by repetitive activities that can further reduce work capacities (Cheng and Rice 2013). If the ascending intensity is equal to or above the threshold for a prolonged activity, it can constrain the duration earlier than expected. Consequently, LMF may interrupt an evacuation before reaching the CRC limits (Ben-Ezra and Verstraete 1988). There is a considerable amount of research on LMF, but we have only found a few studies that examine the simultaneous effects of LMF and CRC on ascending
23
capacity. The highly energetic and demanding tasks involve muscular load, cardiorespiratory response, which can be measured through oxygen consumption and muscle fatigue monitoring (Holmer and Gavhed 2007). The inclusion of muscle EMG measurements is a complementary approach along with cardiorespiratory gas analysis to evaluate stair ascending physiological limitations in the field and laboratory settings.
• Self-preferred ascent: In the field studies presented in the thesis,
individuals performed the stair ascents at their self-preferred ascending step rate (SR) and strategies on regular stairways.
• Controlled ascent: In the laboratory experiment presented, the subjects climbed on a stair machine at predetermined step rates.
1.2.2 Self-preferred ascent
As the effort increases, physical exhaustion affects stair ascending speed and style during long evacuations. It appears to be impossible for a person to continue an ascent with his/her preferred speed for a long duration. Previous research suggests that more investigations are required to consider the important role of physical exhaustion during longer evacuation performance (Ronchi and Nilsson 2013; Pelechano and Malkawi 2008). Physical work capacities and limitations have been explored to some extent in both ascending and descending in several field studies using various designs and protocols on public stairways. These studies have measured heart rate (HR), blood pressure and oxygen uptake (VO2), and have estimated the energy expenditure at the subjects’ preferred speeds (Lam et al. 2014; Teh and Aziz 2002; Halsey, Watkins, and Duggan 2012; Aziz and Teh 2005; Chen et al. 2016). Studies are scarce that examine physiological responses and muscle fatigue combined with EMG during stair ascending activities.
Regular stairs allow subjects to change their ascending strategies and control their pace. Few studies have measured VO2 and EMG to observe exhaustion and muscle fatigue during ascending on regular stairs. An EMG study on regular stairs reported that ascending muscle performance was significantly higher than descending, whereas calf muscles worked proportionately higher than the tibialis anterior muscle (Eteraf Oskouei et al. 2014). Studies have indicated a strong positive relationship between the VO2 slow component (Borrani et al. 2001; Shinohara and Moritani 1992) and motor unit recruitments (Sabapathy, Schneider, and Morris 2005). Previous studies also had short ascending periods that did not allow the VO2 to reach a steady state. It is important to note that none of the studies quantified muscle fatigue as a physiological limiting factor during this intensive ascending task.
24
1.2.3 Controlled ascent
Several laboratory studies have also measured physiological parameters including HR and VO2 to determine the energy costs of using stair machines (Bassett et al. 1997; Butts, Dodge, and McAlpine 1993; O'Connell et al. 1986). Stair ascension metabolic costs measured on a motorized escalator (Bassett et al. 1997) and StairMaster ergometer were used during simulated firefighting activities (O'Connell et al. 1986). The relative VO2 values observed were 26, 32, 38 and 46 mL·min-1·kg-
1 during ascending for 5 minutes on several controlled speeds at 60, 77, 95, and 112 steps·min-1, respectively (Butts, Dodge, and McAlpine 1993). Another study increased the SR every two minutes on a step ergometer and found a lower VO2max response of about 40.1 mL·min-1·kg-1 compared to 43.1 mL·min-1·kg-1 during running on a treadmill. This study claimed that lower VO2max value might contribute to leg muscle LMF. The onset of fatigue may have constrained the ascending capacity and kept the VO2 from reaching the maximal level indicating another possible limiting factor (Ben-Ezra and Verstraete 1988).
The EMG registrations of stair ascending leg muscles were acquired in a few controlled studies in laboratory settings. Double-step strategy (skipping every other step) stair climbing resulted in greater ankle and knee extensor activity including 15 to 20 % higher metabolic costs for propulsion compared to the single-step (taking every step) on an inclined treadmill (Gottschall, Aghazarian, and Rohrbach 2010). EMG and VO2 were measured during a work rate increase in a ramp function cycling study at either 8 W·min-1 (slow) or 64 W·min-1 (fast); it found a progressive MDF decrease during fast ramp cycling while it remained relatively constant during slow ramp cycling. The increase in AMP was relevant to the work rate increase for exercising below the LT (Scheuermann, Tripse McConnell, and Barstow 2002). None of the studies above examined leg muscle fatigue as an associating physiological factor that could limit the stair ascending capacity. However, one needs to elucidate stair ascension by using EMG to measure muscle fatigue in addition to VO2 in order to explore the dominant ascending limiting factors during a rapid evacuation simulation on a stair machine. It is important to test the occurrence of fatigue that is due to the repetition of maximal efforts during stair ascension from both performance and evacuation perspectives. Thus, the research presented in this thesis investigates whether muscular fatigue is one of the physiological limiting factor that constrains performance during a long stair ascension evacuation. Moreover, a muscle activity rate change (MARC) method was developed. It includes muscle activity interpretation squares (MAIS) for analyzing and interpreting the stair ascending EMG data.

25
2 Aims and objectives
The overall aim of the research was to explore and compare stair ascending capacities and physiological limitations during two different strategies: a) self-preferred pace in the field, and b) controlled pace in the laboratory. This was done by measuring cardiorespiratory capacity (CRC) and muscle performance. The research questions were:
• What physical work capacity and muscle performance are required to accomplish stair ascent evacuation?
• How can the ascent height and physical work capacity be described by the physiological model presented in Paper I?
• What factors constrain performance and what were the differences in work capacities and leg muscle performance between stair ascending at various vertical stairway heights at self-preferred and controlled rates?
We hypothesized that
• In order to ensure a continuous ascent in the field, oxygen uptake (VO2) has to stabilize at a submaximal level.
• Both CRC and local muscle fatigue (LMF) limit the evacuation ascending duration and speed.
• VO2 and electromyography (EMG) are correlated in fatigue development. • Stair ascent can only be sustained for 5 minutes at 90 % VO2max speed.
Specific objectives
The present work intended to develop and validate a method to evaluate stair ascending physical work capacity using combined VO2, heart rate (HR) and EMG measurements.
1. To develop muscle activity interpretation squares (MAIS) to analyse and interpret muscle activity rate change (MARC) over time during stair ascent.
2. To investigate whether LMF due to repetitive activity rather than CRC is the factor that limits ascending capacity during lab simulation tests.
3. To find out whether EMG and VO2 uptakes associated with ascending speeds, strategies and building types in field stair evacuation studies.
26
3 Methods
3.1 Muscle activity interpretation
3.1.1 Muscle activity rate change (MARC)
This research introduces the muscle activity rate change (MARC) to interpret and evaluate dynamic task EMG data. MARC is achieved by dividing the total dynamic task duration data into ten division of equal length (10 %) of the individual total working period (100 %). The data in each 10 % dataset is then averaged to yield one data point (for a total of 10 averaged data points for the 100 % period). This is done for the amplitude (AMP) in µV and the median frequency (MDF) in Hz in order to evaluate fatigue. This method can also be applied for time normalization for the whole working duration of any dynamic task. The periodical average AMP and MDF changes per unit of time represent the MARC. Later, the rate change values are combined and plotted in the muscle activity interpretation squares (MAIS).
3.1.2 Muscle activity interpretation squares (MAIS)
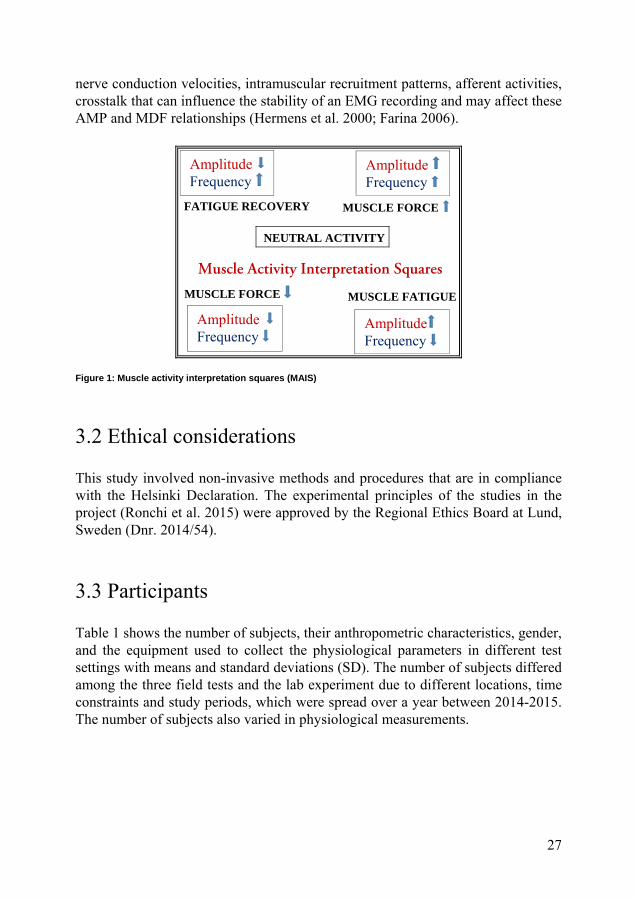
MAIS were developed and used to interpret the dynamic work EMG data over time for any dynamic task. The 10 % periodical average EMG activities during repeated movements from a given task provide an estimation of fatigue according to the relative changes that occur in the muscles’ amplitude and frequency (Asplund and Hall 1995) (Figure 1). The MAIS is based on the four possible assumptions of muscle activity rate changes (MARC), derived from the combination of AMP and MDF changes per unit of time. The increase in EMG amplitude and frequency results in: 1) muscle force increase. An increase in the amplitude and a decrease in frequency indicates 2) muscle fatigue. A decrease in both the amplitude and frequency indicates 3) muscle force decrease. A decrease in EMG amplitude and an increase in frequency indicates 4) muscle fatigue recovery (Cifrek et al. 2009). However, there are number of factors and confounding variables including: skin and muscle temperature (Oksa, Ducharme, and Rintamäki 2002; Halder, Gao, and Miller 2014); muscle fibre lengths and sizes, presence of different motor units and
27
nerve conduction velocities, intramuscular recruitment patterns, afferent activities, crosstalk that can influence the stability of an EMG recording and may affect these AMP and MDF relationships (Hermens et al. 2000; Farina 2006). Figure 1: Muscle activity interpretation squares (MAIS)
3.2 Ethical considerations
This study involved non-invasive methods and procedures that are in compliance with the Helsinki Declaration. The experimental principles of the studies in the project (Ronchi et al. 2015) were approved by the Regional Ethics Board at Lund, Sweden (Dnr. 2014/54).
3.3 Participants
Table 1 shows the number of subjects, their anthropometric characteristics, gender, and the equipment used to collect the physiological parameters in different test settings with means and standard deviations (SD). The number of subjects differed among the three field tests and the lab experiment due to different locations, time constraints and study periods, which were spread over a year between 2014-2015. The number of subjects also varied in physiological measurements.
FATIGUE RECOVERY
Amplitude Frequency
Amplitude Frequency
MUSCLE FATIGUE
MUSCLE FORCE
Amplitude Frequency
Amplitude Frequency
MUSCLE FORCE
NEUTRAL ACTIVITY
Muscle Activity Interpretation Squares

28
Table 1: Participants
The total number of subjects and their anthropometric data: mean, standard deviation (SD), and range.
Stairs Number of subjects
Male : Female Age (years) Height (m) Weight (kg) BSA (ADu m-2)
Number of subjects with HR measurement
13F 47 27:20 32.5 (9.2)
19.0-51.0
1.76 (0.08)
1.64-1.95
73.8 (13.9)
55.0-120.0
1.89 (0.19)
1.59-2.33
31F 29 18:11 31.8 (7.1)
20.0-46.0
1.73 (0.06)
1.55-1.82
70.1 (13.9)
50.0-103.0
1.83 (0.18)
1.46-2.18
SE 34 21:13 37.6 (11.4)
22.0-62.0
1.74 (0.10)
1.52-1.90
74.9 (13.1)
47.0-116.0
1.89 (0.20)
1.41-2.43
Number of subjects with VO2 and HR measurements
13F 30 14:16 32.6 (9.0)
(19.0-51.0)
1.74 (0.06)
(1.64-1.87)
71.7 (15.2)
(55.0-120.0)
1.85 (0.19)
1.59-2.33
31F 16 9:7 34.3 (7.0)
(24.0-46.0)
1.75 (0.05)
(1.68-1.82)
75.0 (13.7)
(55.0-103.0)
1.89 (0.16)
(1.62-2.18)
SE 17 11:6 39.4 (10.4)
25.0-62.0
1.74 (0.09)
1.60-1.90
75.2 (14.5)
62.0-116.0
1.89 (0.20)
1.64-2.43
Number of subjects with EMG, VO2 and HR measurements
13F 12 8:4 35.6 (9.7)
24.0-51.0
1.74 (0.06)
1.67-1.87
72.9 (11.9)
55.0-99.0
1.87 (0.16)
1.61-2.15
31F 9 6:3 33.2 (7.3)
24.0-46.0
1.75 (0.05)
1.68-1.82
72.5 (12.5)
55.0-101.0
1.86 (0.14)
1.62-2.12
Laboratory
StairMaster
25 13:12 35.3 (12.3)
22.0-62.0
1.72 (0.07)
1.59-1.89
74.4 (17.6)
53.0-128.4
1.86 (0.22)
1.53-2.44
EMG was not measured during climbing at SE.
3.3.1 Field tests
The ascending tests were carried out to simulate emergency evacuation situations involving both genders, a wide range of age, and body sizes in three different public stairways and in a laboratory. The subjects were recruited from different announcements in social media. They went through a screening session to determine eligibility using a questionnaire. The basic information was collected such as age, height, weight, physical status, occupation, exercise habits, public transport use, disabilities, medications, etc. Healthy subjects without any musculoskeletal disorders were selected and they received both verbal and written information about the test procedures during the recruiting period and before the tests. Their written

29
informed consents were obtained. The subjects were asked to abstain from any vigorous exercise or sport activity prior to the tests. The test persons were told that they had the right to terminate the test at any time without providing any reason.
3.3.2 Laboratory experiments
The participant recruitment procedure and instructions prior to the lab tests were the same as for the field study. They were also requested not to eat too much, or drink coffee or tea at least two hours before the tests. Participants visited the laboratory on two occasions. On the first occasion, a description of the test was provided both orally and in writing that included the necessary safety information, test procedures and apparatus to be used. A written informed consent was acquired for the VO2max test. Then a maximal aerobic capacity test was performed on a treadmill to determine the subjects’ individual maximal oxygen uptake (VO2max). The subjects performed the ascension tests on the StairMaster in the second visit after a recovery period of at least 24 hours following the VO2max test. They were able to practice walking on the treadmill or climbing on the StairMaster before the actual tests on both visits. For safety reasons, there were always two researchers available nearby the station.
3.4 Instrumentations and subject preparations
3.4.1 Heart rate (HR) and oxygen uptake (VO2)
HR was measured with Polar watch (RS400, Polar Electronics, Finland), and VO2 with a portable cardiopulmonary exercise testing (CPET) system (Metamax II, Cortex Medical GmbH, Germany). The system consists of a facemask with a volume transducer and sampling tubes for exhaled air connected to an O2 and CO2 gas analyser with a data logger. It was fastened with a snip-snap harness on the subject’s head and face.
The Metamax II, CPET system was calibrated according to the manufacturers’ recommendations before the testing. The instrument was started early in the beginning of each test day to warm up and to measure the atmospheric gas concentrations (20.93 % O2 and 0.03 % CO2). The volume calibration was made using a 3-liter calibration syringe (Cortex Biophysik GmbH; Leipzig, Germany Model: M9474-C, Medikro Oy, Kupio, Finland). The CPET device was also prepared by measuring the ambient air before each of the subject tests.

30
The start of HR and VO2 measurements was synchronized when a beep sound was heard from the CPET instrument. The subject started ascending directly following the beep sound and stopped when the stipulated time was over or when the subjects themselves stopped the ascent. The VO2 uptake was measured with a sampling interval of 10 s, which was stored in the CPET data logger and retrieved into the computer after completion of the measurements. The HR data were recorded with a sampling interval of 5 s and later converted to 10 s to fit with the oxygen uptake data.
3.4.2 Electromyography (EMG)
A portable surface EMG system, Megawin Biomonitor (sampling rate 1024 Hz, ME6000-T16 Mega Electronics, Kuopio, Finland), was used to record raw muscle electrical signals. The EMG biomonitor was harnessed around the subject’s waist during ascending. Four muscles were chosen unilaterally in the dominant lower limb. This included two superficial thigh muscles: vastus lateralis (VL) and vastus medialis (VM); and two calf muscles: gastrocnemius medialis (GM) and gastrocnemius lateralis (GL). All four of these muscles were measured at the thirteen-floor (13F) building site. At the thirty-one floor (31F) building site and in the laboratory experiments, however, the rectus femoris (RF), a two-joint thigh muscle was measured instead of VM. Thigh and calf muscle fibre directions and orientations are parallel and bipennate, respectively, relative to the positions of their tendons (Hamill, Knutzen, and Derrick 2015). To obtain the EMG signals, the hairy skin was shaved and cleaned with 70 % isopropyl alcohol after scrubbing lightly with fine sandpaper. Pre-gelled bipolar surface (10 mm) electrodes (Ambu Neuroline-720-AgCl, Ballerup, Denmark) were positioned on the contracted and approximate centre of the most prominent bulge of muscle belly. The centre-to-centre distance of the electrodes was about 20-30 mm. Electrodes were aligned and placed parallel to the direction of the muscle fibres with respect to the tendon in order to minimize electrical impedance and EMG crosstalk (Hermens et al. 2000). The same investigator placed all the electrodes following the recommendations and procedures in the Surface Electromyography for the Non-invasive Assessment of Muscles (SENIAM) website (www.seniam.org, Enschede, Netherlands). The reference electrodes were attached on the tubercle and shaft of the tibia and fibular head. All EMG cables were taped onto the skin to prevent the movement of artefacts and restrictions during ascension. Subjects were permitted to use their own footwear and clothing after the EMG electrodes were attached to their leg.

31
3.4.3 Other measurements
In the field
A video camera (HDR AS30V, Sony Corporation, Japan) was belted to the subject’s waist to record the ascending duration (AD) and speed. The AD in the field tests was defined as the moments between when the participants trod on the first and the last stair-step recorded in the camera. The recorded ascending speeds were converted into 10 s intervals to fit with other physiological measurements. The total weight of all the instruments on the subjects was about 2.5 kg. Additionally, a number of fixed cameras (Drift Innovation, X170, Stockholm, Sweden) were mounted on the walls of every floor in the building stairways, and every three-meter position at the escalator to capture movements (Delin et al. 2016).
In the laboratory
The EMG of the maximum voluntary contractions (MVC) of the dominant leg muscles during ankle plantar flexion (calf) and knee extension (thigh) were also recorded prior to the stair ascent tests. This was done by applying maximal resistance from the middle point of full range of motion of the respective movements. The middle range of the full joint motion and comfortable position of the knee was ensured to be able to exert maximum force from the thigh. The same was done for the ankle joints. This was carried out in a sitting position for the thigh muscles, and in a prone position on a bed for the calf muscles.
3.5 Experimental procedures
3.5.1 Field tests
The individual subjects were equipped with instruments to measure VO2, HR, speed, and EMG of the dominant lower limb muscles. Due to the aims of the main project and limited time for the use of the escalator, the EMG measurement requiring a relatively long preparation of the subjects was skipped at the short SE. The subjects were informed that the test was about physiological parameters measurements during emergency evacuation, and asked to select their own preferred pace, which would allow them to continue the ascent in these unacquainted number of floors in each building. All kinds of ascent strategies were acceptable, such as single or double steps and using handrails. The subjects were allowed to take a break and/or

32
withdraw from the test at any time if they no longer wanted to continue. A research team member indicated the end of the ascent was by waiting at the defined floor. Test participants were requested to rate their perceived exertion (RPE) on The Borg scale from 6 to 20 by reporting the corresponding number when they passed the researcher (Delin et al. 2016).
3.5.2 Stair characteristics
The stair ascending tests in the field were conducted on three different public stairways. The first two field tests were in two different buildings in terms of height, nature, and number of steps in each flight: 1) thirteen floors (13F), Ideon Gateway, Lund, Sweden, and 2) thirty-one floors (31F), Kista Science Tower, Stockholm, Sweden. The third test was on a 33 meter (m) high stationary escalator (SE) at Västra skogen, Stockholm, Sweden to test endurance on continuous stairs without landings. Detailed descriptions of the stairways are provided, along with fire engineering considerations, in the following papers: Ronchi et al. 2015; Delin et al. 2016; Arias et al. 2016.
The different stairways were chosen in respect of height, flight length and landing in order to compare ascending capacities and performances. The detailed characteristics of the stairways are presented in the Table 2.
Table 2: Characteristics of the three building stairways
Stairways Height (m) Total flights Width (m) Total steps Step riser (m) Step tread (m)
13F 48 26 1.0* 268 0.18 0.26
31F 109 93 1.6* 677 0.17 0.27
SE 33 1 1.2* 166 0.20 0.40
*Width was calculated as the distance between handrails.
Thirteen floor (13F) building
The 13F building had two flights of stairs between floors and one landing. On floors 1-3, the first flight consisted of 11 steps and the second of 12. On floors 4-10 and 12, the first flight consisted of 10 steps and the second of 11. Floor 11 had only one flight of 29 steps (curved without a landing). The distance between each step was 0.18 m and the slope of the flight was 34.7 degrees. On the inner side of the flight, the handrail was mounted above the edge of the step and on the outer side, on the wall, 0.06 m from the edge of the step. The handrails were placed 0.95 m over the nosing. The landings had a depth varying between 0.95-1.25 m and a width of 2.15 m (Figure 2A).
33
Thirty-one floor (31F) building
The 31F building had three flights of stairs between floors with two landings. The first two flights had 7 steps and the last, 9 steps (Delin et al. 2016). The distance between each step was 0.155 m and the slope of the flight was 32.2 degrees. On the inner side of the flight, the handrail was mounted just outside the edge of the step. On the outer side, the handrail was mounted on the wall, 0.075 m from the edge of the step. Each landing had a depth of 1.60 m and a width of 3.55 m (Figure 2B).
Stationary escalator (SE)
The escalator had a height of 33 m and length of 66 m. At the time of the test, it was the longest escalator in Sweden (Arias et al. 2016). The escalator has a single flight without breaks or landings, so the climbing process could be observed without interruption. The width between handrails was 1.2 m. Each step was 1 m wide and 0.345 m high, and 0.055 m deep. The slope of the escalator was 29.7 degrees. There were 165 steps of full height (197 mm), and 12 steps with variable height (5 at the lower end of the escalator, and 7 at the top) (Figure 2C).
A B C D
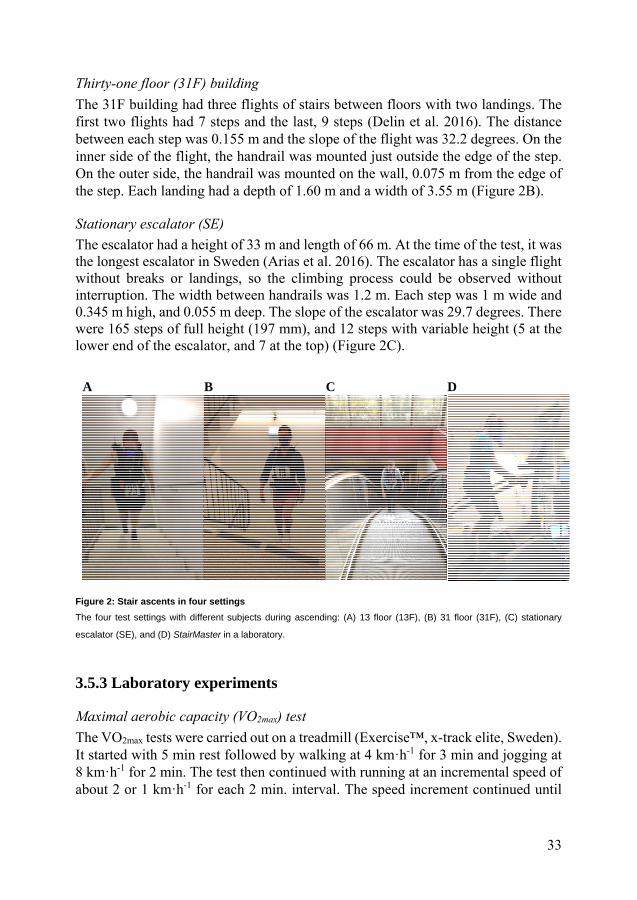
Figure 2: Stair ascents in four settings
The four test settings with different subjects during ascending: (A) 13 floor (13F), (B) 31 floor (31F), (C) stationary
escalator (SE), and (D) StairMaster in a laboratory.
3.5.3 Laboratory experiments
Maximal aerobic capacity (VO2max) test
The VO2max tests were carried out on a treadmill (Exercise™, x-track elite, Sweden). It started with 5 min rest followed by walking at 4 km·h-1 for 3 min and jogging at 8 km·h-1 for 2 min. The test then continued with running at an incremental speed of about 2 or 1 km·h-1 for each 2 min. interval. The speed increment continued until
34
the individual indicated with a hand sign that he or she had reached a suitable speed at which to continue running. The inclination was then applied on the treadmill with increments of 3 % after each 2 min running interval until exhaustion (ACSM, 2010). The highest HR and VO2 in mL·min-1·kg-1 values (at 10 seconds sampling interval) that were obtained during the VO2max test period were designated as the individual’s HRmax and VO2max.
Stair machine characteristics
Subjects performed ascending on a stair machine with a step height of 20.5 cm and depth of 25.0 cm (StairMaster, SM5, Vancouver, WA, USA). Individual step rates (SRs) were determined for each subject at three levels of intensity based on their VO2max values in mL·min-1·kg-1: 60 % for Level 1 (L1), 75 % for Level 2 (L2), and 90 % for Level 3 (L3) (Paper I). This stair machine was considered to simulate stair climbing best, especially the ascent on the escalator. The StairMaster allowed adjustments of SR in 20 different levels from 24 to 162 steps per minute (Figure 2D).
Table 3: Laboratory experiments of ascending levels on the StairMaster The mean (SD) step rates and test durartions for each ascending level corresponding to the individual VO2max and StairMaster levels.
Ascent activities %VO2max Pre-determined test length (min)
Step rate (steps·min-1)
obtained in this study
Corresponding step rate level on StairMaster
Level 1 (L1) 60 % 3 66.1 (16.3) 7 (2)
Level 2 (L2) 75 % 3 88.3 (17.0) 10 (2)
Level 3 (L3) 90 % 5 109.4 (17.8) 13 (2)
Stair ascent on the StairMaster
The safety information about the experiment was repeated for the subjects and they signed a separate informed consent form for the ascending test. They were equipped with instruments to measure VO2, HR and EMG of the dominant lower limb muscles. A three-minute resting period was allowed before starting the first two ascents L1 and L2, and a five-minute resting period before L3 level. The subjects were encouraged to keep ascending at each level for the given duration, but were assured in advance that they could stop at any time. They were allowed to hold the handrails. A general assumption is that people will choose their maximal possible ascending speed in order to reach a safe place in an evacuation situation. Consequently, the subjects were only instructed at L3 (90 % of VO2max) to ascend until exhaustion or up to 5 minutes (Figure 1D). Subjects also rated their perceived exertion (RPE) on the Borg scale at the end of L3.

35
3.6 Data analysis
3.6.1 EMG data processing and normalization
The raw EMG signals were filtered through a bandpass filter (20-499 Hz) in order to eliminate low frequency movement and electrocardiographic artefacts in the Megawin software, version 3.1-b10. The individual recorded ascending duration (AD) differed according to the subjects’ own ascending capacities. Each subject’s total AD was divided into 10 equal lengths (10 %) of the whole individual ascending period (100 %). The 10 % duration dataset was then averaged to yield 10 data points for both median frequency (MDF) in Hz and amplitude (AMP) in µV to evaluate fatigue. This normalization method was applied to compare the dynamic muscle activities per unit time (Dingwell et al. 2008; MacIsaac, Parker, and Scott 2001). The MDF was retrieved from average spectrum analysis using the calculation window. Root mean square (RMS) averaging was also applied to obtain average AMP values from each 10 % period. As there is no absolute scale for EMG amplitudes, and the amplitudes vary from individual to individual, direct raw value comparisons between subjects or conditions cannot be made. Thus, each average 10 % AMP dataset was normalized by the average AMP during the MVC tests of the respective muscles of each subject for the laboratory experiment, and the maximum AMP during the total climbing duration for the field tests. The normalized AMP and MDF for each 10 % period were calculated for all subjects in order to observe related muscle activity changes during the progressive ascension. EMG signals containing excess noise were excluded during analyses.
3.6.2 Calculations and statistics
The averages of all individual subject maximums (highest) were calculated. The means were calculated of the physiological parameters including VO2, HR and metabolic rate (M) that had reached reasonably stable states (mean stable) after the initial growth in all three field tests and in the laboratory ascending levels. These values were averaged for all subjects and used to determine the stair ascending maximum and tolerable capacities. The continuous increments on the graphs of VO2, HR and M were visually inspected by two researchers until they reached at a steady level in order to determine their mean stable (mean stable) values. The two researchers scrutinized the graphs together and came to a consensus on the starting point of steady level after the sharp increase. They then calculated an average until the end of graph in the corresponding ascent.

36
The assumption of normality of EMG values was questioned in the mixed model and analysis of variance (ANOVA) tests. Thus, Friedman’s test of nonparametric-related samples was performed to observe how the related muscle activities changed over time for both AMPs and MDFs. During an emergency evacuation situation, an ascending speed is expected to be close to the individual’s maximal capacity level. Moreover, pronounced muscle fatigue was not expected in these two, 3-min low intensity lab tests. The correlation and regression analyses, and the MARC and MAIS were only applied to the two building tests, and the L3 (90 % of VO2max) tests in the laboratory.
Pearson’s correlations were performed between muscle AMPs, MDF and VO2 results from the field and L3 laboratory tests. This was done to determine and compare how self-preferred and controlled speeds explain the changes in EMG AMPs and MDFs during the slow component increases of VO2. VO2 and speed data were also normalized to 0-100 % periods following the same procedure of EMG normalization. Statistical analyses were carried out in Excel (Microsoft Corporation, USA) and Statistical Package for the Social Sciences (SPSS), version 22.0 (IBM Corporation, USA). A probability (p) value of ≤0.05 was considered to be statistically significant in all tests.
The averages of all the normalized parameter values were calculated within each of the 10 % normalized time periods for the same subject and then for each of the 10 % periods for all individual subjects. In addition, the EMG muscle activity rate change (MARC) was observed in the average AMP and MDF changes per unit of time for the two buildings in the field and 90 % of VO2max (L3) step rates at laboratory. Later, the AMP and MDF values were combined to get one “Δ” point, which was plotted on the muscle activity (amplitude and frequency) interpretation squares (MAIS) for interpretation and evaluation of the LMF in the legs. This is reported in the results section and calculated according to the following equation: ∆= ̅⁄
where,
Δ is change in the selected parameters (AMP and MDF) over a normalized time period;
is the selected parameter (AMP and MDF) value at a normalized time point n;
is the selected parameter value at a normalized time point n-1; ̅ is the average duration in seconds for ascending in each of the 13F, 31F buildings and L3 laboratory tests;
10 is the total number of normalized time periods.

37
4 Results
4.1 Physical work capacity during stair ascending
All the subjects who participated in the field tests managed to reach the top floor except for one woman. She withdrew due to pain in her right knee after ascending 21 of 31 floors. The average ascending durations (AD) were 2.9, 7.8, and 1.7 minutes for ascending 268 (13F), 677 (31F), and 165 (SE) steps, respectively. The laboratory participants managed to ascend the stipulated two, 3-min durations of intensities, L1 and L2 (60 and 75 % of VO2max). The average AD at L3 (90 % VO2max) was about 4.32 (1.14) min when the participants managed to climb 95.0 (30.8) m in a vertical direction. Seventeen participants out of the twenty-five who managed to sustain the ascents for the stipulated 5-min duration and perceived the test as an extremely hard task. The remaining eight participants quit before 5 min, and started doing so even after the second min of the test at L3 (Table 4). The average RPE was 18 on the Borg scale.
The average self-preferred SRs were above 92 steps·min-1 in the field tests at two different building heights, which was lower than the L3 lab experiment. On the long SE, the average SR was 103 (range 33-165) steps·min-1 without landings. This was higher than the average SRs of the two buildings. The SR ranges at the 13F and 31F buildings were between 60-161, and 54-144 steps·min-1, respectively. The SR ranges at L1 and L2 were between 31-89, and 53-118 steps·min-1, respectively. However, the average SRs at L1 and L2 were lower than those two building tests in the field except for SE, but SR at L2 was close to that of 31F. On the contrary, the SR of the SE was also lower than that of L3 (Table 4).
The average absolute and relative highest VO2 values obtained at L3 or 90 % VO2max ascending speeds were quite close to the VO2max test values. The average HRmax and VO2max measured for the lab subjects were 190.4 (13.6) b·min-1 and 46.7 (9.2) mL·min-1·kg-1, respectively. The HRmax range was between 161.0 and 212.0 b·min-
1, and VO2max was between 29.7 and 60.6 mL·min-1·kg-1.

38
Notably, the ascending performances at L1 and L2 were slightly higher than the calculations based on VO2max: 63 for L1 and 79 % for L2. These data were used to develop an ascending evacuation model (Paper I). The %HRmax reached varied widely compared to the %VO2max reached during ascending at these fixed SRs (Table 4).
Table 4: Stair ascending capacity comparisons
Stair ascending capacity comparisons between self-preferred ascending in the field tests (13F, 31F and SE) and three individual controlled ascending speeds on the StairMaster in laboartory experiments in each test setting with their means (SD).
*Number of subjects were measured with the CPET instrument.
# Stable state was not usually reached due to short ascent duration.
¤ Based on recently published database and the American College of Sports Medicine (ACSM) guidelines.
N/A: Not applicable for the field tests.
Parameters Self-preferred pace of ascents Controlled pace of ascents
13F
(N=47)
31F
(N=29)
SE
(N=34)
Level 1 (60 % VO2max )
(N=25)
Level 2 (75 % VO2max)
(N=25)
Level 3 (90 % VO2max)
(N=25)
AD (s) 174.7 (32.5) 469.5 (116.6) 100.0 (33.5) 180.0 (0.0) 180.0 (0.0) 259.2 (68.7)
SR (steps·min-1) 95.4 (18.9) 91.8 (22.6) 102.6 (35.7) 66.1 (16.3) 88.3 (17.0) 109.0 (17.8)
HRmean stable (b·min-1) 162.7 (15.1) 167.9 (15.2) 153 (16.3)# 141.0 (15.9) 163.9 (14.5) 183.8 (12.5)
HRhighest (b·min-1) 165.6 (14.7) 174.1 (14.6) 162.2 (12.0) 142.0 (15.8) 165.5 (14.3) 184.9 (12.2)
Vdisp (m·min-1) 17.1 (3.4) 14.8 (3.6) 20.5 (7.1) 13.2 (3.3) 17.7 (3.4) 21.9 (3.6)
Vheight reached (m) N/A N/A N/A 39.7 (9.8) 53.0 (10.2) 95.0 (30.8)
(N=30)* (N=16)* (N=17)*
VO2mean stable (L·min-1) 2.66 (0.75) 2.83 (0.60) 2.06 (0.36)# 2.07 (0.49) 2.62 (0.61) 3.09 (0.64)
VO2highest (L·min-1) 2.76 (0.76) 3.04 (0.58) 2.97 (0.66) 2.13 (0.50) 2.68 (0.63) 3.18 (0.65)
VO2mean stable (mL·min-1·kg-1) 37.2 (5.2) 38.5 (8.3) 30.1 (4.5)# 28.7 (6.1) 36.0 (6.9) 42.7 (7.9)
VO2highest (mL·min-1·kg-1) 38.6 (5.2) 41.4 (8.6) 39.7 (6.7) 29.5 (6.18) 36.8 (6.8) 43.9 (7.8)
Mmean stable (W·m-2) 495.0 (96.8) 519.5 (110.9) 414.5 (64.6)# 377.9 (73.2) 486.5 (86.4) 581.2 (92.4)
Mhighest (W·m-2) 495.0 (96.7) 559.0 (107.9) 547.4 (83.3) 389.7 (74.4) 498.5 (87.4) 598.6 (91.7)
*%VO2max 89¤ 95¤ 91¤ 62.5 (5.1) 78.6 (6.6) 93.6 (6.1)
*%HRmax 85¤ 89¤ 83¤ 74.3 (5.6) 86.8 (5.7) 96.9 (3.0)

39
4.2 Oxygen uptake (VO2)
The ascending durations at 13F and 31F were sufficiently long to achieve stable VO2 levels. The changes in VO2 uptake after the onset of tests with normorlized ascending time in Figures 3A and 3B indicates that the initial VO2 values were about the same from both building field tests at the self-preferred pace. The stable amount of VO2 was observed about 37.2-38.5 mL·kg-1·min-1 in the 13F and 31F buildings (Table 4, and Figures 3A and 3B). In these tests, steady VO2 values were reached between 50-60 %, and 20-30 % of the normalized ascending period in the 13F and 31F buildings, respectively. The corresponding ascent times in both cases were 1.5-2.0 minutes from the start. Stable state was not usually achieved at SE due to the short AD (on average about 1.5 min) as shown in Figure 3C. However, the VO2highest was approaching 40 mL·kg-1·min-1 at the end of the SE test, a level which was close to that achieved in the two buildings.
Oxygen uptake (VO2) during self-preferred ascents (field tests)
A B
C

40
Oxygen uptake (VO2) during controlled ascents (laboratory experiments)
D E
F
Figure 3: Oxygen uptake (VO2) patterns during stair ascents
Average oxygen uptake (VO2) pattern and intensity in the normalized time (0-100 %) during self-preferred ascents at 13F (A), 31F (B), SE (C); and controlled ascent at 60 %, L1 (D), 75 %, L2 (E), and 90 %, L3 (F). The average absolute ascending duration was 2.9, 7.8, 1.7 minutes for 13F, 31F, SE; and 3.0, 3.0 and 4.3 minutes at L1, L2 and L3, respectively.
On the other hand, the steady state of VO2 values reached about 35-40 % (1.5-2.0 min) of the total normalized ascending period after the primary rapid increase at L3 in the lab settings. VO2 values levelled off somewhat at around 75 % of normalized time. This was equal to 3.5 minute after the onset of ascent (Figure 3F). At L1 and L2, the sharp increases in VO2 values slowed down at around 55 and 45 % of the normalized time periods, respectively, and continued to increase in this relatively steady state until the 3-min long ascents. The VO2 values obtained from these three tests indicated the amount of stable oxygen uptakes related to stair ascending intensity. These values were on average below 30, above 35, and above 40 mL·min-
1·kg-1 for 60 % (L1), 75 % (L2) and 90 % (L3) of the VO2max SRs, respectively (Figure 3D-F).

41
4.3 Muscle activity
4.3.1 Electromyographic (EMG) activities during stair ascension
EMG amplitude (AMP) and ascending speed
A decrease in ascending speed was observed in all three field-tested stairways (Figures 4A-C). There was a sharp drop within the first 20-30 % of time (same time point as for VO2 stabilization) followed by fluctuations that were caused by some subjects slowing down or stopping for rest and then speeding up again (Figures 4A and 4B) at 31F. The average ascending speed dropped to 70 % of time, corresponding to VO2 reaching about 37 mL·kg-1·min-1 (close to stable state at 13F and 31F) and then stabilized in the short AD at SE (Figure 4C). The AMP results clearly showed a reduction of muscle activities over the ascending period. The ascending speeds and the AMPs for all four muscles in both test settings followed a similar decreasing pattern. There was a significant decrease in AMPs over time (p<0.01) in the Friedman test results of the related samples in all muscles measured in both settings (Figure 4).
EMG amplitudes (AMPs) during self-preferred ascent (field tests)
A B
C

42
EMG amplitudes (AMPs) during controlled ascent (laboratory experiments)
D E
F Figure 4: Muscle EMG amplitude (AMP) changes
Changes in average EMG normalized amplitudes of four leg muscles in relation to the average self-preferred ascending speeds (m·s-1) over the normalized time (10-100 %) periods at 13F (N=12) (A); and 31F (N=9) (B); only ascending speed at SE (N=17) (C); and controlled speeds at L1, L2, and L3, (D, E, and F).
The AMPs clearly showed an increase over time during ascending at the last two levels (L2, L3). However, the average amplitudes of all four muscles differred significantly in all three levels (L1, L2 and L3, p<0.05) (Figures 4D-F) in the Friedman’s analysis. The AMP results reflected the leg muscles’ workload, as they seem to be largely dependent on the ascending intensities in laboratory studies Figures 4D-F. About 3-5 % higher AMP was observed at L3 than at L1 and L2.
EMG median frequency (MDF) and ascending speed
Muscle MDF changes per unit of time significantly decreased according to the related Friedman test samples only in the lateral calf (GL) muscles measured at both 13F, p<0.05 and 31F, p<0.05 (Figures 5A and 5B). At 31F, the other calf (GM) muscle frequency change was not significant, but the p value reached 0.051 (Figure 5B). These MDF results showed consistency between the muscles and their changing patterns. The pattern of MDF change was similar between the two buildings. These reflect similar work intensities in both settings, despite the large difference in ascending durations (Figures 5A and 5B).

43
EMG median frequencies (MDFs) during self-preferred ascent (field tests)
A B
EMG median frequencies (MDFs) during controlled ascent (laboratory experiments)
C
D
E
Figure 5 Muscle median frequency (MDF) changes
Changes in average EMG median frequencies (MDF) of four muscles in relation to their average self-preferred ascending speeds (m·s-1) over the normalized time (10-100 %) periods at 13F (N=12) (A); 31F (N=9) (B); and controlled speeds at L1, L2, and L3, (C, D, and E)
The MDF changes in the normalized time (10-100 %) period differed significantly for the VL (p<0.05) and RF (p<0.05) during testing at L1 and L2, respectively, in the Friedman test (Figures 5C and 5D). On the contrary, the median frequencies of the VL (p<0.01), RF (p<0.01) and GL (p<0.05) muscles decreased significantly (except GM) during this intensive ascending exercise at L3 (Figure 5E).

44
4.3.2 Muscle activity rate change (MARC) in muscle activity interpretation squares (MAIS)
MARC points during self-preferred SR are presented in Figures 6A and 6B, for 13F and 31F, respectively. At 13F test, the MARC points were scattered mainly in the left half of the diagram between muscle “force decrease” and “recovery”, except the 80-90 % points, which were in the “muscle fatigue” squares for the four muscles’ MAIS (Figure 6A). This indicated that the onset of fatigue was adjusted by slowing the ascending speed down. On the other hand in the 31F test, the MARC points were concentrated mostly in the centre, except for GL muscle points, which were distributed along the vertical centre line compared to the other muscles (Figure 6B). In 31F, the MARC pattern (the longer ascending period) may reflect reaching a balance beween ascending workload and physical work capacity.
A 13 floor (13F) building

45
B 31 floor (31F) building
C Laboratory experiment at L3 (90 %VO2max)

46
Figure 6: Muscle activity interpretation squares (MAIS) Muscle activity rate change (MARC) points for four muscles in the normalized time (10-100 %) periods during the self-preferred ascents at 13F (A), 31F (B), and controlled ascents at L3 (C) are presented in the muscle activity interpretation squares (MAIS).
MARC points for all the four muscles during ascending at L3 in the lab experiments showed a similar pattern. Most of the values aggregated between the muscle force increase and muscle fatigue squares of each muscle diagram (towards the right half of the diagrams). Moreover, the MARC points of all four muscles at the end period (90-100 %) were concentrated in the “muscle fatigue” square (Figure 6C).
4 Correlations
Pearson’s correlation coefficient, r values showed correlations between changes in ascending speed, VO2 uptake and EMG muscle activities (AMP and MDF) within normalized time (10-100 %) during the tests on two different building stairways and L3 lab experiment (Table 5).
4.4.1 Correlations between AMP and ascending speed
At 13F, a strong positive correlation was observed between the decreased ascending speed and decreased muscle AMP of all four muscles VL, VM, GL and GM. We have observed similar correlations at the 31F as well between the decreased ascending speed and muscle activations of all four muscles VL, RF, GL and GM (Table 5).

47
Table 5: Pearson’s correlation coefficient, “r”
The Pearson’s correlation coefficient “r” and statistical significance “p” values for ascending speed (AS) versus (vs) EMG amplitude (AMP) and median frequency (MDF), as well as oxygen uptake (VO2) versus average AMP and MDF are presented for each muscle at 13F, 31F buildings, and L3 in the lab.
# VM muscle was measured during the 13F test and RF during the 31F and laboratory tests.
*p<0.05 and ** p<0.01
4.4.2 Correlations between MDF and ascending speed
At 13F, there was a strong negative correlation between the decreased speed and a small increase in MDFs for both thigh muscles, VL and VM. On the other hand, there was a strong positive relationship between decreased speed and MDF for the GL (r = 0.75); no relationship was found for the GM muscle (Table 5). Negligible negative correlations were found between decreased speeds and unchanged MDFs throughout the ascending period for three muscles VL, RF and GM. On the contrary, for GL (r = 0.92), the correlation was strongly positive showing decreasing speed and decreasing MDF.
4.4.3 Correlations between VO2 and AMP
At the 13F, the VO2 and AMP of all four muscles showed strong negative correlations. The VO2 increased while muscle AMPs were decreased during self-preferred AS. At the 31F, there was similar pattern with strong negative correlations existed between increased VO2 and decreased muscle activations over the ascending period for all muscles at 31F (Table 5). The observed pattern is reflecting the continued VO2 uptake while muscles start getting fatigued and it was being compensated by reduction in speed when ascending in the buildings. In the constant ascending at L3 test, there were no significant correlation observed at between VO2 and AMP. The correlation coefficient, r values were positive which are reflecting the increased AMPs (Table 5). A significant positive relationship was
13F 31F L3
Muscles AS vs AMP
AS vs MDF
VO2 vs AMP
VO2 vs MDF
AS vs AMP
AS vs MDF
VO2 vs AMP
VO2 vs MDF
VO2 vs AMP
VO2 vs MDF
VL 1.00** -0.7* -0.95** 0.68* 0.90** -0.13 -0.99** 0.36 0.56* -0.14*
VM/RF# 0.88** -0.88** -0.91** 0.77** 0.84** -0.23 -0.99** 0.15 0.06 -0.06
GL 0.82** 0.75* -0.81** -0.91** 0.88** 0.92** -0.95** -0.90** 0.15* -0.05
GM 0.86** -0.14 -0.97** 0.36 0.88** -0.16 -0.96** 0.10 0.09 0.10

48
observed between VO2 and the VL muscle (r = 0.56) when both the VO2 and AMPs increased significantly.
4.4.4 Correlations between VO2 and MDF
A high negative correlation (r = -0.91) was observed between VO2 and the GL muscle MDF. However, moderate correlations (r = 0.68 and 0.77) were observed for VL and VM at 13F. Similarly, at 31F GL showed a strong negative relationship (r = -0.90) between VO2 and MDF. There were no correlations observed in other three muscles reflecting that the MDFs were unchanged.
At L3, there were no significant correlations observed between the VO2 slow component increases with MDFs too. This small and negative relationships between VO2 and leg muscle frequencies when VO2 values were increasing and reaching a steady state, while three muscle MDFs decreased significantly at L3, except GM (Table 5).
4.4.5 Correlations between VO2 and heart rate (HR)
The highest correlation was observed between HR and VO2 in the 31F (r = 0.65). In the SE and 13F, they were not so highly correlated, the r = 0.50 being and 0.32, respectively. However, the p values were <0.01 for all three test sites during the subjects’ preferred asceding speeds. During the observations of the median subjects’ HRs, I found that the work intensity was moderate during ascending the 13F, and that the HR increase was steady during ascending 265 steps. During the short SE ascension, the subjects were able to see the destination and climbed the steps with a burst of intensity. In the beginning of the 31F test, there was an exponential increase in HR with a very sharp development followed by a slow increase untill the end of ascending the 677 steps. Simultaneouly, VO2 grew exponentially under the first 1-2 minutes and then stabilized at the level of of about 40 mL·min-1·kg-1.
On the contrary, high corelations were observed between VO2 and HR time normalized values, r =.865, while both parameters increased during the high intensity exercise of the L3 experiment in the laboratory.

49
5 Discussion
The present study analysed the physiological limitations including VO2, HR and muscle performance, and how these contribute to the physical performance required for a successful evacuation. The aim of the joint analysis of the VO2 and EMG results was to determine whether stair ascent endurance and speed reductions were related to VO2 or local muscle fatigue (LMF); moreover, to determine how LMF in the legs influenced the stair ascending performance. Physiological performance and limitations were summarized by calculating the stair ascending energy expenditure in relation to ascending height and presence of landing; and by quantifying the leg muscle performance and constraints from two different situations: 1) self-preferred, and 2) controlled ascending step rates. This was done in order to observe the effects of muscle workload on evacuation speeds and VO2.
5.1 Ascending duration (AD) and step rate (SR)
The participants managed the ascent at an average pace of 92 steps·min-1 in order to reach the top of the 31F building with a height of 109 m and 677 steps (3 landings/floor) within less than eight minutes. In contrast, in the 13F building with 268 steps (13F, 2 landings/floor), the average AD was just below three minutes for the 48 m. The participants managed to ascend the 33 m high SE without landings within less than two min at their self-selected SR. The vertical displacement was highest about 20.5 m·min-1 at the 33 m long SE compared to the 13F and 31F (Table 4) buildings due to the time spent on the landings (Delin et al. 2016). Thus, it took more time to cover the same vertical distance in high buildings than in the short SE. Anaerobic capacity was enough to cover the distance before reaching exhaustion.
The ADs were longer at 13F and 31F and allowed micro breaks, thus avoiding exhaustion, which involves both anaerobic and aerobic capacities. They seem to have affected the performance, which was reflected in the speed reductions curve because of the possible onset of muscle fatigue. The onset of fatigue most likely resulted in the speed reductions. The reduction of ascending speed was moderate in the 48 m building with one landing (13F) and short ascent duration (about 3 minutes). Simultaneously, reduction of ascending speed in the first minute was

50
abrupt in 31F with two landings between floors and a relatively long AD (about 8 minutes), and on SE without a landing, a short AD (<2 minutes) (Delin et al. 2016) (Table 3). A previous 20-level building study showed that ascending speeds decreased continuously for the first 13-14 levels (Chen et al. 2016).
In the laboratory experiment, all (25) participants managed to keep ascending for the first two, 3-min durations (L1 and L2) without major cardiovascular strain and exertion. But only two-third of the subjects (N=17) managed to sustain ascending for the 5-min duration at the L3 speed, which was considered to be an extremely hard task according to the subjects’ RPE average value of 18. An ascending evacuation model was developed based on individual physical capacity data from our laboratory study (Papers I and III). The SR for 90 % of the VO2max ranged from 68 to 133 steps·min-1, while the average was 109 steps·min-1. At that SR, subjects managed to ascend on average 95 m on the stair machine in 4.32 minutes (21.1 m·min-1). Butts et al. (1993) used a different step machine. In their study, subjects climbed at a similar SR of about 112 steps·min-1 for 5-min. The average VO2highest reached 42 mL·min-1·kg-1 and the HRhighest peaked at 175 b·min-1. They also found that in 5-min long ascents with SRs of about 70 and 84 steps·min-1, the VO2highest reached about 28 and 35 mL·min-1·kg-1, respectively, while the HRhighest reached 135 and 150 b·min-1, respectively (Butts, Dodge, and McAlpine 1993). The subjects managed the SR above 92 steps·min-1, which was ≥ SRs at L2 (75 % of VO2max) when ascending in the13F and 31F buildings. This could be possible to continue for a long duration. For evacuation in short vertical distances, a double step is recommended. In order to cover longer distances, single step would be an advantage (Aziz and Teh 2005).
5.2 Oxygen uptake (VO2) and heart rate (HR)
The ascending durations (ADs) at 13F and 31F appeared to be sufficient to reach cardiorespiratory steady state (Figure 3A and 3B) as reported in previous studies (Boreham, Wallace, and Nevill 2000; Teh and Aziz 2002; Williams-Bell et al. 2010). Usually, a steady state of VO2 uptake measurement is achieved within 2-3 min of any intensive activity unless it exceeds a subject’s physiological limits, that is, his or her LT (Saunders et al. 2000; Whipp and Wasserman 1972). In the results presented in this dissertation, the VO2 values might also have reached a stable state at low SR in the first two lab tests, 3-min ADs (L1 and L2) (Figure 3D and 3E). However, the VO2 values were driven to stable states after 70 % of the normalized time at L3, which was also ≈3 min of this maximal 5-min duration (Figure 3F).
51
The mean relative and absolute VO2highest values reached between 39.0-41.0 mL·kg-
1·min-1 and between 2.76-3.04 L·min-1, respectively, during ascent in all three public stairways. The HRhighest was between 153-168 b·min-1. Aziz and The’s VO2 results showed about 2.08 L·min-1 and an HR of 154 b·min-1 at 100 single steps.min-1 (Aziz and Teh 2005). The American College of Sports Medicine (ACSM) guidelines and the largest aerobic capacity database present VO2max and HRmax for different age groups and genders. The VO2max and HRmax averages of about 43.6 mL·kg-1·min-1 and 182 b·min-1, respectively, can be used for comparison (Loe et al. 2013; ACSM 2010). Based on these two sources, the efforts made by our subjects reached about 89, 95, and 91 % of VO2max during their preferred speeds at 13F, 31F, and SE conditions, respectively. The HRhighest reached 85, 89, and 83 % of HRmax for ascending 13F, 31F, and SE, respectively. According to the ACSM guidelines, more than 60 % of HRmax is considered to be vigorous activity (ACSM 2010). That the %VO2max was higher than the % HRmax indicates that the preferred ascending speed was tolerable in terms of HR level. In another study that involved rescuing six victims and climbing six flights of stair for 5 minutes, the subjects’ VO2max rose to 44.0 mL·min-1·kg-1 (83 % of their VO2max) (von Heimburg, Rasmussen, and Medbo 2006). In a study by Teh and Aziz, the intensity of ascending 12 floors (180 steps) reached 83 and 89 % of VO2max and HRmax, respectively (Teh and Aziz 2002).
In the lab studies, the average VO2mean stable and HRmean stable of 42.7 (7.9) mL· min-
1·kg-1 and 183.8 (12.5) b.min-1, respectively, were observed at L3. However, the subjects reached their VO2mean stable and HRmean stable on average 37.2-38.5 mL·min-
1·kg-1 and 162.7-167.9 b.min-1, respectively (≥85 % of average maximal capacities reported in the databases), when they were able to maintain their preferred ascending pace at 13F and 31F building until the end. The stable VO2 and HR values for 13F were equal to L2 SR (75%), but they were higher at 31F. The intensity of these field study step rates were equal or above the VT. In the field tests, a tolerable ascending speed was between 92 and 95 steps·min-1 in order to reach the top of 31F (3 landings/floor) and 13F (2 landings/floor) buildings, respectively, while avoiding exhaustion. The duration was prolonged by slowing the speeds due to hyperventilation while the subjects were ascending at their maximum speed in beginning (Vogiatzis et al. 1996). The phenomenon was opposite in the end of the L3 lab test.
In contrast, the VO2highest and HRhighest means (SD) in the L3 lab experiment reached values of 43.9 (7.8) mL·min-1·kg-1 and 184.9 (12.2) b·min-1, respectively, which were around 94 and 97 % VO2max (46.7 mL·min-1·kg-1) and HRmax (190 b·min-1), respectively (Table 4). The VO2highest ranges were between 30.7 to 58.3 mL·min-
1·kg-1. However, the obtained VO2highest values were equal to the other reported VO2max of previous studies (von Heimburg, Rasmussen, and Medbo 2006; Loe et al. 2013). Several studies also have suggested that the human endurance limit regarding

52
maximal VO2 uptake is about 41.0 to 45.0 mL·kg-1·min-1 for an average (80 kg) man during heavy work lasting longer than 20 min (Lusa et al. 1993; Davis et al. 1982; Gledhill and Jamnik 1992; Bilzon et al. 2001; Sothmann et al. 1992). In the lab at L3 test, eight subjects were unable to endure 5-min because of exhaustion, which presumably prevented them for reaching the VO2highest to their VO2max (Paper III).
5.3 Metabolic rate (M)
Work intensity is reflected like VO2 also in M values, which were high in the self-preferred ascending pace. The Mmean stable and Mhighest values observed ranged from 500-600 W·m-2. Activities that have Mhighest values in this range are classified, according to the International Organization for Standardization (ISO no. 8996), as having the most strenuous workloads for the general population (ISO 2004). In the lab experiments, the average Mhighest was also about 600 W·m-2 (range 424-764 W·m-
2) during ascending at ≈90 % of VO2max. The Mhighest values found in this study were equal, and the HRhighest values were higher than the highest values suggested for 5-min duration work at a similar intensity. Additionally, it has been shown in another study that a work intensity of about 475 W·m-2 corresponding to ≈70 % of VO2max, can be performed for up to 15-20 minutes (Holmer and Gavhed 2007), which is similar to our lab experiment, L2 (Table 4). Based on previous research, the present analysis suggested that participants could manage ascending for 2-6 minutes at 90 % of VO2max and constant SR.
5.4 Muscle EMG amplitude (AMP) and median frequency (MDF)
Oxygen uptake was not the only physiological capacity that limited the performance in these dynamic and high intensity activities. Muscle activities also played a role in the two types of ascending capacity as evidenced in this research. EMG muscle activity results clearly distinguished the two types of ascending strategies. Both the AMP and MDF showed a decreasing and stable pattern during self-preferred ascent in the field. In the laboratory during controlled ascent, MDF also decreased but AMP increased. The significant decrease of AMP and unchanged or minimal decrease in MDF in the two buildings (13F, 3F) reflects fatigue avoidance by reducing working intensity. These MDF results supported that motor control during a slow dynamic contraction at low force level does not influence the power spectrum (Christensen et al. 1995). Sustaining maximum preferred pace was possible only for

53
about one minute (Figures 4-6). The early ascents (first one min) can be related to the limitations of oxygen transportation or ventilatory threshold and anaerobic processes (Barstow 1994). However, a significant AMP decrease was associated with the reduction of ascending rate after 10 to 20 % of average time and decreased power muscle production in the self-preferred condition. The results suggest that the subjects counteracted fatigue by reducing their speed and power productions in order to complete the ascent (Figures 4A and 4B). As observed, the possible body postural adaptations likely contributed to modifying the self-preferred ascending pace. The magnitude and direction of muscular force supposed to be changed continuously with body posture during dynamic ascending velocity (Merletti, Knaflitz, and De Luca 1990; Farina 2006). Subjects might have taken the advantages of the handrails by grabbing and increased the contribution of the upper limb muscles when approaching exhaustion in the field. In the lab test, AMP increased significantly at all three controlled ascending speeds (Figures 4D-F). The MDFs decreased (Figure 5E) significantly at L3, while only the VL and RF MDFs shifted to lower frequencies at L1 and L2 (Figures 5C and 5D), respectively. Neither of the leg muscle exertions were very high for the 3-min duration tests in L1 and L2. The EMG results for these two lower SRs infer that workloads and durations were insufficient to cause fatigue, especially for the calf muscles. The significant decrease in MDF in the lab and the non-significant MDF results in the field support Scheuermann et al.’s findings of a progressively decreasing MDF during fast ramp cycling and a constant MDF during slow ramp cycling exercise (Scheuermann, Tripse McConnell, and Barstow 2002). At L3 lab study, a simultaneously significant AMP increase and MDF decrease indicated leg muscle fatigue. Another EMG study on cycling also showed that MDF changes are related to changes in movement kinematics, and individual postural adaptation (Dingwell et al. 2008). The subjects in the lab study tried to cope with the leg LMF by postural modifications and adaptive strategies, but with limited success. They tried to incline forward and partially transferred their body weight through their forearms on to the handrails to reduce the workload of the leg muscles in both the field and lab tests. The upper limb support may have confounded the lower limb muscle EMG results. In spite of contradictory results in the MDF and speed relationship, they still support that AMP reflects the speed reduction due to strong positive correlations between AMP and AS.
5.5 Muscle activity and oxygen uptake (VO2)
The stair ascending results in the field indicate that some relationships exits between VO2 slow component rise and work rate (Cannon et al. 2011; Jones et al. 2011). The

54
VO2 values were still in the process of reaching a stable state at the end or at the point of exhaustion during an ascent. A steady state VO2 was not achieved immediately. We observed an initial rapid VO2 increase, and reached a steady state after ascending to a duration of about 1.5-3.0 minutes, which continued with slow growth (Figure 3). During exercise at higher intensities, VO2 continued to grow slowly only after 2-3 min (Barstow 1994; Whipp and Wasserman 1972). Both the field (Paper II) and laboratory experiment (Paper III) provided evidence that neither self-preferred nor study-controlled ascent affect initial rapid VO2 uptake pattern.
The higher AMP observed in the beginning during preferred pace was related to the high velocity movement, which required progressive recruitment of fast twitch (type II) fibres for the equivalent durational VO2 values (Borrani et al. 2001). During heavy exercise, both type I and II fibres are usually recruited at the very beginning of the exercise. The additional type II fibres motor units need to be recruited to maintain power output for sustaining the ascent during the impaired excitation and contraction coupling due to the onset of fatigue and VO2 slow component rise (Krustrup et al. 2004; Sabapathy, Schneider, and Morris 2005). Thus, the ascending AMP end period results do not agree with the progressive recruitment of fast-twitch fibres for the simultaneous VO2 slow component rise in the field tests. This may be caused by the selection of self-preferred and low ascending speed.
In the lab, the average AMP (Figures 4C-E) increase was slow and relatively stable after an initial increase (within 0.5-1.0 min) until the end of ascent. The initial increase of AMP can be attributed to the accumulation of the motor units required to continue ascending with the given intensity indicating a connection to the initial VO2 component rise (Scheuermann, Tripse McConnell, and Barstow 2002). The increased VO2 could have been caused by the progressive recruitment of fast-twitch motor units for the compensation of already reduced power output from fatigued fibres (Shinohara and Moritani 1992). This would increase the energy demand (Saunders et al. 2000). A high supply of oxygen and energy are required to meet the demands for the fast rate of muscular contractions during stair stepping at high SR (Kang et al. 2004). This mechanism also provokes the growth of lactate values to a high level and progressively leads the VO2 rise, and later to a steady state as well (Roston et al. 1987). The AMP increments at the start of the ascents (Figures 4D-F) were similar to the primary and rapid VO2 increasing component followed by steady state and slow component increase at L3 (Figure 3F). This indicates a relationship between the AMPs increase and VO2 slow component rise during controlled ascending SR among different ascending intensities (Figures 3 and 4). The current study results suggest that the onset of muscle fatigue was a prerequisite and the additional recruitment of inefficient muscle fibres may not be required, rather than the decrease of work efficiencies in the fatigued fibres and slow increasing VO2
(Jones et al. 2007; Zoladz et al. 2008).

55
5.6 Muscle activity rate change (MARC) in muscle activity interpretation squares (MAIS)
The present thesis showed the changes of both AMP and MDF as muscle activity rate change (MARC) percentile points during stair ascents in order to observe the development of muscle fatigue over time. The MARC percentile points per unit time support the interpretations of muscle activities in both ascending strategies. Firstly, the muscle AMP and MDF rate changes at self-preferred ascent in both buildings (Figures 6A and 6B) showed differences due to the ADs and building heights. This difference may have been the reason for the self-preferred pace, and the fact was that the pace was not kept at a steady state, but fluctuated depending on fatigue development and the recovery was achieved. The AMPs in both buildings decreased reflected the reduced muscle power production leading to continuation of ascent at slower rate.
The appearance of 80-90 % period MARC points in the “muscle fatigue” square (right lower sections of Figure 6A diagrams) in MAIS indicated that subjects reached fatigue after ascending an average 2.5 min on 13F. Notably, the MARC points represent 90-100 %, which fall into either muscle force decrease or recovery, reflecting decreased AMPs. The majority of the MARC points were located in the areas of decreased AMPs showing, up in the left half of the MAIS and partly sharing all four squares for 13F buildings (Figure 6A). This indicates that the lower muscle power production was related to the decrease in ascending speed.
In the 31F test, there was a different distribution pattern of the MARC values. They clearly appear to be more or less centred (MAIS, Figure 6B) in this AD test that was three times longer than in the 13F of the MAIS, while they seldom appear in the fatigue zone. The longer time spans of each individual time-normalized period involve many more ascending strategies and events, such as slowing down, accelerating and grabbing handrails for support, so that the MARC averages were small and come close to “no-change” in the centre point of the MAIS (Paper II). This indicates that when studying fatigue development in detail, shorter periods of time normalization may be useful. “No change” could be interpreted as subjects were still able to ascend at lower speeds by reducing muscle power to prevent fatigue. The subjects adopted multiple strategies to avoid getting exhausted. This indicated that they had full controll of their ascending task while it took on average about 7.8 minutes to reach the top. This discussion on MARC was supported by significantly positive correlation between AMPs and speeds. The correlations of other muscles indicate negligible changes in muscle activity level, or in the case of negative correlations with speed reflecting recovery in the self-preferred situation.

56
An opposite trend of the MARC points was observed during the controlled ascending pace study where the most and last 90-100 % percentile points were concentrated in the “muscle fatigue” square on the MAIS (Figure 6C). The MARC points displayed on the MAIS also provided evidence that the leg muscles were fatigued even after ascending about two minutes in the L3 test. I observed that some points in the starting period were in the “force increase” square, which suggested that subjects were strong enough to exert a high force at the beginning of the ascent. Most of the MARC points appeared in the “muscle fatigue” square because the subjects had to keep ascending with a constant high speed, which led to exhaustion in the end (Paper III). The interpretations above appears reliable between the two ascending strategies. The subjects had to comply with the selected speeds driven by the stair machine. They were unable to slow it down except through minor weight shifts to the arms. In these circumstances, CRC and LMF combined constrain a person’s ascent up to a certain height and affect evacuation duration. Consequently, a person may only be able to ascend up to about two or three minutes at the maximum preferred speed (Costill, Wilmore, and Kenney 2012 ; Barstow 1994). One might need to slow down or select an affordable pace soon after the onset of an activity in order to continue longer distances.
5.7 Overall comparisons between self-preferred and controlled step rate (SR)
The high intensity ascent at L3 (90 % of VO2max) was above the threshold for prolonged activity where the pumping capacity of the heart reached its upper limit at about 97 % of HRmax. The HRmax could not be maintained for a long time and constrained ascending capacity at L3, which is also evidence of reaching the ventilatory threshold. The L3 stair ascent, which was set to be sustained over 5 min above the ventilatory threshold, met a forced early cessation. Two factors affect continuous ascent for long durations or durations above 5 minutes. First, the intensity of the activity needs to be stable at a level no greater than the ventilatory threshold. Second, the VO2 uptake and transportation needs to meet the working muscle demand (Barstow 1994). Otherwise, the anaerobic processes will result in LMF and affect work capacity. When any of these conditions occur, the ascension stops, and the evacuation duration is reduced. The whole body energy system reaches its anaerobic capacity limit or threshold within 2-3 min after the onset of testing (Whipp and Wasserman 1972; Barstow 1994). The oxygenated blood flow is insufficient to meet the increasing energy demands of the leg muscles for aerobic metabolism due to the low cardiac output,

57
specifically, the stroke volume (Kravitz and Dalleck 2002). The inability to supply an adequate energy transportation system after using up the stored ATP and glycolysis (a shift from anaerobic to aerobic process) means that a reduction in work rate was obviously needed to minimize the energy demands of the high SRs in the controlled pace lab tests. The discontinuations indicated the insufficient energy supply and recovery for the aerobic metabolism (mitochondrial respiration) of the local muscles due to high repetitive activities and progressive hyperventilation (Vogiatzis et al. 1996). The above discussion suggests that the development of muscle fatigue, which was enhanced by EMG results with MAIS. This indicates the possible exhaustion pathways due to LMF and CRC during high-intensity ascent at a controlled pace. These combined physiological constraints may inhibit the VO2
from reaching the subjects’ VO2max due to a high repetitive and excessive workload that brought on the exhaustion earlier and in turn, limits ascending performance (Ben-Ezra and Verstraete 1988). Thus, the results of this study infer that evacuation at individual maximum and constant intensity will last between 2 and 6 minutes.
The lower %HRmax achieved in the self-preferred tests in the field proved that HR was kept at an affordable level. The subjects were forced to slow down their preferred SR in the field, which appeared to be above the VT. Ascending and leg muscle energy requirements need to be maintained at a tolerable HR level, which is below or equal to the threshold for a prolonged ascension in the self-controlled situation. The subjects were unable to sustain ascending at their maximum speed and maintain the initial HR level. They were only able to continue ascending at a slower speed (Figure 3) with decreased muscular power and a stable HR (Table 3) (Stegemann 1981). The working power reduction of the muscles was related to the reduction of peripheral and whole body energy demands, as well as the change of energy transportation system from anaerobic to aerobic (Costill, Wilmore, and Kenney 2012 ). A few cases of short momentary stops and postural adaptations were observed, as Dekerle et al. mentioned; nevertheless, there was always a continuous ascension. The subjects’ continuous postural adaptations and ascending modifications can be due to declining functional efficiency of muscle (Jones et al. 2007; Cannon et al. 2011; Vanhatalo et al. 2011). The fluctuated ascending rates reflected in the reduction in muscular power production, which suggests increasing the ascending time in the building stairs (Dekerle et al. 2015).
The results suggest that ascending a long vertical distance is possible at high SRs, but the activity can end quite quickly due to fatigue. A high number of flights, and of steps in a flight, increases the total energy demand, and thus constrains a person’s maximum evacuation speed to be within one minute. If the person tries to maintain the pace always at submaximal level, the maximum duration of continuous ascent at about 80-90 % of maximal capacity is expected to last about 9-12 minutes before reaching exhaustion (Holmer and Gavhed 2007). Such efforts still require some

58
periods for recovery to delay the leg LMF during ascension at self-preferred pace. A tolerable step rate of about 92-95 steps·min-1 extends a person’s ascending endurance at the self-preferred pace and VO2 reaches a stable state around 37-38 mL·kg-1·min-1. Landings or resting planes allow micro pauses and help a person to reach a refuge area before fatigue or exhaustion sets in and forces the person to stop. A stairway with landings increases a person’s duration because he or she is covering less vertical height and is able to get relief from muscle fatigue and exhaustion. All this enables longer performance.
5.8 Limitations and recommendations
The ascending speeds achieved in the field studies may not represent a real evacuation situation. Humans’ intuitive responses during panic situations may be to choose their maximal possible speed to ascend in order to reach a safe place during evacuation. The subjects’ speeds in this research in the lab were pre-determined and controlled experiments to better simulate the real evacuation situations.
Blood lactate (BLa−) was not measured in either of the self-preferred or controlled speed ascending tests. One recommendation for future laboratory and field stairways tests would be to measure the BLa− at predefined time intervals to support the EMG results. Such measurements would strengthened the discussions of muscle activities as well as confirm the presence of leg muscle fatigue during evacuation.
The current research averaged EMG AMPs and MDFs for fatigue analysis in each 10th percentile period of the whole duration, which included both muscle activations and deactivations. However, it would be preferable to analyse EMG data, especially during each cycle of the dynamic movement. Stair ascending EMG should be analysed a few step cadences from each normalized time interval.
More controlled studies are needed to examine the stair ascending physiological limitations and endurance related to age, gender and body weight in order to improve our present physiological model. Moreover, it is necessary to determine the ascending endurance, energy expenditure and muscle performance at different capacity levels (percentage of subject’s VO2max) until exhaustion. The present research suggest that the study of progressive and gradual increments of step rate starting below the ventilatory threshold can potentially delay the onset of fatigue and increase the duration as well as the vertical height. Further studies that synchronize EMG with a motion capture system and force plate can elucidate stair climbing kinematics and kinetics in the lab settings. A lab study also allows detecting and analyzing sequential muscle activation during each step.

59
5.9 Societal relevance of stair ascending work capacity
These field tests and laboratory experiments revealed the physical work capacities required for and the limitations of a successful stair ascending evacuation. More precisely, the stair ascending cardiorespiratory endurance, maximal aerobic capacity, and muscle activity were evaluated in both self-preferred and controlled situations.
From a health perspective, these capabilities are worth assessing. The results provide, in part, up-to-date information about the fitness of the general population and people’s ability to carry out ascending evacuations at different building heights and from underground metro stations during any emergency, since ascending stair is a part of our daily life activities.
This work capacity information increases our mass and individual awareness of our own level of fitness in relation to managing a sudden or unexpected physical challenge in a survival situation in order to avoid a fatal accident. It allows local authorities to make adequate preparations for first responders so that they can face the challenges and meet the demands of their occupation. The information is helpful for the proper management and planning of evacuation tasks to reduce risks and vulnerability during emergencies.
The beneficial effects to health and fitness of short and intermittent bouts of exercise throughout the day have yet to be identified. Stair climbing is considered to be one of the minimally required exercises in daily life to improve cardiovascular fitness (Teh and Aziz 2002; Boreham, Wallace, and Nevill 2000). Making it a regular habit of taking the stairs is a feasible, convenient and cost-effective exercise method for us to remain physically active in everyday life. It can help to prevent obesity and reduce sedentary work-related physical problems globally (Ilmarinen et al. 1978; Boreham, Wallace, and Nevill 2000; Donath et al. 2014).
The combined method applied in this research that includes muscle activity and oxygen uptake analyses was found to be reliable for assessing physical capacities and constraints in challenging situations. The muscle activity interpretation squares (MAIS) that were developed to plot the muscle activity rate change percentile points (MAR) make up an effective fatigue analysis tool using EMG data. It is useful to explain physical loads that cause musculoskeletal disorders in our daily lives and workplaces and increase financial and societal costs (Gallagher and Schall 2017).

60
6 Conclusions
The field tests revealed that oxygen uptake (VO2) and heart rate (HR) reached 89 to 95 % and 89 to 96 %, respectively, of human capacity based on the database. In the lab, the %VO2max and %HRmax reached 94 and 97%, respectively, during climbing at 90 % of VO2max (L3). This provides evidence that the stair ascension intensity was higher at the controlled pace at L3 than the self-preferred pace. The average VO2highest reached 39-41 during the field and 44 mL·kg-1·min-1 during the L3 tests. VO2 reached a steady state about 37-38 mL·kg-1·min-1 during ascents in the 13F, 31F buildings, and 60, 75 and 90 % VO2max related step rate (SR) at the lab, except during the short ascent at the stationary escalator (SE). Neither the self-preferred nor the controlled SR affected the VO2 uptake patterns. The EMG AMP and VO2
showed small increasing relationships at L3. The maximum duration of continuous ascent can last about 2-6 minutes at 90 % of maximum capacity or constant SR at 109 steps·min-1. High repetitive activities reached 97 % of subject’s HRmax evidenced by hyperventilation and insufficient recovery, which caused an imbalance between the energy availability and local demand resulting in muscle fatigue. The significant AMP increase and MDF decrease confirmed LMF in the leg, which forced the subjects to quit the ascents before 5-min and limited the duration to 4.32 minutes; thus, the VO2 prevent from reaching the VO2max at controlled SR. In contrast, a tolerable SR was found to be about 92-95 steps·min-1 at the self-preferred ascents.The significant AMP decrease and unchanged MDF indicated muscle power reductions due to diminished working efficiencies during ascending in the buildings stairways. The fatigue recovery by muscle power and speed reduction was reflected in the muscle activity interpretation squares (MAIS) during self-preferred pace. In contrast, the MARC points appeared in the muscle fatigue squares during controlled pace. These suggests that MARC and MAIS are suitable to observe muscle activity changes during dynamic tasks over time. The subjects’ ability to sustain their maximum self-preferred ascending pace was very short. The reduction of ascending speeds was required to achieve tolerable SR, which prevented the fatigue and consequently delayed exhaustion. Thus, the subjects increased their tolerances and reached the top of the 13F and 31F buildings as well as the SE. The controlled step rate results at 90 % VO2max infer that leg LMF significantly contributes along with cardiorespiratory components to constrain the stair ascending durations and oxygen uptake capacities.

61
7 Acknowledgement
I generously appreciate everyone who has assisted and supported me throughout the journey so far. In particular, I am grateful to and I sincerely thank …
Chuansi Gao, my main advisor for believing in me and involved me into different projects in 2012. I admit that this work is a result of your significant presence and contributions. You have made myself to think on research in constructive way. Truly, you have the solutions for the most of my problems. Thanks a lot for your encouragement, and for understanding me.
Kalev Kuklane, my co-advisor, thanks for your research ideas and significant supports, which were phenomenal. In fact, you have paved the way for this thesis. Thanks for your critical comments, which always kept me on the track.
Michael Miller, my co-advisor, thanks so much for giving me many quality-full and effective sessions in your office at HSC, in Lund to understand the electromyography (EMG). Your guidance into the realms of EMG and statistics was intriguing. Thank you so much for your motivational words and shared knowledge.
Karl Fridolf and Enrico Ronchi, the project leaders from the Department of Fire Safety Engineering, I express my gratitude for involving me into this project.
Mattias Delin (DeBrand Sverige AB) and Johan Norén (Brand & Riskingenjörerna AB), the cooperation partners, I appreciate your valuable supports during the field tests and provision of the related data. Moreover, Karin Lundgren-Kownacki and Sofia Månsson, many thanks for your help during data collection in the field.
Karin Lundgren-Kownacki, it is always great to share the office with you. Thanks for the company and instant support with the Swedish.
I would like to express my gratitude to all the members in the Department of Design Sciences, especially Ergonomics and Aerosol Technology division. Your company and co-operation are the sources of my positive energy. My PhD colleagues in the department, big thanks for your smileys, talks and heart-warming friendships, which are encouraging too. I love to share moments and cheer with you.
Eileen Deaner, thanks so much indeed for editing the thesis. You have made the thesis comprehensible.

62
Robert Olsson, I acknowledge your countless and unforgettable technical helps with computers and software.
Karin Öhrvik, Susanne Nordbeck, Hajnalka Bodnar, Ilnaz Golestani and Jessica Sellergren, I admit and appreciate your invaluable administrative supports in many occasions.
I greatly miss my family, especially my late father Narayan Chandra Halder, in every step of my life, but his valuable advice are still resonating and directing the paths. I express distinctive gratitude to my mother Reba Rani Kirttania for her sacrifices and support for my education. Love you, ‘Ma’. My sister Oyendrila thanks for the best wishes and understanding me. You all are the core existence of my life.
Last but not the least, my thanks and love go to my better half, Urmila for enduring me, which contributed to make this work possible. Dear, your love and care have made myself complete.
Finally, I am grateful to the volunteers for their contributions. I would like to acknowledge and thanks to the sponsors: the Swedish Fire Research Board (Brandforsk) and the Swedish Transport Administration (Trafikverket) of the whole project. The sponsors had no role in the study design, data collection and analysis, decision to publish, or preparation of the thesis.

63
8 References
ACSM. 2010. American College of Sports Medicine, ACSM's guidelines for exercise testing and prescription. 8 ed. Philadelphia, USA: Wolters Kluwer; Lippincott Williams & Wilkins.
Andriacchi, T. P., G. B. Andersson, R. W. Fermier, D. Stern, and J. O. Galante. 1980. "A study of lower-limb mechanics during stair-climbing." J Bone Joint Surg Am 62 (5):749-57.
Arias, S., E. Ronchi, J. Norén, M. Delin, K. Kuklane, A. Halder, and K. Fridolf. 2016. "An experiment on ascending evacuation on a long, stationary escalator." In 14th International Conference and Exhibition on Fire Science and Engineering (Interflam), 2016. Windsor, United Kingdom
Asplund, D. J., and S. J. Hall. 1995. "Kinematics and myoelectric activity during stair-climbing ergometry." J Orthop Sports Phys Ther 22 (6):247-53. doi: 10.2519/jospt.1995.22.6.247.
Astorino, T. A. 2009. "Alterations in VOmax and the VO plateau with manipulation of sampling interval." Clin Physiol Funct Imaging 29 (1):60-7. doi: 10.1111/j.1475-097X.2008.00835.x.
Aziz, A. R., and K. C. Teh. 2005. "Physiological responses to single versus double stepping pattern of ascending the stairs." J Physiol Anthropol Appl Human Sci 24 (4):253-7. doi: 10.2114/jpa.24.253.
Barstow, T. J. 1994. "Characterization of VO2 kinetics during heavy exercise." Med Sci Sports Exerc 26 (11):1327-34.
Bassett, D. R., Jr., and E. T. Howley. 2000. "Limiting factors for maximum oxygen uptake and determinants of endurance performance." Med Sci Sports Exerc 32 (1):70-84.
Bassett, D. R., J. A. Vachon, A. O. Kirkland, E. T. Howley, G. E. Duncan, and K. R. Johnson. 1997. "Energy cost of stair climbing and descending on the college alumnus questionnaire." Med Sci Sports Exerc 29 (9):1250-4.
Beltz, N. M., A. L. Gibson, J. M. Janot, L. Kravitz, C. M. Mermier, and L. C. Dalleck. 2016. "Graded Exercise Testing Protocols for the Determination of VO2max: Historical Perspectives, Progress, and Future Considerations." J Sports Med (Hindawi Publ Corp) 2016:3968393. doi: 10.1155/2016/3968393.
Ben-Ezra, V., and R. Verstraete. 1988. "Stair climbing: an alternative exercise modality for firefighters." J Occup Med 30 (2):103-5.
Bilzon, J. L., E. G. Scarpello, C. V. Smith, N. A. Ravenhill, and M. P. Rayson. 2001. "Characterization of the metabolic demands of simulated shipboard Royal Navy fire-fighting tasks." Ergonomics 44 (8):766-80. doi: 10.1080/00140130118253.
64
Boreham, C. A., W. F. Wallace, and A. Nevill. 2000. "Training effects of accumulated daily stair-climbing exercise in previously sedentary young women." Prev Med 30 (4):277-81. doi: 10.1006/pmed.2000.0634.
Borrani, F., R. Candau, G. Y. Millet, S. Perrey, J. Fuchslocher, and J. D. Rouillon. 2001. "Is the VO2 slow component dependent on progressive recruitment of fast-twitch fibers in trained runners?" J Appl Physiol (1985) 90 (6):2212-20.
Burnley, M., G. Davison, and J. R. Baker. 2011. "Effects of priming exercise on VO2 kinetics and the power-duration relationship." Med Sci Sports Exerc 43 (11):2171-9. doi: 10.1249/MSS.0b013e31821ff26d.
Butts, N. K., C. Dodge, and M. McAlpine. 1993. "Effect of stepping rate on energy costs during StairMaster exercise." Med Sci Sports Exerc 25 (3):378-82.
Cannon, D. T., A. C. White, M. F. Andriano, F. W. Kolkhorst, and H. B. Rossiter. 2011. "Skeletal muscle fatigue precedes the slow component of oxygen uptake kinetics during exercise in humans." J Physiol 589 (Pt 3):727-39. doi: 10.1113/jphysiol.2010.197723.
Cerretelli, P. , and P.E. DiPrampero. 1987. Gas exchange in exercise. In: Handbook of Physiology. Edited by A. P. Fishman, L.E. Farhi, S.M. Tenney and S.R. Geiger. Bethesda, Maryland: American Physiological Society.
Chen, J., J. Wang, J. Wang, X. Liu, T. Li, and P. Lin. 2016. "An Experimental Study of Individual Ascent Speed on Long Stair." Fire Technology 53 (1):283-300. doi: 10.1007/s10694-016-0579-1.
Cheng, A. J., and C. L. Rice. 2013. "Factors contributing to the fatigue-related reduction in active dorsiflexion joint range of motion." Appl Physiol Nutr Metab 38 (5):490-7. doi: 10.1139/apnm-2012-0357.
Chowdhury, S. K., and A. D. Nimbarte. 2015. "Comparison of Fourier and wavelet analysis for fatigue assessment during repetitive dynamic exertion." J Electromyogr Kinesiol 25 (2):205-13. doi: 10.1016/j.jelekin.2014.11.005.
Christensen, H., K. Sogaard, B. R. Jensen, L. Finsen, and G. Sjogaard. 1995. "Intramuscular and surface EMG power spectrum from dynamic and static contractions." J Electromyogr Kinesiol 5 (1):27-36.
Cifrek, M., V. Medved, S. Tonkovic, and S. Ostojic. 2009. "Surface EMG based muscle fatigue evaluation in biomechanics." Clin Biomech (Bristol, Avon) 24 (4):327-40. doi: 10.1016/j.clinbiomech.2009.01.010.
Costill, L. David, H. Jack Wilmore, and W. Larry Kenney. 2012 Physiology of sport and exercise Fifth edition ed. Champaign, IL: Human Kinetics.
Davis, P. O., R. J. Biersner, R. J. Barnard, and J. Schamadan. 1982. "Medical evaluation of fire fighters: How fit are they for duty?" Postgrad Med 72 (2):241-5, 8.
Dekerle, J., K. M. de Souza, R. D. de Lucas, L. G. Guglielmo, C. C. Greco, and B. S. Denadai. 2015. "Exercise Tolerance Can Be Enhanced through a Change in Work Rate within the Severe Intensity Domain: Work above Critical Power Is Not Constant." Plos One 10 (9):e0138428. doi: 10.1371/journal.pone.0138428.
Delin, M., J. Norén, E. Ronchi, K. Kuklane, A. Halder, and K. Fridolf. 2016. "Ascending stair evacuation: walking speed as a function of height." Fire and Materials:n/a-n/a. doi: 10.1002/fam.2410.

65
Dingwell, J. B., J. E. Joubert, F. Diefenthaeler, and J. D. Trinity. 2008. "Changes in muscle activity and kinematics of highly trained cyclists during fatigue." IEEE Trans Biomed Eng 55 (11):2666-74. doi: 10.1109/TBME.2008.2001130.
Donath, L., O. Faude, R. Roth, and L. Zahner. 2014. "Effects of stair-climbing on balance, gait, strength, resting heart rate, and submaximal endurance in healthy seniors." Scand J Med Sci Sports 24 (2):e93-101. doi: 10.1111/sms.12113.
Dorman, L. E., and G. Havenith. 2009. "The effects of protective clothing on energy consumption during different activities." European Journal of Applied Physiology 105 (3):463-70. doi: 10.1007/s00421-008-0924-2.
Duffield, R., J. Edge, D. Bishop, and C. Goodman. 2007. "The relationship between the VO2 slow component, muscle metabolites and performance during very-heavy exhaustive exercise." J Sci Med Sport 10 (3):127-34. doi: 10.1016/j.jsams.2006.05.013.
Eberstein, A., and B. Beattie. 1985. "Simultaneous measurement of muscle conduction velocity and EMG power spectrum changes during fatigue." Muscle Nerve 8 (9):768-73. doi: 10.1002/mus.880080905.
Eteraf Oskouei, A., N. Ferdosrad, I. Dianat, M. Asghari Jafarabadi, and J. Nazari. 2014. "Electromyographic Activity of Soleus and Tibialis Anterior Muscles during Ascending and Descending Stairs of Different Heights." Health Promot Perspect 4 (2):173-9. doi: 10.5681/hpp.2014.023.
Farina, D. 2006. "Interpretation of the surface electromyogram in dynamic contractions." Exerc Sport Sci Rev 34 (3):121-7.
Gallagher, S., and M. C. Schall, Jr. 2017. "Musculoskeletal disorders as a fatigue failure process: evidence, implications and research needs." Ergonomics 60 (2):255-69. doi: 10.1080/00140139.2016.1208848.
Gledhill, N., and V. K. Jamnik. 1992. "Characterization of the physical demands of firefighting." Can J Sport Sci 17 (3):207-13.
Goodwin, M. L., J. E. Harris, A. Hernandez, and L. B. Gladden. 2007. "Blood lactate measurements and analysis during exercise: a guide for clinicians." J Diabetes Sci Technol 1 (4):558-69. doi: 10.1177/193229680700100414.
Gottschall, J. S., G. S. Aghazarian, and E. A. Rohrbach. 2010. "The metabolic and muscular differences between two stair-climbing strategies of young adults." J Strength Cond Res 24 (9):2558-63. doi: 10.1519/JSC.0b013e3181e83a6f.
Halder, A., C. Gao, and M. Miller. 2014. "Effects of cooling on ankle muscle strength, electromyography, and gait ground reaction forces." J Sports Med (Hindawi Publ Corp) 2014:520124. doi: 10.1155/2014/520124.
Halsey, L. G., D. A. Watkins, and B. M. Duggan. 2012. "The energy expenditure of stair climbing one step and two steps at a time: estimations from measures of heart rate." Plos One 7 (12):e51213. doi: 10.1371/journal.pone.0051213.
Hamill, J., K. Knutzen, and T. Derrick. 2015. Biomechanical basis of human movement. Fourth Edition ed. Philadelphia: Wolters Kluwer Health/Lippincott Williams and Wilkins.
Hanon, C., C. Thepaut-Mathieu, C. Hausswirth, and J. M. Le Chevalier. 1998. "Electromyogram as an indicator of neuromuscular fatigue during incremental exercise." Eur J Appl Physiol Occup Physiol 78 (4):315-23.

66
Hermens, H. J., B. Freriks, C. Disselhorst-Klug, and G. Rau. 2000. "Development of recommendations for SEMG sensors and sensor placement procedures." J Electromyogr Kinesiol 10 (5):361-74.
Holmer, I., and D. Gavhed. 2007. "Classification of metabolic and respiratory demands in fire fighting activity with extreme workloads." Appl Ergon 38 (1):45-52. doi: 10.1016/j.apergo.2006.01.004.
Horton, R. 2012. "GBD 2010: understanding disease, injury, and risk." Lancet 380 (9859):2053-4. doi: 10.1016/S0140-6736(12)62133-3.
Howley, E. T., D. R. Bassett, Jr., and H. G. Welch. 1995. "Criteria for maximal oxygen uptake: review and commentary." Med Sci Sports Exerc 27 (9):1292-301.
Ilmarinen, J., J. Rutenfranz, P. Knauth, M. Ahrens, H. Kylian, A. Siuda, and U. Korallus. 1978. "[The effect of an on the job training program -- stairclimbing -- on the physical working capacity of employees (author's transl)]." Eur J Appl Physiol Occup Physiol 38 (1):25-40. doi: 10.1007/bf00436750.
ISO, International Organization for Standardization. 2004. "ISO 8996 Ergonomics of thermal environment - Determination of metabolic heat production." In. Geneva, Switzerland.
Johnson, A. N., D. F. Cooper, and R. H. Edwards. 1977. "Exertion of stairclimbing in normal subjects and in patients with chronic obstructive bronchitis." Thorax 32 (6):711-6.
Jones, A. M., B. Grassi, P. M. Christensen, P. Krustrup, J. Bangsbo, and D. C. Poole. 2011. "Slow component of VO2 kinetics: mechanistic bases and practical applications." Med Sci Sports Exerc 43 (11):2046-62. doi: 10.1249/MSS.0b013e31821fcfc1.
Jones, Andrew M., Daryl P. Wilkerson, Nicolas J. Berger, and Jonathan Fulford. 2007. "Influence of endurance training on muscle [PCr] kinetics during high-intensity exercise." American Journal of Physiology - Regulatory, Integrative and Comparative Physiology 293 (1):R392-R401. doi: 10.1152/ajpregu.00056.2007.
Kang, J., H. Walker, M. Hebert, M. Wendell, and J. R. Hoffman. 2004. "Influence of contraction frequency on cardiovascular responses during the upper and lower body exercise." Research in Sports Medicine 12 (4):251-64 14p.
Kraemer, W. J., and R. U. Newton. 1994. "Training for improved vertical jump. , ." Sports Science Exchange 7 (6):1-12. .
Kravitz, L., and L. C. Dalleck. 2002. "Physiological factors limiting endurance exercise capacity." IDEA Health & Fitness Association. Advanced sports conditioning for enhanced performance. IDEA Resource Series:21-7.
Krustrup, P., K. Soderlund, M. Mohr, and J. Bangsbo. 2004. "The slow component of oxygen uptake during intense, sub-maximal exercise in man is associated with additional fibre recruitment." Pflugers Arch 447 (6):855-66. doi: 10.1007/s00424-003-1203-z.
Lam, J. H. T., J. K. K. Yuen, E. W. M. Lee, and R. Y. Y. Lee. 2014. "Experimental study on upward movement in a high-rise building." Safety Science 70 (70):397-405. doi: 10.1016/j.ssci.2014.07.011.
Loe, H., O. Rognmo, B. Saltin, and U. Wisloff. 2013. "Aerobic capacity reference data in 3816 healthy men and women 20-90 years." Plos One 8 (5):e64319. doi: 10.1371/journal.pone.0064319.

67
Lusa, S., V. Louhevaara, J. Smolander, M. Kivimaki, and O. Korhonen. 1993. "Physiological responses of firefighting students during simulated smoke-diving in the heat." Am Ind Hyg Assoc J 54 (5):228-31.
Macdonald, A. S., D. Loudon, P. J. Rowe, D. Samuel, V. Hood, A. C. Nicol, M. A. Grealy, and B. A. Conway. 2007. "Towards a design tool for visualizing the functional demand placed on older adults by everyday living tasks." Universal Access in the Information Society 6 (2):137-44. doi: 10.1007/s10209-007-0078-8.
MacIsaac, D., P. A. Parker, and R. N. Scott. 2001. "The short-time Fourier transform and muscle fatigue assessment in dynamic contractions." J Electromyogr Kinesiol 11 (6):439-49.
McArdle, W. D. , F. I. Katch, and V. L. Katch. 2015. Exercise Physiology, Nutrition, Energy, And Human Performance. Eigth edition ed. Philadelphia: Wolters Kluwer Health
McFadyen, B. J., and D. A. Winter. 1988. "An integrated biomechanical analysis of normal stair ascent and descent." J Biomech 21 (9):733-44. doi: 10.1016/0021-9290(88)90282-5.
Merletti, R., M. Knaflitz, and C. J. De Luca. 1990. "Myoelectric manifestations of fatigue in voluntary and electrically elicited contractions." J Appl Physiol (1985) 69 (5):1810-20.
Nadeau, S., B. J. McFadyen, and F. Malouin. 2003. "Frontal and sagittal plane analyses of the stair climbing task in healthy adults aged over 40 years: what are the challenges compared to level walking?" Clinical Biomechanics 18 (10):950-9. doi: 10.1016/s0268-0033(03)00179-7.
Nightingale, E. J., F. Pourkazemi, and C. E. Hiller. 2014. "Systematic review of timed stair tests." J Rehabil Res Dev 51 (3):335-50. doi: 10.1682/JRRD.2013.06.0148.
O'Connell, E. R., P. C. Thomas, L. D. Cady, and R. J. Karwasky. 1986. "Energy costs of simulated stair climbing as a job-related task in fire fighting." J Occup Med 28 (4):282-4.
Oksa, Juha, Michel B. Ducharme, and Hannu Rintamäki. 2002. "Combined effect of repetitive work and cold on muscle function and fatigue." Journal of Applied Physiology 92 (1):354-61.
Peacock, R. D., J. D. Averill, and E. D. Kuligowski. 2010. "Stairwell Evacuation from Buildings: What We Know We Don’t Know." In Pedestrian and Evacuation Dynamics 2008, edited by Wolfram W. F. Klingsch, Christian Rogsch, Andreas Schadschneider and Michael Schreckenberg, 55-66. Springer Berlin Heidelberg.
Pelechano, N., and A. Malkawi. 2008. "Evacuation simulation models: Challenges in modeling high rise building evacuation with cellular automata approaches." Automation in Construction 17 (4):377-85. doi: 10.1016/j.autcon.2007.06.005.
Per-Olof, Å., R. Kaare, A. D. Hans, and B. S. Sigmund. 2003. Textbook of Work Physiology. Fourth ed. Champaign, IL: Human Kinetics.
Poole, D. C., T. J. Barstow, G. A. Gaesser, W. T. Willis, and B. J. Whipp. 1994. "VO2 slow component: physiological and functional significance." Med Sci Sports Exerc 26 (11):1354-8.
68
Ramos-Jiménez, A., R. P. Hernández-Torres, P. V. Torres-Durán, J. Romero-Gonzalez, D. Mascher, C. Posadas-Romero, and M. A. Juárez-Oropeza. 2008. "The Respiratory Exchange Ratio is Associated with Fitness Indicators Both in Trained and Untrained Men: A Possible Application for People with Reduced Exercise Tolerance." Clinical Medicine. Circulatory, Respiratory and Pulmonary Medicine 2:1-9.
Rantanen, T., P. Era, M. Kauppinen, and E. Heikkinen. 1994. "Maximal Isometric Muscle Strength and Socioeconomic Status, Health, and Physical Activity in 75-Year-Old Persons." Journal of Aging and Physical Activity 2 (3):206-20. doi: 10.1123/japa.2.3.206.
Reybrouck, T., J. Ghesquiere, M. Weymans, and A. Amery. 1986. "Ventilatory threshold measurement to evaluate maximal endurance performance." Int J Sports Med 7 (1):26-9. doi: 10.1055/s-2008-1025730.
Riener, R., M. Rabuffetti, and C. Frigo. 2002. "Stair ascent and descent at different inclinations." Gait & Posture 15 (1):32-44. doi: 10.1016/S0966-6362(01)00162-X.
Robergs, R.A., and S. Roberts. 1997. Exercise Physiology: Exercise, performance, and clinical applications. St Louis, Missouri: Mosby.
Ronchi, E., and D. Nilsson. 2013. "Fire evacuation in high-rise buildings: a review of human behaviour and modelling research." Fire Science Reviews 2 (1):1.
Ronchi, E., J. Norén, M. Delin, K. Kuklane, A. Halder, S. Arias, and K. Fridolf. 2015. "Ascending evacuation in long stairways: Physical exertion, walking speed and behaviour" In. Lund, Sweden Lund University.
Rossiter, H. B., S. A. Ward, J. M. Kowalchuk, F. A. Howe, J. R. Griffiths, and B. J. Whipp. 2001. "Effects of prior exercise on oxygen uptake and phosphocreatine kinetics during high-intensity knee-extension exercise in humans." The Journal Of Physiology 537 (Pt 1):291-303. doi: 10.1111/j.1469-7793.2001.0291k.x.
Roston, W. L., B. J. Whipp, J. A. Davis, D. A. Cunningham, R. M. Effros, and K. Wasserman. 1987. "Oxygen uptake kinetics and lactate concentration during exercise in humans." Am Rev Respir Dis 135 (5):1080-4. doi: 10.1164/arrd.1987.135.5.1080.
Sabapathy, S., D. A. Schneider, and N. R. Morris. 2005. "The VO2 slow component: relationship between plasma ammonia and EMG activity." Medicine & Science in Sports & Exercise 37 (9):1502-9 8p.
Samuel, D., P. Rowe, V. Hood, and A. Nicol. 2011. "The biomechanical functional demand placed on knee and hip muscles of older adults during stair ascent and descent." Gait Posture 34 (2):239-44. doi: 10.1016/j.gaitpost.2011.05.005.
Saunders, M. J., E. M. Evans, S. A. Arngrimsson, J. D. Allison, G. L. Warren, and K. J. Cureton. 2000. "Muscle activation and the slow component rise in oxygen uptake during cycling." Med Sci Sports Exerc 32 (12):2040-5.
Scheuermann, B. W., J. H. Tripse McConnell, and T. J. Barstow. 2002. "EMG and oxygen uptake responses during slow and fast ramp exercise in humans." Exp Physiol 87 (1):91-100. doi: 10.1113/eph8702246.
Shinohara, M., and T. Moritani. 1992. "Increase in neuromuscular activity and oxygen uptake during heavy exercise." Ann Physiol Anthropol 11 (3):257-62.
Shiomi, T. 1994. "Effects of different patterns of stairclimbing on physiological cost and motor efficiency." J Hum Ergol (Tokyo) 23 (2):111-20.

69
Sothmann, M. S., K. Saupe, D. Jasenof, and J. Blaney. 1992. "Heart rate response of firefighters to actual emergencies. Implications for cardiorespiratory fitness." J Occup Med 34 (8):797-800.
Stegemann, J. 1981. Exercise Physiology: Physiologic Bases of Work and Sport. Stuttgart: Goerg Thieme Verlag/Mosby.
Teh, K. C., and A. R. Aziz. 2002. "Heart rate, oxygen uptake, and energy cost of ascending and descending the stairs." Med Sci Sports Exerc 34 (4):695-9.
Vanhatalo, A., D. C. Poole, F. J. DiMenna, S. J. Bailey, and A. M. Jones. 2011. "Muscle fiber recruitment and the slow component of O2 uptake: constant work rate vs. all-out sprint exercise." Am J Physiol Regul Integr Comp Physiol 300 (3):R700-7. doi: 10.1152/ajpregu.00761.2010.
Whipp, B. J., and K. Wasserman. 1972. "Oxygen uptake kinetics for various intensities of constant-load work." J Appl Physiol 33 (3):351-6.
Williams-Bell, F. M., G. Boisseau, J. McGill, A. Kostiuk, and R. L. Hughson. 2010. "Physiological responses and air consumption during simulated firefighting tasks in a subway system." Appl Physiol Nutr Metab 35 (5):671-8. doi: 10.1139/H10-061.
Vogiatzis, I., N. C. Spurway, S. Jennett, J. Wilson, and J. Sinclair. 1996. "Changes in ventilation related to changes in electromyograph activity during repetitive bouts of isometric exercise in simulated sailing." Eur J Appl Physiol Occup Physiol 72 (3):195-203.
von Heimburg, E. D., A. K. Rasmussen, and J. I. Medbo. 2006. "Physiological responses of firefighters and performance predictors during a simulated rescue of hospital patients." Ergonomics 49 (2):111-26. doi: 10.1080/00140130500435793.
Xu, C., G. Yang, and M. Yang. 2015. "Sample-Based Vegetation Distribution Information Synthesis." Plos One 10 (8):e0134009. doi: 10.1371/journal.pone.0134009.
Zoladz, J. A., L. B. Gladden, M. C. Hogan, Z. Nieckarz, and B. Grassi. 2008. "Progressive recruitment of muscle fibers is not necessary for the slow component of VO2 kinetics." J Appl Physiol (1985) 105 (2):575-80. doi: 10.1152/japplphysiol.01129.2007.
Zoladz, J. A., A. C. Rademaker, and A. J. Sargeant. 1995. "Non-linear relationship between O2 uptake and power output at high intensities of exercise in humans." J Physiol 488 ( Pt 1):211-7.

6

am
itav
a h
ald
er
Evaluation of physical work capacity and leg m
uscle fatigue during exhaustive stair ascending evacuation 2017
978
9177
5331
77
Division of Ergonomics and Aerosol TechnologyDepartment of Design Sciences
Faculty of Engineering ISBN 978-91-7753-317-7
Evaluation of physical work capacity and leg muscle fatigue during exhaustive stair ascending evacuationamitava halder | divsion of ergonomics and aerosol technology
dePartment of design sciences | faculty of engineering | lund university
Are you aware of your current stair climbing capacity? You may be required to make long and non-stop stair ascents during evacuations in case of fires, earthqu-akes, or subway emergencies. Physical exhaustion in-cluding muscle fatigue and cardiorespiratory constra-ints, human behaviour and mental performance can influence the prospects of a person’s successful evacuation upwards in long flights of stairs. This the-sis describes and compares human stair ascending capacities and physiological limitations using two different strategies: a) a self-preferred pace in the field in two buildings and on an escalator, and b) a controlled pace in the laboratory on a stair machine. In the self-p pace referred ascents, the oxygen uptake (VO2) and heart rate (HR) of the subjects reached 89 to 95% and 89 to 96%, respectively, of the human
maximum capacities reported in large databases. In the controlled ascents, the VO2 and HR reached 94 and 97%, respectively, of the subjects’ maximal capacities during ascending at 90% of their maximum capacity related step rate. The average VO2 highest reached 39-41 mL·kg-1·min-1 at the self-preferred pace and 44 mL·kg-1·min-1 during ascending at 90% of maximum capacity related step rates. The study developed and validated a method that shows changes of both electromyographic amplitudes and frequ-encies. The method consists of muscle activity interpretation squares (MAIS) in which muscle activity rate changes (MARC) are used for assessing leg muscle fatigue during stair ascents. The subjects needed to reduce their ascending speeds to a tolerable rate in order to prevent fatigue and thus delay exhaustion so that they could reach the top of the buildings and escalator. The results of the controlled pace at 90% subject’s maximal capacity infer that leg muscle fatigue significantly contributes, in conjunction with car-diorespiratory limitations, to constrain human stair ascending durations and the essential oxygen uptake for performance. The MARC points during different climbing periods enable the interpretation of muscle activity in both stair ascent strategies. MARC and MAIS can be useful for interpreting muscle activity changes over time during dynamic tasks.