evaluation of, performance of select fusion … select fusion experiments and projected reactors ......
TRANSCRIPT

NASA Contractor Report 3043
Evaluation of, Performance
of Select Fusion Experiments and Projected Reactors
George H. Miley
PURCHASE ORDER C-2438-D OCTOBER 1978
https://ntrs.nasa.gov/search.jsp?R=19790002724 2018-06-18T18:29:53+00:00Z

TECH LIBRARY KAFB, NM
NASA Contractor Report 3043
Evaluation of Performance of Select Fusion Experiments and Projected Reactors
George H. Miley University of Illinois Urbana, Illinois
Prepared for Lewis Research Center under Purchase Order C-24 3 8-D
NASA National Aeronautics and Space Administration
Scientific and Technical lnfotmation Office
1978


Table of Contents
Page
1. Introduction ........................ 1
2. Performance Criteria .................... 1
3. Performance Plots. ..................... 3
a. Gain Performance ................. 3
b. Average Power Performance ............. 15
4. Alternate Criteria ..................... 17
5. Summary ........................... 20
6. References ......................... 23
7. Appendices ......................... 25
A. Derivation of Gain Criterion. ............ 25
B. Nomenclature. .................... 27
iii
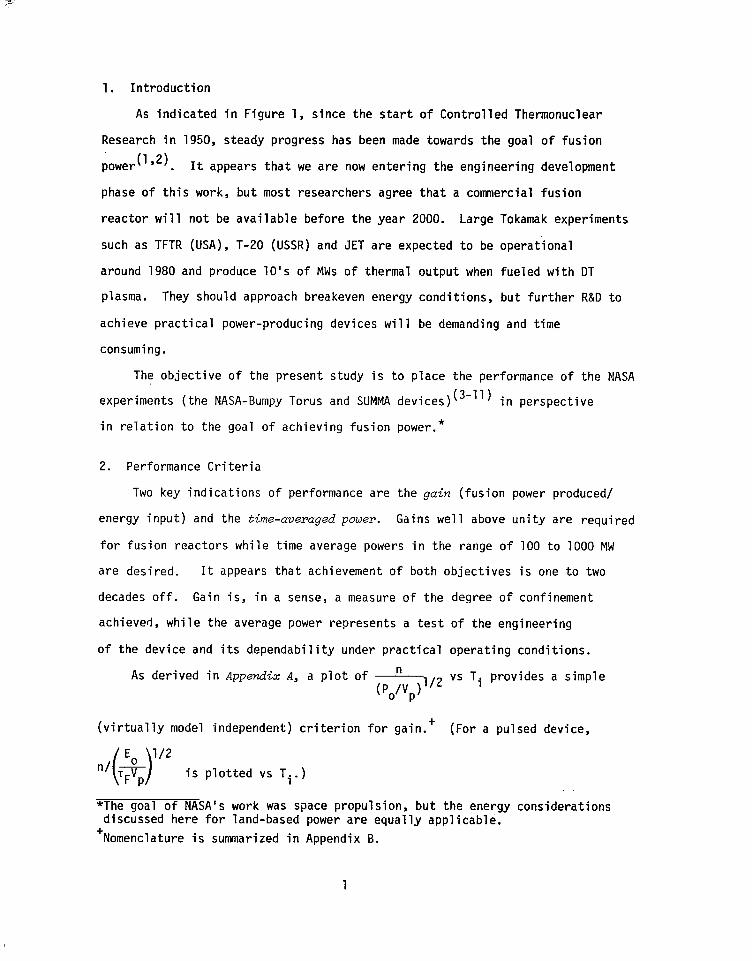
1. Introduction
As indicated in Figure 1, since the start of Controlled Thermonuclear
Research in 1950, steady progress has been made towards the goal of fusion
power("'). It appears that we are now entering the engineering development
phase of this work, but most researchers agree that a commercial fusion
reactor will not be available before the year 2000. Large Tokamak experiments
such as TFTR (USA), T-20 (USSR) and JET are expected to be operational
around 1980 and produce 10's of MWs of thermal output when fueled with DT
plasma. They should approach breakeven energy conditions, but further R&D to
achieve practical power-producing devices will be demanding and time
consuming.
The objective of the present study is to place the performance of the NASA
experiments (the NASA-Bumpy Torus and SUMMA devices) (3-11) in perspective
in relation to the goal of achieving fusion power.*
2. Performance Criteria
Two key indications of performance are the gain (fusion power produced/
energy input) and the time-averaged power. Gains well above unity are required
for fusion reactors while time average powers in the range of 100 to 1000 MW
are desired. It appears that achievement of both objectives is one to two
decades off. Gain is, in a sense, a measure of the degree of confinement
achieved, while the average power represents a test of the engineering
of the device and its dependability under practical operating conditions.
As derived in Appendix A, a plot of vs Ti provides a simple
(virtually model independent) criterion for gain.+ (For a pulsed device,
l/2 is plotted vs Ti.)
*The goal of NASA's work was space propulsion, but the energy considerations discussed here for land-based power are equally applicable.
+Nomenclature is summarized in Appendix B.
1
Figure 1
FUSION ENERGY EVOLUTION (from Ref. 7)
ACTUAL EFFORT
PHYSICS RESEARCH
20r10 j 1 2l1!10 I
LNUCLEAR THirORY OF rHt: AjOr.1
START OF - -
k CONTRULLED FUSION Tfh5RlVlOflUCLEAR DEMONSTRATION PROGRAMS REACTOR
FUSION POWER DEVELOPMENT PLANS
REACTOR-LIKE CONDITIONS IN HYDROGEN PLASMA
TENS OF MEGAWATTS THERMAL OR FISSION REACTOR FUEL IT-M)
EXFERIMENTAL FUSION POWER REACTOR lo’s OF MEGAWATTS ELECTRIC
;XPERIMENTAL FUSION POWER REACTOR
loo MEGAWATTS ELECTR’C TR’T’UM BREED’NG
--.---__- --.-- - ..-- ----. _-..-.--- --I COMMf.RCIAL SCALE
DEMUNSTRATION PLANT
---. -, So0 MEGAWATTS ELECTRIC
2
Most reactor designs involve plants with average powers in the range
of 1000 MW or more. Current experiments however, have produced at the most,
only 10's of watts output. For pulse devices such as laser-fusion plants,
duty cycles of the order of 10M8 with peak powers exceeding 10 17 W are
required. A useful description of this criterion is obtained by plotting
duty cycle vs average fusion power with iso-lines showing peak power values.
3. Performance Plots
a. Gain Performance
The measured gains for the NASA devices are shown on Fig. 2 along with
data from other operational experiments as well as projected data for
future experiments and conceptual reactors. The NASA devices have gains
on theorder of 10 -10 which places them in the same range of the French TFR
experiment but above the EBT and Doublet IIA devices. However, they fall
well below the high performance experiments such as 2X-IIB and Alcator
that have gains on the order of 10m4.
Data used in constructing Fig. 2 are summarized in Tables 1 through 4.
Data from existing experiments were selected to provide a range of device
sizes and types. The four tokamak experiments (Alcator, Doublet-IIA, ORMAK,
TFR, and PLT) range from a modest 54-cm major-radius up to 130 cm (see Fig. 3)
and have power inputs ranging from 300 kW to 5 1 MW. Besides tokamaks, a
mirror experiment (2X-IIB) and an electron-ring stablized bumpy torus (EBT)
are included. Data for these tables were obtained through personal
discussions (12-17) with workers in the laboratories involved and, to a lesser
extent, from reports in the 1976 IAEA Berchtesgaden Conference along with
1975 European Fusion Conference at Lausanne. (18-26)
3

P
lOI
lOI5
lOI
lOi
lOI
IO” C
A GOALS OF DEVICES UNDER CONSTRUCTION
0 GOALS OF CONCEPTUAL DESIGNS
SCALED FROM DATA
(1): WITH INJECTION
):WlTH INJECTION AND GAS PUFFIN6
LI) LOW IMPEDANCE CASE
I) HIGH IMPEDANCE CASE
I IW
ION TEMPERATURE, Ti (keV) Figure 2. Requirements for a Breakeven (Zero Net Power) Fusion Reactor
Table 1
Performance Data From Various Operational Fusion Devices (Refs. 4-19)
I I ORMAK I
I I I 7
i7, cm -3
I iWith 2X-IIB D-IIA i EBT Ohmic HeatingjInjection
I
1.5x10¹⁴ 3x10¹³ /4x1012 ! 3x10¹³ 1 3x10'3
E kJ n' 220(a) 400(b) i - j -
P o, kW
7F' set
VP, cm 3
Ti, keV
4B0(e) 900
10-2 6~10-~ -
4.5x10³ 7x10⁵ 4x10 5(4
8.4~10~ 8.4~10~
13 0.2 0.1 0.4 1.1
4
8.4~10~ 4.1x10⁶
4
0.9 0.8
I 6.72~10~~ 5.59x101
.
Alcator ~ TFR
296(g) 1.3x10⁵
1.5x10⁵ 7.73x10⁵
0.6 -0.7(h)
I 5.20~10~~ 1.54~10~'
(a) Includes injector accelerator and arc power supplies, but not filament power supply (.72 MJ) nor magnetic power (.37 MJ).
(b) Includes ohmic heating power but not magnetic field. (300 MJ).
(c) Only includes 18 and 28 GH, microwave power input; neglects magnetic field power of 12 MW.
(d) Toroidal plasma volume only (corresponding n and Ti neglect hot electron annulus).
(e) Averaged over a pulse length of -0.1 set (injection -0.02 set).
I{ f Averaged over a pulse length of -1 sec. g Averaged over a 0.7-set pulse.
(h) Estimated; 2.5 keV electron T measured.

NASA-B.T. (VP = 82L)
SUMMA (Vp = 1.5R)
1
!
-
-
-
-
-
-
-
-
-
-
-
-
L
Table 2: NASA Device Performance Data (Ref. 3)
( 1 T ii 10J2cmv3 ' i,eV Po,kW 3
412(a) 7.1 0.05
1233(a) 2.8 0.006
653(a) 13.5 0.07
680(a) 1.8 0.025
406 47. 1.6
417 24. 0.8
373 42. 1.9
186 12. 2.9
395 1.0
200(a) ,I: 5.
500 67.5 2.
1000(a) 240.
2500(d) 4000. 5:: -
0.28 0.17
0.25 0.035
0.22 0.16
0.41 0.17
1.2 2.1
1.18 1.5
1.36 2.7
2.8 7.7
2.5 2.4
0.145 0.50
0.192 0.30
7.38 0.25
0.13 1.0
(a) Measured temperatures. Other values, based on scaling laws, are thought to be lower bounds. in Table 2A.
Maximum projected performance for the 5T is given
(b) Based on measured n, VP, and current to electrode rings.
(c) Assumes n - $2.
(d) Extrapolated values. Scaling relations for Summa are summarized in Table 2B.

Table 2A
Projected Bumpy Torus Operating Points
High Plasma Impedance* Low Plasma Impedance Parameter Extrapolation Extrapolation
: Electrode Voltage V,, kV 4.5 0.5
Electrode Currents, Ia, amps 100 100
Input Power, PO, MW 0.45 0.05
Ion Temperature Ti, keV 0.64 0.14
Average Plasma Density, n, cm -3 7x10¹² 3x10¹³
Particle Containment Time, ~~~ msec.
Lawson Parameter, ii ~~~ sec/cm3 1.3:;:10 1.2:;:11 3 l/2 $(P,/V), cmm3/(watts/cm ) 3x10¹² 3.8~10'~
(0~)~~~ cm3/sec. 6.5~10-~~ --
*High and low impedance modes represent two distinct regimes of the discharge that differ by base pressure and voltage.
7

Table 2B
Scaling Relations for Summa*
Metal Floating Shields:
T= 6.46 10.27 ~-1.05 $53 0.3< I < 2.1 A 7< v -c 20 kV
0.7< B < 3.1 T
n = 1.75x10¹² IO.95 v-O.22
Boron Nitride Floating Shields:
T = o c,7 IO.127 v2.33 . .
n = 1.2~10~~ Iom7
0.14 < I < 3.0 A 4.5 < v < 22 kV
B = 1.95 T
B = 1.38 T
B = 2.0 T (tentative)
* The metal floating-shield case provides the most complete correlation, but this was not the optimum configuration. Correlations for boron nitride shields are less accurate due to fewer data points.
8

Table 3: Projected Performance of Next
Generation Large Tokamaks
_.. - _. _ _-:- _..._ _---. i ---
- - .._.__ ~-.- _~.- -.. _ - -- - - _ ;-
Ti, cm -3
Ti , keV
PO, MW
Neutral beams
Ohmic heating
RF
pTF, MW
*F' set
TE' set
V 106cm3
n;(Po/V)'/z ,cm-3/(W/cm3)1'2
TFTR
ix1 0'3 -
6
-20
70
500
l-3
0.3
>::1013 -
JT-60
(2-10)x10'3
5-10
2b
200
15
390
5
0.2-l
54
(l.o-4.9)xlo13
JET T-20
-1014
5-10
(10-25)
2-300
>3 -
250-380
10-20
0.4-2
173
-7x10¹³
5x10¹³
5-10
50
600
50
1200
15
2
279
3x10¹³
9
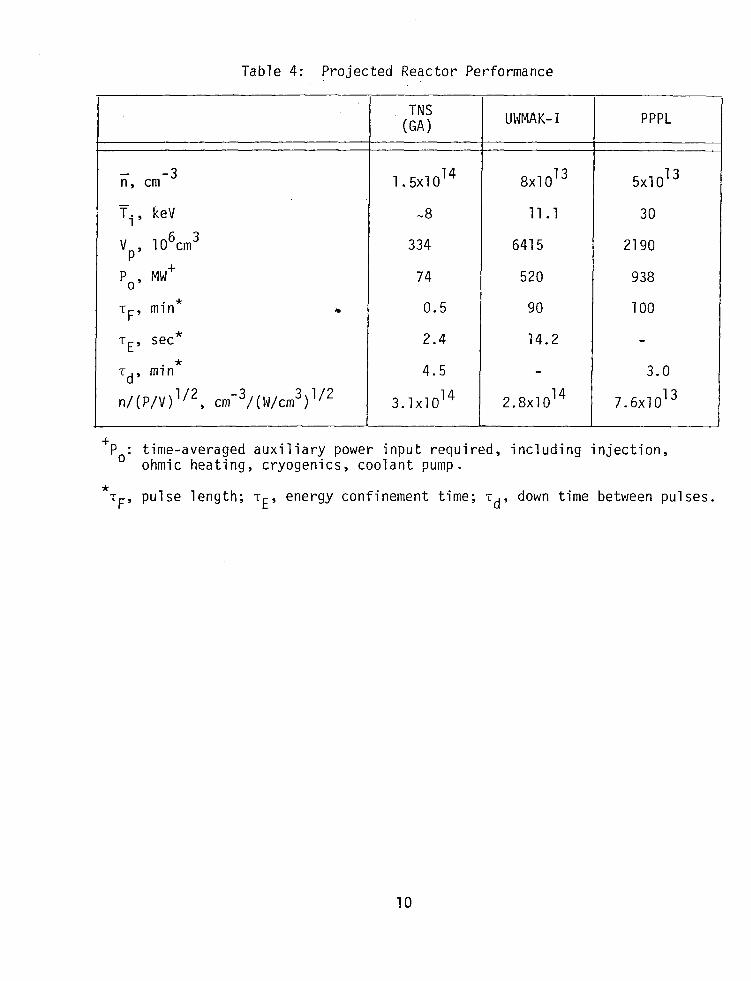
Table 4: Projected Reactor Performance
5x10¹³ ii, cm -3 1.5x10¹⁴ 8~10'~
Ti, keV -8 11.1 30
V P'
106cm3 334 6415 2190
PO, MW+ 74 520 938
TF' min* * 0.5 90 100
TE' set* 2.4 14.2
'd' min *
n/Wd'2, cm-3/(W/cm3)1'2 3.1x:,:4 2.8x10¹⁴
+P,: time-averaged auxiliary power input required, including injection, ohmic heating, cryogenics, coolant pump.
3.0
7.6~10'~
TNS (GA)
UWMAK-I PPPL
-
* ~~~ pulse length; TF, energy confinement time; ~~~ down time between pulses.
10
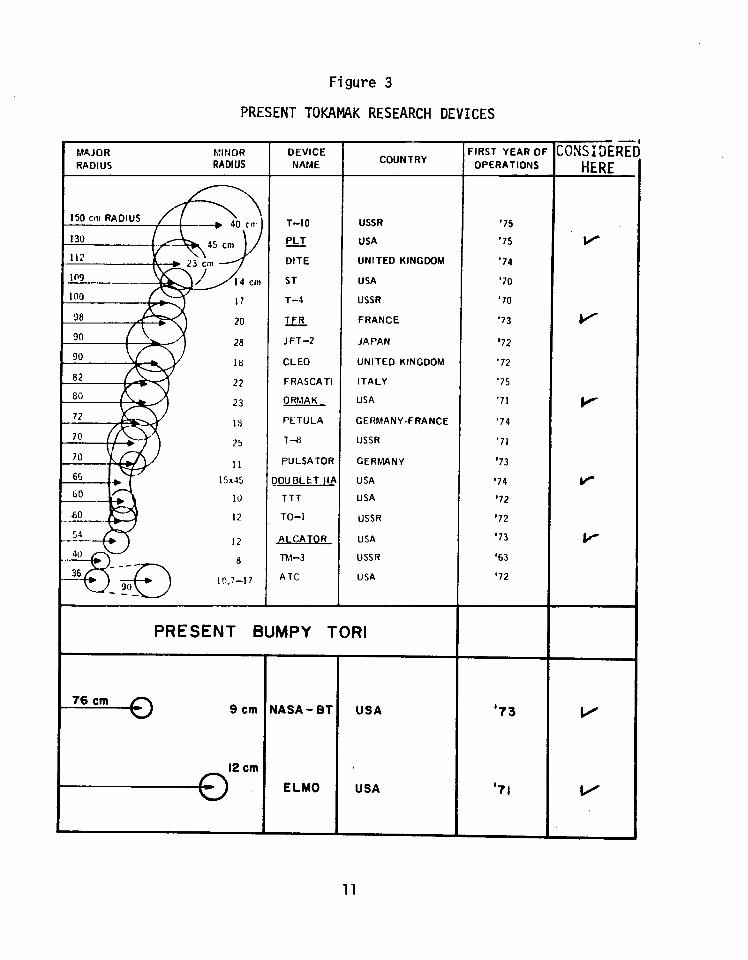
Figure 3
PRESENT TOKAMAK RESEARCH DEVICES
MAJOR NINOR DEVICE RADIUS RADIUS NAME
150 cm RADIUS , ---* 40 Cn’ 1
20
28
18
22
23
1Y
25
11
15x45
10
1c
T-10
PLT -
DITE
ST
T-4
TEL
JFT-2
CLEO
FRASCATI
ORhlAK
FETULA
1-H
PULSATOR
IOUOLET IIP
TTT
TO-1
JII CATOR
Thl-3
ATC
COUNTRY
USSR ‘75
USA ‘75
UNITED KINGDOM ‘74
USA ‘70
USSR ‘70
FRANCE ‘73
JAPAN ‘72
UNITED KINGDOM ‘72
ITALY ‘75
USA ‘71
GERMANY-FRANCE ‘74
USSR ‘71
GERMANY ‘73
USA ‘74
USA ‘72
USSR ‘72
USA ‘73
USSR ‘63
USA ‘72
PRESENT BUMPY TORI
=-a 9 cm
12 cm
NASA - BT USA
ELM0 USA
FIRST YEAR 01 OPERATIONS
‘73
‘71
:ONSXER? HERE
v
v
Y
P
v
I0
v
11

In calculating input energy requirements for Fig. 2, only the plasma
heating power has been included, i.e., ohmic and neutral beam heating for
tokamaks, neutral beam heating for the mirror, and rf heating for EBT. In all
cases, much larger power requirements are necessary for the magnetic field
coils. It is assumed, however, that these coils can eventually be made
superconducting and hence should not be included in this analysis.*
The effect of coil power supplies in present experiments can be
illustrated by considering the Doublet-IIA. An additional 300 MJ is
required to energize the toroidal and vertical field coils (vs only 400 kJ
for plasma heating). If this were included in the input energy Eo, the
parameter n/(Eo/~FVp)"2 would be reduced from 3x10 '* to -101'cm-3/(W/cm ) . 3 l/2
A similar reduction would occur for the other tokamak devices (except
Alcator) were coil supplies included in the analysis (27)
Likewise extraneous losses in 2X-IIB dominate the energy balance in
present experiments but can be eliminated in future devices. Inclusion of the
magnetic field energy of 0.37 MJ and injector filament heating (0.72 MJ)
could reduce n/(Eo/~,Vp)"* from 2~10~~ to -8x1011cm-3/(W/cm3)1'2. An
additional 10 MJ used for gettering prior to the experiment might also be
added. However, inclusion of this energy does not seem proper since gettering
must eventually be eliminated or only used for initial start-up of a reactor.
In most cases, the pulse length in tokamak experiments is sufficiently
long to achieve a quasi steady-state condition relative to plasma parameters
and power input. Average parameters during this period have been used in
* It is significant to note that the 'NASA group has pioneered in super- conducting magnet technology for fusion experiments, such coils being employed for both Summa and the NASA Bumpy Torus. Thus, during its 5 year history, the NASA Bumpy Torus has provided over 2000 hours of experimental running time with superconducting coils.
12
the present evaluation. This is somewhat optimistic since losses during
the startup phase are neglected. Since, however, the burn time will be
long compared to startup in later devices, this assumption is in principle
consistent with neglecting the magnet power.
An indication of the startup requirement can be obtained by con-
sidering ORMAK. If the power required during startup is added, the time-
average power is increased by a factor of 2.4. Consequently the ORMAK
case without injection would have $(Po/Vp)1'2 reduced from 4~10'~ to
-2.7~10~~ were this effect included. Thus this consideration is not so
significant as the assumption that the magnetic field coil energy should
be excluded.
The next generation of tokamaks included in Fig. 2 and Table 3
(namely TFTR, JT-60, JET, and T-20) are intended to reach a domain of
plasma parameters close to those of a reactor in order to determine the
scaling laws. As illustrated in Fig. 4, the major radii of these devices
vary from 2.48 m for TFTR to 5.0 m for the large T-20. The corresponding
plasma radii range from 0.85 m to 2 m with toroidal fields from 26 kG to
60 kG.
Another way of comparing these tokamaks is by the magnitude of the plasma
current, which can be linked to the plasma parameters. Up to now the
maximum plasma current obtained in the present tokamaks is of the order
of 0.5 mega-amperes (MA). This current will reach 1 MA with T-10 and PLT
working at full performance. The plasma current, Ip, for the next generation
of tokamaks will be between 2 and 6 MA, and the estimated plasma current in
a reactor is between 8 and 12 MA.
An excellent summary of the parameters anticipated for the next generation
tokamaks is contained in Ref. 28. Data for Table 3 is taken from this reference
and also from various scattered project reports. The projected gains for
these devices indicated on Fig. 2 all fall in the range near 10-l. This is
below the breakeven point (unity gain), mostly due to injector inefficiencies.
If the enerqy enterinq the plasma (vs. the injector energy) were used to compute
13
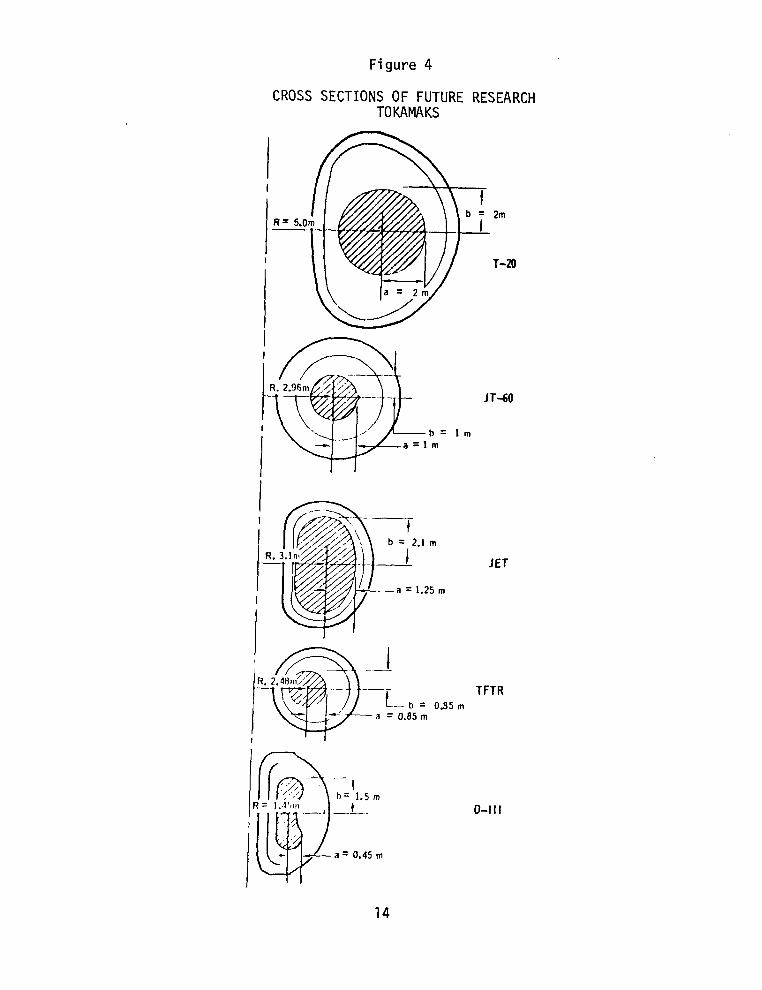
Figure 4
CROSS SECTIONS OF FUTURE RESEARCH TOKAMAKS
Zm
T-20
,1 m
.25 m
.-- I
b= 1.5 m 1 --._
a = 0.45 m
JET
TFTR
D-111
14
--
the input, breakeven would be predicted. Any projections of this nature
must be viewed with great caution, however, since important uncertainties
in injector performance, containment scaling, etc. remain.
Finally, for perspective, gains predicted for several reactor designs
are included in Fig. 2. The corresponding data, summarized in Table 4,
is based on Refs. 29-32. The gain values indicated for these designs are
surprisingly low. Values over 10 are desired for minimum recirculation.*
These were, however, early design efforts and more recent studies such as
UWMAK-III have attempted to place more emphasis on optimization of the gain.
A feeling for the size of the reactors involved is given by Table 5.
The GA-TNS (T-he Next Step) design is intended as an early demonstration
reactor and as such has a power output that is roughly l/lOth of that of
the UWMAK-1 and PPPL commercial reactor designs.
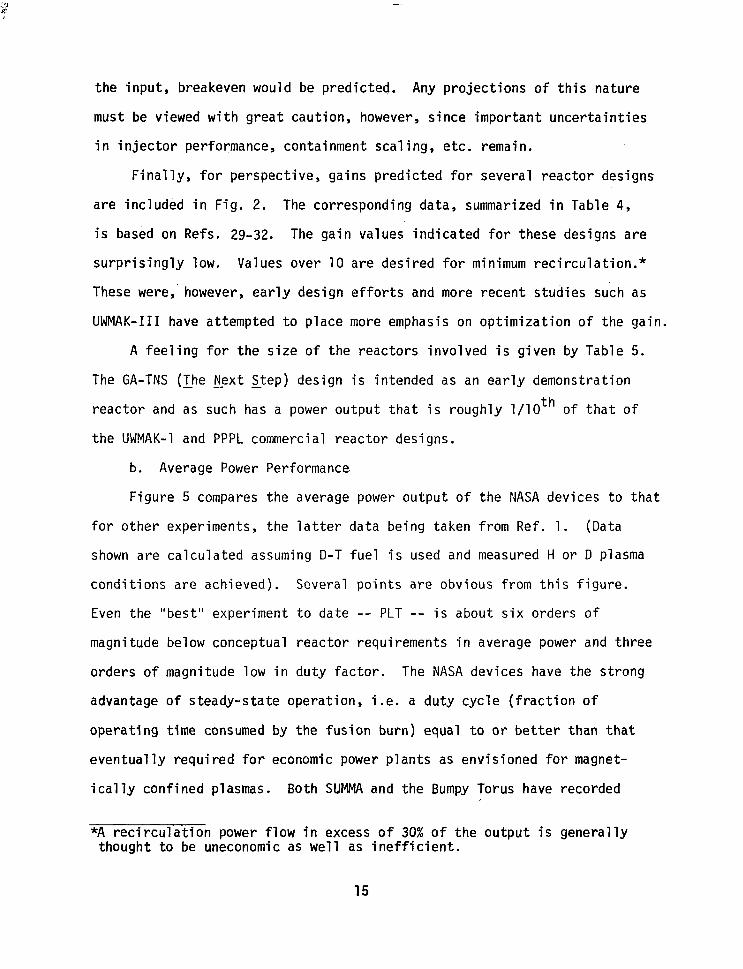
b. Average Power Performance
Figure 5 compares the average power output of the NASA devices to that
for other experiments, the latter data being taken from Ref. 1. (Data
shown are calculated assuming D-T fuel is used and measured H or D plasma
conditions are achieved). Several points are obvious from this figure.
Even the "best" experiment to date -- PLT -- is about six orders of
magnitude below conceptual reactor requirements in average power and three
orders of magnitude low in duty factor. The NASA devices have the strong
advantage of steady-state operation, i.e. a duty cycle (fraction of
operating time consumed by the fusion burn) equal to or better than that
eventually required for economic power plants as envisioned for magnet-
ically confined plasmas. Both SUMMA and the Bumpy Torus have recorded
*A recirculation power flow in excess of 30% of the output is generally thought to be uneconomic as well as inefficient.
15
I
1O-4 w 6 IO -6
g ,o-8
z 3 IO-IO : (3
IO-l2
IO-l4
FSL-78- 4
HIGH uWMAK III DUTY SUMMA EBT NASA BT
l MEASURED DATA 0 GOALS OF OPERATING DEVICES A GOALS OF DEVICES UNDER CONSTRUCTION 0 GOALS OF CONCEPTUAL DESIGNS
-PEAK FUSION POWER, WATTS
to2 IO4 IO6 IO8 IO’O lOI
AVERAGE FUSION POWER, WATTS
Figure 5. Progress in Average Power Production for Fusion Devices Assuming Operation with DT Fuel.

numerous runs of duration of hours or more. On the other hand, mainly
due to their relatively small volume, the total power from the NASA
devices is over four orders of magnitude below devices like PLT, Alcator,
and 2X-IIB.
While it might be argued that once a satisfactory gain is achieved,
the average power can be increased quite simply by increasing the plasma
volume, it must be remembered that a number of crucial engineering con-
siderations are involved. First, efficiencies, magnetic fields, etc.
must be maintained in the larger sizes. Second, and most crucial, the
device must hold together for extended periods (months to years) of
operation under fusion conditions, i.e., with heavy currents at
electrodes, with intense radiation and neutron fields, etc. Achievement
of such performance is not at all straightforward and must be developed
through a series of scaled experiments. This can be both expensive and
time consuming.
4. Alternate Criteria
The gain and average power plots presented in the preceding section,
when considered simultaneously, provide a definitive measure of performance.
However, to provide some further insight, as well as a basis for comparison
to other widely used criteria, several other presentations are noted here.
Reference 1 and various EPRI reports have frequently concentrated
on relative fractional burnup. For a D-T plasma, the fractional burnup fb is

FSL-78- I
l MEASURED dATA I 3
5 LAWSOh . GOALS OF OPERATING DEVICES s CRITERION A GOALS OF DEVICES UNDER CONSlRUCTlOf$ 0 GOALS OF DEVICES UNDER DESIGN f : --- 0 SCALED FROM DATA
\ i
5
\ 3
\ ’ 0
\
\
- 1982””
\ JET 1981
JT-60 o IQEIJ
USEFUL FUSION FISSION DEVICE
TORMAC \ 1976 1974
I EBT, 1976 MODEL C STELLARATOR
FRACTION OF BURN lo-’ I I I I
lo23 l622 ,lG20t t Cl8 t IC'V 200)Hf II
IO Ml&LION 2oDE%&!!N
SO MILLJON 100 M 500 M DEGREES
<mODT (DT FUEL BURN RATE) cm3/sec
Figure 6. Progress in Fractional Burn Assuming Operation with DT Fuel.
Note: (HI) refers to high impedance plasma mode (NB) refers to operation with neutral beam injection
added.
18
10’3 : ‘f (012
m 'E 0 IO" r-' = IO'O
IO9
I
IO'
g to2 m
-3 & IO
-4 IO
-5 IO
/ ALCATOR
l -
/ 0
/
#
/
I NASA BT
~,,,,,,, REACTOR+ ,,,,,,,,,,,,, /,, ,,,,,,,,, \ I
d’ Dllll
! TFTF
/
0 / PLT, T-IO
0 NASA /It --
/ /
0
l - ./O SUMMA
+/& l /
/*\ /’
/ NASA 0
+’ PILOT RIG
I L 1 I 1 I I I I I I
1955 1965 1975 1
1985 1955 1965 1975 1985
YEAR YEAR
FSL- 78, I I I I I I
Y”” f f f REACTOR ~,,,,,,,,,,,,,,,/,,,,, (
PLT Is\78 ,’ ”
-I
L
;+ R
3
I I I I I ‘1 NASA -ET,
K ,. ~,,//,,,,REACTOR~ ////,////, @SUMMA ,,, \ ’
4X,’ /
/ .(’
4 D-III
TFTR -
0 /
0 PLT
Figure 7. Advances in Single Parameters

where n is the plasma density, T P
is the particle confinement time, and
WV> is the averaged fusion "reactivity" (or effective cross section x relative
particle speed). Equation (1) suggests a plot of n-cp vs <WI> as shown in
Fig. 6.
Fractional burnups of the order of 10-l (10%) are necessary for an
attractive reactor. Experimental devices such as 2X-IIB has achieved the
equivalent of fb s 10 -5 , placing them within four orders of magnitude of
the goal (Note the similarity of this assessment to the departure from
gain breakeven as discussed earlier). The NASA devices have equivalent
burnups in the range of 10 -11 , placing them ten orders of magnitude away
from power plants.
In some presentations (e.g. see Ref. Z), advances in individual parameters
are reviewed. Graphs, taken from Rev. 2 for representative DOE devices are shown
in Fig. 5 for n-r, T, Ti, and run time vs year. Data points for the NASA BT
and Summa devices have been superimposed. Clearly the strong points of the
NASA experiment, as already suggested, are the steady-state operation and
good heating (high Ti). It is also noteworthy that while the NASA experiments
remain below the leading magnetic devices in nT and T P'
the slopes of the
curves in these figures for NASA work are as steep as (or steeper) than for
the other devices. In other words, the rate of progress has been comparable
to that at other fusion laboratories. To match other devices in absolute
another values of these parameters would require, however, an investment in
generation of larger experimental devices.
5. Summary.
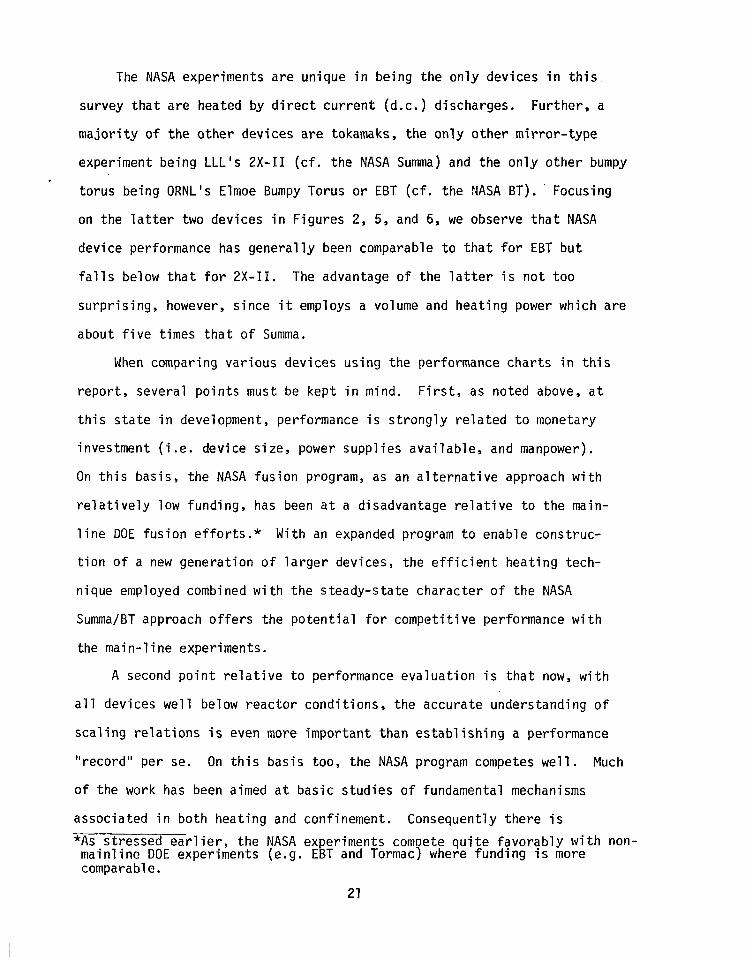
The NASA experiments are unique in being the only devices in this
survey that are heated by direct current (d-c.) discharges. Further, a
majority of the other devices are tokamaks, the only other mirror-type
experiment being LLL's 2X-11 (cf. the NASA Summa) and the on
torus being ORNL's Elmoe Bumpy Torus or EBT (cf. the YASA BT
on the latter two devices in Figures 2, 5, and 6, we observe
device performance has generally been comparable to that for
falls below that for 2X-11. The advantage of the latter is not too
surpr ising, however, since it employs a volume and heating power wh
about five times that of Summa.
y other bumpy
. Focusing
that NASA
EBT but
ich are
When comparing various devices using the performance charts in this
report, several points must be kept in mind. First, as noted above, at
this state in development, performance is strongly related to monetary
investment (i.e. device size, power supplies available, and manpower).
On this basis, the NASA fusion program , as an alternative approach with
relatively low funding, has been at a disadvantage relative to the main-
line DOE fusion efforts.* With an expanded program to enable construc-
tion of a new generation of larger devices, the efficient heating tech-
nique employed combined with the steady-state character of the NASA
Summa/BT approach offers the potential for competitive performance with
the main-line experiments.
A second point relative to performance evaluation is that now, with
all devices well below reactor conditions, the accurate understanding of
scaling relations is even more important than establishing a performance
"record" per se. On this basis too, the NASA program competes well. Much
of the work has been aimed at basic studies of fundamental mechanisms
associated in both heating and confinement. Consequently there is
*As stressed earlier, the NASA experiments comoete quite favorably with non- mainline DOE experiments (e.g. EBT and Tarmac) where funding is more comparable.
21
considerable confidence in the ability to scale-up to larger, higher
performance devices.
A final point, however, is the inevitable question of whether or not
the approach,will make a good reactor, either in the context of economic .
commercial power or for space propulsion. This is a very difficult
question to evaluate for any device, and it is especially difficult for
the NASA concepts since no detailed reactor studies have been performed
(vs a number of such studies for tokamaks as reflected by the listing in
Table 5). Such a study should be an essential aspect of any extension of
the NASA program.
It should also be noted that, as in all high-level scientific
programs, considerable (and often unexpected) "fall-out" information is
generated that may help advance scientific endeavors other than the one
immediately involved. It is too early to evaluate this aspect of the NASA
fusion program, but certainly one obvious contribution is in superconducting
magnet technology. The NASA devices have provided more operating experience
with superconducting coils than any other fusion experiment in the U. S.
This data should not only be important to the fusion community but also
to allied fields using superconducting technology.
22

References
1. "Fusion Power: Status and Options," Research Institute, 1977.
EPRI ER-510-SR, Electric Power
2. E. E. Kintner, "The Status of Fusion and Its Implications for the U. S. and World Energy Strategies," Japan, Nov. 16, 1977.
a talk before the Tokai Research Est.,
3. J. Reinmann and G. Seikel, NASA Lewis Research Center, private communication, 1977.
4. J. Reece Roth, "Ion Heating Mechanism in a Modified Penning Discharge," NASA TN D-6985.
5. J. Reece Roth, A. David Holmes, Thomas A. Keller, and Walter M. Krawczonek, "Characteristics and Performance of a Superconducting Bumpy-Torus Magnetic Facility for Plasma Research," NASA TN D-7353.
6. J. J. Reinmann, M. R. Lauver, R. W. Patch, S. J. Posta, A. Snyder, and G. W. Englert, "Hot Ion Plasma Heating Experiments in SUMMA," NASA TM X-71559.
7. Donald R. Sigman, John J. Reinmann, and Milton R. Lauver, "Parametric Study of Ion Heating in a Burnout Device (HIP-l)," NASA TM X-3033.
8. J. Reece Roth, Glenn A. Gerdin, and Richard W. Richardson, "Characteristics of the NASA Lewis Bumpy Torus Plasma Generated with Positive Applied Potentials," IEEE Transactions on Plasma Science, Vol. PS-4, No. 3, September 1976.
9. J. Reece Roth, Glenn A. Gerdin, and Richard W. Richardson, "Characteristics of the NASA Lewis Bumpy-Torus Plasma Generated with Positive Applied Potentials,” NASA TN D-8114.
10. J. Reece Roth and Glenn A. Gerdin, "Characteristics of the NASA Lewis Bumpy-Torus Plasma Generated with High Positive or Negative Applied Potentials,” NASA TN D-821 1.
11. J. Reece Roth, "Factors Affecting Ion Kinetic Temperature, Number Density, and Containment Time in the NASA Lewis Bumpy-Torus Plasma," NASA TN D-8466.
12. T. C. Simonen and A. W. Molvik, Lawrence Livermore Laboratory, private communication, 1977.
13. R. A. Dandl, Oak Ridge National Laboratory, private communication, 1977.
14. J. F. Lyon, Oak Ridge National Laboratory, private communication, 1977.
15 . R. R. Parker, Massachusetts Institute of Technology, private communication, 1977,
16. H. Eubank and K. Young, communication, 1977.
Princeton Plasma Physics Laboratory, private
23

17. T. H. Jensen, General Atomic Co., private communication, 1977.
18. F. H. Coensgen, et al., "2X-IIB Plasma Confinement Experiments," proc.
6th IAEA Conf. Plasma Physics and Controlled NucZ. Fusion Res., Berchtesgaden*, Oct. 1976. (Vol III, pp 135-145).
19. L. A. Berry, et al., "Confinement and Neutral Beam Injection Studies in ORMAK," IAEA-B, Vol. 1, pp 49-68.
20. R. L. Freeman, et al., "Doublet IIA Experiments ,” IAEA-B, Vol. 1, pp 317-322.
21. Equipe TFR, "Heating by Injection of Fast Neutrals and Study of the Ion Energy Balance in TFR," IAEA-B, Vol. 1, pp 69-84.
22. C. L. Hedrick, et al., "Transport and Scaling in the Elmo Bumpy Torus (EBT)," IAEA-B, Vol. II, pp 145-153.
23. D. Grove, et al., "Experimental Results of the PLT Tokamak," IAEA-B, Vol. I, pp 21-33.
24. E. Apgar, et al., "High-Density and Collisional Plasma Regimes in the Alcator Programme," IAEA-B, Vol. I, pp 247-257.
25. G. J. Boxman, et al., "Low and High Density Operation of Alcator," 7th European Conf. Fusion, Lausanne, 1975.
26. J. F. Lyon, "Confinement and Neutral Injection Experiments in ORMAK," 7th European Conf. Fusion, Luusanne, 1975.
27. "DCTR Power Supply and Energy Storage Review Meeting," WASH-1310, AEC, Germantown, MD., March 1974.
28. D. L. Jassby (compiler), 2 (1977).
"Large Tokamak Experiments ," NucZ. Fusion, 17,
29. R. G. Mills (ed.), "A Fusion Power Plant," MATT-1050, Princeton Plasma Physics Laboratory, August 1974.
30. B. Badger, et al., “UWMAK-1, A Wisconsin Toroidal Fusion Reactor Design," UWFDM-68, U. of Wise., May 1975.
31. J. W. Davis and G. L. Kulcinski, "Major Features of D-T Tokamak Fusion Reactor Systems," EPRI 472-1, Electric Power Research Institute, 1976.
32. "TNS Scoping Studies," GA-A14412, General Atomic Co., May 1977.
33. "The JET Project," EUR5516e, Commission of European Communities, 1976.
*Abbreviated at IAEA-B in subsequent references.
24

Appendix A
Derivation of Gain Criterion*
A simple box diagram of the power, P, (or energy, E) cycle is shown below.
PFUSION + 'INJECTE
__ ---_- .- ---_-
For brcakcvcn, PN,:.,- = 0. T11c energy bnlancc is then
PO = I-$ ("IN.JEC'I'ED + pLOSS + "FUSION) = 'I',- cpo + PFIJSION)
Rearranging the last equation gives
1’1: = 1 - 1 E GAIN - I’0 G
(11
If the systcrn is a pulsed machine, replace the P with E to get
I:]: = 1 - 1 : GAIN Eoq
(1')
The fusion power released, PF, (or energy, EF) is
PF = 2 <m> E F" (2) 4
or T r:
'F = I
l-l 2 <UV> E,Z v dt = ,,2 - <uv> EF v 'F (2’1 0 4 4
*Based on a letter from J. Reinmann, NASA Lewis Research Center, 3 Oct. 1977, and conversations with G. Seikel, J. Reinmann, and R. Roth.
25
where 1 . is the time interval during which most of the fusion energy is rele!&ed, namely, when both Ti and n are high simultaneously.
Substituting Eqn. 2 into 1 and rearranging gives
n2 = 4xGAIN = function of Ti cc%'> EF
n 2 4xGAIN -- = <uv> E F = function Of 'Ti
(3)
(3')
Eqn. 3 is a simple (almost model-independent) criterionfor breakeven. This criterion is plotted in Fig. 2 as
Curves are shown for several values of CAIN. Since over311 plant thermal efficicncics of about l/3 < 'IT < l/2 are to be expected, a real fusion reactor must opcratc with paramctcrs above the curves shown for a GAlN of I or 2. 'fhc other GAIN curves arc plotted so that wflcn real experimental parameters are placed on this plot, one can determine how many orders of magnitude the experiment departs from a breakeven device.
Note that -rF is the time during which n and T are both simultaneously high. It is not necessarily the time during which the external energy sources are on, nor the particle or energy containment times.
For Fig. 2, <CIV>DT was calculated from SS of the reference: Hively, L. M.: Nuclear Fusion, 17, 4 (1977). cF was set equal to the total energy released in a D-T reaction, i.e., 14.7 MeV.
26

Appendix B
Nomenclature ___~- A - n, n: peak (average) plasma density, electrons/cm3
E,, PO: energy (or power) input to plasma and necessary auxiliaries, kJ, kW.
Ef, Pf: fusion energy (power) released, kJ, kW.
TF: length of burn where significant fusion occurs, set
+ ‘p: energy (particle) confinement time, set
v : P
plasma volume, cm3
Ti, Te: average ion (electron) temperature, keV
nT: thermal conversion efficiency
EF: energy released per fusion, MeV
-WV> : fusion reactivity for D-T reactions, cm3/sec
'TF: total fusion power thermal output, MW
-Cd: down time between pulses
27
EXPERIMENTS AND PROJECTED REACTORS 6. Performing Organization Code
1
7. Author(s)
George H. Miley
9. Performing Organization Name and Address
Fusion Studies Laboratory University of Illinois Urbana, Illinois 61801
2. Sponsoring Agency Name and Address
National Aeronautics and Space Administration Washington, D. C. 20546
8. Performing Organization Report No.
10. Work Unit No.
11. Contract or Grant No. Purchase Order C-2438-D
13. Type of Report and Period Covered
Contractor Report 14. Sponsoring Agency Code
1 5. Supplementary Notes
Final report. Project Manager, John J. Reinmann, Fluid System Components Division, NASA Lewis Research Center, Cleveland, Ohio 44135.
1 6. Abstract
The performance of NASA Lewis fusion experiments (SUMMA and Bumpy Torus) is compared with other experiments and that necessary for a power reactor. Key parameters cited are gain (fusion power/input power) and the time average fusion power, both of which may be more signifi- cant for real fusion reactors than the commonly used Lawson parameter. The NASA devices are over 10 orders of magnitude below the required powerplant values in both gain and time average power. The best experiments elsewhere are also as much as 4 to 5 orders of magnitude low. However, the NASA experiments compare favorably with other “alternate approaches” that have received less funding than the mainline experiments. The steady-state character and efficiency of plasma heating are strong advantages of the NASA approach. The problem, though, is to move ahead to experiments of sufficient size to advance in gain and average power parameters.
1. Report No. 2. Government Accession No. 3. Recipient’s Catalog No.
NASA CR-3043 4. Title and Subtitle 5. Report Date
EVALUATION OF PERFORMANCE OF SELECT FUSION October 1978
1 7. Key Words (Suggested by Author(s) J
Fusion reactor evaluation 18. Distribution Statement
Unclassified - unlimited STAR Category 75
1 9. Security Classif. (of this report) 1 20. Security Classif. (of this page) 1 21. No. of Pages 1 22. Price’
Unclassified Unclassified 29 A03
* For sale by the National Technical Information Service, Springfield. Virginia 22161 NASA-Langley, 1978