evaluation of ott pluvio precipitation gage versus belfort ... · u.s. department of the interior...
TRANSCRIPT

U.S. Department of the Interior U.S. Geological Survey
Evaluation of OTT PLUVIO Precipitation Gage versus Belfort Universal Precipitation Gage 5-780 for the National Atmospheric Deposition Program
Water-Resources Investigations Report 03–4167
A product of the Atmospheric Deposition Program

(Back of Cover)

Evaluation of OTT PLUVIO Precipitation Gage versus Belfort Universal Precipitation Gage 5-780 for the National Atmospheric Deposition Program
By Mary L. Tumbusch
U.S. GEOLOGICAL SURVEY
Water-Resources Investigations Report 03–4167
A product of the Atmospheric Deposition Program
Carson City, Nevada 2003

U.S. DEPARTMENT OF THE INTERIOR GALE A. NORTON, Secretary
U.S. GEOLOGICAL SURVEY CHARLES G. GROAT, Director
Any use of trade, product, or firm names in this publication is for descriptive purposes only and does not imply endorsement by the U.S. Government
For additional information Copies of this report can be contact: purchased from:
District Chief U.S. Geological Survey U.S. Geological Survey Information Services 333 West Nye Lane, Room 203 Building 810 Carson City, NV 89706–0866 Box 25286, Federal Center
Denver, CO 80225–0286
email: [email protected]
http://nevada.usgs.gov

CONTENTS
Abstract.................................................................................................................................................................................. 1 Introduction............................................................................................................................................................................ 1
Purpose and Scope ..................................................................................................................................................... 2 Acknowledgments...................................................................................................................................................... 2
Approach................................................................................................................................................................................ 4 Instrumentation ...................................................................................................................................................................... 4
Belfort Universal Precipitation Gage 5-780............................................................................................................... 4 OTT PLUVIO Precipitation Gage.............................................................................................................................. 5 NovaLynx Model 260-2510 Standard Rain and Snow Gage ..................................................................................... 5
Phase III Testing .................................................................................................................................................................... 6 Results.................................................................................................................................................................................... 9
Comparison of Data from Belfort Universal Precipitation Gage 5-780 and OTT PLUVIO Precipitation Gage....... 9 Site AL99........................................................................................................................................................ 9 Site IL11 ......................................................................................................................................................... 10 Site MN16....................................................................................................................................................... 12 Site NV03 ....................................................................................................................................................... 16 Site PA15 ........................................................................................................................................................ 16 Site WY95 ...................................................................................................................................................... 16
Comparison of Data from NovaLynx Model 260-2510 Standard Rain and Snow Gage with Data from Belfort Universal Precipitation Gage 5-780 and OTT PLUVIO Precipitation Gage ....................................................... 20
Site IL11 ......................................................................................................................................................... 20 Site PA15 ........................................................................................................................................................ 22
Summary................................................................................................................................................................................ 24 References Cited.................................................................................................................................................................... 25
FIGURES
1. Map showing location of NADP/NTN sites across the conterminous United States ............................................ 3 2. Photograph showing Belfort 5-780 precipitation gage, at site NV03, showing Belfort rotating chart .................. 4 3. Photographs showing (A) OTT PLUVIO precipitation gage with stainless steel housing, at site NV03.
(B) OTT PLUVIO precipitation gage with stainless steel housing removed showing collection bucket and data logger....................................................................................................................................................... 5
4. (A) Sketch map showing placement of OTT PLUVIO and Belfort 5-780 precipitation gages and Aerochem sample collector at site NV03. (B) Photograph of site NV03 looking north ....................................... 7
5. Boxplots showing differences, in inches, between the daily precipitation measured by the Belfort 5-780 and OTT PLUVIO precipitation gages................................................................................................................. 10
6-12. Graphs showing (A) Cumulative precipitation. (B) Frequency analysis of the difference between precipitation measurements by Belfort 5-780 gage minus OTT PLUVIO precipitation gage:
6. Site AL99........................................................................................................................................................ 11 7. Site IL11 East ................................................................................................................................................. 13 8. Site IL11 West ................................................................................................................................................ 14 9. Site MN16....................................................................................................................................................... 15
10. Site NV03 ....................................................................................................................................................... 17 11. Site PA15 ........................................................................................................................................................ 18 12. Site WY95 ...................................................................................................................................................... 19
13. Graph showing cumulative precipitation from the Belfort 5-780 and OTT PLUVIO precipitation gages, and NovaLynx Model 260-2510 Standard Rain and Snow Gage at site IL11....................................................... 20
CONTENTS III

14. Graph showing differences, in inches, of precipitation measurements between the Belfort 5-780 and OTT PLUVIO precipitation gages, and the NovaLynx Model 260-2510 Standard Rain and Snow Gage at site IL11................................................................................................................................................................. 21
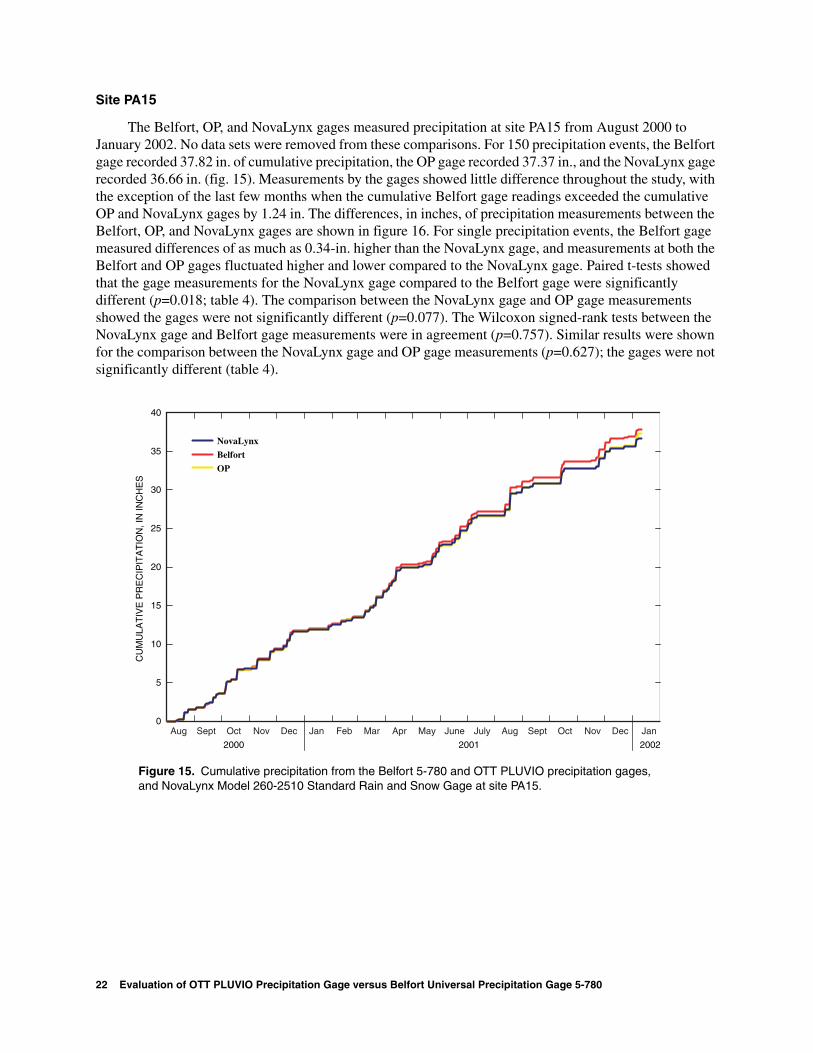
15. Graph showing cumulative precipitation from the Belfort 5-780 and OTT PLUVIO precipitation gages, and NovaLynx Model 260-2510 Standard Rain and Snow Gage at site PA15............................................................. 22
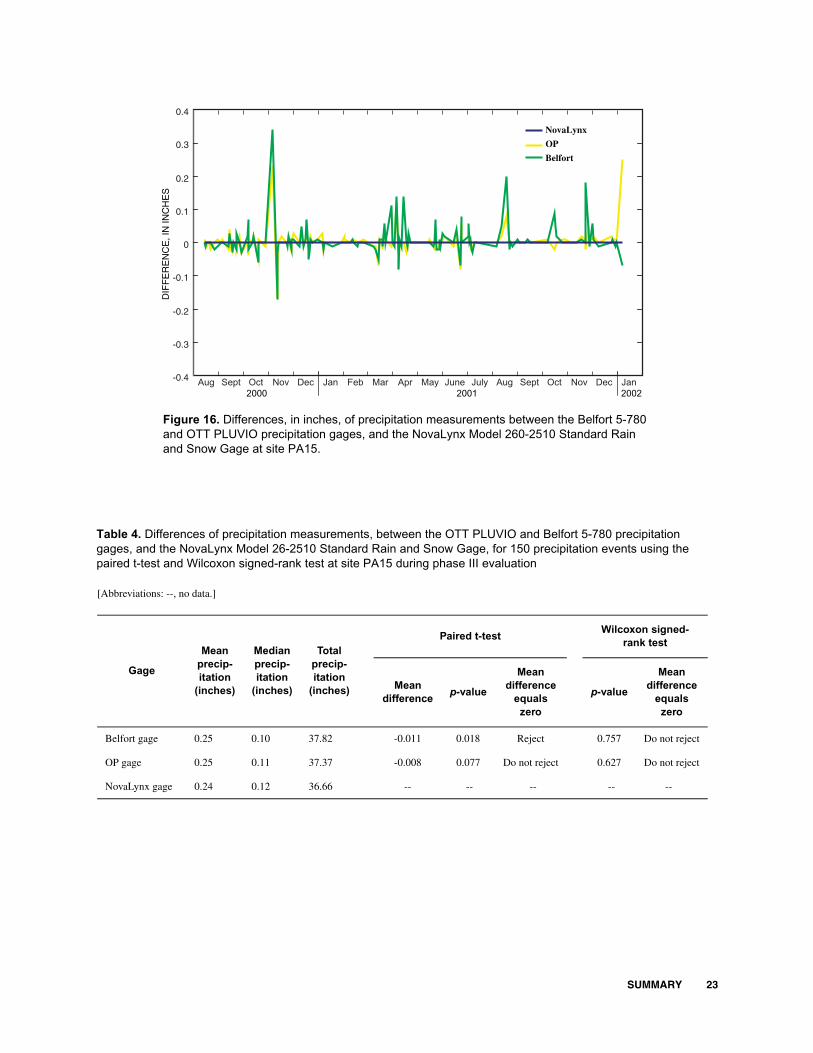
16. Graph showing differences, in inches, of precipitation measurements between the Belfort 5-780 and OTT PLUVIO precipitation gages, and the NovaLynx Model 260-2510 Standard Rain and Snow Gage at site PA15 ................................................................................................................................................................ 23
TABLES
1. Differences of precipitation measurements, between the OTT PLUVIO and Belfort 5-780 precipitation gages, collected at the National Trends Network sites during phase III evaluation .............................................. 8
2. Differences of measurements at the National Trends Network sites using the paired t-test and the Wilcoxon signed-rank test during phase III evaluation .......................................................................................................... 12
3. Differences of precipitation measurements, between the OTT PLUVIO and Belfort 5-780 precipitation gages, and the NovaLynx Model 260-2510 Standard Rain and Snow Gage, for 144 precipitation events, using the paired t-test and Wilcoxon signed-rank test at site IL11 during phase III evaluation ............................ 21
4. Differences of precipitation measurements, between the OTT PLUVIO and Belfort 5-780 precipitation gages, and the NovaLynx Model 260-2510 Standard Rain and Snow Gage, for 150 precipitation events using the paired t-test and Wilcoxon signed-rank test at site PA15 during phase III evaluation............................ 23
CONVERSION FACTORS
Multiply By To obtain
inch (in.) 25.4 millimeter foot (ft) 0.3048 meter
IV Evaluation of OTT PLUVIO Precipitation Gage versus Belfort Universal Precipitation Gage 5-780

Evaluation of OTT PLUVIO Precipitation Gage versus Belfort Universal Precipitation Gage 5-780 for the National Atmospheric Deposition Program
by Mary L. Tumbusch
ABSTRACT
The National Atmospheric Deposition Program, a cooperative effort supported by Federal, State, and local agencies, and Indian Tribes, was established in 1977 to study atmospheric deposition and its impact on the environment. The program's National Trends Network now includes wet-deposition networks at more than 250 sites across the United States, Canada, Puerto Rico, and the Virgin Islands. Precipitation amounts are currently measured using a Belfort Universal Precipitation Gage 5-780, which involves technology that is more than 50 years old.
In 1999, a three-phase study was begun to evaluate several weighing, all-weather precipitation gages to find a possible replacement for the Belfort Universal Precipitation Gage 5-780. One gage that performed consistently well in phase I and II testing was the OTT PLUVIO Precipitation Gage. Phase III of the study, discussed herein, was to determine the accuracy and comparability of the data sets collected by the OTT PLUVIO Precipitation Gage and the existing Belfort Universal Precipitation Gage 5-780. Seven OTT PLUVIO Precipitation Gages were installed at six National Trends Network sites across the country for a data-collection period of approximately 18 months. The NovaLynx Model 260-2510 Standard Rain and Snow Gage also was used, as a reference, at two of the sites. Paired t-tests analysis showed no significant differences in precipitation measurements between the Belfort Universal Precipitation Gage 5-780 and the OTT PLUVIO Precipitation Gages at three of the six sites. When the false positives were removed from the precipitation-event data sets, the gages at all sites were in agreement and the paired t-tests showed the gage measurements were not significantly different. A false positive is defined as a zero response from the Belfort Universal Precipitation Gage 5-780 concurrent with a recorded response from the OTT PLUVIO Precipitation Gage.
INTRODUCTION
Since 1977, the National Atmospheric Deposition Program (NADP) has measured atmospheric deposition1 and its effects on the environment. The NADP is a cooperative effort of Federal, State, and local agencies, and Indian Tribes, to provide a long-term record of precipitation data of the United States, Canada, Puerto Rico, and the Virgin Islands (National Atmospheric Deposition Program, 2003). The NADP consists of three distinct wet-deposition2 networks: the National Trends Network (NTN), the Mercury Deposition Network (MDN), and the Air Resource and Monitoring Network (AIRMoN). NTN is a weekly monitoring network designed to collect data on the chemistry of precipitation for geographical and temporal long-term
1Atmospheric deposition is the process whereby airborne particles and gases are deposited on the earth’s surface. 2Wet deposition is the part of atmospheric deposition that is contained in precipitation.
ABSTRACT 1

trends in acidity, nutrients, and base cations (Gordon, 2003). The Aerochem collection sampler is used by the NTN to collect samples for the chemical analysis of precipitation. Figure 1 shows the NTN monitoring sites across the conterminous United States (National Atmospheric Deposition Program, 2002). The MDN was developed to monitor weekly concentrations of total and methyl mercury in precipitation and to evaluate the seasonal and annual flux of mercury in wet deposition. AIRMoN was designed to measure daily precipitation chemistry for acidity, nutrients, and base cations (Gordon, 2003).
Precipitation amounts are measured at all three NADP networks using the Belfort Universal Precipitation Gage 5-780 (hereafter, referred to as Belfort gage). The Belfort gage uses mechanical linkages and analog chart recorders, technology that is more than 50 years old. Many of the Belfort gages have been collecting data in the field for more than 15 years. However, in 1997, the Belfort gages had more than 180 equipment failures (Claybrooke and others, 2000). Concerns regarding the reliability and labor intensive operation of the Belfort gages, and the improvements made in precipitation gage technology, prompted the NADP to evaluate the performance of more advanced weighing, all-weather precipitation gages as possible replacements for the Belfort gages.
In 1999, the U.S. Geological Survey (USGS) Atmospheric Deposition Program began a three-phase study to compare the performance of several precipitation gages to the performance of the Belfort gage with reference to the NovaLynx Model 260-2510 Standard Rain and Snow Gage (hereafter, referred to as NovaLynx gage), which is used nationwide by the National Weather Service. Phase I consisted of indoor bench testing with known amounts of simulated precipitation. Phase II consisted of 26 weeks of actual precipitation collection at a single outdoor test site near Bay St. Louis, Mississippi. The OTT PLUVIO Precipitation Gage (hereafter, referred to as OP gage) performed consistently well. In phase I, the OP gage had the lowest cumulative error totals for up to 3 in. of simulated precipitation and the second lowest cumulative error totals between 4 and 8 in. In phase II, the OP gage operated trouble-free during a 6-month testing period. The median absolute difference in simulated precipitation between the OP gage and the reference NovaLynx gage was 0.04 in. during a 26-week period of testing. The difference in simulated precipitation between the NovaLynx gage and the Belfort gage was 1.23 in. (Gordon, 2003). Phase III has consisted of further testing of the OP gage.
Purpose and Scope
This report describes the results of phase III of the precipitation-gage evaluation. Phase III testing evaluated the accuracy and comparability of the precipitation data collected by the OP gages and the existing Belfort gages installed at six NTN sites across the United States (fig. 1). The data were compared to help NADP determine whether the OP gage would be a suitable replacement for the Belfort gage in accuracy, ease of operation, and reliability.
The scope of the work included OP gage installation at six NTN sites across the United States, weekly data acquisition from OP dataloggers and Belfort gages for 18 months of data collection, compilation of data, and statistical comparison of gage measurements on an event and cumulative basis.
Acknowledgments
The author is grateful to the site operators who assisted in this study; Kevin Miller, Tennessee Valley Authority; Roger Claybrooke, Illinois State Water Survey; Art Elling and Alan Ellsworth, U.S. Department of Agriculture Forest Service; Robert Ziegler, Penn State University; and Laurie Bonner, U.S. Geological Survey.
2 Evaluation of OTT PLUVIO Precipitation Gage versus Belfort Universal Precipitation Gage 5-780

INT
RO
DU
CT
ION
3
Figure 1. Location of NADP/NTN sites across the conterminous United States. Six study sites for the precipitation gage comparison study are also shown.
MN16(Marcell,
Minnesota)
WY95(Brooklyn Lake,
Wyoming)
NV03(Smith Valley,
Nevada)
IL11(Bondville,
Illinois)
PA15(Penn State,Pennsylvania)
AL99(Sand Mountain,
Alabama)

APPROACH
The USGS purchased six of the OP gages and the NADP purchased one. The gages were installed at six NTN sites across the United States (two of the gages were at one site). The sites have varied climate conditions, equipment configurations, topographic settings, and power availability. The OP gages were in place for about 18 months. The data were downloaded from the OP data loggers and collected at the Belfort precipitation gages weekly. Data from the OP gages were statistically compared with the data collected from the Belfort gages. The NovaLynx gages, at two sites, were used as a reference to evaluate accuracy. The seven gages were installed at the following six test sites: Sand Mountain, Ala. (AL99); Bondville, Ill. (IL11 East and West); Marcell, Minn. (MN16); Smith Valley, Nev. (NV03); Penn State, Pa. (PA15); and Brooklyn Lake, Wyo. (WY95).
INSTRUMENTATION
Belfort Universal Precipitation Gage 5-780
The Belfort gage (fig. 2) converts the weight of collected precipitation into an equivalent depth of water. An 8-in. diameter, knife-edge orifice collects all forms of precipitation. Precipitation travels through a funnel into the galvanized weighing bucket, which rests on a platform supported by a calibrated weighing spring. During the winter, the funnel is removed in order to collect snow, and anti-freeze is added to the bucket to prevent freezing. As the bucket fills with precipitation, the spring is depressed, causing a dual traverse pen system to record the accumulated precipitation on a rotating chart. Gage capacity of 12 in. is standard (Belfort Instrument Company, 2002).
Figure 2. Belfort 5-780 precipitation gage, at site NV03, showing Belfort rotating chart.
4 Evaluation of OTT PLUVIO Precipitation Gage versus Belfort Universal Precipitation Gage 5-780
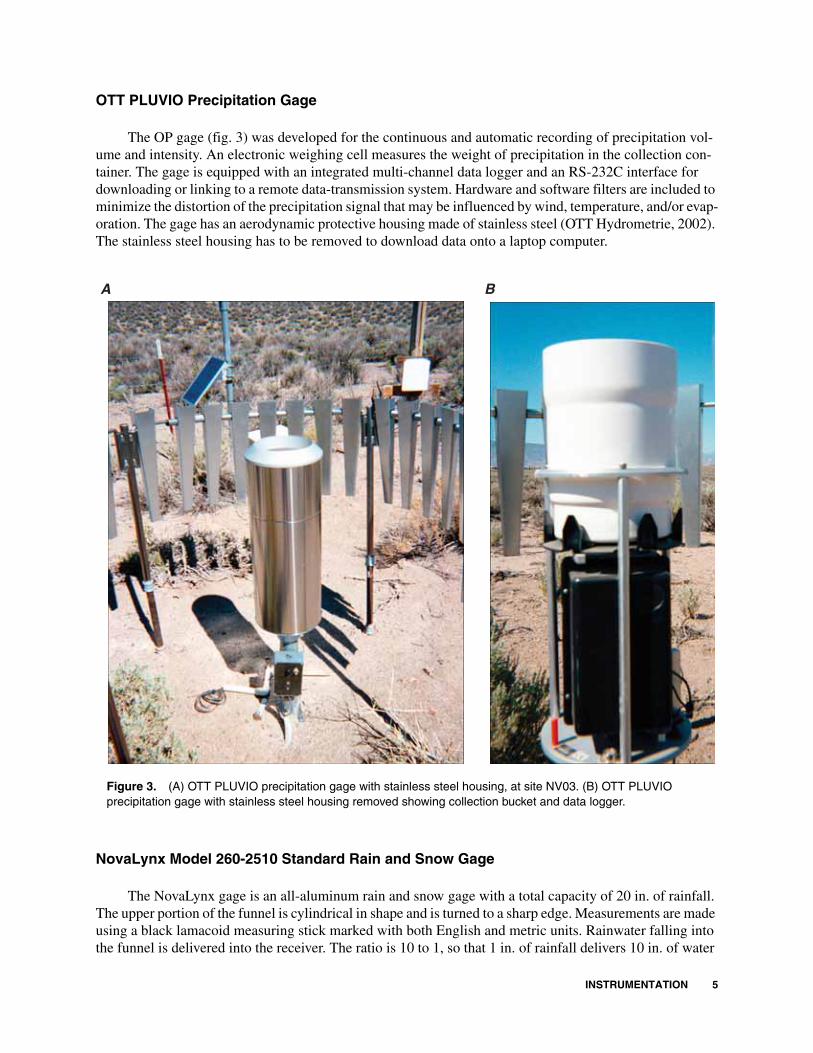
OTT PLUVIO Precipitation Gage
The OP gage (fig. 3) was developed for the continuous and automatic recording of precipitation volume and intensity. An electronic weighing cell measures the weight of precipitation in the collection container. The gage is equipped with an integrated multi-channel data logger and an RS-232C interface for downloading or linking to a remote data-transmission system. Hardware and software filters are included to minimize the distortion of the precipitation signal that may be influenced by wind, temperature, and/or evaporation. The gage has an aerodynamic protective housing made of stainless steel (OTT Hydrometrie, 2002). The stainless steel housing has to be removed to download data onto a laptop computer.
A B
Figure 3. (A) OTT PLUVIO precipitation gage with stainless steel housing, at site NV03. (B) OTT PLUVIO precipitation gage with stainless steel housing removed showing collection bucket and data logger.
NovaLynx Model 260-2510 Standard Rain and Snow Gage
The NovaLynx gage is an all-aluminum rain and snow gage with a total capacity of 20 in. of rainfall. The upper portion of the funnel is cylindrical in shape and is turned to a sharp edge. Measurements are made using a black lamacoid measuring stick marked with both English and metric units. Rainwater falling into the funnel is delivered into the receiver. The ratio is 10 to 1, so that 1 in. of rainfall delivers 10 in. of water
INSTRUMENTATION 5

to the receiver. Any excess flow into the outer chamber can be measured after the quantity in the receiver has been measured and removed. The gage can be read to 0.01 in. When used as a snow gage, the receiver and funnel are removed and snowfall is measured directly (NovaLynx Corporation, 2002).
PHASE III TESTING
Phase III testing was done at six NTN sites across the country (fig. 1) for about 18 months. Standard operating procedures written for the installation, operation, and maintenance of the OP gages were followed during the installation. The OP gages were placed at the chosen NTN sites, following guidelines from the National Atmospheric Deposition Program (2001). These guidelines state that the gage is to be placed more than 16 ft (5 m) from the existing Belfort gage and Aerochem sample collector (fig. 4).
The initial data-collection period, for the study reported herein, began in July 2000, and ended on January 15, 2002. Throughout the data-collection period, collection dates varied and missing data occurred for various reasons. The OP gage was removed from the NV03 site from April through August 2001 for bench testing of the satellite telemetry interface in the lab. However, the OP gage was unable to communicate with the Sutron Corporation 8210 Data Recorder and Transmitter for telemetry purposes. One concern that the site operators noted when downloading data onto a laptop computer was that the laptops did not function well in cold weather. Other concerns when downloading the data were the software was not easy to use, transmission of the data was complicated, and four files are required for each download. Problems with data retrieval from site WY95 were downloading and transmitting the data; therefore, only 24 precipitation events were recorded. The site operator at AL99 stopped collecting data from the OP gage at the beginning of January 2002 because of problems downloading the OP gage data.
The sites were visited every Tuesday following NTN protocol. Each week the regular NTN site operator retrieved the data electronically from the OP gage, changed the paper charts in the Belfort gage, and performed regular maintenance of all gages. Information about site operations, sample conditions, precipitation records and sample chemistry was recorded on the Field Observer's Report Form (FORF). The data retrieved from the OP gages were sent to the experiment coordinator in an e-mail attachment along with notation about site conditions and any foreign substances that may have accumulated in the bucket. Addition of oil or antifreeze, evaporation losses, or dumping of gage content were taken into account and noted on the FORF.
Data loss varied considerably from gage to gage (table 1). The major problems with the Belfort gage were mechanical, whereas, problems with the OP gage were with downloading data. The OP gages at sites IL11 West and PA 15 had the least amount of difficulty. Site IL11 West OP gage had 6 days of lost data out of 526 days of operation, whereas the Belfort gage had 57 days of lost data. The OP gages at site PA15 lost 12 days of data out of 523 days of operation, and the Belfort gage at the same site had 37 days of lost data.
The Belfort and OP gages at site NV03 were the only instruments in the phase III study that were equipped with rain shields. Currently, precipitation gage shielding is optional at NTN sites. According to Gordon (2003), previous precipitation gage studies describe the difficulties involved in obtaining accurate measurements of solid (snow/ice) and liquid (rain) precipitation. Many of these studies concluded that over-catch due to raindrop splash, undercatch due to wind velocity and shielding, and errors associated with the diameter of the gage orifice, the amount of time the orifice was open, and the type of rain gage used contributed the most to measurement precision and accuracy. Gordon (2003) references Yang and others (1999), who state that wind-induced gage undercatch of precipitation is the greatest source of bias in precipitation observations. According to Yang and others (1999), numerous studies have shown that a shielded gage can catch up to 50 percent more precipitation than its unshielded counterpart for the same environmental conditions. For the purpose of this study, wind-induced gage undercatch of precipitation was not considered.
6 Evaluation of OTT PLUVIO Precipitation Gage versus Belfort Universal Precipitation Gage 5-780

A Fence
B
l l le
collector
21.6 feet (6.6 meters)
Gate
20.7
feet
(6.3
met
ers)
19.0 feet (5.8 meters)
N
Belfort gage
So ar pane Aerochem samp
OP gage
Figure 4. (A) Placement of OTT PLUVIO and Belfort 5-780 precipitation gages and Aerochem sample collector at site NV03. (B) Site NV03 looking north.
PHASE III TESTING 7

collected at the National Trends Network
ives removed from data set
Adjustedmean
precip-itation,
OP/Belfort(inches)
Adjustedmedianprecip-itation,
OP/Belfort(inches)
Adjustedtotal
precip-itation,
OP/Belfort(inches)
0.44/0.42 0.20/0.20 61.19/58.83
0.27/0.26 0.10/0.09 30.26/29.99
0.30/0.29 0.13/0.12 43.04/42.13
0.17/0.17 0.05/0.06 34.72/33.98
0.05/0.05 0.02/0.02 2.39/2.18
0.20/0.21 0.07/0.08 37.39/38.09
0.24/0.25 0.08/0.08 4.26/4.08
8 Evalu
ation
of O
TT
PL
UV
IO P
recipitatio
n G
age versu
s Belfo
rt Un
iversal Precip
itation
Gag
e 5-780
collected at the National Trends Network
ives removed from data set
Adjusted Adjusted Adjusted total mean median
precip- precip- precip-itation, itation, itation,
OP/Belfort OP/Belfort OP/Belfort (inches) (inches) (inches)
0.44/0.42 0.20/0.20 61.19/58.83
0.27/0.26 0.10/0.09 30.26/29.99
0.30/0.29 0.13/0.12 43.04/42.13
0.17/0.17 0.05/0.06 34.72/33.98
0.05/0.05 0.02/0.02 2.39/2.18
0.20/0.21 0.07/0.08 37.39/38.09
0.24/0.25 0.08/0.08 4.26/4.08
Table 1. Differences of precipitation measurements, between the OTT PLUVIO and Belfort 5-780 precipitation gages, sites during Phase III evaluation
[Abbreviations: OP, OTT PLUVIO precipitation gage; Belfort, Belfort 5-780 precipitation gage.]
Site
Numberof daysgages
were inoperation
Numberof daysof lostdata,
OP/Belfort
Precipitation events data set False posit
Number ofprecip-itationevents
Mean precip-itation,
OP/Belfort(inches)
Medianprecip-itation,
OP/Belfort(inches)
Totalprecip-itation,
OP/Belfort(inches)
Numberof
falsepositivesremoved
Adjustednumber
ofevents
AL99 525 41/57 167 0.37/0.35 0.08/0.08 61.51/58.83 27 140
IL11 East 432 22/57 192 0.17/0.16 0.03/0.00 32.69/29.99 78 114
IL11 West 526 6/57 230 0.19/0.18 0.03/0.01 44.55/42.13 86 144
MN16 505 25/26 278 0.13/0.12 0.02/0.02 35.26/33.98 78 200
NV03 497 139/26 141 0.03/0.02 0.01/0.00 3.60/2.18 94 47
PA15 523 12/37 196 0.19/0.19 0.05/0.05 37.50/38.09 11 185
WY95 526 470/57 24 0.18/0.17 0.07/0.06 4.38/4.08 6 18
sites duri
Mean Median Site of
false of
precip
ng p Table 1. Differences of precipitation measurements, between the OTT PLUVIO and Belfort 5-780 precipitation gages,
hase III evaluation
[Abbreviations: OP, OTT PLUVIO precipitation gage; Belfort, Belfort 5-780 precipitation gage.]
Precipitation events data set False posit
Number Number of days of days Total Number
Number of gages of lost precip- precip- precip-Adjusted number were in data, itation, itation, itation,
operation OP/Belfort itation OP/Belfort OP/Belfort OP/Belfort positives
events (inches) (inches) (inches) removed
events
AL99 525 41/57 167 0.37/0.35 0.08/0.08 61.51/58.83 27 140
IL11 East 432 22/57 192 0.17/0.16 0.03/0.00 32.69/29.99 78 114
IL11 West 526 6/57 230 0.19/0.18 0.03/0.01 44.55/42.13 86 144
MN16 505 25/26 278 0.13/0.12 0.02/0.02 35.26/33.98 78 200
NV03 497 139/26 141 0.03/0.02 0.01/0.00 3.60/2.18 94 47
PA15 523 12/37 196 0.19/0.19 0.05/0.05 37.50/38.09 11 185
WY95 526 470/57 24 0.18/0.17 0.07/0.06 4.38/4.08 6 18

RESULTS
Phase III test results for both the Belfort and OP gages were compiled for each site, paired by date, arranged chronologically and graphed to determine unusual patterns or trends. Precipitation gage responses were evaluated by running a data filter on each set of gage data. One data set was developed using precipitation events. False-positive data were removed to create an additional data set. False positives are defined as a recorded response from the OP gage with a zero response from the Belfort gage when the site operator reported a zero precipitation day and no recorded opening of the Aerochem sample collector. False positives (typically 0.01 in.) were attributed to be either wind or temperature related. Precision was indicated by the repeat of results between gages of the same type at sites IL11 East and West.
The Belfort and OP gages were compared on a daily basis at each site and for each set of gages. Data analysis comparing the Belfort and the OP gages consisted of cumulative precipitation graphs for both gages. A frequency analysis run on the differences between the Belfort minus the OP gage measurements were used to evaluate the precipitation-event data sets and the data sets with the false positives removed. A paired t-test was run on all data sets, using a 95-percent confidence interval. Data also were evaluated using a non-parametric statistical test (Wilcoxon signed-rank test) to compare gage performance. The null hypothesis for the analysis was that the mean (paired t-test) or the median (Wilcoxon signed-rank test) difference between the gage measurements equal zero. For the purpose of this study, all of the data recorded by the NovaLynx gages were used as a reference for comparing precipitation from gages at sites IL11 and PA15. The data collected from the NovaLynx gages did not follow NTN protocol. No data sets were removed from these comparisons.
The box plots in figure 5 show the differences in inches between the daily precipitation measured by the Belfort and OP precipitation gages. Site WY95 was omitted from the box-plot analysis because it provided only a few data points. The median for the six sites listed was at or close to zero indicating the center of distribution of the data. There was a slight variability of distribution between the upper and lower quartiles or the middle 50 percent of the data. The symmetry of the median within the box indicates how the values were clustered in the middle of the data. Sites AL99 and IL11 East show that the values were clustered in the lower and upper ranges of the distribution. The values clustered in the lower range of the distribution indicate the OP gage had higher readings at site AL99. The values clustered in the upper range of the distribution indicate the Belfort gage had higher readings at site IL11 East. Site AL99 had the greatest variability for the entire data set, with the presence of several extreme values or outliers. Site PA15 had the single most extreme outlier, the OP gage measured almost 0.8 in. higher than the Belfort for a single event.
Comparison of Data from Belfort Universal Precipitation Gage 5-780 and OTT PLUVIO Precipitation Gage
Site AL99
The site operator at AL99 stopped collecting data from the OP gage at the beginning of January 2002 because of problems with downloading the OP gage data. From August 2000 through January 9, 2002, total precipitation at the Belfort gage was 58.83 in. Total precipitation measured at the OP gage was 61.51 in. for 167 events (table 1). When the false positives were removed from the data set, the measured precipitation for 140 events at the OP gage was 61.19 in. The cumulative precipitation for both gages was similar throughout the study (fig. 6A). The frequency analysis on the differences between the Belfort and OP gage measurements showed that the OP gage reading was 0.01 in. higher approximately 30 percent of the time. When the false positives were removed the OP gage read 0.01 in. higher 20 percent of the time (fig. 6B). Paired t-tests for both the precipitation events data set (p=0.065) and the data set with the false positives removed (p=0.105) showed no significant difference between the Belfort and OP gage measurements. The Wilcoxon signed-rank tests showed that the Belfort and OP gage measurements for both data sets (p= < 0.004) were significantly different (table 2).
RESULTS 9

Figure 5. Differences, in inches, between the daily precipitation measured by the Belfort 5-780 and OTT PLUVIO precipitation gages.
Site IL11
Phase III testing precision was indicated by the repeat of the results between gages of the same type at sites IL11 East and West. The OP gages at site IL11 were placed about 16 ft apart. The OP gage at IL11 East was not in operation until November 2000. During the first year of data collection, there was a higher occurrence of false positives at the IL11 West OP gage. In order to determine if this occurrence was either gage or placement related, the OP gage at site IL11 West was switched with the OP gage East on September 11, 2001. The gage in question continued to record more false positive measurements after the switch. The OP gage at IL11 East measured 32.69 in. total precipitation and had 22 days of lost data over a period of 432 days of operation. The OP gage at IL11 West measured 44.55 in. cumulative precipitation and had 6 days of lost data over a period of 526 days of operation (table 1).
At site IL11 East, from November 2000 to January 2002, the total precipitation for 192 precipitation events at the Belfort gage was 29.99 in., whereas the OP gage measured 32.69 in. After removing the false positives, the OP gage measured a cumulative precipitation of 30.26 in. (table 1). Although the cumulative precipitation for both gages was within about an inch throughout most of the study, the OP gage was reading up to 2.5 in. higher than the Belfort gage after the OP gages were switched in September 2001 (fig. 7A). From September 18 through October 2, 2001, the OP gage measured as much as 0.36 in. precipitation almost daily, the Belfort gage recorded very little precipitation, without any problems noted by the site operator. The frequency analysis showed the OP gage was reading 0.01 in. higher than the Belfort gage 31 percent of the time. The OP gage read 0.01 in. higher approximately 19 percent of the time when the false positives were removed (fig. 7B). A paired t-test for the precipitation events data set (p=0.002) showed the Belfort and OP gage measurements were significantly different. When the false positives were removed, the
10 Evaluation of OTT PLUVIO Precipitation Gage versus Belfort Universal Precipitation Gage 5-780

-0.4
0
A
0
10
20
30
40
50
60
70
2000 2001 2002
CU
MU
LAT
IVE
PR
EC
IPIT
AT
ION
, IN
INC
HE
S
AL99 OP (61.51 inches)
AL99 Belfort (58.83 inches)
Aug Sept Oct Nov Dec Jan Feb Mar Apr May June July Aug Sept Oct Nov Dec Jan
AL99 AL99 false positives removed
40
45
50
35
30
25
20
15
10
5
PE
RC
EN
T F
RE
QU
EN
CY
B
-0.3
5
-0.3
0
-0.2
5
-0.2
0
-0.1
5
-0.1
0
-0.0
5 0
BELFORT - OP
Figure 6. (A) Cumulative precipitation. (B) Frequency analysis of the difference between precipitation measurements by Belfort 5-780 gage minus OTT PLUVIO precipitation gage at site AL99. Data outside the limits of this graph: -0.71, -0.62, -0.42, and 0.57.
0.00
0.05
0.10
0.15
0.20
0.25
0.30
0.35
0.40
RESULTS 11

Site
p Mean
Mean p
Median p
Median
Do not Reject 0.004 Reject
Reject Do not
~0 Reject Do not
Do not ~0 Reject
Do not
Do not ~0 Reject
Do not
NV03 Do not
Reject 0.041 Reject
Do not Do not Do not
WY95 Do not
Reject Do not
p
p
Table 2. Differences of measurements at the National Trends Network sites using the paired t-test and the Wilcoxon signed-rank test during hase III evaluation
Precipitation event data set False positives removed Precipitation
event data set False positives
removed
Mean difference
-value Mean
equals difference
-value equals -value equals -value equals zero zero zero zero
Paired t-test Wilcoxon signed-rank test
AL99 0.016 0.065 Do not reject
0.016 0.105 reject
~0
IL11 East 0.014 0.002 0.002 0.696 reject
0.733 reject
IL11 West 0.011 0.009 Reject -0.006 0.312 reject
0.205 reject
MN16 -0.005 0.023 Reject -0.004 0.158 reject
0.116 reject
0.011 0.001 Reject 0.004 0.583 reject
~0
PA15 0.003 0.566 Do not reject
0.004 0.495 reject
0.649 reject
0.332 reject
-0.013 0.380 Do not reject
-0.010 0.598 reject
0.031 0.208 reject
analysis indicated no significant difference between gage measurements, the p-value of 0.696 was very high. The Wilcoxon signed-rank test showed the Belfort and OP gage measurements for the precipitation events data set (p=~0) were significantly different. The data set with false positives removed had the highest p-value, 0.733, indicating no significant difference between gage measurements (table 2).
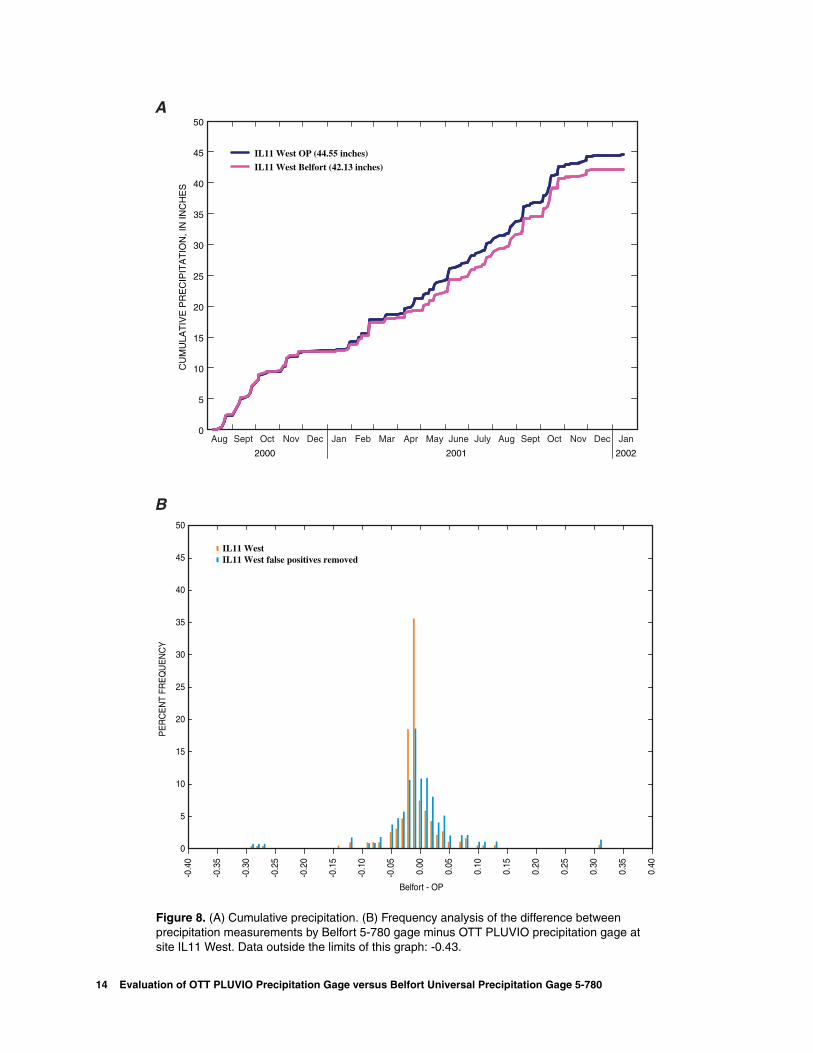
At site IL11 West, from August 2000 to January 2002, the total precipitation for 230 events at the Belfort gage was 42.13 in., and the OP gage measured 44.55 in. When the false positives were removed, the total precipitation measured at the OP gage was 43.04 in. (table 1). The difference between the cumulative precipitation at both gages was less than 2.5 in. during the study (fig. 8A). The frequency analysis showed that the OP gage read 0.01 in. higher than the Belfort gage 37 percent of the time. The OP gage was 0.01 in. higher 20 percent of the time when the false positives were removed (fig. 8B). Paired t-test (p=0.009) and Wilcoxon signed-rank test (p=~0) results for the gage measurements were significantly different for the precipitation events data set. After false positives were removed, for 144 events, the gage measurement results were not significantly different for either the paired t-test (p=0.312) or the Wilcoxon signed-rank test (p=0.205; table 2).
Site MN16
Measured precipitation for 278 events at site MN16, from August 2000 through January 2002, using the Belfort gage was 33.98 in. The measured precipitation for the OP gage was 35.26 in. (table 1). When the false positives were removed, the OP gage measured 34.72 in. of total precipitation for 200 events. Cumulative precipitation measurements were equal or nearly equal until the middle of June 2001; since then, measurements were less than 1.3 in. apart throughout the rest of the study (fig. 9A). The site operator reported that 12 tent caterpillars were found in the OP gage collection bucket the week of June 19; this could explain the jump in precipitation that was measured. The frequency analysis showed that the OP gage read 0.02 in. higher than the Belfort gage 22 percent of the time. When the false positives were removed, the OP gage read 0.02 in. higher than the Belfort gage 26 percent of the time (fig. 9B). Paired t-test for the precipitation events data set showed the gage measurements were significantly different (p=0.023). When the false positives were removed from the data set, the paired t-test showed no significant difference (p=0.158) between the gage measurements. The Wilcoxon signed-rank test showed the gage measurements were significantly different (p=~0) for the data set with 278 events and showed no significant difference between the gage measurements (p=0.116) when the false positives were removed (table 2).
12 Evaluation of OTT PLUVIO Precipitation Gage versus Belfort Universal Precipitation Gage 5-780

A
0
5
10
15
20
25
30
35
CU
MU
LAT
IVE
PR
EC
IPIT
AT
ION
, IN
INC
HE
S
IL11 East OP (32.69 inches)
IL11 East Belfort (29.99 inches)
2000 2001 2002
Nov Dec Jan Feb Mar Apr May June July Aug Sept Oct Nov Dec Jan
IL11 East IL11 East false positives removed
40
45
50
35
30
25
20
15
10
5
PE
RC
EN
T F
RE
QU
EN
CY
B
-0.4
0
-0.3
5
-0.3
0
-0.2
5
-0.2
0
-0.1
5
-0.1
0
-0.0
5
0.00
0.05
0.10
0.15
0.20
0.25
0.30
0.35
0.40
0
Belfort - OP
Figure 7. (A) Cumulative precipitation. (B) Frequency analysis of the difference between precipitation measurements by Belfort 5-780 gage minus OTT PLUVIO precipitation gage at site IL11 East.
RESULTS 13
A
0
5
10
15
20
25
30
35
40
45
50
CU
MU
LAT
IVE
PR
EC
IPIT
AT
ION
, IN
INC
HE
S
IL11 West OP (44.55 inches)
IL11 West Belfort (42.13 inches)
2000 2001 2002
Oct Nov Dec Jan Feb Mar Apr Oct Nov Dec Jan
IL11 West IL11 West false positives removed
40
45
50
35
30
25
20
15
10
5
Aug Sept May June July Aug Sept
PE
RC
EN
T FR
EQ
UE
NC
Y
B
-0.4
0
-0.3
5
-0.3
0
-0.2
5
-0.2
0
-0.1
5
-0.1
0
-0.0
5
0.00
0.05
0.10
0.15
0.20
0.25
0.30
0.35
0.40
0
Belfort - OP
Figure 8. (A) Cumulative precipitation. (B) Frequency analysis of the difference between precipitation measurements by Belfort 5-780 gage minus OTT PLUVIO precipitation gage at site IL11 West. Data outside the limits of this graph: -0.43.
14 Evaluation of OTT PLUVIO Precipitation Gage versus Belfort Universal Precipitation Gage 5-780

A
0
5
10
15
20
25
30
35
40
45
CU
MU
LAT
IVE
PR
EC
IPIT
AT
ION
, IN
INC
HE
S
MN16 OP (35.26 inches)
MN16 Belfort (33.98 inches)
2000 2001 2002
Aug Sept Oct Nov Dec Jan Feb Mar Apr May June July Aug Sept Oct Nov Dec Jan
B
MN16 MN16 false positives removed
0
5
10
15
20
25
30
35
40
45
50
PE
RC
EN
T F
RE
QU
EN
CY
-0.4
0
-0.3
5
-0.3
0
-0.2
5
-0.2
0
-0.1
5
-0.1
0
-0.0
5
0.00
0.05
0.10
0.15
0.20
0.25
0.30
0.35
0.40
Belfort - OP
Figure 9. (A) Cumulative precipitation. (B) Frequency analysis of the precipitation measurements by Belfort 5-780 and OTT PLUVIO precipitation gages at site MN16.
RESULTS 15

Site NV03
Total precipitation at site NV03, from September 2000 to January 2002 for 141 events at the Belfort gage was 2.18 in. During the same data-collection period, the OP gage measured 3.60 in. of total precipitation. When the false positives were removed from the data set, the measured precipitation for 47 events at the OP gage was 2.39 in. (table 1). The OP gage recorded 67 percent false positive measurements at the NV03 site. The false positives were suspected to be either wind or temperature related. The number of false positives could be explained by the high incidence of winds, the openness of the site, and the extreme temperatures that are common at the NV03 site.
Figure 10A shows the cumulative precipitation at the NV03 site. During most of the study, the total precipitation measured at the OP gage was approximately 1-in. higher than at the Belfort gage. The frequency analysis showed the OP gage reading 0.01 in. higher than the Belfort gage 75 percent of the time. When false positives were removed, the OP gage read 0.01 in. higher than the Belfort gage 32 percent of the time (fig. 10B). The paired t-test showed that the Belfort and OP gage measurements were significantly different (p=0.001) for 141 events. When the false positives were removed from the precipitation events data set, the paired t-test showed no significant difference (p=0.583) between gage measurements (table 2). The Wilcoxon signed-rank test showed that the Belfort and OP gage measurements were significantly different for both the precipitation events data set (p=~0) and the data set with false positives removed (p=0.041).
Site PA15
From August 2000 until January 2002, the total precipitation measured by the Belfort gage at PA15 was 37.50 in. The OP gage measured 38.09 in. for 196 precipitation events. This was the only time throughout the study that the Belfort gage recorded more total precipitation than the OP gage. When false positives were removed (only 11 were considered false positives), the total precipitation at the OP gage was 37.39 in. (table 1). The cumulative precipitation for both gages showed little difference throughout most of the study, with the final cumulative difference showing less than 1.5 in. precipitation (fig. 11A). The frequency analysis shows that the OP gage read 0.01 in. higher than the Belfort gage 34 percent of the time overall. The OP gage read 0.01 in. higher 30 percent of the time when false positives were removed (fig. 11B). The Belfort and OP gages at site PA15 were in agreement for both statistical analyses. The paired t-test, for the precipitation events data set (p=0.566) and the data set with the false positives removed (p=0.495), showed the gage measurements were not significantly different. The Wilcoxon signed-rank test had similar results (table 2). The gage measurements were not significantly different for the precipitation events data set (p=0.649) or the data set with the false positives removed (p=0.332).
Site WY95
From August through the middle of October 2000, the gages at WY95 site recorded 24 precipitation events. The site operator had many problems downloading and transmitting the data at this site. The laptop computer did not function well in the cold weather; another laptop was used without success. The site operator found that the software was not easy to use and data transmittal was complicated.
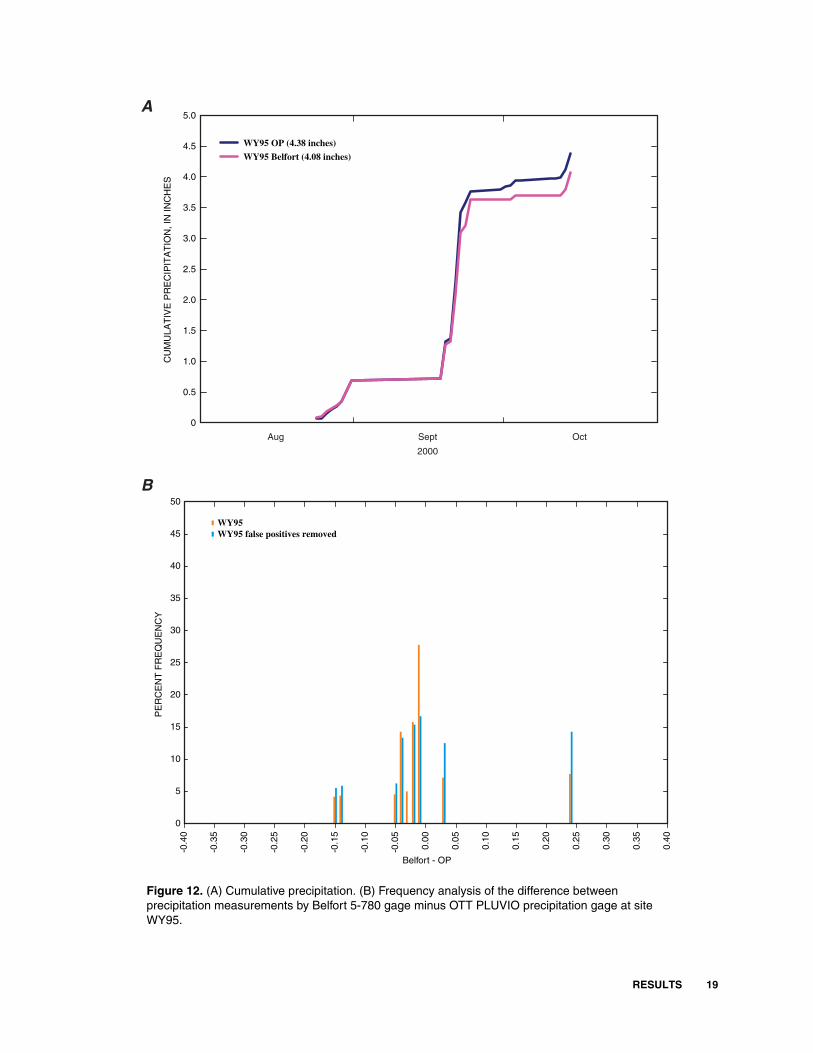
The Belfort gage measured 4.08 in. of total precipitation for 24 precipitation events, whereas, the OP gage measured 4.38 in. When false positives were removed the total precipitation at the OP gage measured 4.26 in. (table 1). The cumulative precipitation measured at the WY95 site for both gages was within 0.5 in. throughout the study (fig. 12A). The frequency analysis showed that the OP gage read 0.01 in. higher than the Belfort gage 28 percent of the time for all data. The OP gage read 0.01 in. higher 17 percent of the time when false positives were removed (fig. 12B). The paired t-test showed that the gage measurements were not significantly different for either the precipitation events data (p=0.380) or for the data sets with false positives removed (p=0.598). The Wilcoxon signed-rank test showed gage measurements were significantly different (p=0.031) for the data set that had 24 precipitation events, and was not significantly different (p=0.208) for 18 of those events when false positives were removed (table 2).
16 Evaluation of OTT PLUVIO Precipitation Gage versus Belfort Universal Precipitation Gage 5-780

A
0
0.5
1.0
1.5
2.0
2.5
3.0
3.5
4.0
CU
MU
LAT
IVE
PR
EC
IPIT
AT
ION
, IN
INC
HE
S
NV03 OP (3.60 inches)
NV03 Belfort (2.18 inches)
2000 2001
Sept Oct Nov Dec Jan Feb Mar Apr May June July Aug Sept Oct Nov Dec
2002
Jan
PE
RC
EN
T F
RE
QU
EN
CY
80
70
60
50
40
30
20
10
NV03 NV03 false positives removed
-0.4
0
-0.3
5
-0.3
0
-0.2
5
-0.2
0
-0.1
5
-0.1
0
-0.0
5
0.00
0.05
0.10
0.15
0.20
0.25
0.30
0.35
0.40
Belfort - OP
Figure 10. (A) Cumulative precipitation. (B) Frequency analysis of the difference between precipitation measurements by Belfort 5-780 gage minus OTT PLUVIO precipitation gage at site NV03.
0
B
RESULTS 17

A
0
5
10
15
20
25
30
35
40
PR
EC
IPIT
AT
ION
, IN
INC
HE
S
PA15 OP (37.50 inches)
PA15 Belfort (38.09 inches)
2000 2001 2002
Aug Sept Oct Nov Dec Jan Feb Mar Apr May June July Aug Sept Oct Nov Dec Jan
PA15 PA15 false positives removed
40
45
50
35
30
25
20
15
10
5
PE
RC
EN
T FR
EQ
UE
NC
Y
B
-0.4
0
-0.3
5
-0.3
0
-0.2
5
-0.2
0
-0.1
5
-0.1
0
-0.0
5
0.00
0.05
0.10
0.15
0.20
0.25
0.30
0.35
0.40
0
Belfort - OP
Figure 11. (A) Cumulative precipitation. (B) Frequency analysis of the difference between precipitation measurements by Belfort 5-780 gage minus OTT PLUVIO precipitation gage at site PA15. Data outside the limits of this graph: -0.79.
18 Evaluation of OTT PLUVIO Precipitation Gage versus Belfort Universal Precipitation Gage 5-780
A
WY95 WY95 false positives removed
40
45
50
0
0.5
1.0
1.5
2.0
2.5
3.0
3.5
4.0
4.5
5.0
CU
MU
LAT
IVE
PR
EC
IPIT
AT
ION
, IN
INC
HE
S
WY95 OP (4.38 inches)
WY95 Belfort (4.08 inches)
35
30
25
20
15
10
5
PE
RC
EN
T F
RE
QU
EN
CY
Aug Sept Oct
2000
B
-0.4
0
-0.3
5
-0.3
0
-0.2
5
-0.2
0
-0.1
5
-0.1
0
-0.0
5
0.00
0.05
0.10
0.15
0.20
0.25
0.30
0.35
0.40
0
Belfort - OP
Figure 12. (A) Cumulative precipitation. (B) Frequency analysis of the difference between precipitation measurements by Belfort 5-780 gage minus OTT PLUVIO precipitation gage at site WY95.
RESULTS 19

Comparison of Data from NovaLynx Model 260-2510 Standard Rain and Snow Gage with Data from Belfort Universal Precipitation Gage 5-780 and OTT PLUVIO Precipitation Gage
Site IL11
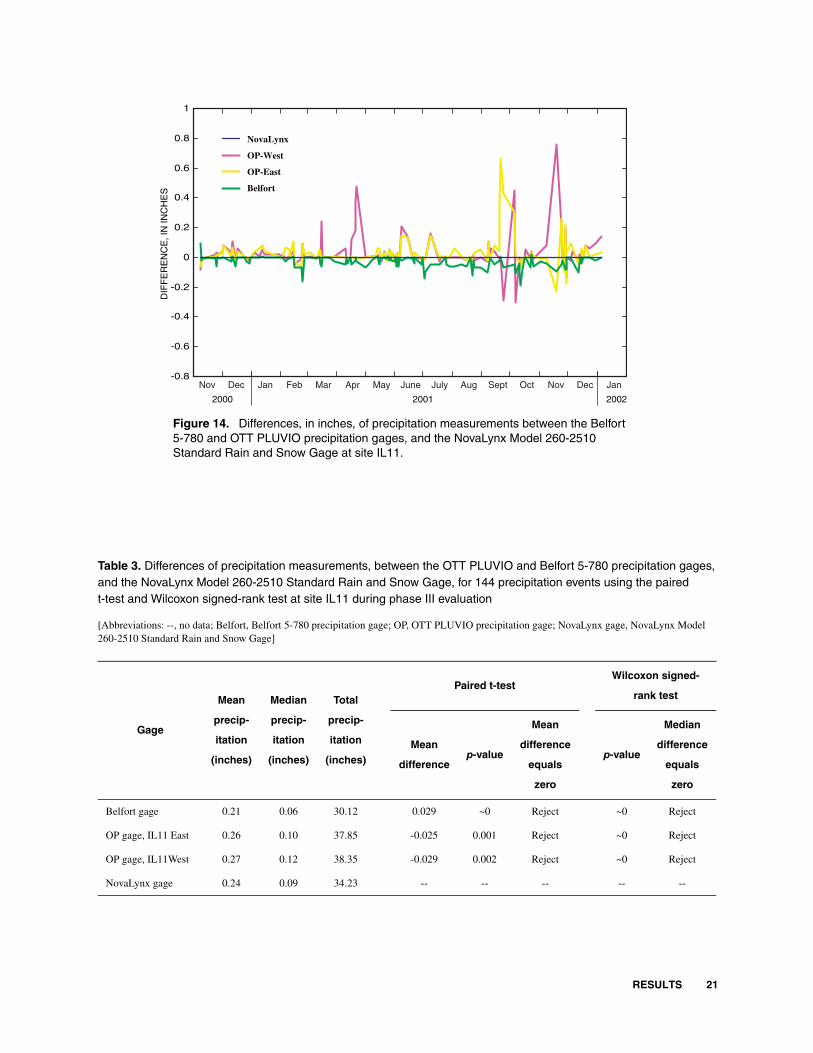
Comparisons made between the Belfort and OP gages at sites IL11 East, IL11 West and the NovaLynx gage included all of the data collected, no data sets were removed. From November 2000 to January 2002, the OP gage at IL11 East recorded 37.85 in., the OP gage at IL11 West recorded 38.35 in., the Belfort gage recorded 30.12 in., and the NovaLynx gage recorded 34.23 in. for 144 cumulative precipitation events. Figure 13 shows the cumulative precipitation measurements at the four gages. Measurements at all gages were similar from November 2000 to March 2001, but diverged throughout the remainder of the study. The OP gages read higher than the NovaLynx gage, as much as 4 in. by January 2002. The Belfort gage read more than 4 in. lower than the NovaLynx gage by the end of the study. The differences in precipitation amounts between the Belfort, OP, and the NovaLynx gages at site IL11 are shown in figure 14. The differences, in inches, were computed subtracting the actual gage measurement from the NovaLynx gage. The results are shown using the NovaLynx gage as zero, with a negative number indicating a higher measured difference and a positive number indicating a lower measured difference. The OP gages measured differences of as much as 0.76 in. higher than the NovaLynx gage, whereas the Belfort gage read consistently lower. Paired t-test comparisons between the NovaLynx gage and Belfort gage showed the measurements were significantly different (p=~0; table 3). Paired t-test comparisons between the NovaLynx gage and the OP gage at IL11 East (p=0.001), and NovaLynx gage and the OP gage IL11 West (p=0.002) showed the gage measurements were significantly different. The Wilcoxon signed-rank test showed the gage measurements for the NovaLynx and Belfort gages (p=~0), NovaLynx and OP gages at IL11 East (p=~0), and NovaLynx and OP gages at IL11 West (p=~0) were significantly different (table 3).
0
5
10
15
20
25
30
35
40
CU
MU
LAT
IVE
PR
EC
IPIT
AT
ION
, IN
INC
HE
S NovaLynx (34.23 inches)
OP-West (38.35 inches)
OP-East (37.85 inches)
Belfort (30.12 inches)
Nov Dec Jan Feb Mar Apr May June July Aug Sept Oct Nov Dec Jan
2000 2001 2002
Figure 13. Cumulative precipitation from the Belfort 5-780 and OTT PLUVIO precipitation gages, and NovaLynx Model 260-2510 Standard Rain and Snow Gage at site IL11.
20 Evaluation of OTT PLUVIO Precipitation Gage versus Belfort Universal Precipitation Gage 5-780
-- ---- -- --
-0.8
-0.6
-0.4
-0.2
0
0.2
0.4
0.6
0.8
1
DIF
FE
RE
NC
E, I
N IN
CH
ES
NovaLynx
OP-West
OP-East
Belfort
Nov Dec Jan Feb Mar Apr May June July Aug Sept Oct Nov Dec Jan
2000 2001 2002
Figure 14. Differences, in inches, of precipitation measurements between the Belfort 5-780 and OTT PLUVIO precipitation gages, and the NovaLynx Model 260-2510 Standard Rain and Snow Gage at site IL11.
i l
Mean Median rank test
precip Mean Median
Reject Reject
p
p p
Table 3. Differences of precipitation measurements, between the OTT PLUVIO and Belfort 5-780 precipitat on gages, and the NovaLynx Mode 260-2510 Standard Rain and Snow Gage, for 144 precipitation events using the paired t-test and Wilcoxon signed-rank test at site IL11 during hase III evaluation
[Abbreviations: --, no data; Belfort, Belfort 5-780 precipitation gage; OP, OTT PLUVIO precipitation gage; NovaLynx gage, NovaLynx Model 260-2510 Standard Rain and Snow Gage]
Paired t-test Wilcoxon signed-
Total
Gage itation
precip
itation
precip
itation Mean difference difference (inches) (inches) (inches) difference
-value equals
-value equals
zero zero
Belfort gage 0.21 0.06 30.12 0.029 ~0 ~0
OP gage, IL11 East 0.26 0.10 37.85 -0.025 0.001 Reject ~0 Reject
OP gage, IL11West 0.27 0.12 38.35 -0.029 0.002 Reject ~0 Reject
NovaLynx gage 0.24 0.09 34.23
RESULTS 21
Site PA15
The Belfort, OP, and NovaLynx gages measured precipitation at site PA15 from August 2000 to January 2002. No data sets were removed from these comparisons. For 150 precipitation events, the Belfort gage recorded 37.82 in. of cumulative precipitation, the OP gage recorded 37.37 in., and the NovaLynx gage recorded 36.66 in. (fig. 15). Measurements by the gages showed little difference throughout the study, with the exception of the last few months when the cumulative Belfort gage readings exceeded the cumulative OP and NovaLynx gages by 1.24 in. The differences, in inches, of precipitation measurements between the Belfort, OP, and NovaLynx gages are shown in figure 16. For single precipitation events, the Belfort gage measured differences of as much as 0.34-in. higher than the NovaLynx gage, and measurements at both the Belfort and OP gages fluctuated higher and lower compared to the NovaLynx gage. Paired t-tests showed that the gage measurements for the NovaLynx gage compared to the Belfort gage were significantly different (p=0.018; table 4). The comparison between the NovaLynx gage and OP gage measurements showed the gages were not significantly different (p=0.077). The Wilcoxon signed-rank tests between the NovaLynx gage and Belfort gage measurements were in agreement (p=0.757). Similar results were shown for the comparison between the NovaLynx gage and OP gage measurements (p=0.627); the gages were not significantly different (table 4).
CU
MU
LAT
IVE
PR
EC
IPIT
AT
ION
, IN
INC
HE
S
40
35
30
25
20
15
10
5
0
NovaLynx
Belfort
OP
Aug Sept Oct Nov Dec Jan Feb Mar Apr May June July Aug Sept Oct Nov Dec Jan
2000 2001 2002
Figure 15. Cumulative precipitation from the Belfort 5-780 and OTT PLUVIO precipitation gages, and NovaLynx Model 260-2510 Standard Rain and Snow Gage at site PA15.
22 Evaluation of OTT PLUVIO Precipitation Gage versus Belfort Universal Precipitation Gage 5-780
-- -- -- -- --
0.4
0.3
DIF
FE
RE
NC
E, I
N IN
CH
ES
0.2
0.1
0
-0.1
-0.2
-0.3
-0.4
NovaLynx
OP
Belfort
Oct Nov Dec Jan Feb Mar Apr July Oct Nov Dec Jan 2000 2001 2002
Mean Median
Mean Mean
Reject
OP gage
p p
Figure 16. Differences, in inches, of precipitation measurements between the Belfort 5-780 and OTT PLUVIO precipitation gages, and the NovaLynx Model 260-2510 Standard Rain and Snow Gage at site PA15.
Table 4. Differences of precipitation measurements, between the OTT PLUVIO and Belfort 5-780 precipitation gages, and the NovaLynx Model 26-2510 Standard Rain and Snow Gage, for 150 precipitation events using the paired t-test and Wilcoxon signed-rank test at site PA15 during phase III evaluation
Aug Sept Aug Sept
precip precip
May June
[Abbreviations: --, no data.]
Total Paired t-test
Wilcoxon signed-rank test
Gage itation
(inches) itation
(inches)
precipitation
(inches) Mean difference
-value difference
equals -value
difference equals
zero zero
Belfort gage 0.25 0.10 37.82 -0.011 0.018 0.757 Do not reject
0.25 0.11 37.37 -0.008 0.077 Do not reject 0.627 Do not reject
NovaLynx gage 0.24 0.12 36.66
SUMMARY 23

SUMMARY
The National Atmospheric Deposition Program (NADP), a cooperative effort supported by Federal, State, and local agencies, and Indian Tribes, was established in 1977 to study atmospheric deposition and its impact on the environment. The program’s National Trends Network (NTN) instituted a wet-deposition network at over 250 sites across the United States, Canada, Puerto Rico, and the Virgin Islands. Precipitation amounts are measured using a Belfort Universal Precipitation Gage 5-780 (Belfort gage), which involves technology that is over 50 years old. In 1999, a three-phase study was begun by the NADP to evaluate several weighing, all-weather precipitation gages to find a possible replacement for the Belfort gage. One gage that performed consistently well, in phase I and II testing, was the OTT PLUVIO Precipitation Gage (OP gage).
Phase III of the study was to determine the accuracy and comparability of the data sets collected by the OP gages and the existing Belfort gages. The OP gages also were evaluated for accuracy, ease of operation, and reliability. Seven OP gages were installed at six NADP/NTN monitoring sites across the country for a data-collection period of approximately 18 months. The NovaLynx Model 260-2510 Standard Rain and Snow Gage was used as a reference at sites IL11 and PA15. The six test sites were: Sand Mountain, Ala. (AL99); Bondville, Ill. (IL11 East and West); Marcell, Minn. (MN16); Smith Valley, Nev. (NV03); Penn State, Penn. (PA15); and Brooklyn Lake, Wyo. (WY95).
Throughout the data-collection period, data were lost for various reasons. Mechanical difficulties were a major problem with the Belfort gages, and the OP gages lost data due to downloading problems. In addition, data-retrieval difficulties caused sites AL99 and WY95 to end participation in the study before the data-collection period ended.
• During the phase III evaluation, daily data for the Belfort and OP precipitation gages were compared for each site and set of gages. The OP gages at IL11 West and PA15 sites were the most trouble free: only 6 days of lost data out of 526 days of operation and only 12 days of lost data out of 523 days of operation, respectively. The corresponding Belfort gage at the IL11 West site lost 57 days of data and the corresponding Belfort gage at PA15 site lost 37 days of data.
• Throughout phase III testing, the cumulative precipitation measured by the OP gages was frequently higher than the precipitation measured by the Belfort gages. The gages at the PA15 site were the exception, with the Belfort gage recording 0.59-in. more cumulative precipitation than the OP gage. The cumulative precipitation differences, for OP gage minus Belfort gage, were: 2.68 in. at site AL99; 2.70 in. at site IL11 East; 2.42 in. at site IL11 West; 1.28 in. at site MN16; 1.42 in. at site NV03; and 0.30 in. at site WY95. When false positives were removed from the data sets, the cumulative precipitation differences, for OP gages minus Belfort gages, were: 2.36 in. at site AL99; 0.27 in. at site IL11 East; 0.91 in. at site IL11 West; 0.74 in. at site MN16; 0.21 in. at site NV03; -0.70 in. at site PA15; and 0.18 in. at site WY95.
• The false positive readings ranged from 11 at site PA15 to 94 at site NV03. The high number of false positives at the NV03 site may be explained by the openness of the area, and the high winds and extreme temperatures that are common at this site.
• Paired t-test analysis between the Belfort and the OP gage precipitation measurements showed no significant differences between the gages at sites AL99, PA15, and WY95. When the false positives were removed from the precipitation-event data sets, the gages at all sites were in agreement and the paired t-tests showed the gage measurements were not significantly different. Wilcoxon signed-rank tests for the precipitation-event data sets showed that only the gage measurements at the PA15 site were not significantly different. When the false positives were removed from the data sets, the analysis showed no significant difference between gage measurements at sites IL11 East, IL11 West, MN16, PA15, and WY95.
24 Evaluation of OTT PLUVIO Precipitation Gage versus Belfort Universal Precipitation Gage 5-780

As part of the phase III testing, the OP and Belfort measurements at sites IL11 and PA15 were compared to data from the NovaLynx gage. No data sets were removed from these comparisons.
• At site IL11, the total precipitation collected from the OP gage at site IL11 East for 144 precipitation events was 37.85 in.; at the IL11 West site the OP gage measured 38.35 in. In contrast, the Belfort gage measured 30.12 in. and the NovaLynx gage measured 34.23 in. Paired t-test comparisons between the NovaLynx and Belfort gages, the NovaLynx and OP gages at site IL11 East, and NovaLynx and OP gages at site IL11 West, showed gage measurements were significantly different. Results of the Wilcoxon signed-rank test and the paired t-test comparison were similar for the NovaLynx and Belfort gages, and for the NovaLynx and OP gages at site IL11 East. For the Nova-Lynx and OP gages at site IL11 West, the Wilcoxon signed-rank test showed gage measurements were significantly different.
• At site PA15, total precipitation for 150 events was 37.82 in. for the Belfort gage, 37.37 in. for the OP gage, and 36.66 in. for the NovaLynx gage. Paired t-test showed that the measurements for the NovaLynx gage were significantly different compared to those for the Belfort gage. The paired t-test showed no significant difference between the NovaLynx gage and the OP gage measurements. Results of the Wilcoxon signed-rank test for the NovaLynx and Belfort gage measurements were in agreement. Similar results were shown for the NovaLynx and OP gage comparison; the measurements from these gages were not significantly different.
REFERENCES CITED
Belfort Instrument Company, 2002, Universal precipitation gauge: Series 5-780/5915, accessed June 10, 2002 at URL <http://www.belfortinstrument.com/products/precipitation/m5-780.html>
Claybrooke, R.D., Bowersox, V.C., and Lynch, J.A., 2000, Modernizing NTN equipment, a look at two candidates: The NOAH II precipitation gage and the Canadian MIC precipitation collector. Proceedings, 93rd Air and Waste Management Association Meeting, Pittsburgh, Penn., Paper 389.
Gordon, J.D., 2003, An initial evaluation of candidate rain gages for modernizing the National Atmospheric Deposition Program: U.S. Geological Survey Water-Resources Investigations Report 02-4302, 30 p.
National Atmospheric Deposition Program, 2001, Instruction Manual, NADP/NTN site selection and installation: NADP Manual 2000-01, Illinois State Water Survey, accessed October 28, 2002 at URL <http://nadp.sws.uiuc.edu/lib/manuals/siteinst.pdf>
National Atmospheric Deposition Program, 2002, NADP National Trends Network Map, accessed October 28, 2002 at URL <http://nadp.sws.uiuc.edu/networks.html#adp>
National Atmospheric Deposition Program, 2003, NADP Site overview page, accessed March 10, 2003 at URL <http://nadp.sws.uiuc.edu/nadpoverview.asp>
NovaLynx Corporation, 2002, Weather monitoring instruments and systems, NovaLynx Model 260-2510 Standard Rain and Snow Gauge, accessed June 10, 2002 at URL <http://www.novalynx.com/260-2510.html>
OTT Hydrometrie, 2002, Pluvio, Rain gauge with integrated data logger, accessed June 10, 2002 at URL <http://www.ottfrance.com/english/product/sep_products/pluvio/content.htm>
Yang, D., Goodison, B.E., Metcalf, J.R., Louie, P., Leavesley, G., Emerson, D., Hanson, C., Golubev, V., Esko, E., Gunther, T., Pangburn, T., Kand, E., and Milkovic, J., 1999, Quantification of precipitation measurement discontinuity induced by wind shields on national gauges: Water Resources Research, v. 35, no. 2, p. 491-508
REFERENCES CITED 25