evaluation of mg and k exchange cation effects with simulated xrd patterns aparicio, patricia 1 and...
TRANSCRIPT
EVALUATION OF Mg AND K EXCHANGE CATION EFFECTS WITH SIMULATED XRD
PATTERNS
Aparicio, Patricia1 and Ferrell, Ray E.2
1 Departamento de Cristalografía, Mineralogía y Q. Agrícola. Universidad de Seville, Spain.
e-mail:[email protected] Department of Geology and Geophysics. Louisiana
State University, Baton Rouge, LA 70803-4101, USA. e-mail: [email protected]
The use of simulated XRD patterns for interpretation of complex clay mineral assemblages has become essential in modern clay mineral investigations.
Much of the progress is due to the availability of computer programs (i.e., NEWMOD) for the calculation of diffraction effects based on the Mering principle for mixed crystallites.
Additional information can be obtained by comparing actual XRD patterns with those simulating Mg- and K-saturated mixed-layered clays.
MATERIALS Samples from the freshwater marsh in the
area of Lake Des Allemands near New Orleans (Louisiana, USA) from a depth between 200-206cm and 290-300cm.
The dark gray samples belong to the Kenner-Allemands soil association. They are typical of the moderately alkaline, fluid clays occurring beneath slightly acid mucks in freshwater marsh environments of the Mississippi River Deltaic Plain.
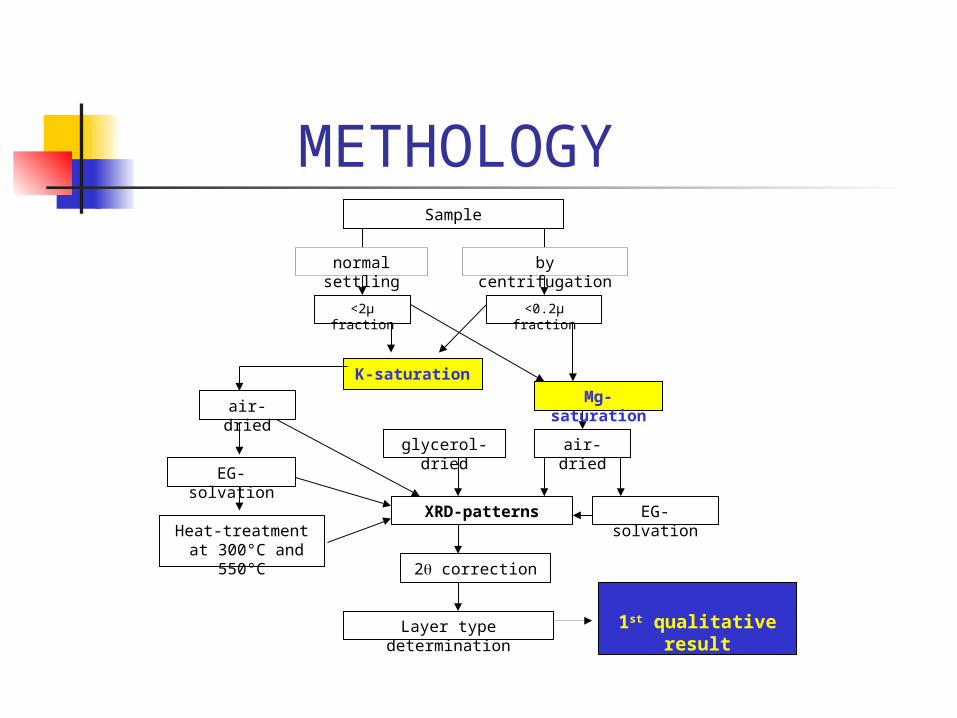
METHOLOGYSample
<2µ fraction <0.2µ fraction
normal settling by centrifugation
K-saturation
air-dried
glycerol-dried
EG-solvation
air-dried
EG-solvationHeat-treatment
at 300°C and 550°C
XRD-patterns
2 correction
Layer type determination 1st qualitative result
Mg-saturation
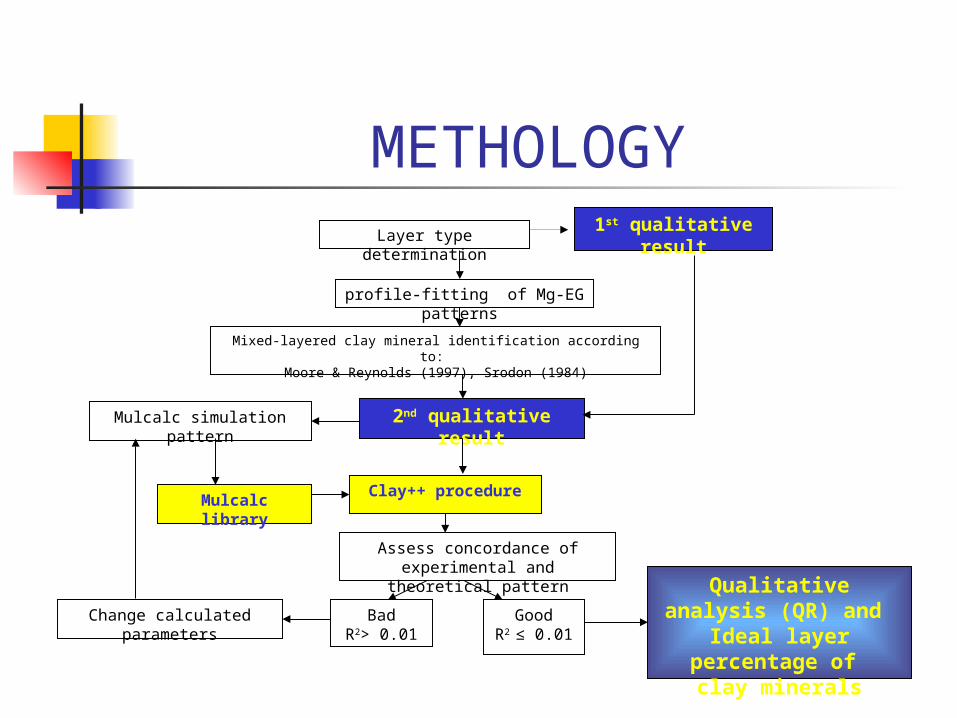
METHOLOGYLayer type determination
1st qualitative result
profile-fitting of Mg-EG patterns
Mixed-layered clay mineral identification according to: Moore & Reynolds (1997), Srodon (1984)
Mulcalc simulation pattern
Mulcalc libraryClay++ procedure
2nd qualitative result
Qualitative analysis (QR) and
Ideal layer percentage of clay minerals
BadR2> 0.01
Assess concordance of experimental and theoretical pattern
Change calculated parameters GoodR2 ≤ 0.01
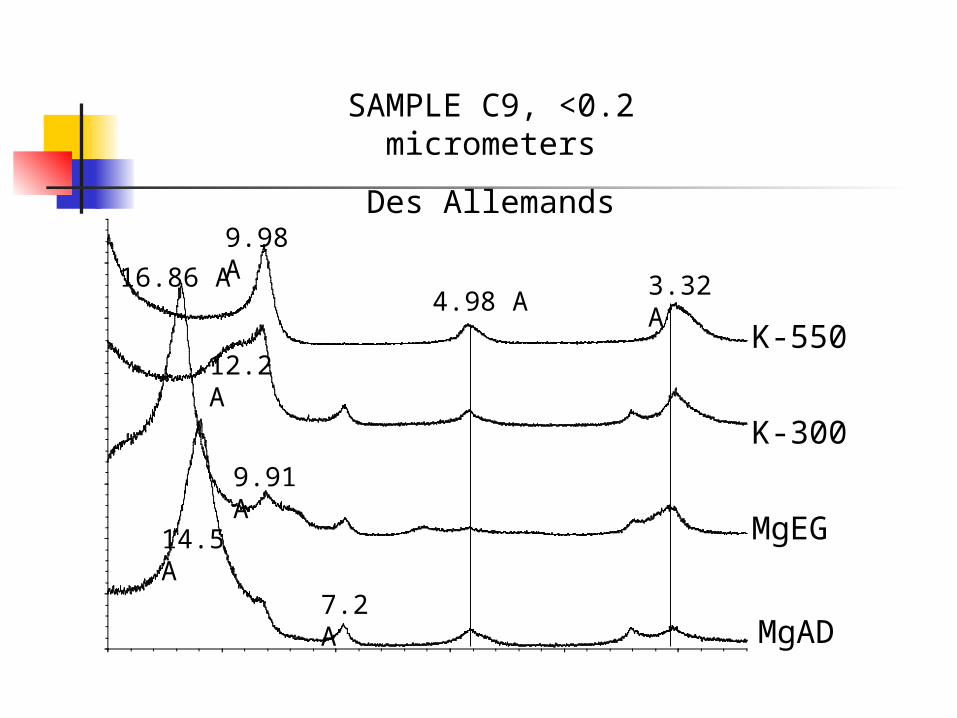
SAMPLE C9, <0.2 micrometers
Des Allemands
MgAD
K-550
K-300
MgEG
3.32 A4.98 A
9.98 A
7.2 A
14.5 A
16.86 A
12.2 A
9.91 A
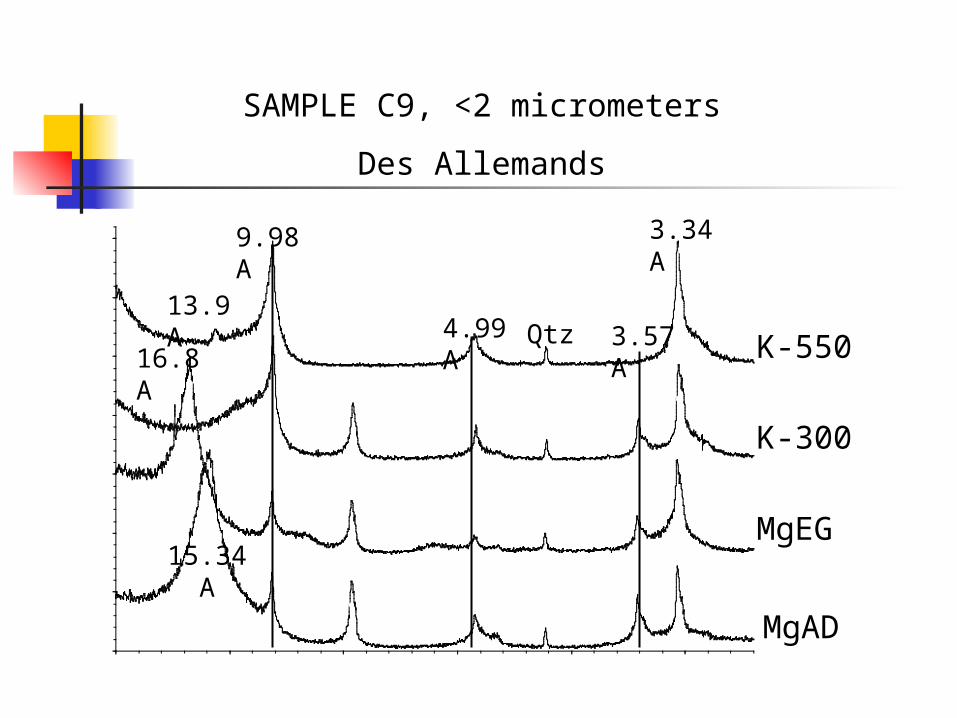
K-550
K-300
3.34 A
MgAD
MgEG
13.9 A
9.98 A
4.99 A Qtz 3.57 A
15.34 A
16.8 A
SAMPLE C9, <2 micrometers
Des Allemands
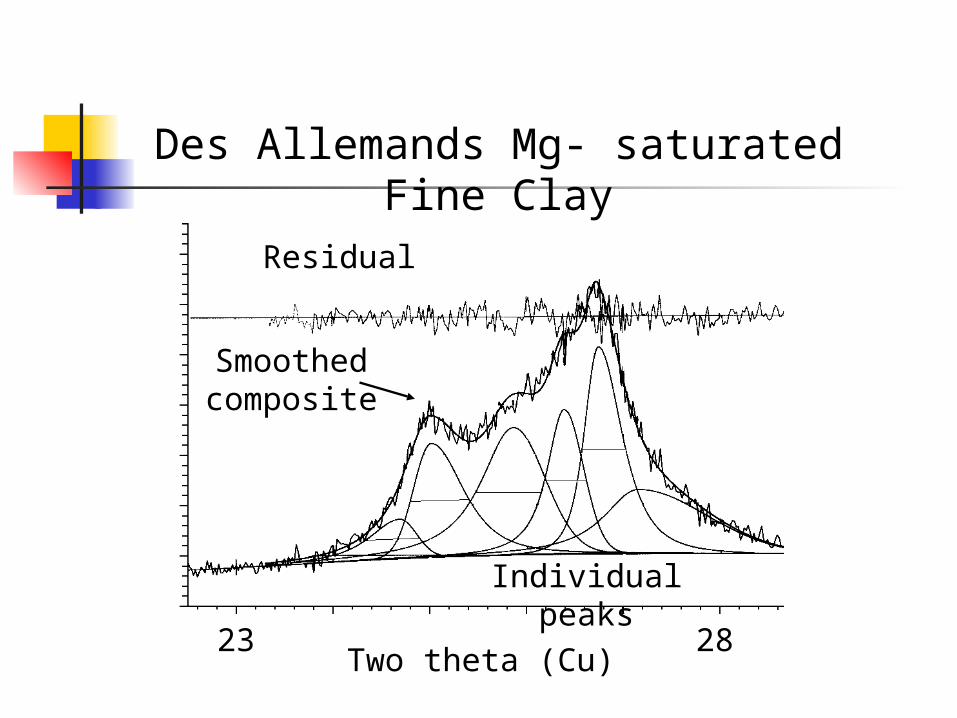
Des Allemands Mg- saturated Fine Clay
23 28
Residual
Smoothed composite
Individual peaks
Two theta (Cu)
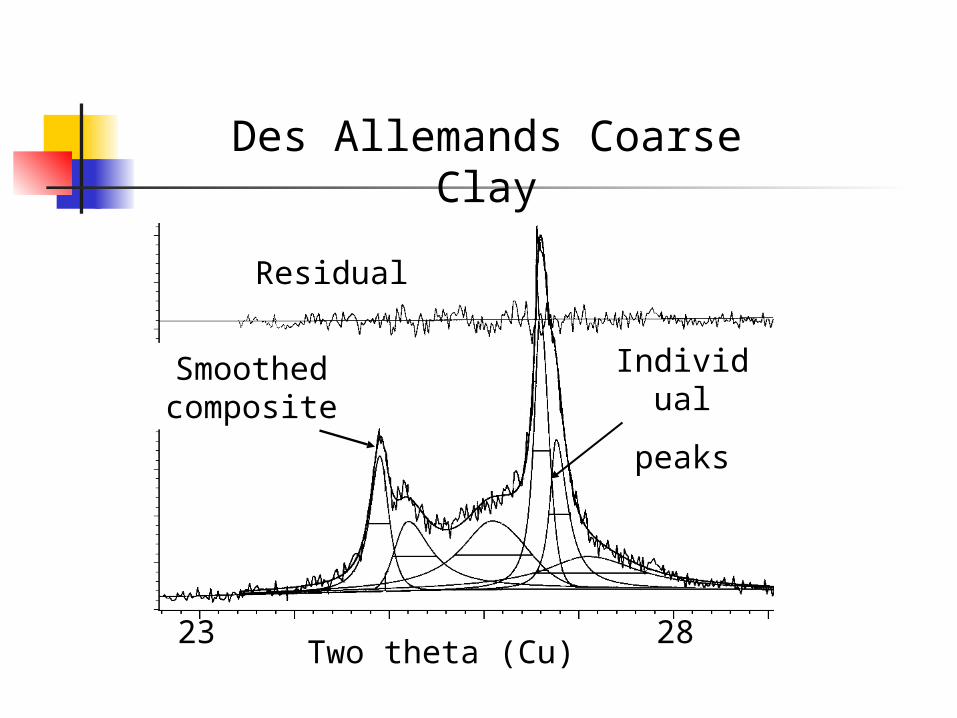
Des Allemands Coarse Clay
23 28
Residual
Smoothed composite
Individual
peaks
Two theta (Cu)
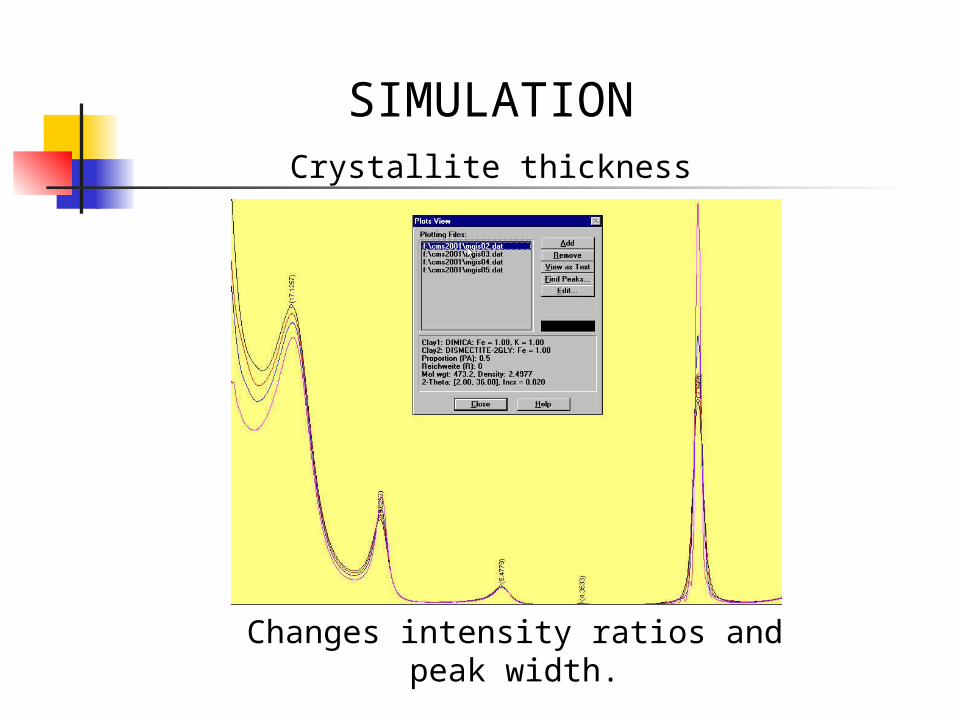
SIMULATIONCrystallite thickness
Changes intensity ratios and peak width.
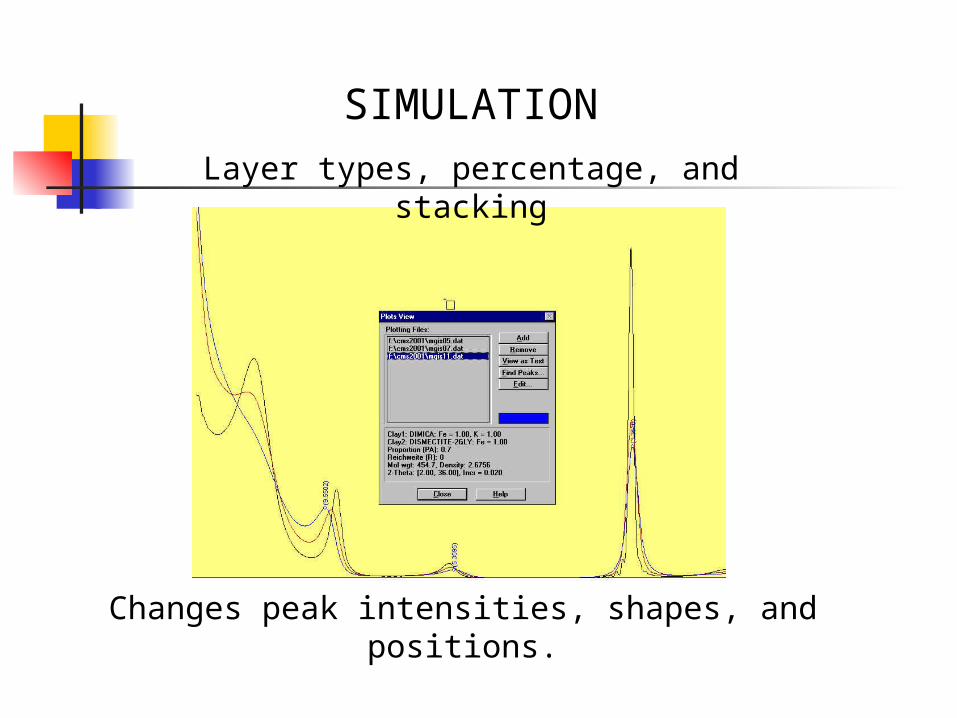
SIMULATION
Layer types, percentage, and stacking
Changes peak intensities, shapes, and positions.
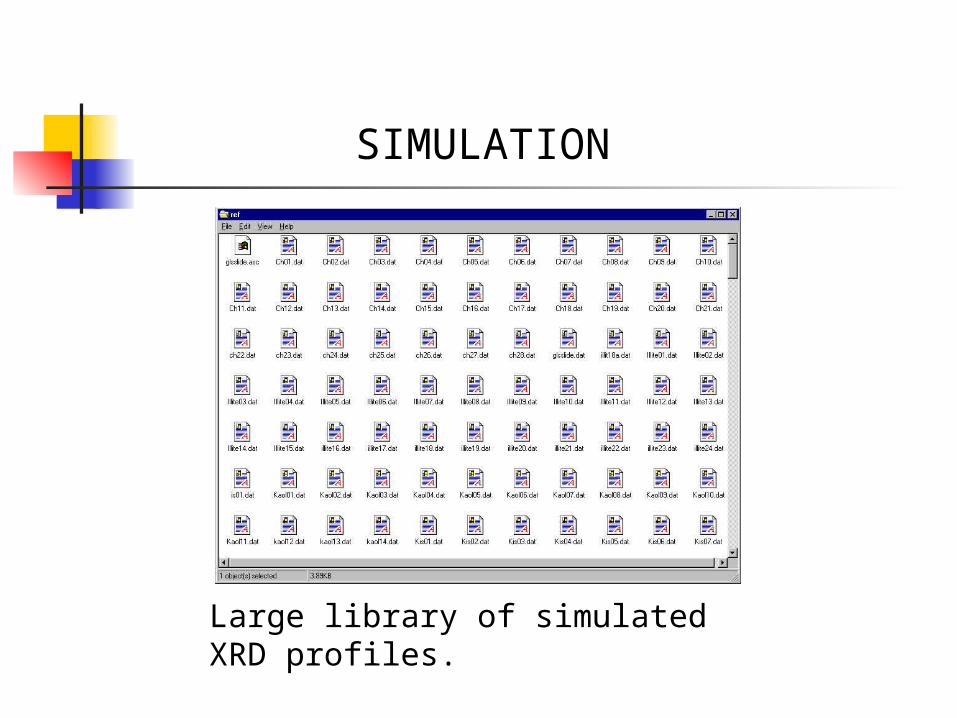
SIMULATION
Large library of simulated XRD profiles.
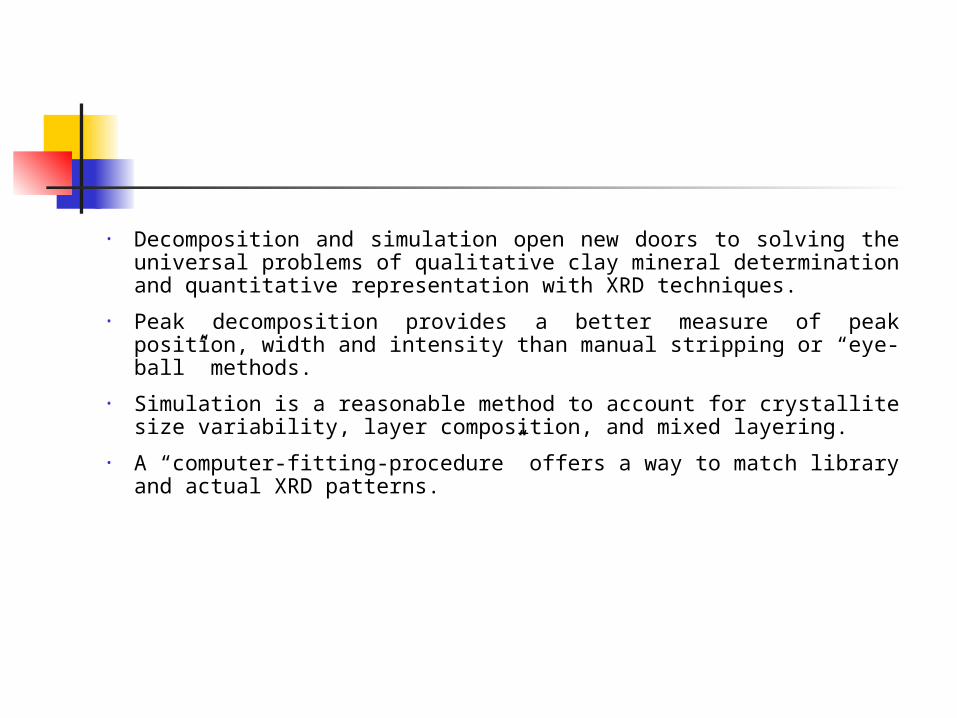
• Decomposition and simulation open new doors to solving the universal problems of qualitative clay mineral determination and quantitative representation with XRD techniques.
• Peak decomposition provides a better measure of peak position, width and intensity than manual stripping or “eye-ball” methods.
• Simulation is a reasonable method to account for crystallite size variability, layer composition, and mixed layering.
• A “computer-fitting-procedure” offers a way to match library and actual XRD patterns.
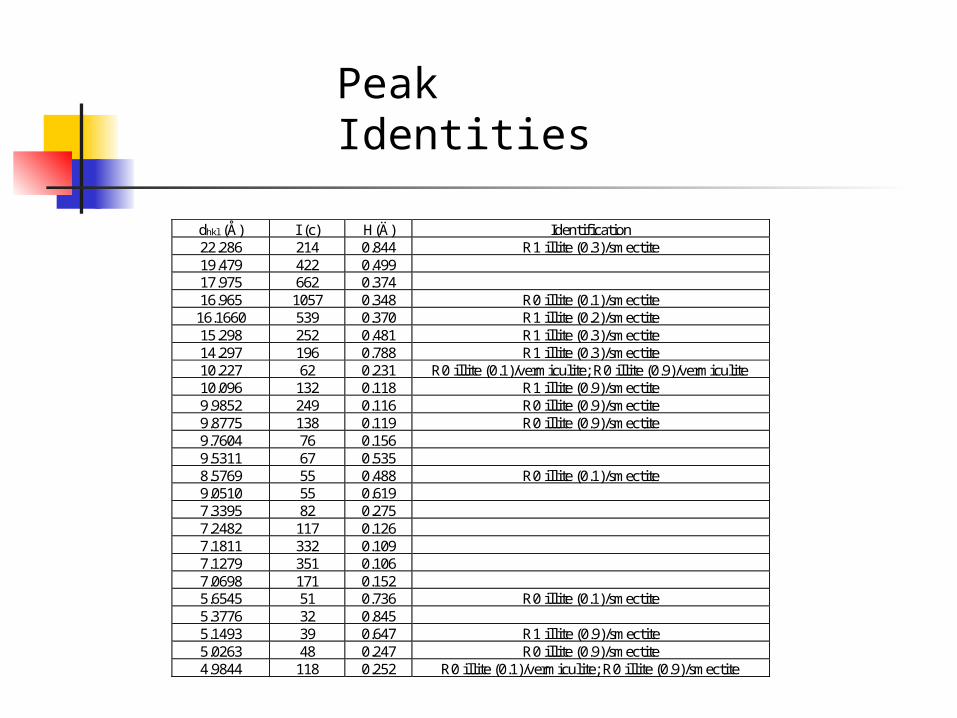
dhkl (Å) I (c) H(Ä) Identification 22.286 214 0.844 R1 illite (0.3)/smectite 19.479 422 0.499 17.975 662 0.374 16.965 1057 0.348 R0 illite (0.1)/smectite
16.1660 539 0.370 R1 illite (0.2)/smectite 15.298 252 0.481 R1 illite (0.3)/smectite 14.297 196 0.788 R1 illite (0.3)/smectite 10.227 62 0.231 R0 illite (0.1)/vermiculite; R0 illite (0.9)/vermiculite 10.096 132 0.118 R1 illite (0.9)/smectite 9.9852 249 0.116 R0 illite (0.9)/smectite 9.8775 138 0.119 R0 illite (0.9)/smectite 9.7604 76 0.156 9.5311 67 0.535 8.5769 55 0.488 R0 illite (0.1)/smectite 9.0510 55 0.619 7.3395 82 0.275 7.2482 117 0.126 7.1811 332 0.109 7.1279 351 0.106 7.0698 171 0.152 5.6545 51 0.736 R0 illite (0.1)/smectite 5.3776 32 0.845 5.1493 39 0.647 R1 illite (0.9)/smectite 5.0263 48 0.247 R0 illite (0.9)/smectite 4.9844 118 0.252 R0 illite (0.1)/vermiculite; R0 illite (0.9)/smectite
Peak Identities
0
1000
2000
3000
4000
5000
6000
4 9 14 19 24 29
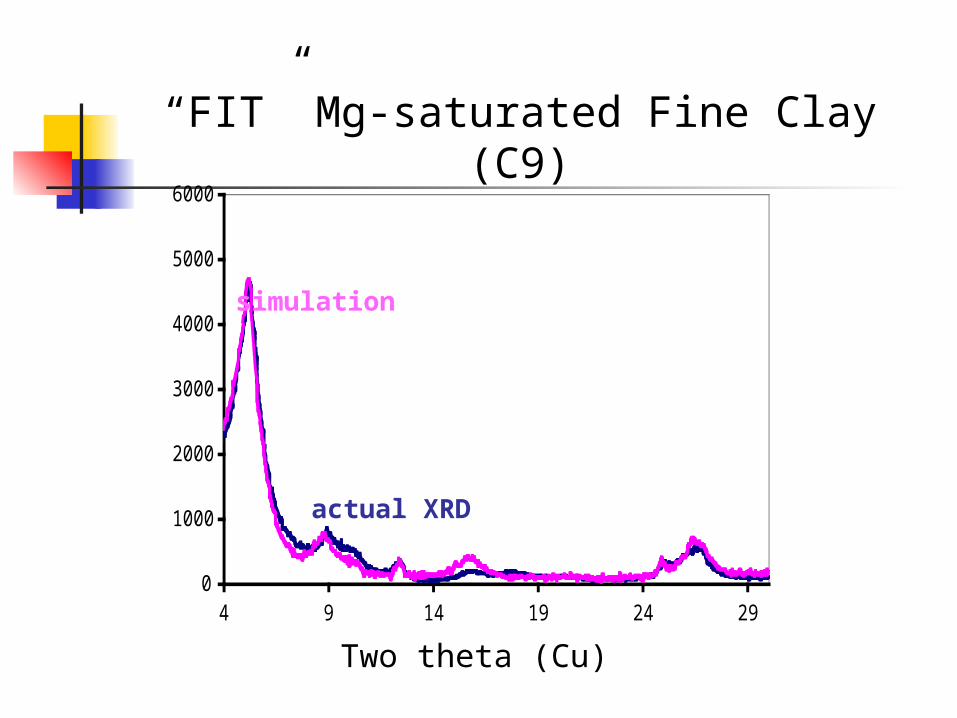
“FIT” Mg-saturated Fine Clay (C9)
actual XRD
simulation
Two theta (Cu)
0
500
1000
1500
2000
2500
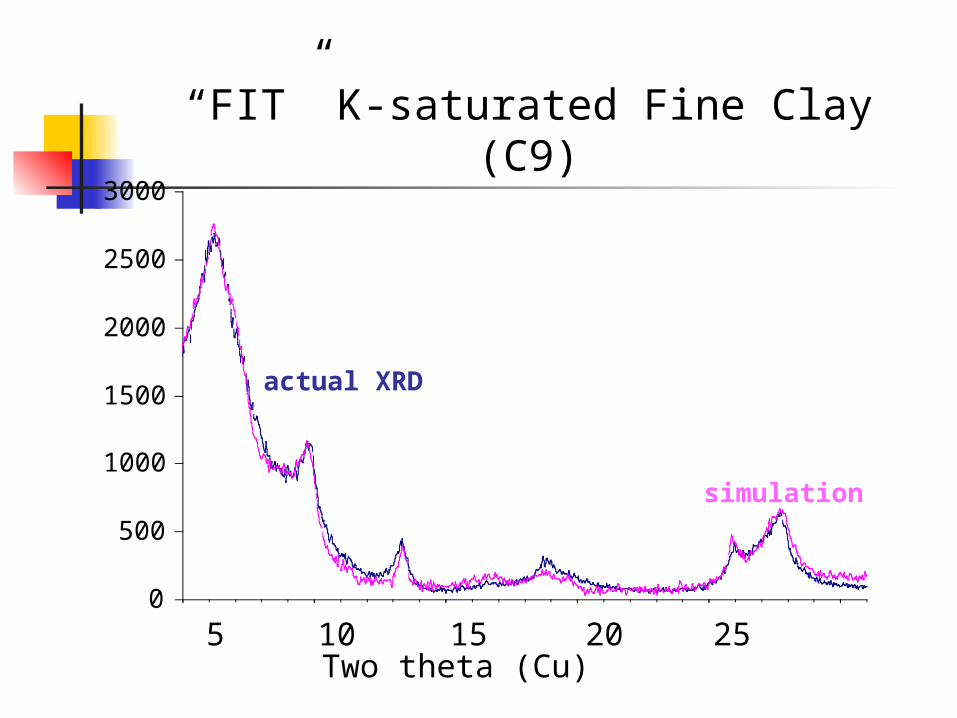
3000“FIT” K-saturated Fine Clay (C9)
5Two theta (Cu)
10 15 20 25
simulation
actual XRD
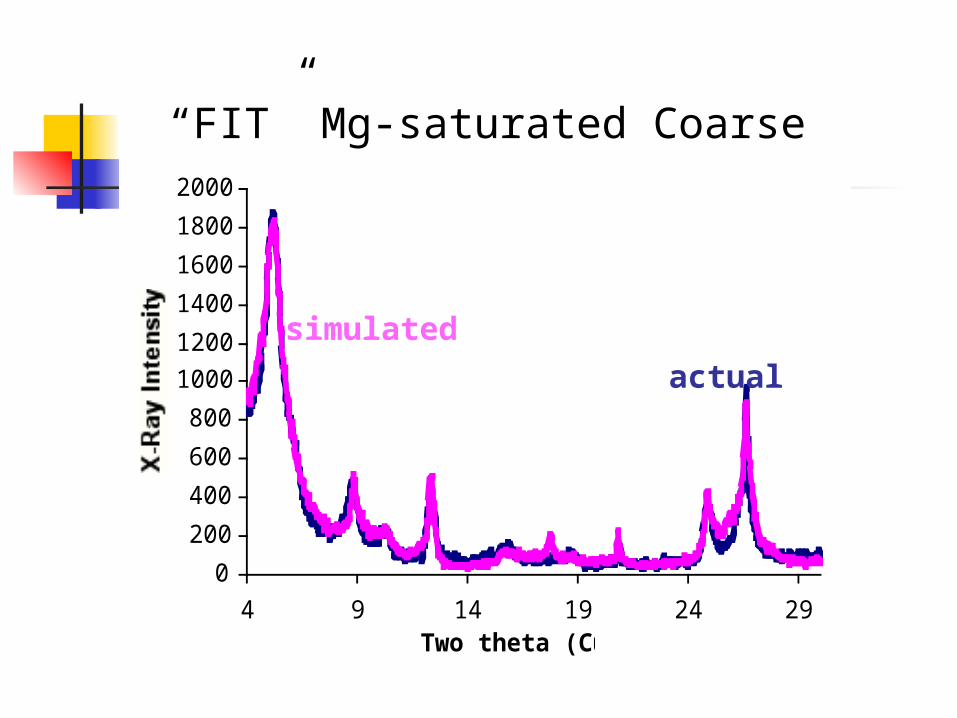
“FIT” Mg-saturated Coarse Clay (C9)
0
200
400
600
800
1000
1200
1400
1600
1800
2000
4 9 14 19 24 29Two theta (Cu)
simulated
actual
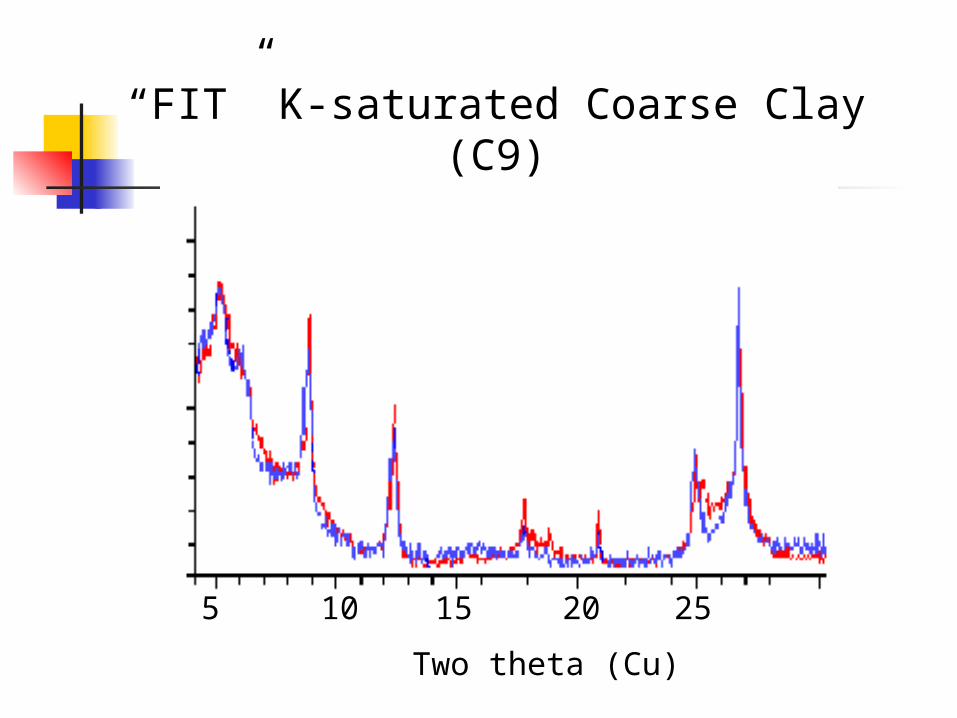
“FIT” K-saturated Coarse Clay (C9)
5
Two theta (Cu)
10 15 20 25
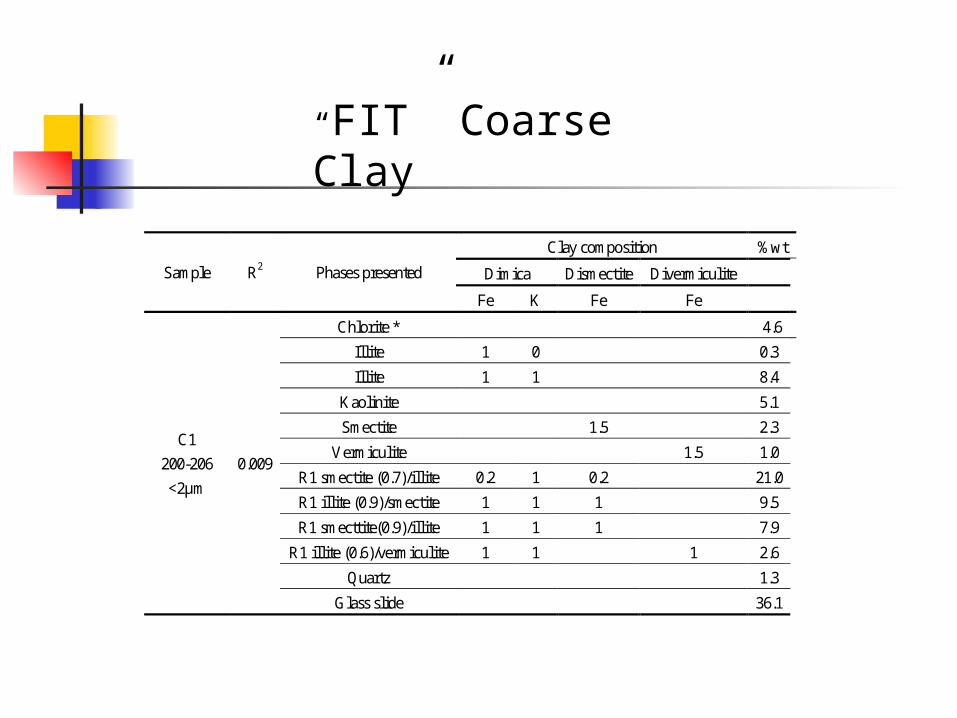
Clay composition %wt
Dimica Dismectite Divermiculite Sample R2 Phases presented
Fe K Fe Fe
Chlorite * 4.6
Illite 1 0 0.3
Illite 1 1 8.4
Kaolinite 5.1
Smectite 1.5 2.3
Vermiculite 1.5 1.0
R1 smectite (0.7)/illite 0.2 1 0.2 21.0
R1 illite (0.9)/smectite 1 1 1 9.5
R1 smecttite(0.9)/illite 1 1 1 7.9
R1 illite (0.6)/vermiculite 1 1 1 2.6
Quartz 1.3
C1
200-206
<2µm
0.009
Glass slide 36.1
“FIT” Coarse Clay
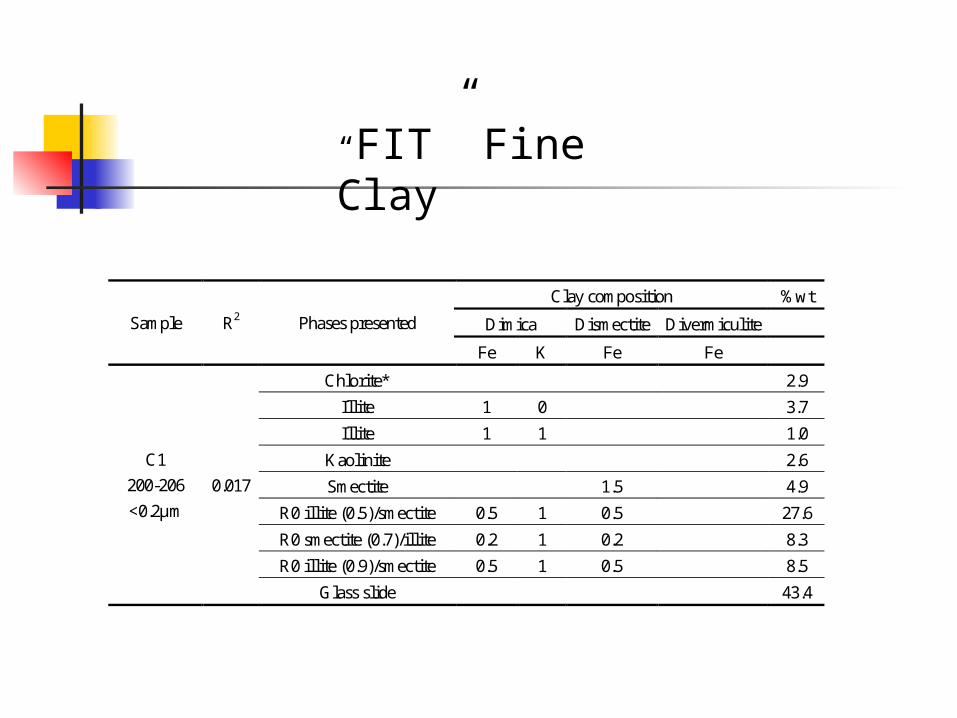
“FIT” Fine Clay
Clay composition %wt
Dimica Dismectite Divermiculite Sample R2 Phases presented
Fe K Fe Fe
Chlorite* 2.9
Illite 1 0 3.7
Illite 1 1 1.0
Kaolinite 2.6
Smectite 1.5 4.9
R0 illite (0.5)/smectite 0.5 1 0.5 27.6
R0 smectite (0.7)/illite 0.2 1 0.2 8.3
R0 illite (0.9)/smectite 0.5 1 0.5 8.5
C1
200-206
<0.2µm
0.017
Glass slide 43.4
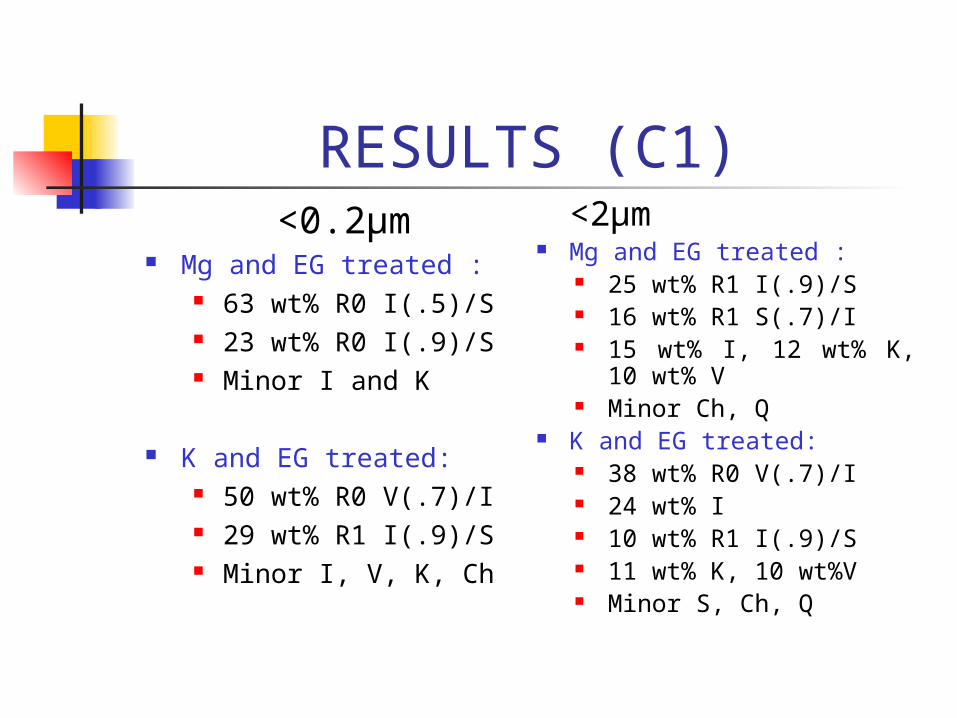
RESULTS (C1)<0.2µm
Mg and EG treated : 63 wt% R0 I(.5)/S 23 wt% R0 I(.9)/S Minor I and K
K and EG treated: 50 wt% R0 V(.7)/I 29 wt% R1 I(.9)/S Minor I, V, K, Ch
<2µm Mg and EG treated :
25 wt% R1 I(.9)/S 16 wt% R1 S(.7)/I 15 wt% I, 12 wt% K, 10
wt% V Minor Ch, Q
K and EG treated: 38 wt% R0 V(.7)/I 24 wt% I 10 wt% R1 I(.9)/S 11 wt% K, 10 wt%V Minor S, Ch, Q
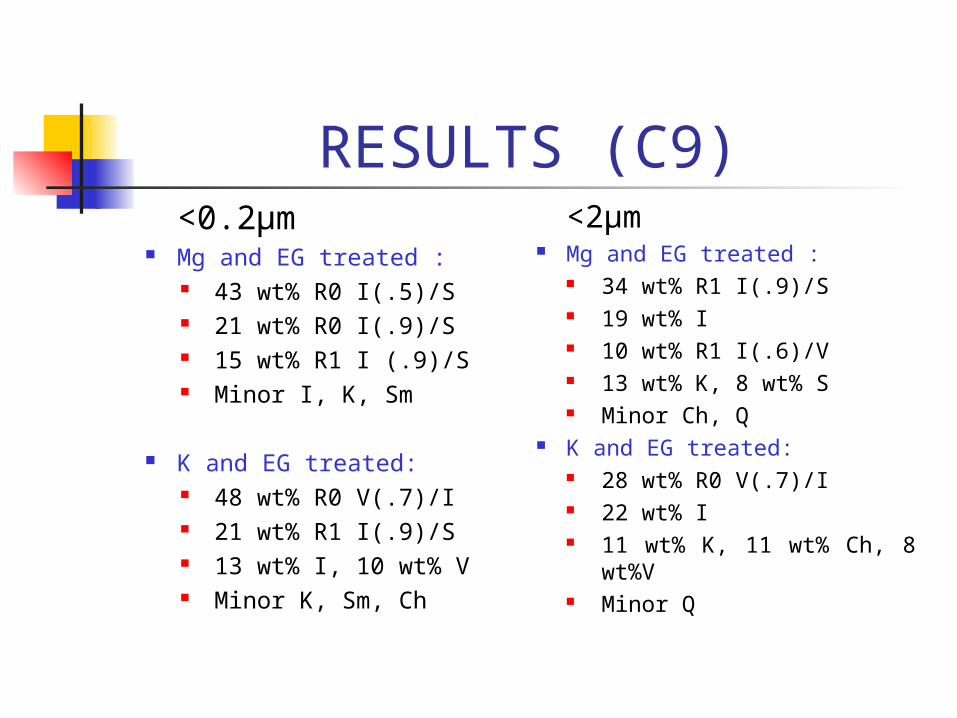
RESULTS (C9)<0.2µm
Mg and EG treated : 43 wt% R0 I(.5)/S 21 wt% R0 I(.9)/S 15 wt% R1 I (.9)/S Minor I, K, Sm
K and EG treated: 48 wt% R0 V(.7)/I 21 wt% R1 I(.9)/S 13 wt% I, 10 wt% V Minor K, Sm, Ch
<2µm Mg and EG treated :
34 wt% R1 I(.9)/S 19 wt% I 10 wt% R1 I(.6)/V 13 wt% K, 8 wt% S Minor Ch, Q
K and EG treated: 28 wt% R0 V(.7)/I 22 wt% I 11 wt% K, 11 wt% Ch, 8 wt
%V Minor Q
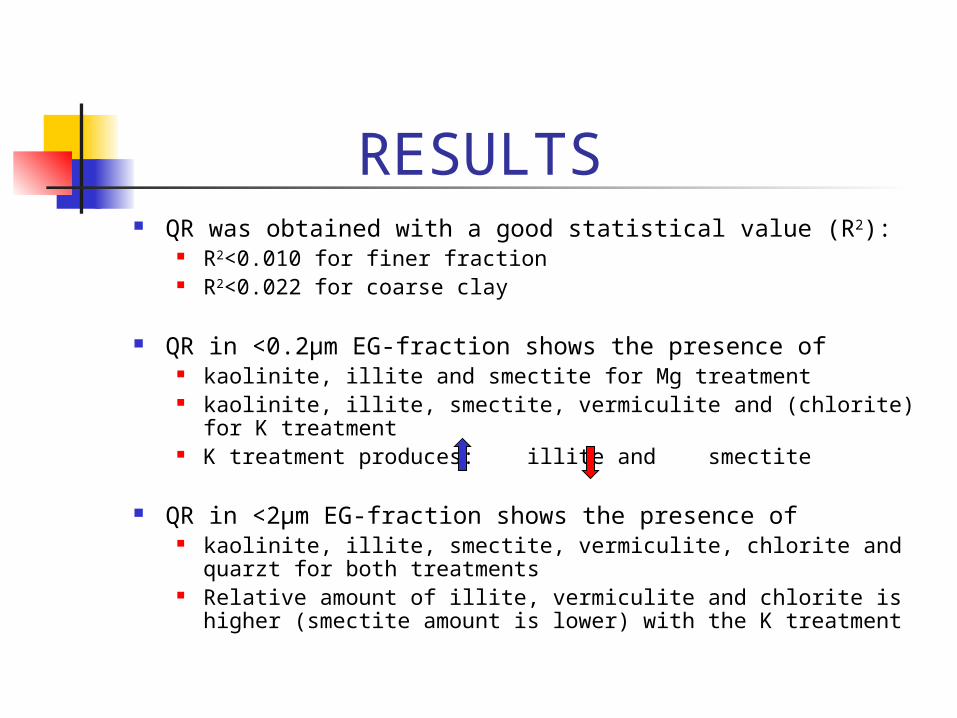
RESULTS QR was obtained with a good statistical value (R2):
R2<0.010 for finer fraction R2<0.022 for coarse clay
QR in <0.2µm EG-fraction shows the presence of kaolinite, illite and smectite for Mg treatment kaolinite, illite, smectite, vermiculite and (chlorite) for K
treatment K treatment produces: illite and smectite
QR in <2µm EG-fraction shows the presence of kaolinite, illite, smectite, vermiculite, chlorite and quarzt for
both treatments Relative amount of illite, vermiculite and chlorite is higher
(smectite amount is lower) with the K treatment
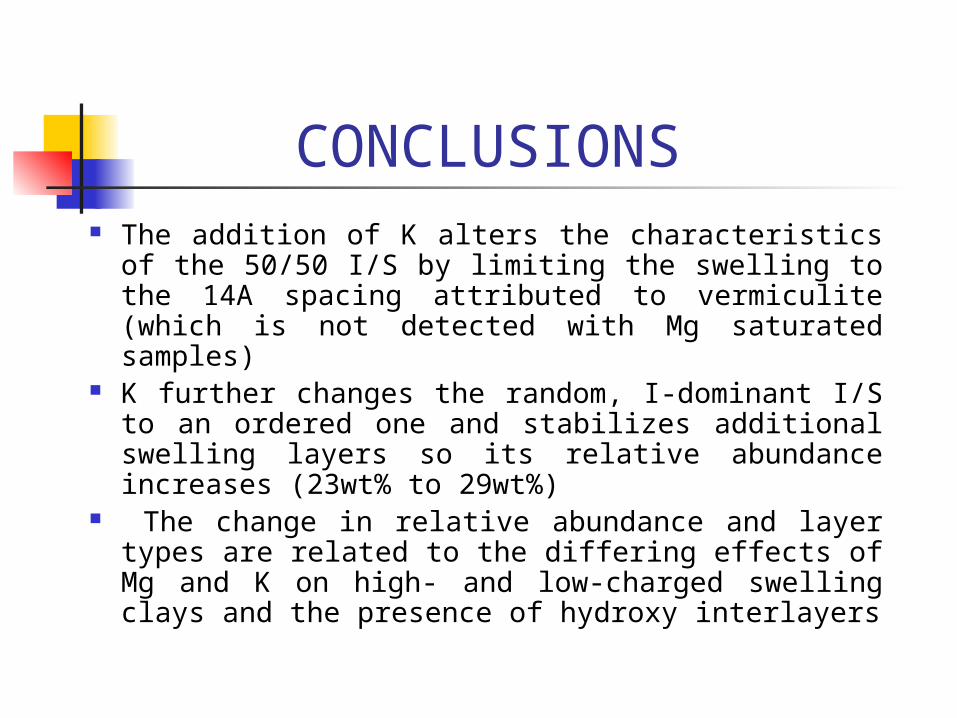
CONCLUSIONS The addition of K alters the characteristics of
the 50/50 I/S by limiting the swelling to the 14A spacing attributed to vermiculite (which is not detected with Mg saturated samples)
K further changes the random, I-dominant I/S to an ordered one and stabilizes additional swelling layers so its relative abundance increases (23wt% to 29wt%)
The change in relative abundance and layer types are related to the differing effects of Mg and K on high- and low-charged swelling clays and the presence of hydroxy interlayers