evaluation of icing scaling on swept naca 0012 airfoil models · evaluation of icing scaling on...
TRANSCRIPT
Jen-Ching TsaoOhio Aerospace Institute, Brook Park, Ohio
Sam LeeASRC Aerospace Corporation, Cleveland, Ohio
Evaluation of Icing Scaling on Swept NACA 0012 Airfoil Models
NASA/CR—2012-217419
May 2012
11ICE-0005
https://ntrs.nasa.gov/search.jsp?R=20120009186 2019-05-04T08:09:37+00:00Z
NASA STI Program . . . in Profi le
Since its founding, NASA has been dedicated to the advancement of aeronautics and space science. The NASA Scientifi c and Technical Information (STI) program plays a key part in helping NASA maintain this important role.
The NASA STI Program operates under the auspices of the Agency Chief Information Offi cer. It collects, organizes, provides for archiving, and disseminates NASA’s STI. The NASA STI program provides access to the NASA Aeronautics and Space Database and its public interface, the NASA Technical Reports Server, thus providing one of the largest collections of aeronautical and space science STI in the world. Results are published in both non-NASA channels and by NASA in the NASA STI Report Series, which includes the following report types: • TECHNICAL PUBLICATION. Reports of
completed research or a major signifi cant phase of research that present the results of NASA programs and include extensive data or theoretical analysis. Includes compilations of signifi cant scientifi c and technical data and information deemed to be of continuing reference value. NASA counterpart of peer-reviewed formal professional papers but has less stringent limitations on manuscript length and extent of graphic presentations.
• TECHNICAL MEMORANDUM. Scientifi c
and technical fi ndings that are preliminary or of specialized interest, e.g., quick release reports, working papers, and bibliographies that contain minimal annotation. Does not contain extensive analysis.
• CONTRACTOR REPORT. Scientifi c and
technical fi ndings by NASA-sponsored contractors and grantees.
• CONFERENCE PUBLICATION. Collected papers from scientifi c and technical conferences, symposia, seminars, or other meetings sponsored or cosponsored by NASA.
• SPECIAL PUBLICATION. Scientifi c,
technical, or historical information from NASA programs, projects, and missions, often concerned with subjects having substantial public interest.
• TECHNICAL TRANSLATION. English-
language translations of foreign scientifi c and technical material pertinent to NASA’s mission.
Specialized services also include creating custom thesauri, building customized databases, organizing and publishing research results.
For more information about the NASA STI program, see the following:
• Access the NASA STI program home page at http://www.sti.nasa.gov
• E-mail your question via the Internet to help@
sti.nasa.gov • Fax your question to the NASA STI Help Desk
at 443–757–5803 • Telephone the NASA STI Help Desk at 443–757–5802 • Write to:
NASA Center for AeroSpace Information (CASI) 7115 Standard Drive Hanover, MD 21076–1320
Jen-Ching TsaoOhio Aerospace Institute, Brook Park, Ohio
Sam LeeASRC Aerospace Corporation, Cleveland, Ohio
Evaluation of Icing Scaling on Swept NACA 0012 Airfoil Models
NASA/CR—2012-217419
May 2012
11ICE-0005
National Aeronautics andSpace Administration
Glenn Research CenterCleveland, Ohio 44135
Prepared under Contract NNC07BA13B
Prepared for theInternational Conference on Aircraft and Engine Icing and Ground Deicingsponsored by the SAE InternationalChicago, Illinois, June 13–17, 2011

Acknowledgments
The authors acknowledge the support of the Integrated Resilient Aircraft Control project under Aviation Safety Program at NASA Glenn Research Center. The authors also wish to thank the NASA Glenn Icing Research Tunnel (IRT) personnelfor their excellent and committed technical support.
Available from
NASA Center for Aerospace Information7115 Standard DriveHanover, MD 21076–1320
National Technical Information Service5301 Shawnee Road
Alexandria, VA 22312
Available electronically at http://www.sti.nasa.gov
Trade names and trademarks are used in this report for identifi cation only. Their usage does not constitute an offi cial endorsement, either expressed or implied, by the National Aeronautics and
Space Administration.
Level of Review: This material has been technically reviewed by NASA expert reviewer(s).
NASA/CR—2012-217419 1
Evaluation of Icing Scaling on Swept NACA 0012 Airfoil Models
Jen-Ching Tsao Ohio Aerospace Institute Brook Park, Ohio 44142
Sam Lee
ASRC Aerospace Corporation Cleveland, Ohio 44135
Abstract
Icing scaling tests in the NASA Glenn Icing Research Tunnel (IRT) were performed on swept wing models using existing recommended scaling methods that were originally developed for straight wing. Some needed modifications (Ref. 1) on the stagnation-point local collection efficiency (i.e., calculation and the corresponding convective heat transfer coefficient for swept NACA 0012 airfoil models have been studied and reported in 2009, and the correlations will be used in the current study. The reference tests used a 91.4-cm chord, 152.4-cm span, adjustable sweep airfoil model of NACA 0012 profile at velocities of 100 and 150 knot and MVD of 44 and 93 m. Scale-to-reference model size ratio was 1:2.4. All tests were conducted at 0 angle of attack (AoA) and 45 sweep angle. Ice shape comparison results were presented for stagnation-point freezing fractions in the range of 0.4 to 1.0. Preliminary results showed that good scaling was achieved for the conditions test by using the modified scaling methods developed for swept wing icing.
Introduction
The results presented here are part of an effort to develop appropriate scaling methods for swept wing ice accretion. Previously, Anderson (Ref. 2) has completed a NASA report that gave a detailed technical review of recommended scaling methods for ice accretion on unprotected, unswept aerodynamic surfaces in Appendix C condition. Later, Anderson and Tsao (Ref. 3) have further supplemented the Appendix C studies of Reference 2 with recent data from both SLD and Appendix C tests.
It was concluded from those two references that acceptable scaling results could be achieved by matching the Ac, n0, and WeL. With scale model size selected, by matching scale and reference values of WeL the scale velocity can be determined. By matching 0 the scale MVD can be found. Reference 2 also showed that the effects of temperature and LWC are not independent, but interact through the freezing fraction. Therefore, with scale LWC chosen, by matching n0 the scale temperature can be calculated. Finally, by matching Ac the scale time can be established. For the scale test, then, only temperature, velocity, MVD and time have to be calculated from the known (reference) values of the similarity parameters.
For swept wing icing scaling, the observations from recent work (Refs. 4 to 7) on ice accretion formations on swept wings have suggested that although there are distinct morphological differences in ensuing ice shapes on unswept and swept wings, the fundamental physics of ice accretion appears to be the same. Thus all the similarity parameters recommended for unswept wing icing scaling should be applicable to swept wing icing application provided appropriate modifications to the local collection efficiency and the convective heat transfer coefficient in the freezing fraction expression at the stagnation line were made due to model sweep angle.
In a more recent study (Ref. 1) Tsao and Kreeger have shown a best curve fit correlation to calculate the 0 on swept wings of NACA 0012 airfoil profile. Some experimental evaluations of 0 were also performed for the validation of such correlation. In the present study, a limited number of reference and scale ice shape comparisons obtained from NACA 0012 airfoil models at 45 sweep angle were made to assess the proposed scaling methods in swept wing icing conditions.
NASA/CR—2012-217419 2
Nomenclature
Ac Accumulation parameter, dimensionless b Relative heat factor, dimensionless c Airfoil chord, cm cp Specific heat of air, cal/g K cp,ws Specific heat of water at the surface temperature, cal/g K d Cylinder radius or twice the leading-edge radius of airfoil, cm hc Convective heat-transfer coefficient, cal/sm2K hf Water film thickness, cm hG Gas-phase mass-transfer coefficient, g/sm2 K Inertia parameter, dimensionless K0 Modified inertia parameter, dimensionless LWC Cloud liquid-water content, g/m3 MVD Water droplet median volume diameter, m n Local freezing fraction, dimensionless n0 Stagnation-point freezing fraction, dimensionless p Pressure, Nt/m2 pw Vapor pressure of water in atmosphere, Nt/m2 pww Vapor pressure of water at the icing surface, Nt/m2 r Recovery factor, dimensionless Re Reynolds number of water drop, dimensionless s Distance along airfoil surface measured from stagnation line, cm tf Freezing temperature, °C ts Surface temperature, °C t Air temperature, °C T Absolute air temperature, K V Air velocity, kt WeL Weber number based on model size and water properties, dimensionless 0 Stagnation-point collection efficiency, dimensionless Droplet energy transfer parameter, °C Droplet range, m Stokes Droplet range if Stokes Law applies, m Sweep angle, degrees f Latent heat of freezing, cal/g v Latent heat of condensation, cal/g Air viscosity, g/m s Air energy transfer parameter, °C Air density, g/m3 i Ice density, g/m3 w Liquid water density, g/m3 Surface tension of water over air, dyne/cm Accretion time, min
NASA/CR—2012-217419 3
Subscripts:
R reference S scale f water film st static tot total at sweep
Similarity Parameters
The similarity parameters used in this study were based on the work originally done by Ruff (Ref. 8). The scaling method involved matching scale and reference values of the key similarity parameters, 0, Ac, n0, and WeL. The equations for the similarity parameters will be presented here without much discussion. Readers who are interested in the physical descriptions and detailed derivations of these parameters are referred to References 2 and 3 and the references given therein.
To maintain the droplet trajectory similitude, Langmuir and Blodgett (Ref. 9) introduced the modified inertia parameter, K0, defined as
0Stokes
1 1
8 8K K
for K>0.125, to describe the inertia of droplets in an air stream flowing around a cylinder of radius d positioned normal to the flow. In Equation (1), K is the inertia parameter,
2MVD
.18
w VK
d
(2)
Departing slightly from Langmuir and Blodgett in this study, d represents twice the leading-edge radius of curvature for airfoils. For the NACA 0012 airfoil model, a leading-edge radius of 0.0158c was used (see Abbott and von Doenhoff (Ref. 10)), where c is the airfoil chord. In Equation (1), /Stokes is the droplet range parameter, defined as the ratio of actual droplet range to that if Stokes drag law for solid-spheres applied. It is a function only of the droplet Reynolds number, Re
δMVDρ
Reμ
V= (3)
This study uses a curve fit to Langmuir and Blodgett’s tabulation of the range parameter as given in the following expression:
δ
λ 1
λ 0.8388 0.001483 Re 0.1847 ReStokes δ
=
(4)
of more practical interest than K0 is the collection efficiency at the stagnation point, 0, which was shown by Langmuir and Blodgett to be a function only of K0,
NASA/CR—2012-217419 4
.84
0
0 .84
0
11.40
8β
11+1.40
8
K
K
(5)
It should be noted that the 0 shown in Equation (5) denotes the collection efficiency at the stagnation point for unswept NACA 0012 models. As for a NACA 0012 model at a given sweep angle 45), this study uses a curve fit from Reference 1 to calculate the collection efficiency along the stagnation line,0, ,
0, 0 cos (6)
Thus the droplet trajectory similarity is satisfied if K0,S = K0,R and S = R (so is (0,)S = (0,)R), and the scale drop size, i.e., scale MVD, is determined. To ensure water-catch similarity, the accumulation parameter is introduced:
LWC
ci
VA
d
(7)
If all the water impinging on the leading edge freezes at that location and the leading-edge collection efficiency is 100 percent, Ac directly becomes a measure of the normalized thickness of ice that will accrete. The scale accretion time can be found from Ac,S = Ac,R. When super-cooled water drops strike an aircraft surface, they may not freeze immediately on impact. The freezing fraction is the ratio of the amount of water that freezes in a specified region on the surface to the total amount of liquid water that reaches that region. Thus, local ice thickness depends on 0,Ac and freezing fraction. Because each local ice thickness around the model defines the overall shape of the ice, the freezing fraction obviously has a major influence on ice shape. The freezing fraction is influenced mainly by the ambient temperature, the LWC of the cloud and the aircraft velocity.
The rate at which the water freezes on a surface depends on the magnitude of local heat transfer imbalance. For glaze ice, it is known that the fraction of water that freezes is less than unity, and the motion of unfrozen surface water can have an effect on the resulting ice shape. Therefore, it is important to maintain surface energy and surface-water dynamics similarities for glaze ice accretions. The freezing fraction is formally defined as the ratio of the amount of water that freezes at a given surface location to the total amount of water that impinges at that location. From Messinger’s (Ref. 11) steady-state surface energy balance analysis, the freezing fraction at the stagnation point can be written as
,0
p ws
f
cn
b
(8)
The key terms in this formulation include and which have dimensions of temperature and relate to the water drop energy transfer and air energy transfer, and b, the relative heat factor, which was first introduced by Tribus, et al. (Ref. 12)
2
,2f stp ws
Vt t
c (9)
NASA/CR—2012-217419 5
tot2
st tot stst
tot
tot
θ Λ12
.622
ww w
Gs v
wwp c
st
p p p
h T T pVt t r
p pc hT T
(10)
0 ,LWC p ws
c
V cb
h
(11)
Equation (10) from Ruff (Ref. 8) has included compressibility effects. Various incompressible forms of have also been used by Charpin and Fasso (Ref. 13) and others; however, the differences are not significant mainly due to the fact that, for most icing conditions, the Mach number is relatively low.
As for the sweep angle effect on the convective heat transfer along the stagnation line of a NACA 0012 wing section, it was shown by Reshotko and Beckwith (Ref. 14) that for incompressible flow the ratio of swept to normal convective heat transfer coefficient became
1
2, cosc ch h (12)
It should be noted that the hc shown above represents the convective heat-transfer coefficient at the stagnation point for unswept NACA 0012 models and for brevity its expression can be found in Reference 2 for interested readers. Since for most icing conditions the Mach number is relatively low Equation (12) is used. Some experimental evaluations of this expression for calculating the freezing fraction on a swept wing were made in this study.
In 1988 Bilanin (Ref. 15) presented a Buckingham- analysis in which he concluded that surface-water phenomena had to be included in icing scaling methods. Olsen and Walker (Ref. 16) and Hansman, et al. (Refs. 17 to 19) studied surface effects and surface water during ice accretion, presenting additional evidence that these were important phenomena to consider in ice accretion. From the close-up photographs of these research studies, it was observed that for glaze ice accretion unfrozen water on the ice surface tended to coalesce to form beads. These beads sometimes were swept downstream and sometimes froze in place. Bilanin (Refs. 15 and 20) also argued that drop splashing on impact might affect the shape of the ice accreted.
Hansman and Turnock (Ref. 17) found that when a surfactant was added to the icing spray water, the ice shape appearance and shape changed significantly, with the glaze horns moving toward the leading edge. Clearly, then, surface tension, and by implication, surface phenomena, have a significant role in the physics of ice accretion.
In 2003 Anderson and Tsao (Ref. 21) had provided experimental evidence from past studies to show that a similarity parameter dependent on the ratio V xcy/z must be included in scaling methodology to account for surface-water dynamics effect in glaze ice accretions, although the powers x, y, and z are not yet determined. The length may not be chord itself but rather some physical characteristic L related to chord; for example, the water-film thickness. Likewise, the velocity could also be of the water-film that is related to V. Thus a Weber number based on L and V
2
We wL
V L
(13)
has been suggested as a potential additional similarity parameter to supplement Ruff’s basic scaling method. Studies by Bartlett (Refs. 22 and 23) and Oleskiw, et al., (Ref. 24) found no measurable effect of pressure on ice shape. These observations suggest that water density is a better choice than air density for Equation (13). In this study the WeL is based on the twice the nose radius of the airfoil:
NASA/CR—2012-217419 6
2
We wL
V d
(14)
with the understanding that .L d The scale velocity found from matching WeL,S = WeL,R is
1/2
RS R
S
dV V
d
(15)
Test Description
Facility, Model, and Procedures
The icing tests were performed in the NASA Glenn Icing Research Tunnel (IRT). The IRT is a closed-loop, refrigerated, sea level tunnel with a 1.8 by 2.7 m rectangular test section. The icing cloud is generated by operating 10 spray bars, a configuration in use since 1998. The IRT cloud calibrations for both Appendix C and SLD conditions used for these tests were released in the January of 2010. The LWC and MVD measurements were made using methods reported previously (Ref. 25). The LWCs reported in this paper are based on an analysis of the LWC calibration data completed in April 2009 for both Standard and Mod-1 nozzles. In addition, since only a limited range of MVD-LWC combinations for speeds of 51, 77, 103, and 129 m/s (100, 150, 200, and 250 kt) have been calibrated to date in the SLD regime, all SLD reference cases selected in this study were limited to these calibrated conditions.
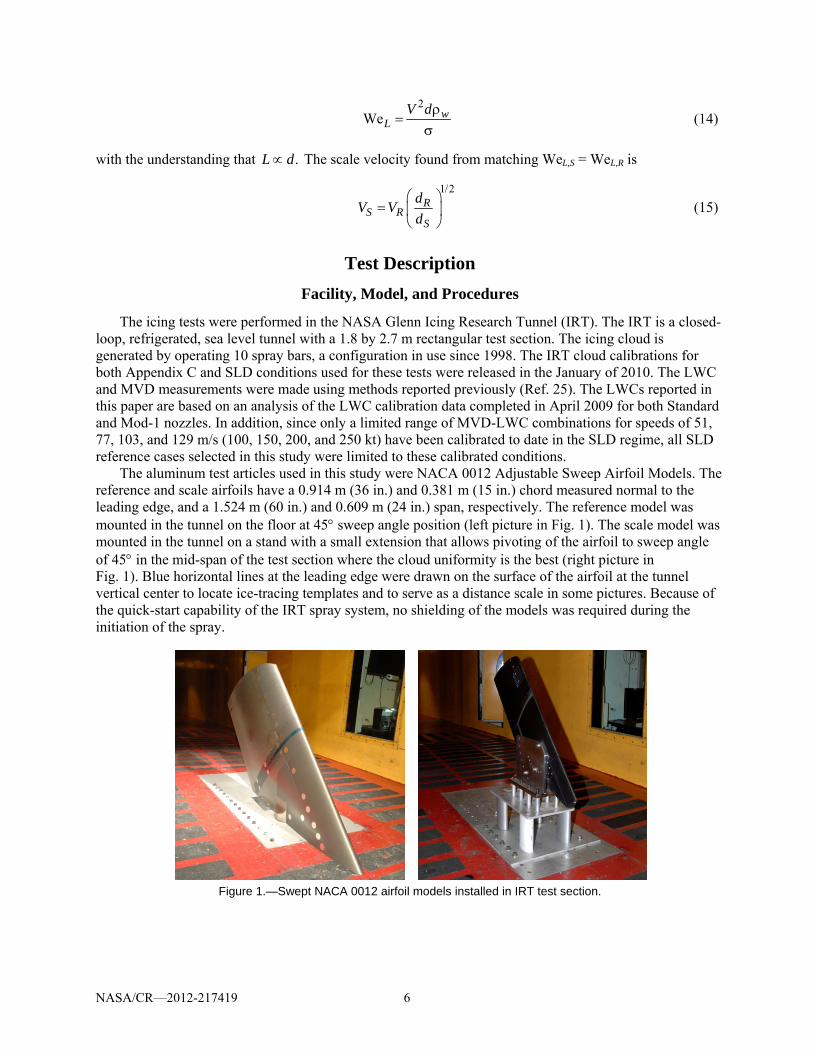
The aluminum test articles used in this study were NACA 0012 Adjustable Sweep Airfoil Models. The reference and scale airfoils have a 0.914 m (36 in.) and 0.381 m (15 in.) chord measured normal to the leading edge, and a 1.524 m (60 in.) and 0.609 m (24 in.) span, respectively. The reference model was mounted in the tunnel on the floor at 45 sweep angle position (left picture in Fig. 1). The scale model was mounted in the tunnel on a stand with a small extension that allows pivoting of the airfoil to sweep angle of 45 in the mid-span of the test section where the cloud uniformity is the best (right picture in Fig. 1). Blue horizontal lines at the leading edge were drawn on the surface of the airfoil at the tunnel vertical center to locate ice-tracing templates and to serve as a distance scale in some pictures. Because of the quick-start capability of the IRT spray system, no shielding of the models was required during the initiation of the spray.
Figure 1.—Swept NACA 0012 airfoil models installed in IRT test section.
NASA/CR—2012-217419 7
To record the ice shapes, a thin slice was first melted through the ice normal to the model leading edge. A cardboard template was then placed into this slit and an outline of the ice shape traced by pencil, giving a two-dimensional cross section of the ice. Tracings were taken at the vertical center of the tunnel (91 cm from the floor) and at 2.5 cm below the center. The ice shapes so recorded were digitized using an automated line-following feature in the image-analysis software, SigmaScan Pro (Ref. 26). The results presented in this study are from IRT test entry in April 15–16, 2010. Though the actual swept wing ice accretions could exhibit very complex three-dimensional ice shape features like scallops, the shape differences between the two tracing locations were never significant. Therefore only centerline shapes will be reported here. It should be noted that in general the IRT cloud uniformity, especially for LWC distribution, in SLD regime is not as good as in Appendix C for any given air speed.
Uncertainty Analysis
Estimates of the uncertainty in the reported average conditions were made by considering inherent errors of instruments, temporal fluctuation and spatial variation of the instrument readings in the test section, and uncertainty in tunnel calibration of MVD and LWC. Recorded air temperature was believed to be accurate to 0.5 °C, and the uncertainty in air velocity was estimated to be 1 m/s. For Appendix-C conditions the net uncertainty in MVD was estimated at 12 percent. For SLD conditions it may have been as much as 20 percent. These uncertainties are not referenced to an absolute value of MVD, which is unknown. Repeatability and scatter in the LWC calibration data suggests the uncertainty is about 12 percent for both Appendix-C and SLD conditions.
The test-parameter uncertainties were used to estimate the following uncertainties in the similarity parameters for the Appendix-C tests: 3 percent in 0, 12 percent in Ac, 13 percent in n0 and 2 percent in WeL. For the SLD tests the uncertainties were: 4 percent in 0, 12 percent in Ac, 12 percent in n0 and 4 percent in WeL.
Test Results
Due to very limited IRT test time available for the scaling method evaluation, this study only used the IRT calibrated SLD drop sizes as reference conditions. These reference cases included MVDs of 44 and 93 m, and airspeeds of 100 and 150 knot. A baseline condition of V = 100 knot and MVD = 44 m was chosen, and air temperature was varied to create a range of stagnation-point freezing fractions (n0). Scale conditions were then calculated by matching 0, n0, Ac, and WeL with selected scale LWC value for each of the reference case. For each figure, reference ice shape was shown shaded, while a solid line indicated the scale ice shape. The table below each figure gave the test conditions and similarity parameters for each pair of reference and scale tests. The conditions given were the average conditions recorded over the duration of each test, which can sometimes differ slightly from the planned set points. The parameters in the tables were calculated from these average conditions.
100ktV (16)
For the baseline condition of MVD = 44 m, there were three sets of reference and scale ice shape
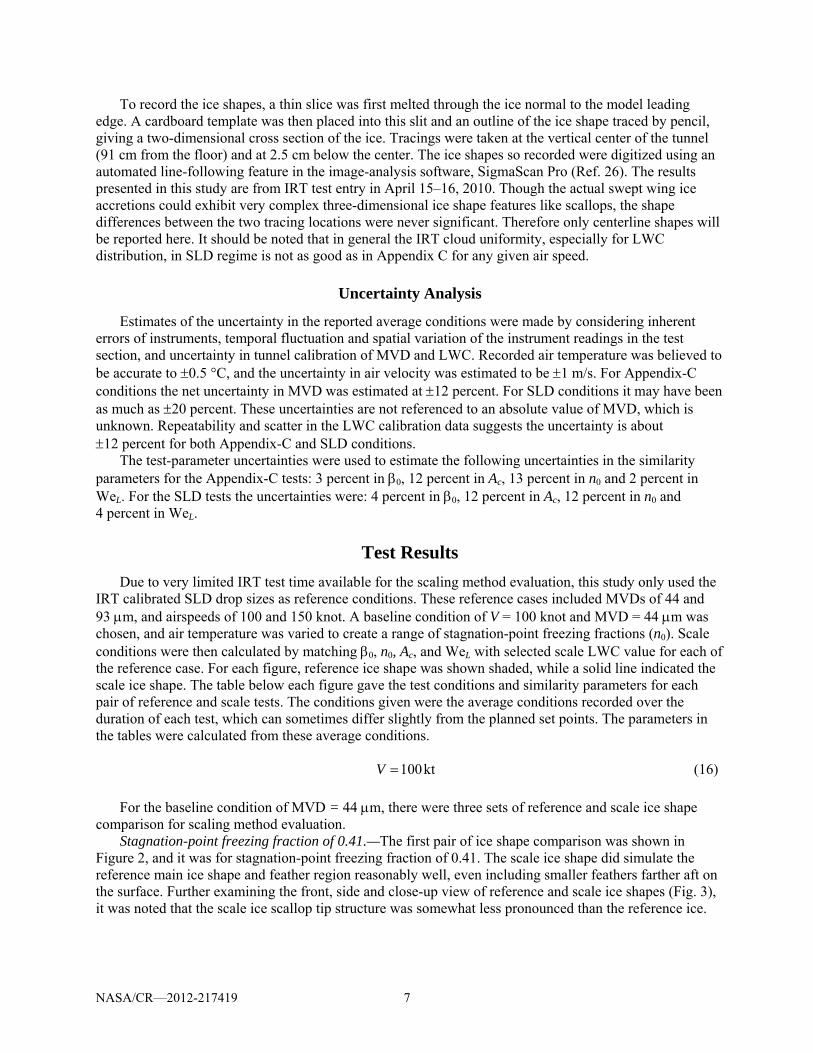
comparison for scaling method evaluation. Stagnation-point freezing fraction of 0.41.—The first pair of ice shape comparison was shown in
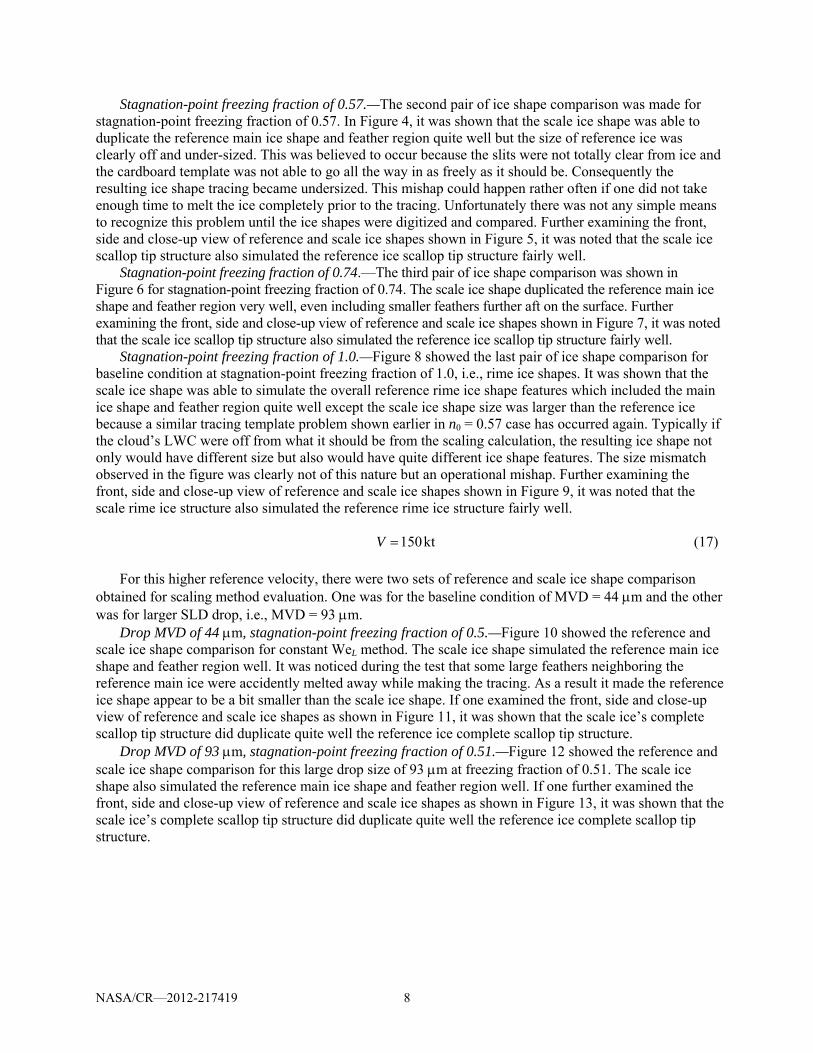
Figure 2, and it was for stagnation-point freezing fraction of 0.41. The scale ice shape did simulate the reference main ice shape and feather region reasonably well, even including smaller feathers farther aft on the surface. Further examining the front, side and close-up view of reference and scale ice shapes (Fig. 3), it was noted that the scale ice scallop tip structure was somewhat less pronounced than the reference ice.
NASA/CR—2012-217419 8
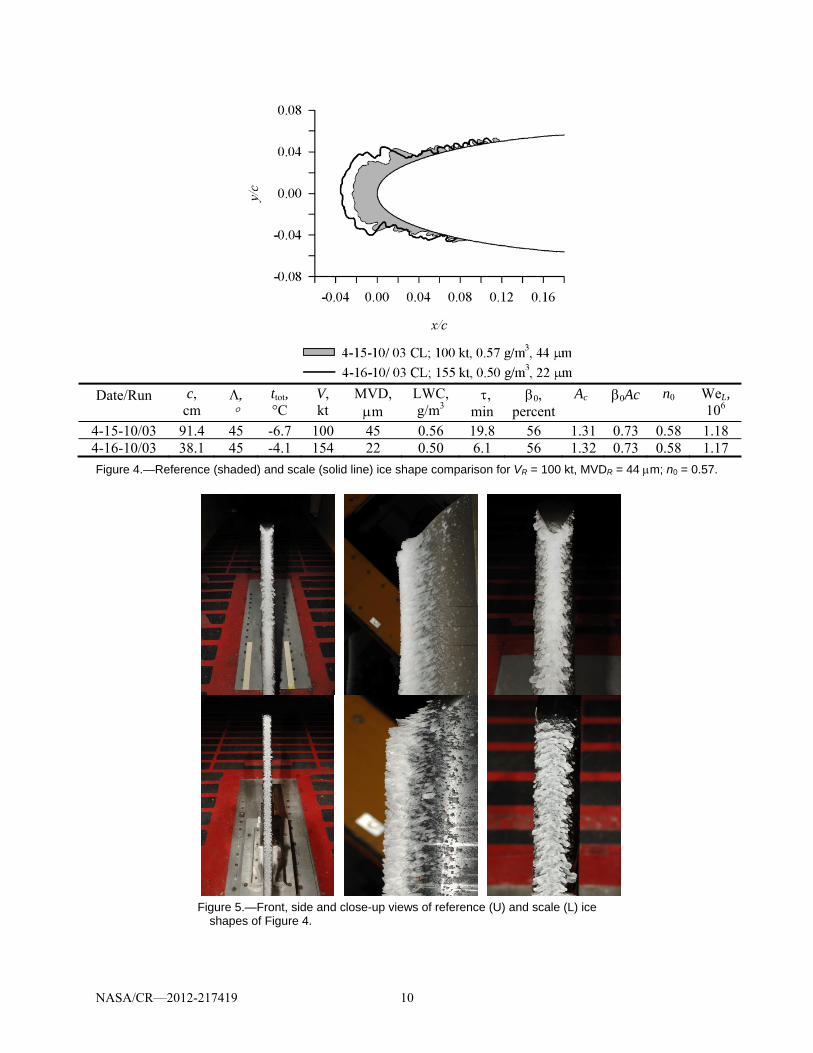
Stagnation-point freezing fraction of 0.57.—The second pair of ice shape comparison was made for stagnation-point freezing fraction of 0.57. In Figure 4, it was shown that the scale ice shape was able to duplicate the reference main ice shape and feather region quite well but the size of reference ice was clearly off and under-sized. This was believed to occur because the slits were not totally clear from ice and the cardboard template was not able to go all the way in as freely as it should be. Consequently the resulting ice shape tracing became undersized. This mishap could happen rather often if one did not take enough time to melt the ice completely prior to the tracing. Unfortunately there was not any simple means to recognize this problem until the ice shapes were digitized and compared. Further examining the front, side and close-up view of reference and scale ice shapes shown in Figure 5, it was noted that the scale ice scallop tip structure also simulated the reference ice scallop tip structure fairly well.
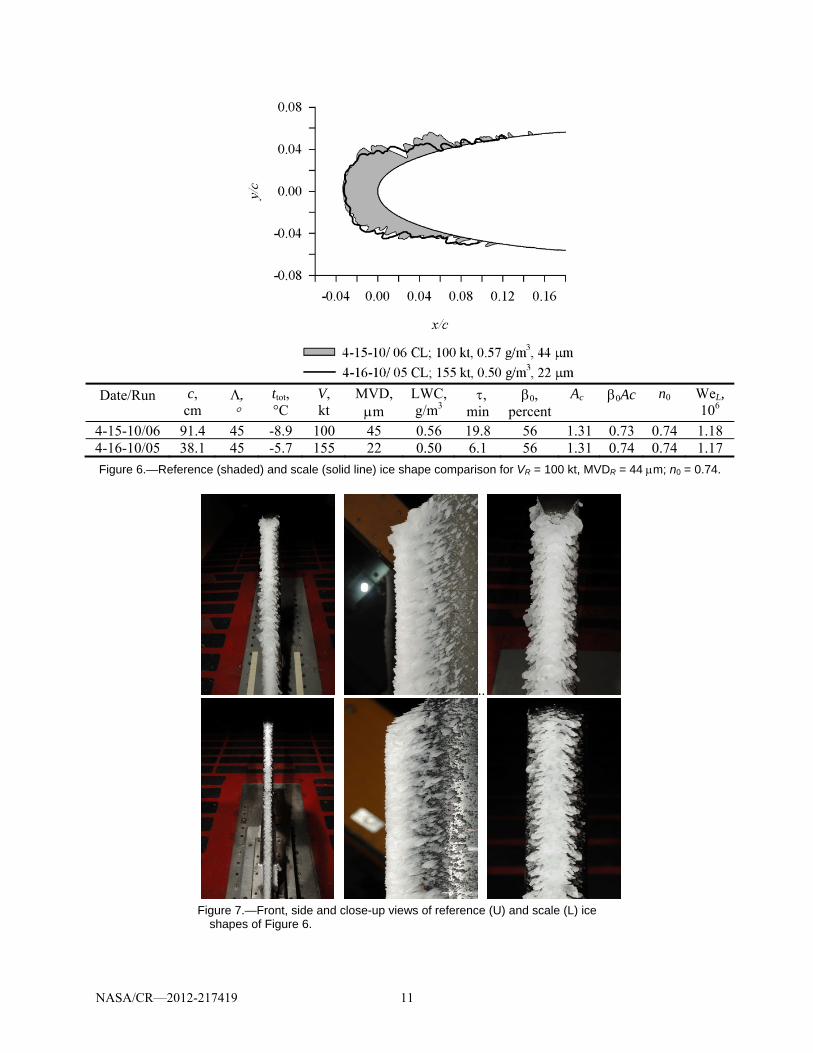
Stagnation-point freezing fraction of 0.74.—The third pair of ice shape comparison was shown in Figure 6 for stagnation-point freezing fraction of 0.74. The scale ice shape duplicated the reference main ice shape and feather region very well, even including smaller feathers further aft on the surface. Further examining the front, side and close-up view of reference and scale ice shapes shown in Figure 7, it was noted that the scale ice scallop tip structure also simulated the reference ice scallop tip structure fairly well.
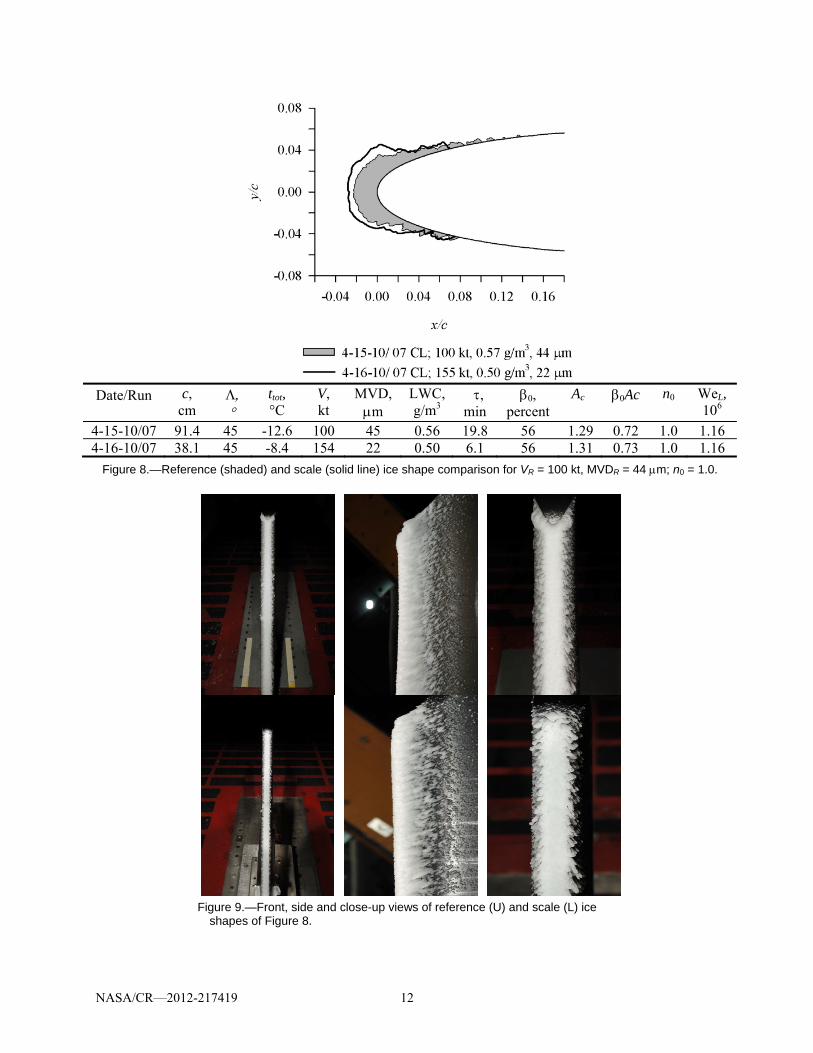
Stagnation-point freezing fraction of 1.0.—Figure 8 showed the last pair of ice shape comparison for baseline condition at stagnation-point freezing fraction of 1.0, i.e., rime ice shapes. It was shown that the scale ice shape was able to simulate the overall reference rime ice shape features which included the main ice shape and feather region quite well except the scale ice shape size was larger than the reference ice because a similar tracing template problem shown earlier in n0 = 0.57 case has occurred again. Typically if the cloud’s LWC were off from what it should be from the scaling calculation, the resulting ice shape not only would have different size but also would have quite different ice shape features. The size mismatch observed in the figure was clearly not of this nature but an operational mishap. Further examining the front, side and close-up view of reference and scale ice shapes shown in Figure 9, it was noted that the scale rime ice structure also simulated the reference rime ice structure fairly well. 150ktV (17)
For this higher reference velocity, there were two sets of reference and scale ice shape comparison obtained for scaling method evaluation. One was for the baseline condition of MVD = 44 m and the other was for larger SLD drop, i.e., MVD = 93 m.
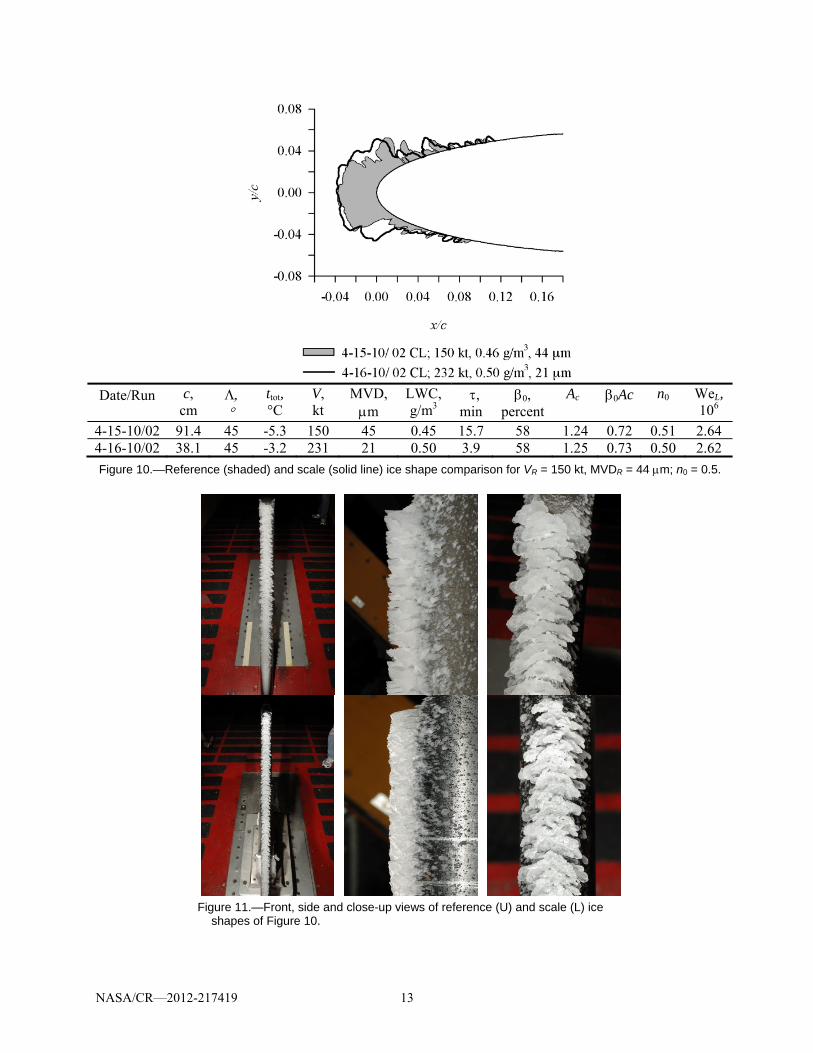
Drop MVD of 44 m, stagnation-point freezing fraction of 0.5.—Figure 10 showed the reference and scale ice shape comparison for constant WeL method. The scale ice shape simulated the reference main ice shape and feather region well. It was noticed during the test that some large feathers neighboring the reference main ice were accidently melted away while making the tracing. As a result it made the reference ice shape appear to be a bit smaller than the scale ice shape. If one examined the front, side and close-up view of reference and scale ice shapes as shown in Figure 11, it was shown that the scale ice’s complete scallop tip structure did duplicate quite well the reference ice complete scallop tip structure.
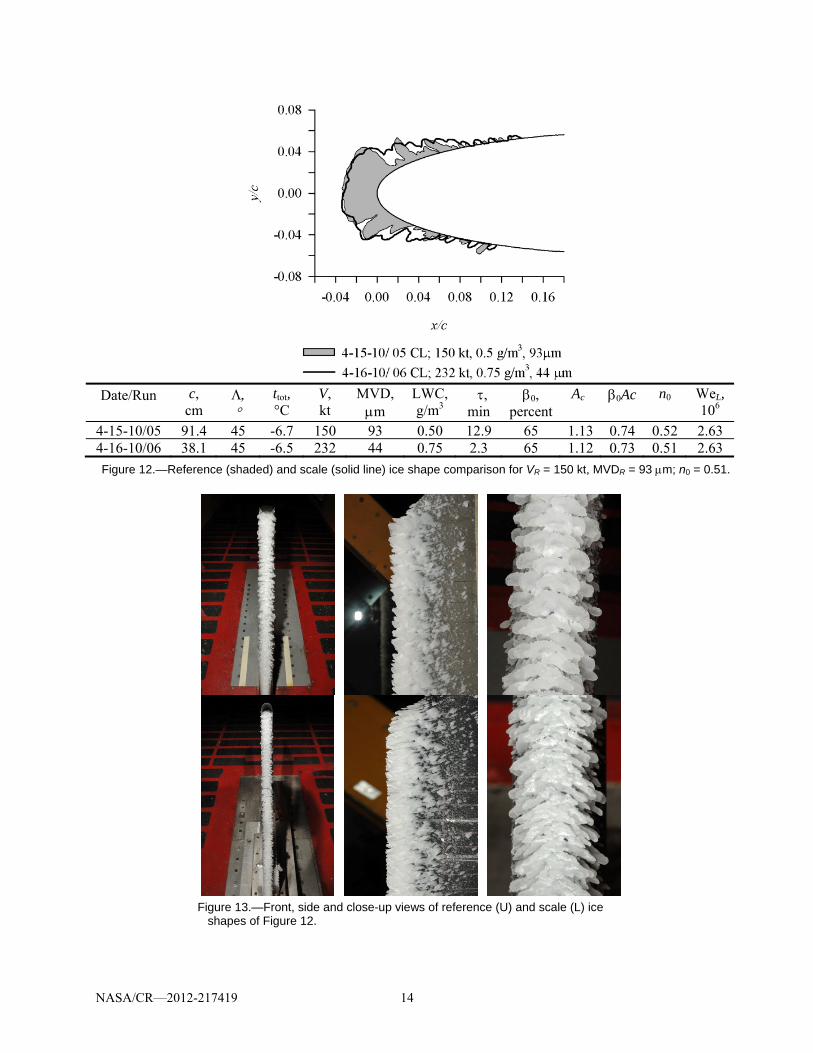
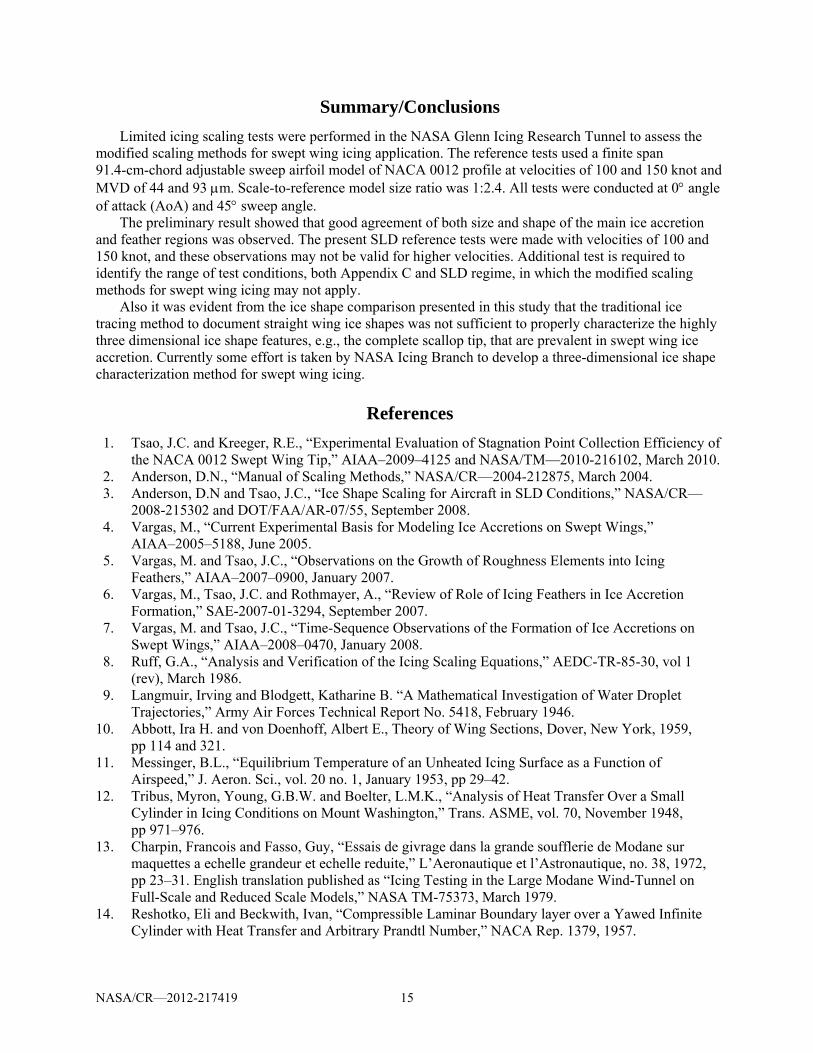
Drop MVD of 93 m, stagnation-point freezing fraction of 0.51.—Figure 12 showed the reference and scale ice shape comparison for this large drop size of 93 m at freezing fraction of 0.51. The scale ice shape also simulated the reference main ice shape and feather region well. If one further examined the front, side and close-up view of reference and scale ice shapes as shown in Figure 13, it was shown that the scale ice’s complete scallop tip structure did duplicate quite well the reference ice complete scallop tip structure.
NASA/CR—2012-217419 9
Date/Run c,
cm
ttot, °C
V, kt
MVD,m
LWC, g/m3
, min
0, percent
Ac 0Ac n0 WeL, 106
4-15-10/01 91.4 45 -4.4 100 45 0.57 19.9 56 1.31 0.73 0.41 1.174-16-10/01 38.1 45 -2.5 155 22 0.50 6.12 56 1.32 0.74 0.42 1.17
Figure 2.—Reference (shaded) and scale (solid line) ice shape comparison for VR = 100 kt, MVDR = 44 m; n0 = 0.41.
Figure 3.—Front, side and close-up views of reference (U) and scale (L) ice
shapes of Figure 2.
NASA/CR—2012-217419 10
Date/Run c,
cm
ttot, °C
V, kt
MVD,m
LWC, g/m3
, min
0, percent
Ac 0Ac n0 WeL, 106
4-15-10/03 91.4 45 -6.7 100 45 0.56 19.8 56 1.31 0.73 0.58 1.184-16-10/03 38.1 45 -4.1 154 22 0.50 6.1 56 1.32 0.73 0.58 1.17
Figure 4.—Reference (shaded) and scale (solid line) ice shape comparison for VR = 100 kt, MVDR = 44 m; n0 = 0.57.
Figure 5.—Front, side and close-up views of reference (U) and scale (L) ice
shapes of Figure 4.
NASA/CR—2012-217419 11
Date/Run c,
cm
ttot, °C
V, kt
MVD,m
LWC, g/m3
, min
0, percent
Ac 0Ac n0 WeL, 106
4-15-10/06 91.4 45 -8.9 100 45 0.56 19.8 56 1.31 0.73 0.74 1.184-16-10/05 38.1 45 -5.7 155 22 0.50 6.1 56 1.31 0.74 0.74 1.17
Figure 6.—Reference (shaded) and scale (solid line) ice shape comparison for VR = 100 kt, MVDR = 44 m; n0 = 0.74.
..
Figure 7.—Front, side and close-up views of reference (U) and scale (L) ice
shapes of Figure 6.
NASA/CR—2012-217419 12
Date/Run c,
cm
ttot, °C
V, kt
MVD,m
LWC, g/m3
, min
0, percent
Ac 0Ac n0 WeL, 106
4-15-10/07 91.4 45 -12.6 100 45 0.56 19.8 56 1.29 0.72 1.0 1.164-16-10/07 38.1 45 -8.4 154 22 0.50 6.1 56 1.31 0.73 1.0 1.16
Figure 8.—Reference (shaded) and scale (solid line) ice shape comparison for VR = 100 kt, MVDR = 44 m; n0 = 1.0.
Figure 9.—Front, side and close-up views of reference (U) and scale (L) ice
shapes of Figure 8.
NASA/CR—2012-217419 13
Date/Run c,
cm
ttot, °C
V, kt
MVD,m
LWC, g/m3
, min
0, percent
Ac 0Ac n0 WeL, 106
4-15-10/02 91.4 45 -5.3 150 45 0.45 15.7 58 1.24 0.72 0.51 2.644-16-10/02 38.1 45 -3.2 231 21 0.50 3.9 58 1.25 0.73 0.50 2.62
Figure 10.—Reference (shaded) and scale (solid line) ice shape comparison for VR = 150 kt, MVDR = 44 m; n0 = 0.5.
Figure 11.—Front, side and close-up views of reference (U) and scale (L) ice
shapes of Figure 10.
NASA/CR—2012-217419 14
Date/Run c,
cm
ttot, °C
V, kt
MVD,m
LWC, g/m3
, min
0, percent
Ac 0Ac n0 WeL, 106
4-15-10/05 91.4 45 -6.7 150 93 0.50 12.9 65 1.13 0.74 0.52 2.634-16-10/06 38.1 45 -6.5 232 44 0.75 2.3 65 1.12 0.73 0.51 2.63
Figure 12.—Reference (shaded) and scale (solid line) ice shape comparison for VR = 150 kt, MVDR = 93 m; n0 = 0.51.
Figure 13.—Front, side and close-up views of reference (U) and scale (L) ice
shapes of Figure 12.
NASA/CR—2012-217419 15
Summary/Conclusions
Limited icing scaling tests were performed in the NASA Glenn Icing Research Tunnel to assess the modified scaling methods for swept wing icing application. The reference tests used a finite span 91.4-cm-chord adjustable sweep airfoil model of NACA 0012 profile at velocities of 100 and 150 knot and MVD of 44 and 93 m. Scale-to-reference model size ratio was 1:2.4. All tests were conducted at 0 angle of attack (AoA) and 45 sweep angle.
The preliminary result showed that good agreement of both size and shape of the main ice accretion and feather regions was observed. The present SLD reference tests were made with velocities of 100 and 150 knot, and these observations may not be valid for higher velocities. Additional test is required to identify the range of test conditions, both Appendix C and SLD regime, in which the modified scaling methods for swept wing icing may not apply.
Also it was evident from the ice shape comparison presented in this study that the traditional ice tracing method to document straight wing ice shapes was not sufficient to properly characterize the highly three dimensional ice shape features, e.g., the complete scallop tip, that are prevalent in swept wing ice accretion. Currently some effort is taken by NASA Icing Branch to develop a three-dimensional ice shape characterization method for swept wing icing.
References
1. Tsao, J.C. and Kreeger, R.E., “Experimental Evaluation of Stagnation Point Collection Efficiency of the NACA 0012 Swept Wing Tip,” AIAA–2009–4125 and NASA/TM—2010-216102, March 2010.
2. Anderson, D.N., “Manual of Scaling Methods,” NASA/CR—2004-212875, March 2004. 3. Anderson, D.N and Tsao, J.C., “Ice Shape Scaling for Aircraft in SLD Conditions,” NASA/CR—
2008-215302 and DOT/FAA/AR-07/55, September 2008. 4. Vargas, M., “Current Experimental Basis for Modeling Ice Accretions on Swept Wings,”
AIAA–2005–5188, June 2005. 5. Vargas, M. and Tsao, J.C., “Observations on the Growth of Roughness Elements into Icing
Feathers,” AIAA–2007–0900, January 2007. 6. Vargas, M., Tsao, J.C. and Rothmayer, A., “Review of Role of Icing Feathers in Ice Accretion
Formation,” SAE-2007-01-3294, September 2007. 7. Vargas, M. and Tsao, J.C., “Time-Sequence Observations of the Formation of Ice Accretions on
Swept Wings,” AIAA–2008–0470, January 2008. 8. Ruff, G.A., “Analysis and Verification of the Icing Scaling Equations,” AEDC-TR-85-30, vol 1
(rev), March 1986. 9. Langmuir, Irving and Blodgett, Katharine B. “A Mathematical Investigation of Water Droplet
Trajectories,” Army Air Forces Technical Report No. 5418, February 1946. 10. Abbott, Ira H. and von Doenhoff, Albert E., Theory of Wing Sections, Dover, New York, 1959,
pp 114 and 321. 11. Messinger, B.L., “Equilibrium Temperature of an Unheated Icing Surface as a Function of
Airspeed,” J. Aeron. Sci., vol. 20 no. 1, January 1953, pp 29–42. 12. Tribus, Myron, Young, G.B.W. and Boelter, L.M.K., “Analysis of Heat Transfer Over a Small
Cylinder in Icing Conditions on Mount Washington,” Trans. ASME, vol. 70, November 1948, pp 971–976.
13. Charpin, Francois and Fasso, Guy, “Essais de givrage dans la grande soufflerie de Modane sur maquettes a echelle grandeur et echelle reduite,” L’Aeronautique et l’Astronautique, no. 38, 1972, pp 23–31. English translation published as “Icing Testing in the Large Modane Wind-Tunnel on Full-Scale and Reduced Scale Models,” NASA TM-75373, March 1979.
14. Reshotko, Eli and Beckwith, Ivan, “Compressible Laminar Boundary layer over a Yawed Infinite Cylinder with Heat Transfer and Arbitrary Prandtl Number,” NACA Rep. 1379, 1957.
NASA/CR—2012-217419 16
15. Bilanin, A.J., “Proposed Modifications to the Ice Accretion/Icing Scaling Theory,” AIAA-88-0203, January 1988.
16. Olsen, W. and Walker, E., “Experimental Evidence for Modifying the Current Physical Model for Ice Accretion on Aircraft Surfaces,” NASA TM 87184, 1986.
17. Hansman, R. John, Jr. and Turnock, Stephen, R., “Investigation of Surface Water Behavior During Glaze Ice Accretion,” J. Aircraft, vol. 26 no. 2, February 1989, pp 140-147.
18. Hansman, R. John, Jr. and Turnock, Stephen R., “Investigation of Microphysical Factors which Influence Surface Roughness During Glaze Ice Accretion,” 4th International Workshop on Atmospheric Icing of Structures, Paris, September 1988.
19. Hansman, R.J., Breuer, K.S., Hazan, D., Reehorst, A. and Vargas, M., “Close-up Analysis of Aircraft Ice Accretion,” AIAA-93-0029, January 1993.
20. Bilanin, Alan J. and Anderson, David N., “Ice Accretion with Varying Surface Tension,” AIAA-95-0538 and NASA TM 106826, January 1995.
21. Anderson, David N. and Tsao, J.C., “Additional Results of Ice-Accretion Scaling at SLD Conditions,” AIAA–2003–0390, January 2003 and NASA/CR—2005-213850, August 2005.
22. Bartlett, C. Scott, “An Analytical Study of Icing Similitude for Aircraft Engine Testing,” DOT/FAA/CT-86/35 and AEDC-TR-86-26, October 1986.
23. Bartlett, C. Scott, “Icing Scaling Considerations for Aircraft Engine Testing,” AIAA-88-0202, January 1988.
24. Oleskiw, Myron M., De Gregorio, Fabrizio and Esposito, Biagio, “The Effect of Altitude on Icing Tunnel Airfoil Icing Simulation,” Proceedings of the FAA International Conference on Aircraft Inflight Icing, DOT/FAA/AR-96/81,II, August 1996, pp 511–520.
25. Ide, Robert F. and Oldenburg, John R., “Icing Cloud Calibration of the NASA Glenn Icing Research Tunnel,” AIAA–2001–0234, January 2001.
26. SigmaScan Pro, image-processing software, ver. 5.0, Systat Software, Inc., Point Richmond, CA.
REPORT DOCUMENTATION PAGE Form Approved OMB No. 0704-0188
The public reporting burden for this collection of information is estimated to average 1 hour per response, including the time for reviewing instructions, searching existing data sources, gathering and maintaining the data needed, and completing and reviewing the collection of information. Send comments regarding this burden estimate or any other aspect of this collection of information, including suggestions for reducing this burden, to Department of Defense, Washington Headquarters Services, Directorate for Information Operations and Reports (0704-0188), 1215 Jefferson Davis Highway, Suite 1204, Arlington, VA 22202-4302. Respondents should be aware that notwithstanding any other provision of law, no person shall be subject to any penalty for failing to comply with a collection of information if it does not display a currently valid OMB control number. PLEASE DO NOT RETURN YOUR FORM TO THE ABOVE ADDRESS.
1. REPORT DATE (DD-MM-YYYY) 01-05-2012
2. REPORT TYPE Final Contractor Report
3. DATES COVERED (From - To)
4. TITLE AND SUBTITLE Evaluation of Icing Scaling on Swept NACA 0012 Airfoil Models
5a. CONTRACT NUMBER NNC07BA13B
5b. GRANT NUMBER
5c. PROGRAM ELEMENT NUMBER
6. AUTHOR(S) Tsao, Jen-Ching; Lee, Sam
5d. PROJECT NUMBER
5e. TASK NUMBER
5f. WORK UNIT NUMBER WBS 648987.02.03.03.10
7. PERFORMING ORGANIZATION NAME(S) AND ADDRESS(ES) Ohio Aerospace Institute
8. PERFORMING ORGANIZATION REPORT NUMBER E-18090
9. SPONSORING/MONITORING AGENCY NAME(S) AND ADDRESS(ES) National Aeronautics and Space Administration Washington, DC 20546-0001
10. SPONSORING/MONITOR'S ACRONYM(S) NASA
11. SPONSORING/MONITORING REPORT NUMBER NASA/CR-2012-217419
12. DISTRIBUTION/AVAILABILITY STATEMENT Unclassified-Unlimited Subject Category: 03 Available electronically at http://www.sti.nasa.gov This publication is available from the NASA Center for AeroSpace Information, 443-757-5802
13. SUPPLEMENTARY NOTES
14. ABSTRACT Icing scaling tests in the NASA Glenn Icing Research Tunnel (IRT) were performed on swept wing models using existing recommended scaling methods that were originally developed for straight wing. Some needed modifications on the stagnation-point local collection efficiency (i.e., β0) calculation and the corresponding convective heat transfer coefficient for swept NACA 0012 airfoil models have been
studied and reported in 2009, and the correlations will be used in the current study. The reference tests used a 91.4-cm chord, 152.4-cm span, adjustable sweep airfoil model of NACA 0012 profile at velocities of 100 and 150 knot and MVD of 44 and 93 mm. Scale-to-reference model size ratio was 1:2.4. All tests were conducted at 0° angle of attack (AoA) and 45° sweep angle. Ice shape comparison results were presented for stagnation-point freezing fractions in the range of 0.4 to 1.0. Preliminary results showed that good scaling was achieved for the conditions test by using the modified scaling methods developed for swept wing icing.15. SUBJECT TERMS Icing; Scaling
16. SECURITY CLASSIFICATION OF: 17. LIMITATION OF ABSTRACT UU
18. NUMBER OF PAGES
22
19a. NAME OF RESPONSIBLE PERSON STI Help Desk (email:[email protected])
a. REPORT U
b. ABSTRACT U
c. THIS PAGE U
19b. TELEPHONE NUMBER (include area code) 443-757-5802
Standard Form 298 (Rev. 8-98)Prescribed by ANSI Std. Z39-18