evaluation of different wag optimization and secondary ... · simulation is built using the eclipse...
TRANSCRIPT

International Journal of Applied Engineering Research ISSN 0973-4562 Volume 12, Number 20 (2017) pp. 9259-9270
© Research India Publications. http://www.ripublication.com
9259
Evaluation of Different Wag Optimization and Secondary Recovery
Techniques in a Stratified Reservoir
Oladepo David A., Ako Churchill, Fadairo Adesina S. and Ogunkunle Tope
Department of Petroleum Engineering, Institution- Covenant University
Idiroko road, Ota, State-Ogun-state, Nigeria.
Abstract
It is a general knowledge that considerable amount of oil is
often left in a hydrocarbon reservoir after depletion of the
primary energy. Therefore the need to develop an oil field is
required through suitable recovery techniques such as water
flooding, miscible gas injection and miscible WAG injection
which are targeted towards recovering a considerable portion
of the remaining oil. The world being an uncertain
environment with an increasingly day to day demand for
energy and uncertainty as to where the next oil field can be
discovered are looking for means to maximally optimize the
production of hydrocarbon from new and producing wells in
the quickest possible time, ensuring pressure is maintained.
The WAG injection scheme is varied with various WAG
ratios. In this study, ultimate recovery was optimized using
different WAG ratios which were compared with two
secondary injection schemes, water injection and gas
injection. The eclipse simulator was used to build a dynamic
model where different development options, predictions and
analysis was done on the reservoir model.
The evaluation of different schemes was considered to
determine the highest ultimate recovery. Factors such as
recovery factor, and field water cut were also analyzed to
come up with an optimum recovery. From the results
obtained, water flooding gave the highest ultimate recovery of
144 million barrels of oil though the FWCT was on the high
side, while the MWAG (2:1) was second in ranking had an
ultimate recovery of 120 million barrels of oil. Water flooding
seems to be the best method to use amongst the five selected
cases for the purpose of continual production by operators of
field XYZ because it yielded the largest ultimate recovery.
From the results obtained, water flooding proves to be the
most economical of all selected five cases discussed.
INTRODUCTION
THE NEED FOR RECOVERY MECHANISMS
Zeron (2012), with the advancement of technology
worldwide, petroleum has become the largest source of non-
renewable energy generation for the purpose of developing
industrialized countries and the world at large. The demand
for energy is developing radically which requires the
provision and creation of efficient methods for tertiary
recovery of the residual hydrocarbon after secondary recovery
becomes uneconomical. These methods of recovery are done
to ensure the maximum possible value of recovery of
hydrocarbon before it reaches the stage of reservoir
abandonment.
It is a general knowledge that considerable amount of oil is
often left in a hydrocarbon reservoir after depletion of the
primary energy. Therefore the need to develop an oil field is
required through suitable recovery techniques such as water
flooding, miscible gas injection and miscible WAG injection
which are targeted towards recovering a considerable portion
of the remaining oil. The world being an uncertain
environment with an increasingly day to day demand for
energy and uncertainty as to where the next oil field can be
discovered are looking for means to maximally optimize the
production of hydrocarbon from new and producing wells in
the quickest possible time, ensuring pressure is maintained.
From definition, optimization is regarded as the act of
obtaining the best achievable outcome under a specified
circumstances or situation. The term ‘optimum’ means
minimum and maximum. This research work seeks to achieve
the maximum possible recovery attainable from a reservoir
which is to be explored using 3 various recovery techniques.
OIL RECOVERY TECHNIQUE
Speight (2009), Oil recovery process is divided into 3 phases
of its lifespan. They are primary recovery, secondary
recovery, and tertiary recovery. The Primary recovery process
usually occurs during the early life stages of the reservoir
when the natural pressure of the reservoir is sufficient to flow
the fluids from the reservoir to the surface. Primary recovery
process is very responsive to the reservoir properties. The
intermediate phase of oil recovery process is the Secondary
recovery process and it involves the injection of water to
displace or push the oil to the surface. Today, the EOR
technique has become a supplementary method for raising
crude oil to the surface through various methods by
effectually making the primary and secondary methods
assisted after the former two processes have become
uneconomical for production. The enhanced oil recovery
method which can be otherwise referred to as the
supplementary methods can help to increase the recovery of
crude oil. This can only be done at an additional cost which is

International Journal of Applied Engineering Research ISSN 0973-4562 Volume 12, Number 20 (2017) pp. 9259-9270
© Research India Publications. http://www.ripublication.com
9260
to be incurred by the operators of a particular field. In most
cases, the EOR method usually has a target of nearly 2/3 of
the Initial oil in place which is about 66.7 percent. The
residual oil after primary and secondary recovery processes
becomes uneconomical is always the motivating factor for
companies to commence on an EOR project. There are 3 main
groups of the EOR process. They include the thermal process,
the miscible gas injection process and the chemical process.
This research paper focuses on a comparative approach of
ultimate recovery using various recovery techniques. To
optimize NPV, this study seek to provide various strategies to
Optimize sweep efficiency of the injector and producer wells
using the results from analysis of miscible WAG, water
flooding and miscible gas injection. The results will be
compared to check the various effects they have on the
outcome of production. Most often, water is a good choice of
injectant because they help in providing pressure maintenance
through the replacement of the produced fluid. They also
provide assistance to pushing out the oil into the producers.
When considering under ride of oil by water in most
reservoirs, it is necessary to consider the fact that Water is
heavier than oil. Gravity is usually responsible for the under
ride of water by oil. Some other factors such as reservoir
heterogeneity, well spacing and thickness of the reservoir can
also be causes to how intense or marginal this under ride can
be when considering the density of water to oil.
Gas flooding is the other secondary flooding that is to be used
in this research work. This can either be miscible or
immiscible. Emphasis on this research is centred on using a
miscible gas. When considering miscible gas injection, the
depth and pressure of the reservoir are variables in which gas
flooding depends on. Miscibility occurs when two phase
fluids forms a single fluid phase. To attain miscibility is
always difficult in real gases. Ideally, when there is an
increase in gas mobility the resultant is usually an increased
injectivity and this often results in the wells becoming rate-
limited. Scenarios where decline in injectivity occurs often
results to a drastic reduced reservoir pressure during
production. Gas tends to override the oil in the reservoir
because they have a lower density and this may result in a
significant volume of the reservoir to be left unswept thereby
leading to early breakthrough. Early breakthrough is a
situation in which the reservoir starts producing water at a
very immature stage. This can be ensuring the injection cycles
are done properly. Miscible gas flooding helps to reduce the
interfacial tension between oil and water. During an
immiscible flood heterogeneities cause worse fingering and
bypassing of oil than water. This problem gets worse as the
mobility ratio becomes larger. Worse fingering and bypassing
of oil are problems that occur from immiscible flood
heterogeneity.
Incorporating the use of water and gas is named Water
Alternating Gas or WAG. This process can be described as
“An enhanced oil recovery method whereby water and gas are
injected in alternating cycles for time duration so as to provide
better sweep efficiency. The benefits of water injection and
gas injection are usually combined in a WAG process.
Typically, a protracted water flood and gas flood is executed
until the field is no longer economical for production. This
process involves alternating slugs of gas and water into the
reservoir with an injection period having phases that tends to
extend for about one to six months.
WAG injection engages drainage and imbibition occurring
simultaneously in the reservoir (Nezhad S, 2006). Due to
mixture of mass transfer, drainage and imbibition cycles, the
residual oil saturation becomes typically lower than in water
flooding which is also like gas flooding. The concept behind
this process known as “WAG” is a blend of two secondary
recovery processes of water flooding and gas injection. This
process was targeted for an ideal or perfect system such that
microscopic and macroscopic sweep efficiency are perfected
concurrently. A scenario where the reservoir is being flooded
with water, oil droplets will be trapped inside the pore spaces
of the water flooded region.
Figure 1: WAG process (accessibility of WAG to difficult to
reach oil) (Esmaiel, 2005).
There are numerous publications on the use of slug as
secondary recovery technique to reduce residual oil saturation,
where effective macroscopic and microscopic sweep
efficiencies is of interest as shown in fig.1. Stenby et al,
(2001) reported the first WAG injection that was carried out
in the North Pembina oil field in Alberta, Canada in 1957. 59
WAG field cases both miscible and immiscible were
reviewed, an increased oil recovery of 5% to 10% was
recorded from majority of the 59 fields investigated but oil
recovery increase of 20% was recorded in some other fields.
Esmaiel (2005) carried out an initial screening of various
properties of the reservoir to attain sensitivity of the Net
present value to the WAG process using a proxy model
developed. His work involves the use of reservoir simulation
model for computation of oil recovery done at duration of
5years and 10years. This was done mainly to increase the
ultimate recovery of the flood pattern. The output from his
base model before optimization was carried out gave an
average recovery of 15.5% having a standard deviation rating
of 1.25% for time duration of 10years.

International Journal of Applied Engineering Research ISSN 0973-4562 Volume 12, Number 20 (2017) pp. 9259-9270
© Research India Publications. http://www.ripublication.com
9261
METHODOLOGY
This paper throws light on the art of producing research
methodology ranging from the gathering of data to the
implementation of software approach. A major tool to be used
in this project is the schlumberger eclipse simulator. This
research seeks to compare three various injection schemes to
account for which method produces a better recovery.
Sensitivity analysis will also be done using the simulator by
increasing and decreasing certain parameters to yield a good
ultimate recovery. The WAG injection scheme is varied with
various WAG ratios. This is then compared with two
secondary injection schemes water injection and gas injection
to account for which method gives a better recovery. The
eclipse simulator will be used to build a dynamic model where
predictions and analysis will be done on the reservoir models.
The models are imported using the Floviz in the eclipse prior
to building of the reservoir model. The research methodology
is as shown in fig. 2
WELL MODELLING
The well modeled for the mechanisms to be compared are
built using a dynamic reservoir model. The numerical
simulation is built using the eclipse 300. The reservoir built
comprises of 2injectors and 2 producer wells. The location
and no of injectors and producer wells play a great role as to
how the oil can be recovered from the reservoir pores. This
factors can either increase of reduce the total amount of oil
recovered from the reservoir pores when comparing various
schemes. It consists of a coarse to upper medium sandstone
characterized by non-inclined strata or trough sedimentary
structure. The well penetrates the 7 layers of the reservoir.
The injector rate used for simulation are shown below
WCONINJE
I1 GAS OPEN RATE 2000
I2 GAS OPEN RATE 2000
WELTARG
I1 WRATE 2000
I2 WRATE 2000
Where WCONINJ and WELTARG are commands in the
eclipse simulator to assign injector rates to water and gas
during a WAG cycle.
Building the model entails looking at the type/dimension of
the grid blocks from the X, Y and Z direction. Pressure-
volume-temperature, viscosity, formation volume factor,
relative permeability of water, relative permeability of oil,
compressibility factor of the rock, fluid density, oil water
contact depth, datum depth, datum pressure, gas oil contact
depth and gas oil saturation function data are all provided to
build the reservoir model. Water injection or gas injections
were performed using the same reservoir parameters for
comparison. This simulation is done by employing the
schlumberger eclipse simulator to test result derived. The
recovery of the oil versus time is plotted on a graph for a
better understanding of the oil recovery trend.
Data required in building the model includes a reservoir
discretized into a 15 by 15 by 7 in the XYZ direction
respectively.
Basically 5 cases are to be considered in this study. These five
cases includes the following outlined below
CASE 1: Miscible WAG injection scheme using ratio 1 to 1.
CASE 2: Miscible WAG injection scheme using ratios 2 to 1.
CASE 3: Miscible WAG injection scheme using ratios 1 to 2
CASE 4: Miscible gas injection scheme.
CASE 5: Water flooding injection scheme.
Figure 2: Research Workflow/Methodology

International Journal of Applied Engineering Research ISSN 0973-4562 Volume 12, Number 20 (2017) pp. 9259-9270
© Research India Publications. http://www.ripublication.com
9262
RESULT AND DISCUSSION
The results are tabulated and analyzed in this study. The
tabulated values from the simulations done are provided in the
later part of this research. The results obtained from the
simulation are the Recovery factors, the Ultimate recovery,
Field water cut and the Field gas-oil ratio from various
injection schemes.
ANALYSIS OF MISCIBLE WATER ALTERNATING
GAS SCHEME RATIO (1:1)
Figure 3: Showing grid after simulation during WAG (1:1)
CASE 1 ANALYSIS:
The simulation done was subject to WAG (1:1) scheme; water
and gas were injected through two injector wells as presented
in the model from fig. 3. Water and gas were alternated
throughout the entire simulation process in an equal 1 to 1
ratio. The injection of water took place for 100days and
alternated with gas for the next 100 days. This cycle was
repeated throughout the entire simulation process. Various
plots were generated and analysis of each plot is discussed
extensively.
Field oil efficiency versus time after the reservoir was
subjected to MWAG (1:1) yielded a recovery factor of 0.37
after production occurred for 77 years from fig. 4. 33years of
simulation using the MWAG mechanism yielded an
insignificant recovery as the project life span remained
actively productive for only 77years. The ultimate recovery
from this injection scheme yielded about 101million barrels of
recovered hydrocarbons after 77years. This analysis is derived
from the plots of FOE and FOPT against time. The simulation
process using MWAG yielded an ultimate recovery of 112
million barrels of oil after 110years
Figure 4: Plot of FOE vs. time

International Journal of Applied Engineering Research ISSN 0973-4562 Volume 12, Number 20 (2017) pp. 9259-9270
© Research India Publications. http://www.ripublication.com
9263
Figure 5: Plot of FOPT vs TIME
Field oil efficiency versus time using water alternating gas
(1:1) gave a productive recovery factor of 0.405 over a period
of 110years with an ultimate recovery of 112million barrels of
oil recovered from fig. 5. The project showed active
productivity up until 93 years of production, thereafter the
recovery became insignificant. 93 years of production yielded
a recovery factor of 0.5 with an ultimate recovery of 136.8
million barrels of oil recovery over 93 years.
ANALYSIS OF MISCIBLE WATER ALTERNATING
GAS SCHEME RATIO 2:1
Figure 6: Showing model after simulation for MWAG (2:1)
CASE 2 ANALYSIS:
The simulation done was subject to miscible gas injection
with a ratio of 2:1. Miscible WAG injection scheme (2:1) was
investigated; water was injected through two injector wells for
200 days and alternated with gas which is injected for 100
days as presented in the model from fig. 6. The production
rate was set at 2000 barrels per day for each producer well.
Field oil efficiency versus time using water alternating gas
gave a recovery factor of 0.439 over a period of 110years with
an ultimate recovery of 120.5million barrels of oil recovered
from fig. 7. The scheme showed active productivity up until
the 77th year of production thereafter the recovery mechanism
became insignificant. Production span for 77years yielded a
recovery factor of 0.407 with an ultimate recovery of 111.4
million barrels of oil recovery over 77 years. This mechanism
showed that it was advisable to foster production at the 77th
year because the remaining 33 years lead to an insignificant
recovery. This is due to the marginal extra 9.1million barrels
that was produced during the remaining 33 years

International Journal of Applied Engineering Research ISSN 0973-4562 Volume 12, Number 20 (2017) pp. 9259-9270
© Research India Publications. http://www.ripublication.com
9264
Figure 7: Plots FOPT, FOE VS time using MWAG (2:1)
ANALYSIS OF MICIBLE WATER ALTERNATING
GAS SCHEME RATIO 1:2
Figure 8: Showing model after simulation for MWAG (1:2)
CASE 3 ANALYSIS:
The simulation done was subject to miscible wag injection
with a ratio of 2:1. Miscible WAG injection scheme (1:2) was
investigated with water injected through two injector wells for
100 days and alternated with gas which is injected for 200
days as presented in the model from fig.8. The production rate
was set at 2000 barrels per day for each producer well.
Field oil efficiency vs time using water flooding gave a
productive recovery factor which was highest at the 66th year
of production with an ultimate recovery of 92.5 million
barrels beyond the 66th year of production as shown in fig. 9,
the recovery mechanism became uneconomical without
further emergence of oil at the producers. As shown in fig. 10,
plots of FOPT versus TIME shows that no further production
was achieved after the 66th year as a constant production was
achieved up until the production time limit set at 110 years.

International Journal of Applied Engineering Research ISSN 0973-4562 Volume 12, Number 20 (2017) pp. 9259-9270
© Research India Publications. http://www.ripublication.com
9265
Figure 9: Plots of FOE VS time using MWAG (1:2)
Figure 10: Showing FOPT VS time using MWAG (1:2)

International Journal of Applied Engineering Research ISSN 0973-4562 Volume 12, Number 20 (2017) pp. 9259-9270
© Research India Publications. http://www.ripublication.com
9266
ANALYSIS OF MISIBLE GAS INJECTION
Figure 11: Showing model after simulation for miscible gas
injection
CASE 4 ANALYSIS:
The simulation done was subject to miscible gas injection.
Miscible gas was injected through two injector wells
throughout the simulation that spanned for 110 years as
presented in the model as shown in fig. 11. The production
rate was set at 2000 barrels per day for each producer well.
Field oil efficiency versus time using miscible gas yielded a
recovery factor of 0.29 after production occurred for 55 years
as shown in fig. 12. 55 years of simulation using the WAG
mechanism yielded an insignificant recovery as the production
became insignificant thereafter. The ultimate recovery from
this injection scheme yielded about 80.8million barrels of
recovered hydrocarbons. This analysis is derived from the
plots of FOE and FOPT against time.
Figure 12: Showing FOPT, FOE versus TIME using MGI.
International Journal of Applied Engineering Research ISSN 0973-4562 Volume 12, Number 20 (2017) pp. 9259-9270
© Research India Publications. http://www.ripublication.com
9267
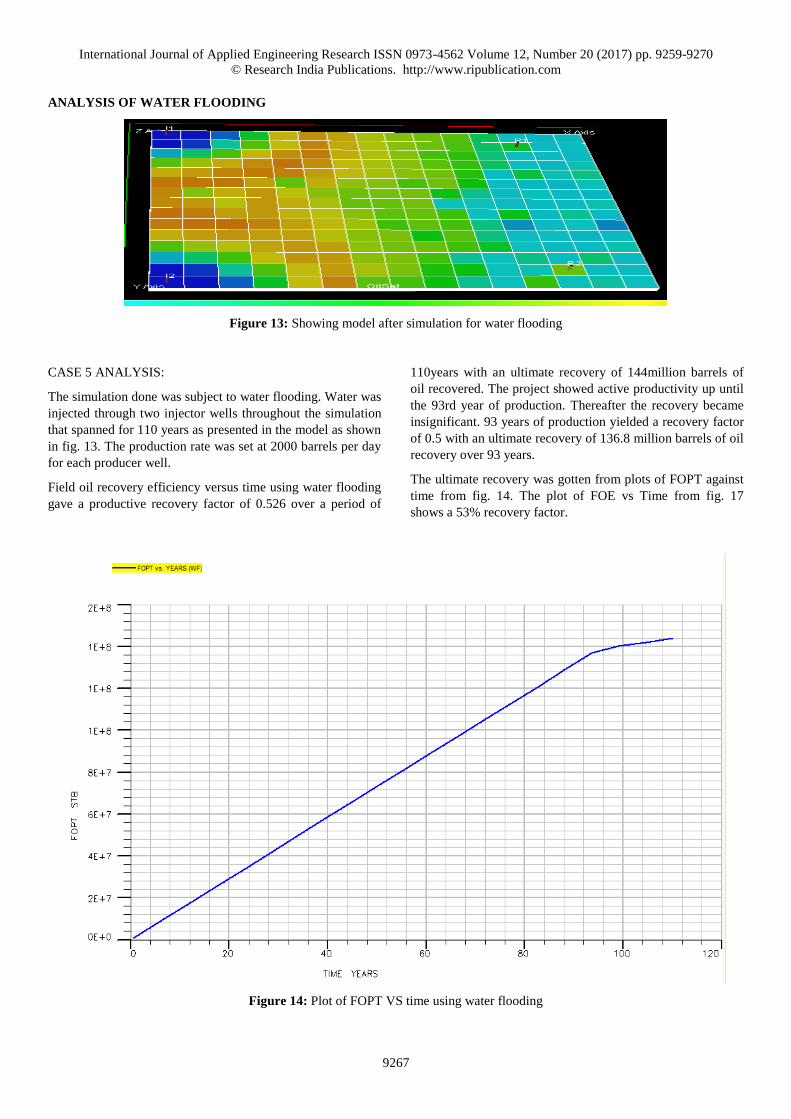
ANALYSIS OF WATER FLOODING
Figure 13: Showing model after simulation for water flooding
CASE 5 ANALYSIS:
The simulation done was subject to water flooding. Water was
injected through two injector wells throughout the simulation
that spanned for 110 years as presented in the model as shown
in fig. 13. The production rate was set at 2000 barrels per day
for each producer well.
Field oil recovery efficiency versus time using water flooding
gave a productive recovery factor of 0.526 over a period of
110years with an ultimate recovery of 144million barrels of
oil recovered. The project showed active productivity up until
the 93rd year of production. Thereafter the recovery became
insignificant. 93 years of production yielded a recovery factor
of 0.5 with an ultimate recovery of 136.8 million barrels of oil
recovery over 93 years.
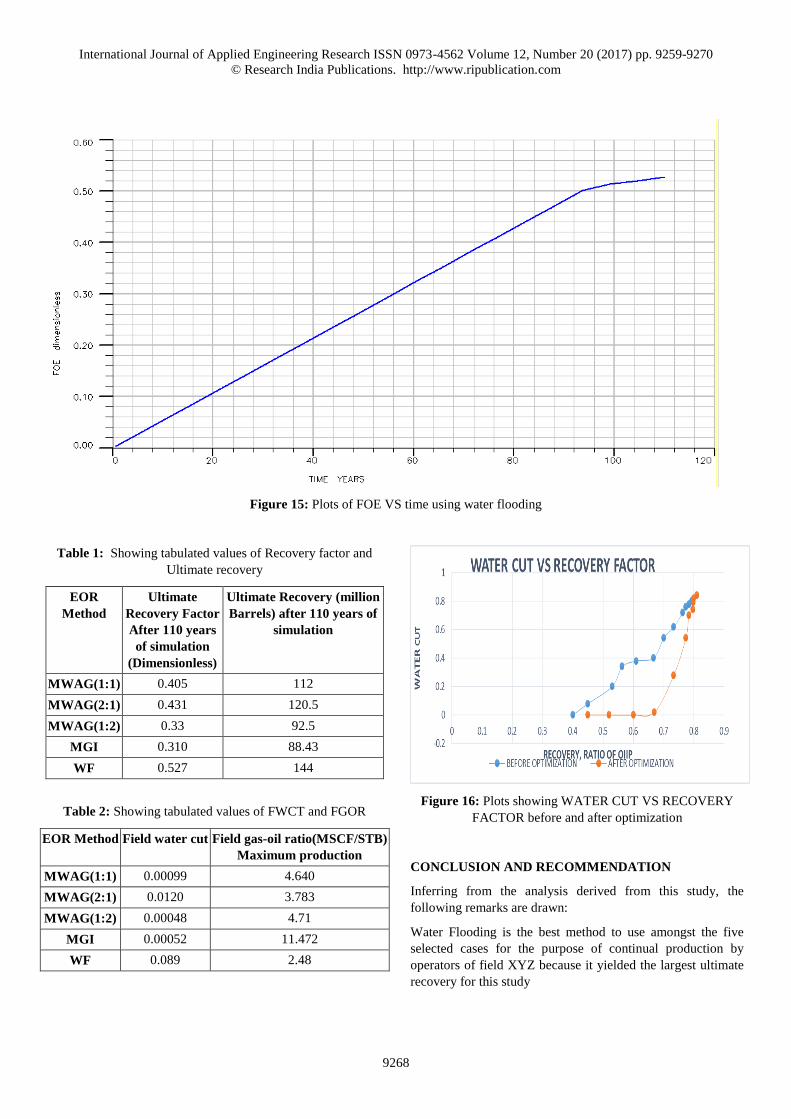
The ultimate recovery was gotten from plots of FOPT against
time from fig. 14. The plot of FOE vs Time from fig. 17
shows a 53% recovery factor.
Figure 14: Plot of FOPT VS time using water flooding
International Journal of Applied Engineering Research ISSN 0973-4562 Volume 12, Number 20 (2017) pp. 9259-9270
© Research India Publications. http://www.ripublication.com
9268
Figure 15: Plots of FOE VS time using water flooding
Table 1: Showing tabulated values of Recovery factor and
Ultimate recovery
EOR
Method
Ultimate
Recovery Factor
After 110 years
of simulation
(Dimensionless)
Ultimate Recovery (million
Barrels) after 110 years of
simulation
MWAG(1:1) 0.405 112
MWAG(2:1) 0.431 120.5
MWAG(1:2) 0.33 92.5
MGI 0.310 88.43
WF 0.527 144
Table 2: Showing tabulated values of FWCT and FGOR
EOR Method Field water cut Field gas-oil ratio(MSCF/STB)
Maximum production
MWAG(1:1) 0.00099 4.640
MWAG(2:1) 0.0120 3.783
MWAG(1:2) 0.00048 4.71
MGI 0.00052 11.472
WF 0.089 2.48
Figure 16: Plots showing WATER CUT VS RECOVERY
FACTOR before and after optimization
CONCLUSION AND RECOMMENDATION
Inferring from the analysis derived from this study, the
following remarks are drawn:
Water Flooding is the best method to use amongst the five
selected cases for the purpose of continual production by
operators of field XYZ because it yielded the largest ultimate
recovery for this study

International Journal of Applied Engineering Research ISSN 0973-4562 Volume 12, Number 20 (2017) pp. 9259-9270
© Research India Publications. http://www.ripublication.com
9269
Based on analysis, water flooding proves to be the most
economical of all selected five cases discussed earlier because
of the cheap nature and availability of the resource.
MWAG (1:2) may have been the best technique to control the
water breakthrough as the total field water cut was estimated
at yield of 0.00048 as compared to MWAG (1:1) values at
0.00099, MWAG (2:1) values at 0.0120, MGI values at 00052
and WF at 0.089
Ultimate recovery was optimized using water alternating gas
by comparing 3 different MWAG ratios. The results derived
from MWAG (1:1), MWAG (2:1) and MWAG (1:2) are 112,
120.5 and 92.5 million barrels of oil respectively which shows
that MWAG (2:1) has the highest ultimate recovery
RECOMMENDATION
Various scenarios of recovery techniques should be analysed
critically before oil companies embark on project solely to
attain the best mechanism that suits the reservoir as factors
such as heterogeneity varies in different fields.
The recommendation for the acquisition of accurate data
should be provided in EOR projects because this can either
make or break the results attained and misinterpretation of
data could lead to making wrong decisions which could cause
a reduction in the ultimate recovery after embarking on the
EOR techniques.
An economic analysis should be followed up after the
predictions of Ultimate recovery from various scenarios
performed as this will give a better insight as to which
technique would prove to be the cheapest and economical
technique in developing the field.
NOMENCLATURE
EOR: Enhanced oil recovery
FWCT: Field water cut
FOE: Field oil recovery efficiency
FOPT: Field oil production cumulative total
FGOR: Field gas oil ratio
HCPV: Hydrocarbon pore volume
IDE: Integrated development environment
IFT: Interfacial tension
IWAG: Immiscible water alternating gas
MMP: Minimum miscibility pressure
MWAG: Miscible water alternating gas
MGI: Miscible gas injection
NPV: Net present value
OOIP: Original oil in place
PV: Pore volume
RF: Recovery factor
WF: Water flooding
REFERENCES
[1] Alghareeb, Z. (2009). Proactive Optimization of Oil
Recovery in Multilateral wells using Real Time
Productin Data.
[2] Alhulthali, A. (2007). Optimal Waterflood
Management Using Rate Control. Reservoir
Evaluation & Engineering .
[3] Alhuthali, A. (2006). Optimal Waterflood
Management Using Rising Rate Control. SPE Annual
Tchnical Conference and Exhibition.
[4] Archer. (1986). Petroleum engineering principles
and practice. London: Graham and Trotman Ltd.
[5] Doghaish, N. (2009). Analysis of Enhanced Oil
Recovery- A Literature Review.
[6] Donaldson. (1989). Enhanced oil recovery, process
and operations. Amsterdan: Elsevier Science
Publishers B.V.
[7] E.Righi. (2004). Experimental Study of Tertiary
Immiscible WAG Injection.
[8] Elias, B. A., Muhammad, S. B., & Seah, C. L.
(2011). Application of Inflow Control Valves (ICV)
in the Water Injector Well. SPE 144406. Kuala
Lumpur: SPE.
[9] Esmaiel, T. (2005). Determination of Wag Ratios
and Slug Sizes Uncertainty in a smart well
environment.
[10] Hussain. (2013). An experimental study of improved
oilrecovery through fines-assisted waterflooding.
[11] Jadhawar P, S. H. (2012). Effect of well pattern and
injection well type on the CO2-assisted gravity
drainage enhanced oil recovery. Journal of
Petroleum Science and Engineering .
[12] Jansen, J. (2001). Contribution to Jaarboek of the
Mijnbouwkundige Vereeniging.
[13] Kulkarni. (2005). Experimental Investigation of
miscible and immiscible Water-Alternating-
Gas(WAG) process performance.
[14] Lyons. (2005). Standard handbook of petoleum and
natural gas engineering. Oxford Golf Professional
Pub.

International Journal of Applied Engineering Research ISSN 0973-4562 Volume 12, Number 20 (2017) pp. 9259-9270
© Research India Publications. http://www.ripublication.com
9270
[15] Mahli, Srivastava, J., & Laxminarayan. (2012).
Laboratory Investigation GS-5C sand of Gandhar
Field.
[16] Mathiassen, O. M. (2003). CO2 as injection gas for
Enhanced Oil Recovery and Estimation of the
Potential of the Norwegian Continental Shelf .
Trondheim.
[17] Mubarak, S., Naseem, D., & Salam, S. (2009).
Lesssons Learned from 100 Intelligent Wells
Equiped with Multiple Downhole Valves. SPE
126089. Aikhobar: SPE.
[18] Nezhad S, M. M. (2006). Experimental Study on
Applicability of Water Alternating CO2 injection in
the Secondary and Tertiary Recovery. First
International .
[19] Sampaio, M., Barreto, C. E., & Schiozer, D. J.
(2012). Comparism between conventional and
Intelligent Wells with Reactive and Proactive
Controls Under Economic Uncertainty. SPE 155657.
Doha: SPE.
[20] Speight, J. (2009). Enhanced recovery method for
heavy oil and tar sands.
[21] Stenby et al. (2001). Review of WAG Field
Experience.
[22] Zeron, L. (2012). Introduction to Enhanced Oil
Recovery (EOR) Processes and Bioremediation of
Contaminated Sites.