evaluation of chemical and electric flares
TRANSCRIPT
1
Evaluation of Chemical and Electric Flares
A report to the National Institute of Justice
CHARLIE MESLOH, Ph.D. Associate Professor, Florida Gulf Coast University MARK HENYCH, Ph.D. Senior Researcher, Weapons and Equipment Research Institute ROSS WOLF, Ed.D. Assistant Professor, University of Central Florida KOMAAL COLLIE, B.S. Research Assistant, Florida Gulf Coast University BRANDON WARGO, M.S. Research Assistant, Florida Gulf Coast University CHRIS BERRY, M.S. Research Assistant, Florida Gulf Coast University
June 12, 2008
The project was supported by Award No. 2006-IJ-CX-008, by the National Institute of Justice, Office of Justice Programs, United States Department of Justice. The opinions, finding, and conclusions or recommendations expressed in this publication are those of the author and do
not necessarily reflect the views of the Department of Justice.
2
TABLE OF CONTENTS
TABLE OF FIGURES ........................................................................................... 4
TABLE OF TABLES ............................................................................................. 4
DISCLAIMER ....................................................................................................... 5
ACKNOWLEDGEMENTS .................................................................................... 5
EXECUTIVE SUMMARY ...................................................................................... 6
THE NATURE OF THE PROBLEM ...................................................................... 7
LITERATURE REVIEW ........................................................................................ 7
Health and Environmental Consequences ........................................................ 8
Driver and Pedestrian Safety .......................................................................... 11
Alternatives to Combustion Based Flares ....................................................... 13
Vehicle Stopping Distance .............................................................................. 15
METHODOLOGY ............................................................................................... 17
Data Collection, Measurement and Analysis ................................................... 17
Research Team Training ................................................................................. 17
9-Point Visibility Scale (Primary Data Collection Measure) ............................. 18
Field Data Collection ....................................................................................... 18
Technologies Evaluated .................................................................................. 19
Orion® Road Flares ..................................................................................... 19
PowerFlare® ................................................................................................ 20
Cyalume® Lightsticks .................................................................................. 21
TurboFlare™ ................................................................................................ 22
Tektite® ELZ™ ............................................................................................ 22
Galls®36” Reflective Traffic Cones .............................................................. 23
Traffic Safety Store™ 28” Collapsible Cones .............................................. 24
ProFlare™ ................................................................................................... 24
Flare Alert™ Beacon Pro ............................................................................. 25
PDK Technologies Inc™, LiteFlare® ........................................................... 26
Additional Technologies Examined ................................................................. 26
Personal Utility Lights .................................................................................. 26
Retro-reflective Clothing .............................................................................. 27
3
GENERAL FINDINGS ........................................................................................ 28
Cost ................................................................................................................. 28
Durability ......................................................................................................... 29
Portability/Ease of Deployment ....................................................................... 29
Factors Affecting Performance ........................................................................ 30
Flare and Cone Combinations ......................................................................... 35
Complimentary Technologies .......................................................................... 37
Establishing a Temporary Traffic Control Zone ............................................... 38
Taper Zone Configuration ............................................................................... 40
CONCLUSIONS ................................................................................................. 42
REFERENCES ................................................................................................... 46
4
TABLE OF FIGURES
Figure 1. Visibility Scale ..................................................................................... 19
Figure 2. Orion® Road Flare .............................................................................. 20
Figure 3. PowerFlare® ....................................................................................... 21
Figure 4. Cyalume® Lightstick ........................................................................... 21
Figure 5. TurboFlare™ ....................................................................................... 22
Figure 6. Tektite® ELZ™ Traffic Safety Strobe .................................................. 23
Figure 7. Galls® 36” Reflective Traffic Cones .................................................... 23
Figure 8. Traffic Safety Store™ 28” Collapsible Cones ...................................... 24
Figure 9. ProFlare™ ......................................................................................... 25
Figure 10. Flare Alert™ Beacon Pro .................................................................. 25
Figure 11. PDK Technologies Inc™, LiteFlare® ................................................ 26
Figure 12. CEJAY GloWand and Krill® Lights ................................................... 27
Figure 13. 5.11 Tactical Series® ANSI III Jackets ............................................. 28
Figure 14. Ground Based Flare Visibility Testing ............................................... 31
Figure 15. Elevation Based Flare Visibility Testing ............................................ 33
Figure 16. Flares Deployed on Cones ............................................................... 35
Figure 17. Multiple Configurations Tested ........................................................ 36
Figure 18. Taper Zone Diagram ......................................................................... 41
TABLE OF TABLES Table 1. Ground and Elevation Testing Comparison ......................................... 34
Table 2. Complimentary Technologies ............................................................... 37

5
DISCLAIMER
While every effort has been made to ensure the accuracy of the
information contained in this report, any errors of commission or omission are
solely the responsibility of the research team. The research team shall not be
liable for any damages or injury caused by errors, inaccuracies, omissions, or
other defects in the content or any of the products tested, or referred. The
researchers shall not be liable for any third-party claims or losses of any nature,
including but not limited to, any claims or losses relating to any product referred
to at any time in the content of this report. The researchers do not intend for
references to corporations, products, or entities to be endorsements of such, and
the researchers are not affiliated with, sponsored by, or endorsed by any
consumer product in this report.
ACKNOWLEDGEMENTS
Special appreciation is to the graduate research team at Florida Gulf
Coast University, who participated in this study, including: Elliot Glass, Alvin
Cassner, Tiffany Terns, Clarence James, Laura Gibson, and Jennifer Medrano.
6
EXECUTIVE SUMMARY
Traditional magnesium highway flares create substantial risks to both the
officer and the surrounding area. In addition to these immediate risks, long-term
environmental impacts on soil and water have been identified in previous
research studies. As a result, this study identified and examined alternative
highway flare systems utilizing chemical or electric sources of energy to
determine their suitability and visibility.
A methodology utilizing a standardized visibility measure was designed to
compare the different flares and related traffic control devices. The flares and
related traffic control devices were tested in scenarios across a range of distance
intervals up to and including one mile. Scenarios were developed and
established based upon driver reaction and stopping distance times.
The findings suggest that the traditional highway flare, despite its inherent
risks, was found to be highly visible and scored well during testing in all
scenarios. The chemical and electric flares tested were less visible than the
highway flare when deployed at ground level. In some cases, minor depressions
in the road surface were found to completely obscure the flare’s visibility.
However, when the same chemical and electric flares were elevated to a 36-inch
height above the ground, their visibility scores increased dramatically and they
were all visible at a distance of one mile.
Scenario testing found that the most effective and visible cone and flare
combinations were those that were basic in design. Complex configurations
using multiple flare types caused driver confusion and directional disorientation.
7
THE NATURE OF THE PROBLEM
Traditionally, law enforcement has utilized magnesium-based highway
flares to identify accident locations and construction sites. These devices burn at
high temperatures and create substantial risk of igniting combustible material or
causing injury to the officer. These flares normally burn from 15 to 30 minutes,
after which the officer is left to dispose of a hot, melted fusee. Many agencies do
not address the disposal of these flare remnants in policy. Our focus group found
that officers frequently kick them to the side of the road, leaving sharp metal
spikes to create a future road hazard.
Other problems with traditional highway flares are the potential
environment impact they have on soil and water. As identified in the literature,
the byproducts of burning flares have the potential to poison a water supply. In
addition, the effects of perchlorates on the human body are detrimental,
especially in pregnant women.
LITERATURE REVIEW
Standard road flares have been a key component of traffic control for
decades. Law enforcement officers, construction workers, and stranded
motorists have utilized road flares to warn others of potential road hazards. This
literature review serves to present a brief background on the use of various
portable traffic control devices, theories associated with their use, and specific
environmental concerns that may arise from their deployment.
8
Health and Environmental Consequences
For this research study, a variety of literature was reviewed in an effort to
determine the characteristics of standard highway traffic flares. A vast majority of
the literature indicated numerous hazardous characteristics associated with the
traditional magnesium flare. These characteristics include a number of harmful
environmental toxins and a high risk of personal injury to the person deploying
the traffic flare.
The traditional magnesium highway flare has been noted to generate
noxious smoke and fumes that can overwhelm the user, while the burning end of
the flare can cause serious burns caused by the molten magnesium. It has also
been documented that many of the elements that compose a traffic flare are
detrimental and cause serious health problems. A key chemical component,
strontium nitrate, which produces the flare’s color, causes irritation to the skin,
eyes, and mucous membranes (NIOSH, 2003).
Another highway flare component, potassium perchlorate similarly irritates
the skin, eyes, and mucous membranes. Furthermore, absorption of the
perchlorates can cause methemoglobinemia, which decreases the ability of the
thyroid to process iodine and causes kidney injury (NIOSH, 2003). Current
studies by the New Jersey Department of Health and Senior Services (NJDOH)
have shown that exposure to potassium perchlorate caused various reproductive
effects and gastroenteritis in laboratory test animals (NJDOH, 2004).
The literature has also identified several significant environmental impacts
from discarding spent highway flares. According to Silva (2003), in addition to
9
fire hazards, traditional highway flares may create a threat to water quality as the
perchlorates dissolve into the water supply. Silva (2003) also cites the Santa
Clara Valley Water District, which measured the leachability of perchlorate from
highway/emergency safety flares (fusee) in water” (p. 4). The Santa Clara Valley
Water District concluded that:
1) Incendiary flares can be a significant source of perchlorate
contamination to both surface and groundwater.
2) Unburned flares improperly disposed of can contaminate water with
perchlorate up to 2,000 times more than completely burnt flares.
Lavdas (1995) found that localized radiation fogs produced by the burning
of highway flares posed greater hazards than widespread advection fogs (which
occurs when moist air passes or is blown over a cool surface). The author
concluded that this was due to the fact that drivers were able to adjust more
easily to widespread fog, but were less successful when very low visibility
situations were suddenly encountered.
Not only do highway flares produce a hazardous, visible smoke, a study
conducted by the Rhode Island Department of Health (RIDoH) under the
Unregulated Contaminant Monitoring Rule (UCMR) looked to assess the risk of
perchlorate poisoning in drinking water (Veeger & Boving, 2004). The research
found that, “240,000 gallons of water could be contaminated to a level of 4µ/L, by
discarding a single flare in the water source” (Pp. 1).
10
Other unintended consequences include the unplanned ignition of the
flares at inappropriate times. As a result of several trunk fires in officer’s cars, a
collaborative study was conducted to investigate this phenomenon (Corey,
Powell, Quesnel, Windsor & Yanez, 2003). The Tucson Arizona Police
Department’s Crime Lab, Arson Detective Unit, in conjunction with the Tucson
Fire Department Fire Investigators conducted several experiments in an attempt
to discern the reason for these trunk fires. It was concluded that under the right
set of circumstances, flares might be unintentionally ignited in officer’s cars. To
alleviate this problem, a city-wide memo was issued addressing this situation in
which they state:
“To minimize the risk of inadvertent flare ignition, which could result
in a trunk fire, flares should never be readied or prepared in
advance, anticipating need. Igniter and striker caps must remain
intact, on the flare, until the flare is needed. Flares should be kept
in their original box or placed in a container, preventing migration
and minimizing movement” (Corey, Powell, Quesnel, Windsor, &
Yanez, 2003: Pp. 27).
According to the National Institute for Occupational Safety and
Health (NIOSH) International Chemical Safety Cards (2003), all of the
elements present in these flares should be stored in tightly closed
containers in a cool, dry place. Additionally, it is advised that the storage
11
area be well ventilated and encourages users to wash their face and
hands thoroughly before handling food (NIOSH, 2003).
Highway flare research is not limited to the United States; law
enforcement agencies from other countries have conducted research on
alternative flare technology. According to a technical memorandum by the
Canadian Police Research Centre, alternatives to highway flares were examined
due to their inherent problems which include:
1. They are not environmentally safe.
2. They pose an extreme hazard at oil gas spills.
3. They can damage/burn uniforms and equipment.
4. The spike remnants must be picked up after every burn.
5. The striker and cap must be disposed of after use.
6. They are difficult to extinguish after each burn.
7. The fumes are offensive and noxious.
8. A case of flares is heavy to handle and hard to store.
9. The brilliance at night is a hazard to passing motorists often distracting
on-coming drivers (Hickman, 1992).
Driver and Pedestrian Safety
Any research into highway flare alternatives needs to examine factors of
visual conspicuity, duration, and clarity as variables which enhance a flare’s
ability to be seen and recognized. In considering alternatives to traditional
highway flares, issues including disorienting or blinding effects, perception of light
12
signals, and the design of light signals are all factors that must be considered.
These concerns stem from theories associated with light and a person’s
biological response to it.
According to Hickman (1992), the brilliance of the flares at night may
distract on-coming motorists. An additional study published in the Annals of
Emergency Medicine theorized that most of the ineffectiveness associated with
light devices, is due to blinding or disorienting affects (De Lorenzo & Eilers,
1991). This study presented two major conclusions; a combination of different
colored lights (white, amber, green) with red warning lights are more effective
than red lights alone and that there was no evidence that flashing emergency
signal lights caused seizures.
A study performed by the Department of Scientific and Industrial Research
in Middlesex, England examined the effect of mixing flashing and steady lights
together as they correspond to reaction times. Their research illustrated that
having a flashing signal on or against a background of steady light yields the
fastest response time. The positive effect of short reaction time diminishes with
each addition of irrelevant flashing light (Crawford, 1963).
The “Moth Effect” represents the driver’s tendency to steer into the
direction of their fixation (Chatziastros, 2003), or toward emergency vehicles
parked on the roadside (Younger, 1997). In 1974, a study published in the
Journal of Illuminating Engineering Society found that humans tend to innately
orient to light (Taylor, 1974). The orientation of drivers to the light source causes
them to not only veer towards that point but to align themselves with the source.
13
This effect causes the driver to believe that they are driving straight when they
are not, which clearly can have serious consequences for safety.
A study conducted by Lieutenant Wells of the Florida Highway Patrol
(2005) tested a bi-colored light bar that was mounted on the roof of a cruiser in
an effort to make the police vehicle more visible during day and nighttime traffic
stops. The combination of red and blue lights on the light bar provided the
greatest illumination. Additionally, it was noted that having the light pattern
broken, which provided random flash patterns, made the cruiser more visible and
thereby gained the attention of the test subjects more easily. The FHP study
found that this randomization of the light patterns did not alter the depth
perception of oncoming drivers.
Alternatives to Combustion Based Flares
Emerging technologies utilizing chemical and electric lighting systems may
offer promise in reducing many of the issues associated with traditional
combustion based highway flares. A vast majority of the new generation flares
are reusable and offer hundreds of hours of operation. Many of these models do
not produce heat, potentially reducing fire hazards and may be more cost
efficient over a several year life-cycle.
Some of the modern electronic flare devices have different color lens
options and may offer solutions that are applicable to changing situations or
environments. In addition, as supported by the literature, the physics of light and
wave dynamics dictates that colors such as green, blue and white are more
14
visible at greater distances due to their higher wavelengths. These findings were
also supported by Allen et al (1997), which found green as the most visible color
on highway scenes. Despite this greater visibility, this color is not immediately
recognized by drivers as a signal to proceed with caution.
Technology such as chemical illumination sticks (light-sticks and
electralume attractors) were considered as a potential technology for
implementation as it’s documented utility in other fields has been shown to be
high (Hazina et al, 2005). This technology was included in this research as its
cost-per-use and high visibility may offer a cost effective solution to traditional
highway flares.
The illumination (chemical) sticks applicability as a location designator has
been used as an important part of mine rescue due to the inherent dangers of
igniting gases in an underground environment. According to Conti, Chasko, &
Cool’s (1991) study of mine rescue team members, 73% identified green
chemical light sticks as the most dominant color seen compared to other colors
including red, clear, and yellow. According to Conti et al (1991), they also
examined the use of different color strobe lights in a simulated smoke filled
mining environment to evaluate their effectiveness. In mine rescue team
simulations, five strobe light colors (red, green, blue, amber, and clear) were
evaluated by 271 miners. Again, the most visible strobe color was the green
light, which could be seen by the largest proportion of persons tested.
Collapsible triangles have also become common in agencies as a
replacement for highway flares. A study conducted by the Indiana University
15
Division of Optometry examined the use of collapsible triangles and highway
flares on traffic patterns and behavior on a 10-mile driving course (Allen, Miller, &
Short 1971). They concluded that in the daytime, a triangle, a triangle plus a
flag, and a road flare were all seen equally well on an open highway. However,
during nighttime driving conditions the use of the highway flare added 6 seconds
of advanced warning to the drivers. For a vehicle that is traveling at 40 mph,
flares were visible for 13.66 seconds, while the triangle was only visible for 7.07
seconds. The illumination provided by the highway flare was found to be
superior in both slowing traffic and detection.
Vehicle Stopping Distance
The stopping distance of a vehicle is determined by three factors:
perception time of driver, reaction time of driver, and braking capability of the
vehicle. The perception time (0.25 - 0.50 seconds) is how long it takes for the
driver to observe a hazard and realize that some action is required. The driver’s
reaction time (0.25 - 0.75 seconds) is how long it takes for the driver to begin
applying the brakes, changing direction, or taking some other action once a
threat has been identified.
The braking capability is based on speed of the vehicle and friction of the
road surface. A number of stopping distance calculators are available which
allow crash investigators to insert these factors into a formula to produce a
minimum stopping distance under a given set of circumstances. However, the
condition of the roadway, wear of the tires and even the type of brakes on the
16
vehicle, greatly impact the friction coefficient and ultimately the accuracy of any
one given calculation.
Additional human factors, such as fatigue, poor eyesight, and drug/alcohol
impairment, may substantially impact the perception of a hazard and
consequently increase the overall vehicle stopping distance. As a result, a 2
second reaction time is not unusual. Therefore, a vehicle traveling at 45 mph will
travel 132 feet during the reactionary period prior to braking. If that same driver
is traveling 70 mph, the vehicle will travel 205 feet during the reactionary period
and an additional 245 feet during braking. Therefore, a total of 450 feet may be
required for an average vehicle on a highway to come to a complete stop.
Consequently, it is imperative that emergency equipment is visible from the
greatest distance possible to allow a driver sufficient time to identify a hazard and
act accordingly.
The University of Michigan Transportation Research Institute examined
the detection distance for pedestrians near a work zone. The stopping distances
established by the study were 125 feet (for normal clothing) and 891 feet (for
retro-reflective clothing) (Sivak, 1984).
These factors and the others identified in the literature were considered in
the design and overall methodology used in this project. Additionally, this
research based itself in a grounded approach and allowed the researchers the
opportunity to modify scenarios and various conditions for the flare testing. An
empirical foundation based upon other social science principals were utilized in

17
data collection and subsequent reporting. The following section addresses the
methodology utilized in the design and data collection of this evaluation.
METHODOLOGY
Data Collection, Measurement and Analysis
To collect the data, researchers developed a data collection instrument
that captured the relevant variables. This instrument was the result of extensive
field-testing, experimentation and data coder training. The data collection
instrument consisted of data code sheets designed to capture the relative
visibility scores of each flare system at different distance intervals.
Research Team Training
Prior to the onset of data collection, the researchers briefed and trained a
research team of participant/observers. This team consisted of eight research
assistants at Florida Gulf Coast University and was integral to the modified
Delphi approach used to collect data.
The principal investigators conducted approximately 42 hours of training
with the team, covering the data collection methodology and the modified Delphi
method. The research team training was conducted over a time frame of
approximately seven weeks. During this time, the principal investigators and the
research team met for intervals of approximately three hours twice per week.
18
9-Point Visibility Scale (Primary Data Collection Measure)
To measure visibility of the flare systems, a 9-point scaled measure was
developed for this project, which became the primary data collection variable.
Utilizing a segment of roadway, a standardized distance of 100 yards was used
to score the flare systems from least visible (scored as a 1) to most visible
(scored as a 9). A score of 0 indicated that it was not visible. A traditional
highway flare was initially assigned a score of 9.
In order to remove as much subjectivity or individual perspective bias as
possible, a modified Delphi approach was utilized in the formation of the scale.
During the initial scale creation, the researchers arrived at consensus in
determining which flare systems were the most and least visible. These levels of
visibility formed the foundation of the scale anchors (least and most visible). A 9-
point scale was selected as opposed to smaller scales, as this allowed for a
greater range of variance in responses.
Field Data Collection
To capture the data, flare systems were placed in the selected
environments at predetermined distances. The research team viewed each of
the flare systems and scored the visibility of each device. Once researchers had
examined each flare system and scored it individually, the scores were
compared, and a consensus score was determined. In this manner, the
researchers adapted the Delphi approach for the data collection. The
intermediate measures are not necessarily equidistant and as such has interval
19
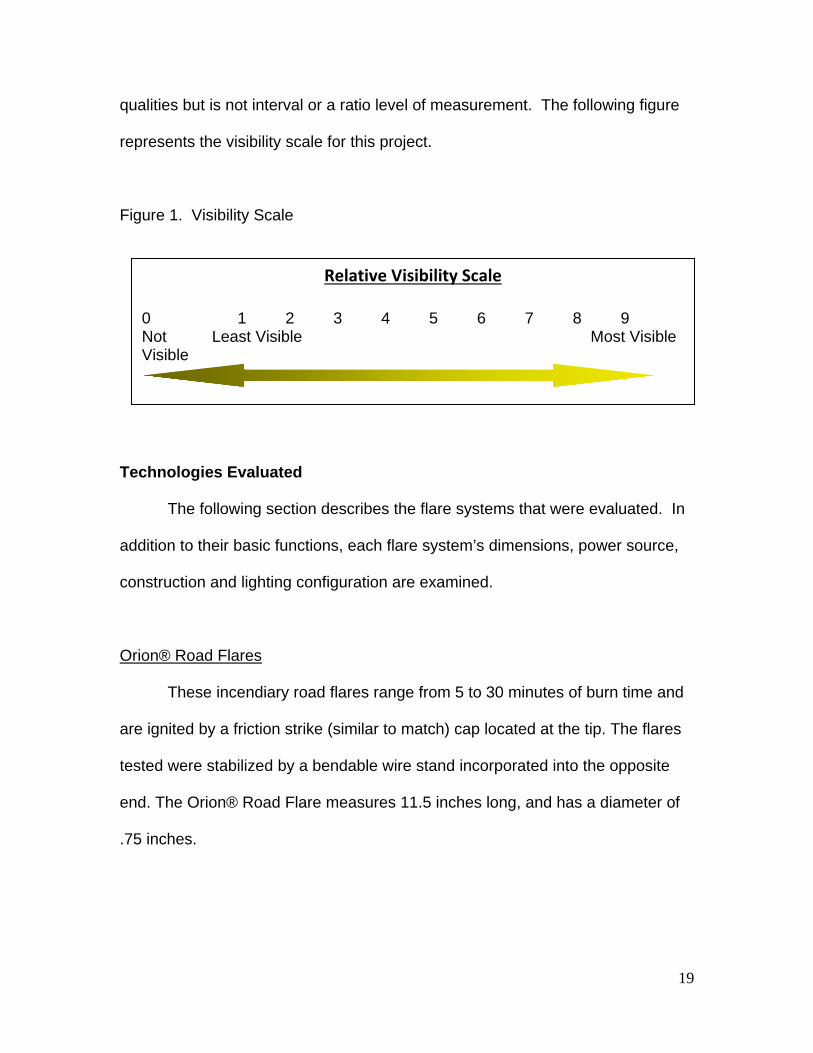
qualities but is not interval or a ratio level of measurement. The following figure
represents the visibility scale for this project.
Figure 1. Visibility Scale
Technologies Evaluated
The following section describes the flare systems that were evaluated. In
addition to their basic functions, each flare system’s dimensions, power source,
construction and lighting configuration are examined.
Orion® Road Flares
These incendiary road flares range from 5 to 30 minutes of burn time and
are ignited by a friction strike (similar to match) cap located at the tip. The flares
tested were stabilized by a bendable wire stand incorporated into the opposite
end. The Orion® Road Flare measures 11.5 inches long, and has a diameter of
.75 inches.
Relative Visibility Scale 0 1 2 3 4 5 6 7 8 9 Not Least Visible Most Visible Visible

20
Figure 2. Orion® Road Flare
PowerFlare®
Advertised as waterproof, these are puck-shaped light devices with a 360°
arrangement of L.E.D.’s around the circumference that are powered by CR123
lithium batteries. The whole unit is housed in a polymer outer shell with an
attached lanyard loop. The PowerFlare® measures 1.25 inches high and 4.25
inches in diameter. It is also available in a rechargeable package that will hold six
units at a time and can be connected to a car cigarette lighter. The power button
doubles as a light pattern selection switch. Each time the button is pressed, it will
cycle to the next light pattern. There are a total of 9 available pattern settings.
The units are available in one of six colors: red, amber (yellow), blue, green,
white and infrared. PowerFlare’s® have an advertised 100 hour runtime per
charge or single battery. A carrying bag is also available to carry PowerFlares® .

21
Figure 3. PowerFlare®
Cyalume® Lightsticks
Cyalume® lightsticks are chemical luminescent tubes. They are
illuminated by the mixing of two chemical ingredients separated by a breakable
vial. To activate, the tube is bent to the point where the inner vial containing
Hydrogen Peroxide is cracked, introducing it to the outer chemicals which are a
mixture of dye and Cyalume. The unit is shook until the contents are completely
mixed and full illumination is reached. Once optimum illumination is reached, the
light’s brightness will begin to decay. No heat is generated in the mixture of the
chemicals. The Cyalume® lightsticks tested have measurements of 6 inches
long and weigh approximately 1 ounce. They have an advertised run time of 30
minutes for the standard intensity and 5 minutes for the high intensity lightsticks.
They are waterproof, disposable, typically individually wrapped, and come in a
variety of lengths and colors.
Figure 4. Cyalume® Lightstick
22
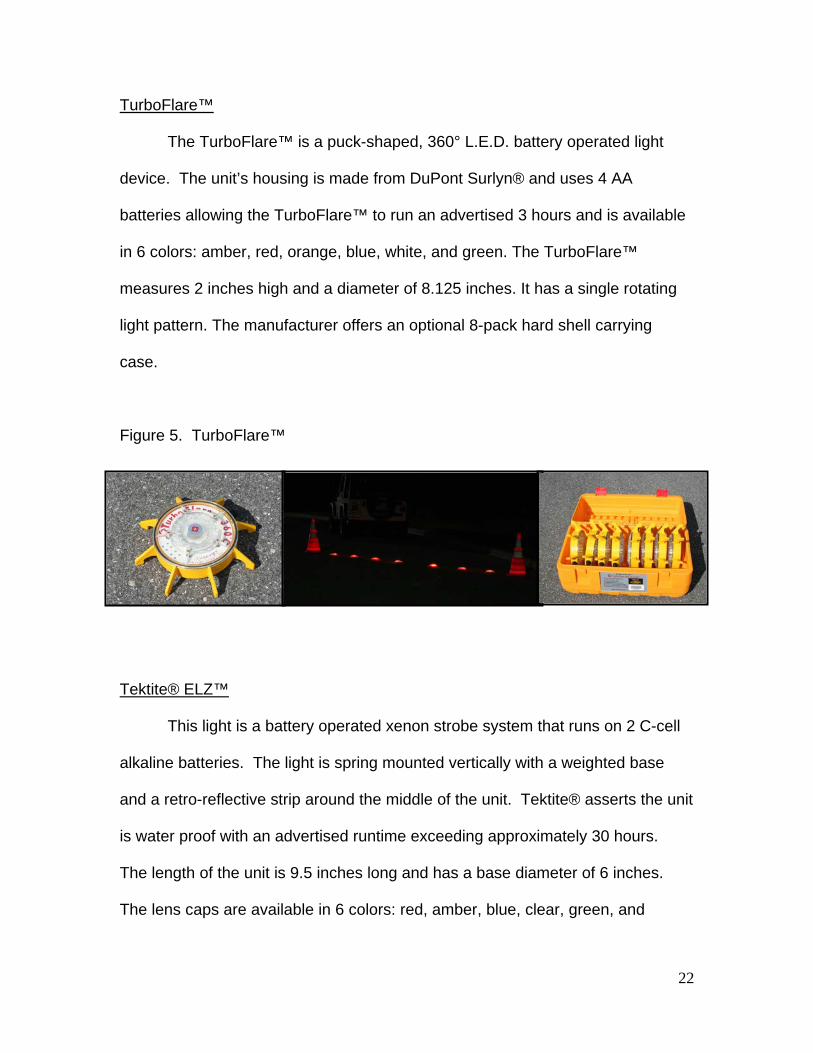
TurboFlare™
The TurboFlare™ is a puck-shaped, 360° L.E.D. battery operated light
device. The unit’s housing is made from DuPont Surlyn® and uses 4 AA
batteries allowing the TurboFlare™ to run an advertised 3 hours and is available
in 6 colors: amber, red, orange, blue, white, and green. The TurboFlare™
measures 2 inches high and a diameter of 8.125 inches. It has a single rotating
light pattern. The manufacturer offers an optional 8-pack hard shell carrying
case.
Figure 5. TurboFlare™
Tektite® ELZ™
This light is a battery operated xenon strobe system that runs on 2 C-cell
alkaline batteries. The light is spring mounted vertically with a weighted base
and a retro-reflective strip around the middle of the unit. Tektite® asserts the unit
is water proof with an advertised runtime exceeding approximately 30 hours.
The length of the unit is 9.5 inches long and has a base diameter of 6 inches.
The lens caps are available in 6 colors: red, amber, blue, clear, green, and
23
infrared. The manufacturer also offers an optional Pelican™ carrying case for
the strobes.
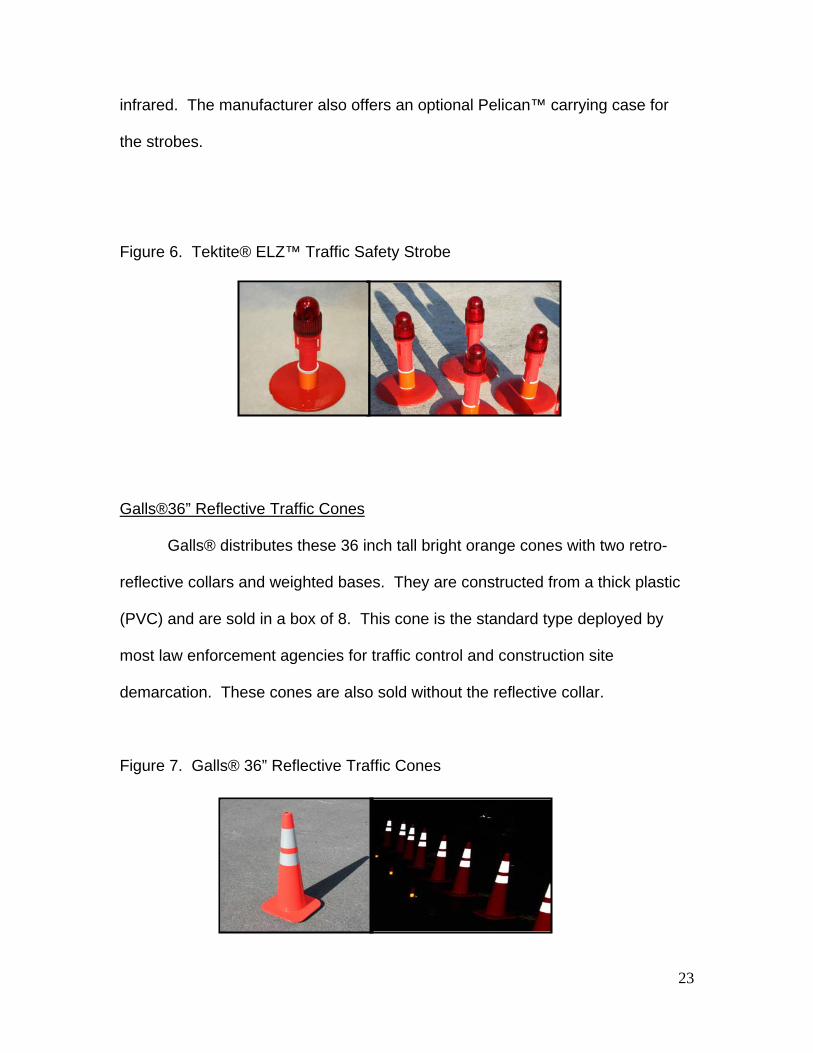
Figure 6. Tektite® ELZ™ Traffic Safety Strobe
Galls®36” Reflective Traffic Cones
Galls® distributes these 36 inch tall bright orange cones with two retro-
reflective collars and weighted bases. They are constructed from a thick plastic
(PVC) and are sold in a box of 8. This cone is the standard type deployed by
most law enforcement agencies for traffic control and construction site
demarcation. These cones are also sold without the reflective collar.
Figure 7. Galls® 36” Reflective Traffic Cones

24
Traffic Safety Store™ 28” Collapsible Cones
These cones are 28 inches tall, bright orange in color, and have two retro-
reflective collars. The bases have rubber feet and an internal battery-operated
light which operates for an advertised run time of 30 hours. The Traffic Safety
Store cones have a small switch on the base which cycles between the two
modes of function: flashing or steady. Each set is distributed with 4 cones and a
nylon-carrying bag.
Figure 8. Traffic Safety Store™ 28” Collapsible Cones
ProFlare™
The ProFlare™ is a disk shaped, battery operated light that has three light
settings: rotary, steady on, and flashing. The ProFlare™ has a diameter of 3.5
inches and a thickness of less than 1 inch without the accessories attached to
the back of the unit. A standard unit is distributed with a variety of mounting
options for the device which include: belt clip, magnet, a 45° or 90° stand, Velcro
armband, suction cup and holes for hardware mounting. The unit has three
different patterns of operation which include flashing, steady on, or rotary. It
requires 4 AAA batteries and has an advertised runtime of 100 hours depending

25
on the unit’s settings. ProFlare™ offers a carrying bag that includes all of the
hardware mentioned about and four units.
Figure 9. ProFlare™
Flare Alert™ Beacon Pro
Advertised as being waterproof, this light has a hard plastic housing with a
red lens. The Beacon Pro has a diameter of 3.75 inches and is 1.75 inches thick.
The kit is sold as: 8 electronic flares, 8 metal stake mounting plates with
removable weighted metal bases and a nylon carrying bag. The unit has two
patterns of operation: flashing or steady. The Beacon Pro requires 4 AA
batteries and has an advertised runtime of 30 hours depending on flash settings.
Figure 10. Flare Alert™ Beacon Pro
26
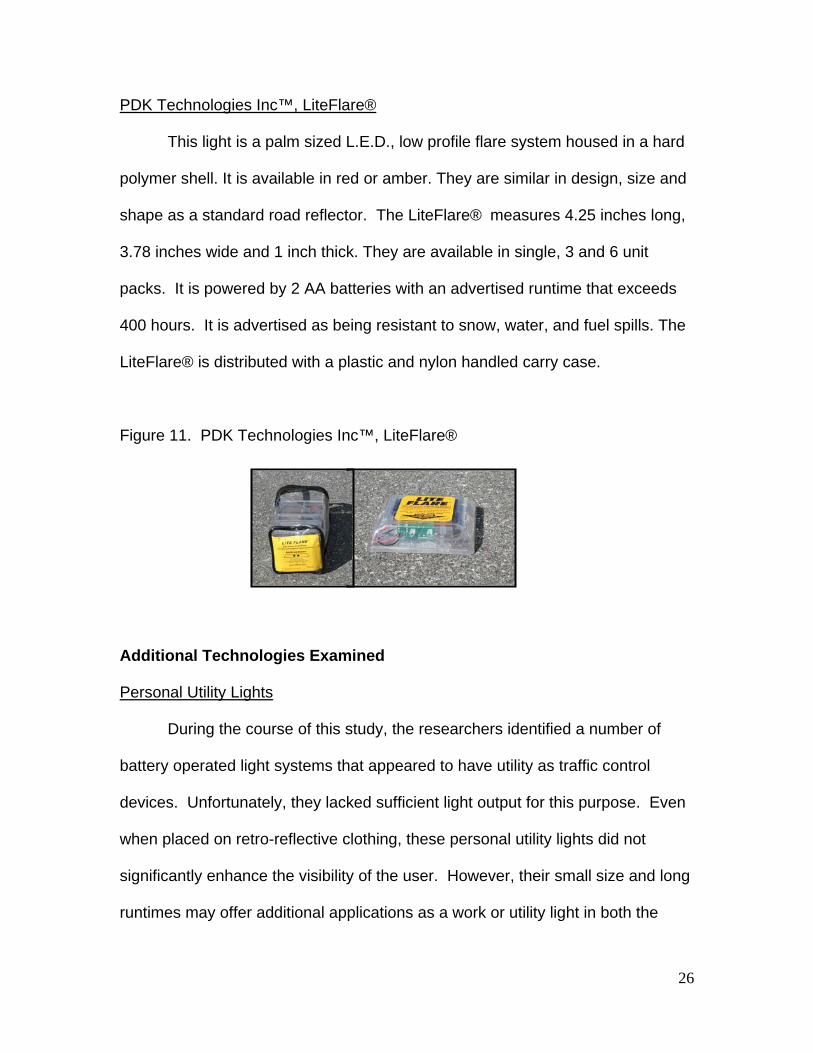
PDK Technologies Inc™, LiteFlare®
This light is a palm sized L.E.D., low profile flare system housed in a hard
polymer shell. It is available in red or amber. They are similar in design, size and
shape as a standard road reflector. The LiteFlare® measures 4.25 inches long,
3.78 inches wide and 1 inch thick. They are available in single, 3 and 6 unit
packs. It is powered by 2 AA batteries with an advertised runtime that exceeds
400 hours. It is advertised as being resistant to snow, water, and fuel spills. The
LiteFlare® is distributed with a plastic and nylon handled carry case.
Figure 11. PDK Technologies Inc™, LiteFlare®
Additional Technologies Examined Personal Utility Lights
During the course of this study, the researchers identified a number of
battery operated light systems that appeared to have utility as traffic control
devices. Unfortunately, they lacked sufficient light output for this purpose. Even
when placed on retro-reflective clothing, these personal utility lights did not
significantly enhance the visibility of the user. However, their small size and long
runtimes may offer additional applications as a work or utility light in both the
27
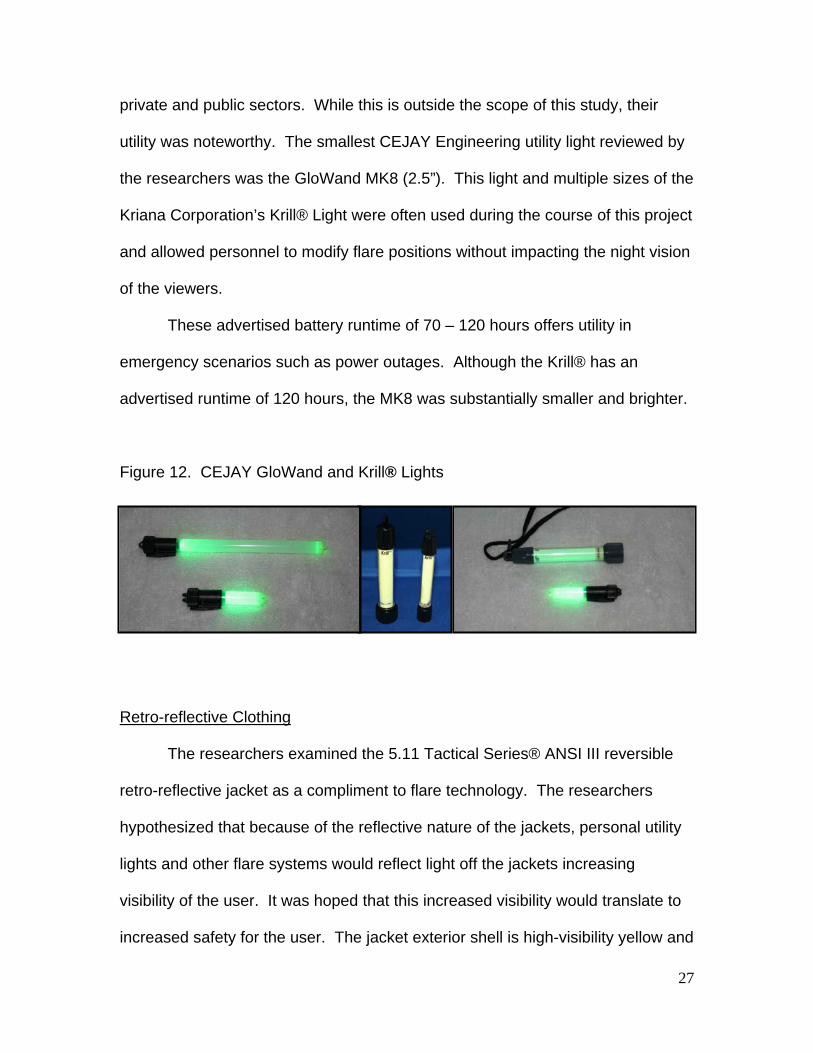
private and public sectors. While this is outside the scope of this study, their
utility was noteworthy. The smallest CEJAY Engineering utility light reviewed by
the researchers was the GloWand MK8 (2.5”). This light and multiple sizes of the
Kriana Corporation’s Krill® Light were often used during the course of this project
and allowed personnel to modify flare positions without impacting the night vision
of the viewers.
These advertised battery runtime of 70 – 120 hours offers utility in
emergency scenarios such as power outages. Although the Krill® has an
advertised runtime of 120 hours, the MK8 was substantially smaller and brighter.
Figure 12. CEJAY GloWand and Krill® Lights
Retro-reflective Clothing
The researchers examined the 5.11 Tactical Series® ANSI III reversible
retro-reflective jacket as a compliment to flare technology. The researchers
hypothesized that because of the reflective nature of the jackets, personal utility
lights and other flare systems would reflect light off the jackets increasing
visibility of the user. It was hoped that this increased visibility would translate to
increased safety for the user. The jacket exterior shell is high-visibility yellow and

28
incorporates 3M Scotchlite™ reflective tape. Class III garments are generally
designed for traffic conditions in excess of 50 mph.
Figure 13. 5.11 Tactical Series® ANSI III Jackets
GENERAL FINDINGS
The various costs, operating times, and portability are all variables to be
considered when purchasing traffic control devices. This section addresses
these variables and factors affecting performance. Additionally, the visibility
scores of the flare systems are illustrated below in both chart and table form.
Cost
The purchase cost of the different systems ranged drastically. When
purchasing technology as part of a set versus purchasing individual units, the
pricing changed considerably. The overwhelming majority of systems utilize off-
the-shelf disposable batteries as a power source. The yearly cost of operation is
29
determined by the cost of the batteries, the runtime, and the number of battery
replacements over that time period. The PowerFlare® system was the only
rechargeable technology (at the time of testing), which negated the need to
purchase replacement batteries.
Durability
All of the flare systems were subjected to a substantial amount of wear
and tear. With the exception of ProFlare™, no failures were noted in any of the
products. During the course of the study, five separate ProFlare™ units ceased
functioning; two units failed due to falls from cones, while another three ceased
operating for unknown reasons. The vast majority of flare systems appeared to
have been designed to survive impacts from vehicles.
PowerFlares® advertises that their product will continue to function after
being driven over as well as suffering from other types of impacts. Researchers
subjected PowerFlares®, LiteFlares® and TurboFlares™ to drops from
increasing heights and drove over them repeatedly, but were unable to damage
these products. The other products were not as durable during drop testing and
this affected their functionality.
Portability/Ease of Deployment
A number of the products tested utilize or are supplied with some type of
carrying case to aid in their deployment. Two companies provide a hard case to
protect their product; TurboFlare™ contains eight flares while Tektite’s® case

30
contains five flares. Other companies (Flare Alert™, ProFlare™, Traffic Store™,
PowerFlare® & LiteFlare®) offer a soft case that aids in transporting their
respective equipment, but provide less protection. PowerFlare® offers a unique
option for quick deployment in the field. A fanny pack is provided that allows an
officer to pick up six PowerFlares® and rapidly deploy them. The PowerFlare®
charging unit is constructed of plastic and may not be durable.
Factors Affecting Performance
The majority of products considered and tested in this evaluation were
limited to a steady or flashing light when activated. The exceptions were
PowerFlare® (nine flash pattern settings) and ProFlare™ (three pattern settings).
These settings allow the operator the ability to choose the most appropriate flash
pattern under the circumstances. This freedom offers a great deal of utility
although certain flash patterns during testing were found to be less visible.
A slow constant flash pattern was less eye catching. In contrast, the faster
the flashing patterns, the greater the sense of urgency reported by the observers.
The faster flash patterns also tended to draw the observers’ attention faster.
Another factor substantially affecting the visibility of individual products,
was their relative height above the ground. It became clear during field-testing
that products that were closer to the ground received considerably lower scores.
A slight depression in the roadway could obscure the flare visibility even at short
distances. By elevating all the products by merely a few inches, their visibility
was often increased by a ¼ mile or in some cases more. When products were

31
placed on a cone, they frequently became visible at a distance of one mile or
more.
The following figures reflect the final performances of the various flares.
As a result of the testing, a second round of data collection was undertaken to
examine the effect of height on flare performance. As such, a second figure
provides information to display these differences.
Figure 14. Ground Based Flare Visibility Testing
During testing, the researchers placed the flares on the roadway at ¼ mile
distance increments. The research team then observed the road flares, as
detailed in the methodology section. The visibility scores were then recorded.
Ground-Based Flare Visibility
0
1
2
3
4
5
6
7
8
9
1/4 Mile 1/2 Mile 3/4 Mile 1 Mile
Distance
Visi
bilit
y In
dex
Road FlareFlareAlertPowerFlareTurboFlareHighway ConesTektiteLiteFlareProFlareCollapsible ConeGlo Wand5.11 Jacket
32
As referenced in the above figure, the traditional highway flare was the only
product that was visible at the distances of ¾ of a mile and 1 mile.
As shown in the chart above, the other flare products became less visible
as distance increased; the greatest reduction being between the ¼ mile and the
½ mile distance interval. Of the electric flare systems that were visible at ½ mile
(Flare Alert™ and Tektite®), it is likely that they were visible as the standard
product design allows them to be elevated.
Due to their proximity to the ground, the other products’ visibility scores
were drastically impacted by even slight depressions or unevenness in the
roadway. Additionally, the roadway selected was a well-maintained county road
with no discernable defects with optimal surface conditions. Only when a laser
level was placed on the road surface was the unevenness obvious.
As the researchers found such a competitive advantage was offered by
the relative height of the flare above the ground, it was decided to remove this
advantage and test the flare products at a standardized height (the height of a
standard road cone above the ground). The following table represents the
visibility of the flares at the standardized height of 36 inches.
33
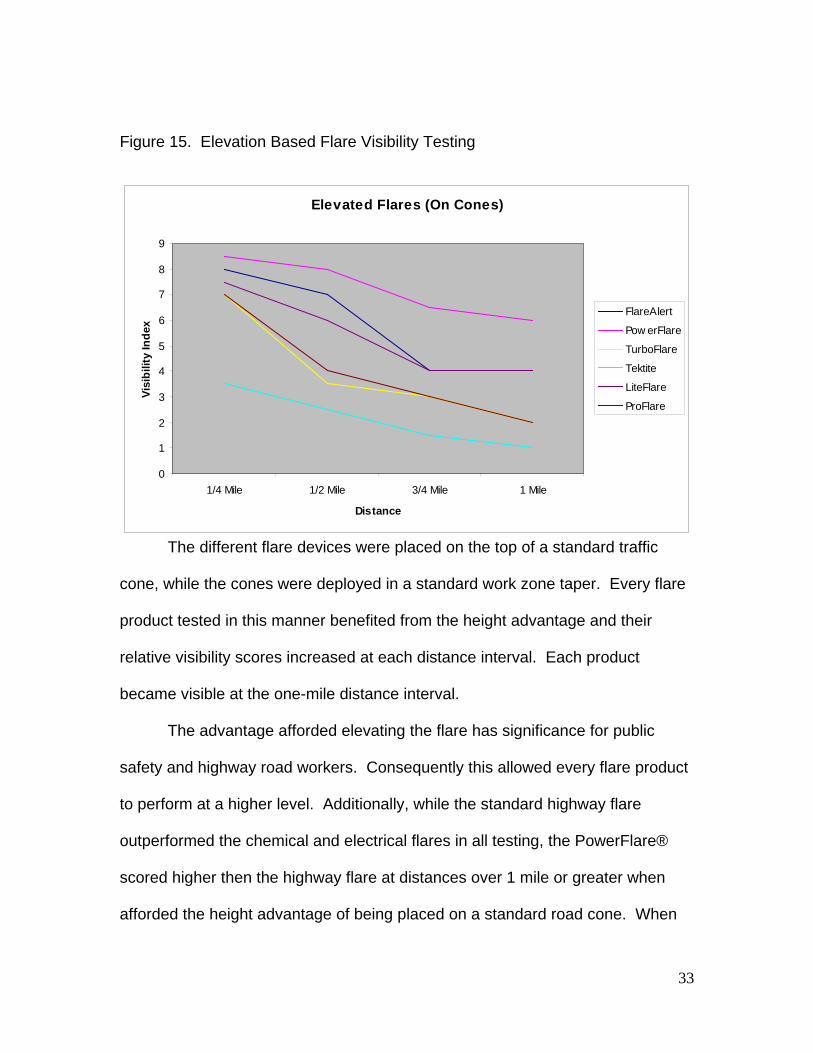
Figure 15. Elevation Based Flare Visibility Testing
The different flare devices were placed on the top of a standard traffic
cone, while the cones were deployed in a standard work zone taper. Every flare
product tested in this manner benefited from the height advantage and their
relative visibility scores increased at each distance interval. Each product
became visible at the one-mile distance interval.
The advantage afforded elevating the flare has significance for public
safety and highway road workers. Consequently this allowed every flare product
to perform at a higher level. Additionally, while the standard highway flare
outperformed the chemical and electrical flares in all testing, the PowerFlare®
scored higher then the highway flare at distances over 1 mile or greater when
afforded the height advantage of being placed on a standard road cone. When
Elevated Flares (On Cones)
0
1
2
3
4
5
6
7
8
9
1/4 Mile 1/2 Mile 3/4 Mile 1 Mile
Distance
Visi
bilit
y In
dex
FlareAlert
Pow erFlare
TurboFlare
Tektite
LiteFlare
ProFlare

34
elevated the Flare Alert™ outperformed the highway flare at ½ mile. At the same
½ mile distance LiteFlare® scored equivalent to the with the standard highway
flare.
As discovered in this testing, the Powerflare®, the Flare Alert™ and the
LiteFlare® products appear to offer competitive market solutions when compared
to a standard highway flare.
Table 1. Ground and Elevation Testing Comparison
Ground Elevated Ground Elevated Ground Elevated Ground Elevated 1/4 Mile 1/2 Mile 3/4 Mile 1 Mile FlareAlert™ 7 8 5 7 0 4 0 4 PowerFlare® 1.5 8.5 0 8 0 6.5 0 6 TurboFlare™ 0.5 7 0 3.5 0 3 0 2 Tektite® 6 3.5 2 2.5 0 1.5 0 1 LiteFlare® 0 7.5 0 6 0 4 0 4 ProFlare™ 0 7 0 4 0 3 0 2
As discussed earlier, all the flares benefited from a height advantage.
However, it must be stated that certain products were omitted from the height
testing. The highway flare was omitted as it posed a serious fire risk when
placed on a plastic traffic cone. Flares and other technologies that could not be
safely placed onto the cone without major modification were omitted.
The following images reflect the flares placed on the cones during
elevation testing. None of the flares other than FlareAlert™ had a dedicated
mounting device; consequently they were simply placed on top of the cones
during testing.
35
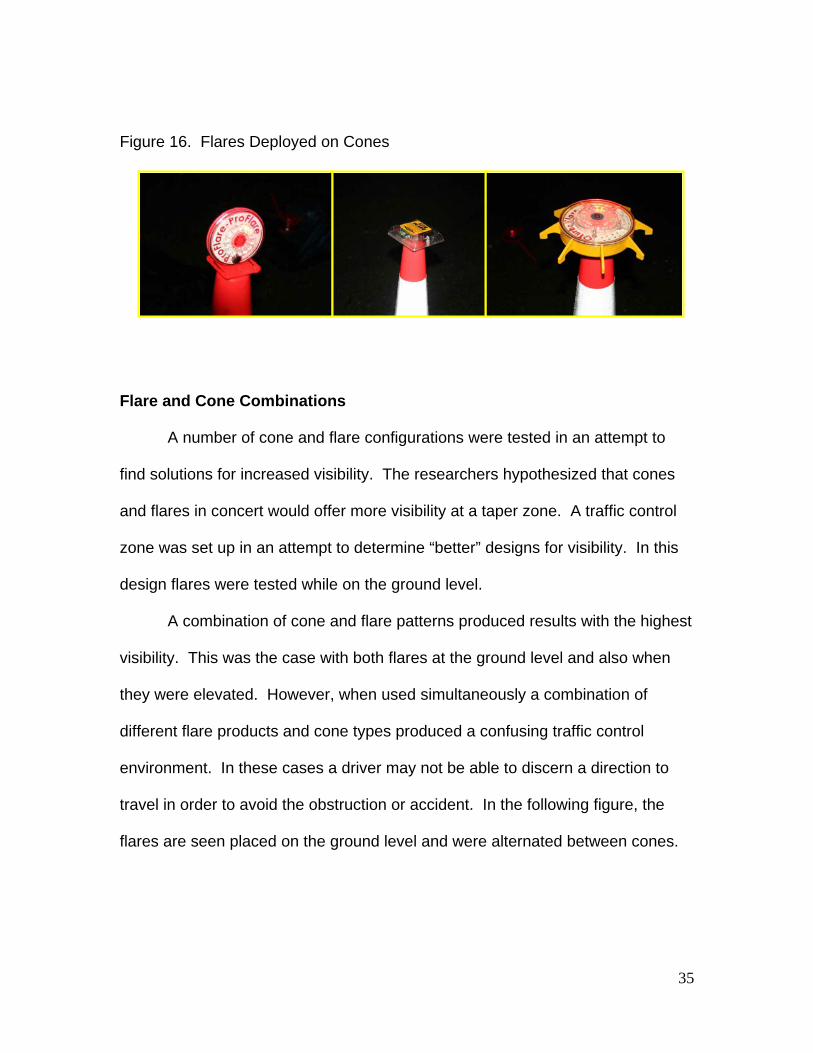
Figure 16. Flares Deployed on Cones
Flare and Cone Combinations
A number of cone and flare configurations were tested in an attempt to
find solutions for increased visibility. The researchers hypothesized that cones
and flares in concert would offer more visibility at a taper zone. A traffic control
zone was set up in an attempt to determine “better” designs for visibility. In this
design flares were tested while on the ground level.
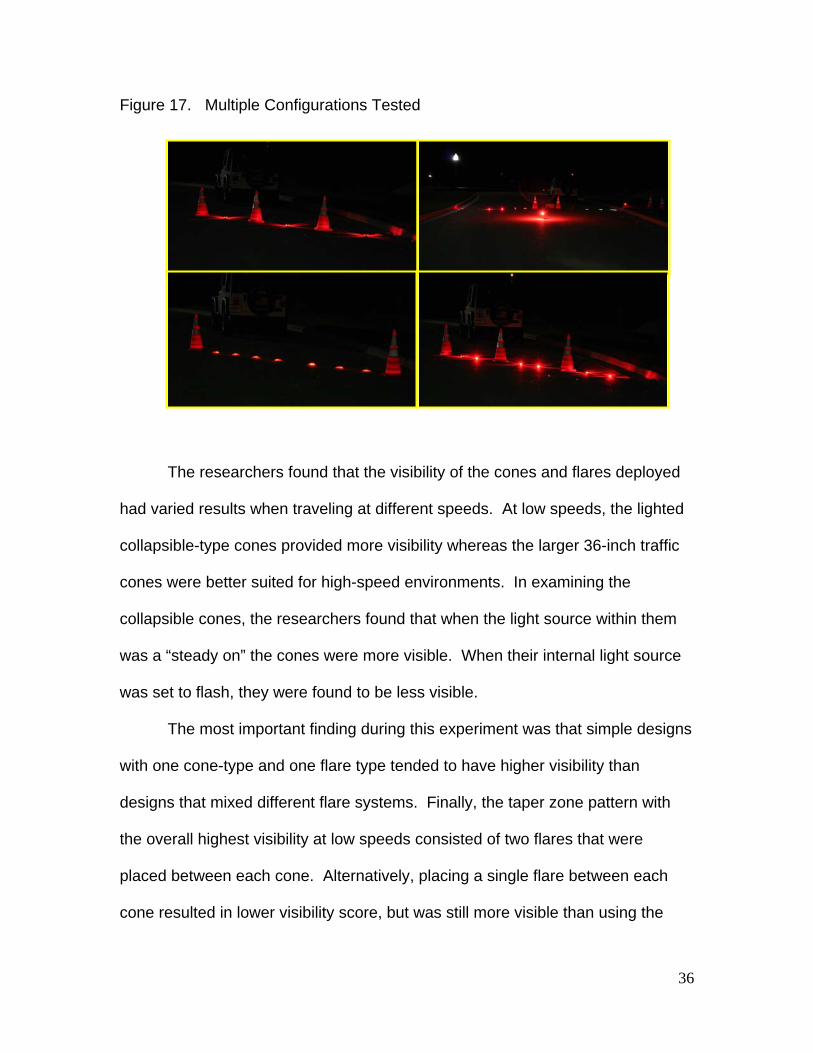
A combination of cone and flare patterns produced results with the highest
visibility. This was the case with both flares at the ground level and also when
they were elevated. However, when used simultaneously a combination of
different flare products and cone types produced a confusing traffic control
environment. In these cases a driver may not be able to discern a direction to
travel in order to avoid the obstruction or accident. In the following figure, the
flares are seen placed on the ground level and were alternated between cones.
36
Figure 17. Multiple Configurations Tested
The researchers found that the visibility of the cones and flares deployed
had varied results when traveling at different speeds. At low speeds, the lighted
collapsible-type cones provided more visibility whereas the larger 36-inch traffic
cones were better suited for high-speed environments. In examining the
collapsible cones, the researchers found that when the light source within them
was a “steady on” the cones were more visible. When their internal light source
was set to flash, they were found to be less visible.
The most important finding during this experiment was that simple designs
with one cone-type and one flare type tended to have higher visibility than
designs that mixed different flare systems. Finally, the taper zone pattern with
the overall highest visibility at low speeds consisted of two flares that were
placed between each cone. Alternatively, placing a single flare between each
cone resulted in lower visibility score, but was still more visible than using the

37
flares in a stand-alone manner. Thus, traffic cones should represent the base
upon which a taper zone is created as they enhanced visibility scores
considerably.
Complimentary Technologies
A number of complimentary technologies were examined in this evaluation
as they were related to the flares. Selected in this evaluation were highway
cones, collapsible cones, Glo Wands, and 5.11 jackets. The following table is
incorporated to detail these other technologies visibility at various ranges.
Table 2. Complimentary Technologies
Complimentary Technology Testing ¼ Mile ½ Mile ¾ Mile 1 Mile Highway Cones 5 1 0 0 Collapsible Cones 5.5 0 0 0 GloWand 4 0 0 0 5.11 Jacket 5 0 0 0
In this case, only the highway cones were visible at one-half mile. The
researchers theorized that the additional height of the traffic cones (36 inches)
over the 28-inch collapsible cone gave it a slight advantage. Both the 36-inch
standard cone and the 28-inch collapsible cones were outfitted with retro-
reflective strips; however both require a light source to illuminate the strips. In
the case of an oncoming car, the light beams of its headlights are fixed at an
angle from the car toward the roadway, and as such require the beams to “reach”
the cones prior to the retro-reflectivity. The retro reflective tape was not visible
after ½ mile, but was visible at ¼ mile for both types of cones.

38
At ½ mile, the collapsible cones were more visible than the standard 36-
inch highway cone because of an internal light source. While the light source
allowed it to be more visible at closer ranges, this effect diminished as distance
increased.
At ¼ mile, the 5.11 jackets were scored equally with the highway cones.
Their retro-reflective material made them visible at closer distances; however
their visibility diminished considerably beyond a ¼ of a mile.
The GloWands were selected for elevation testing as their light output was
greater than the Cyalume® and Krill lights. The 2.5-inch GloWand was visible at
¼ mile. The green GloWand was most readily visible (this finding is consistent
with the literature review which finds that the color green is the most readily
visible light spectrum color). Despite the GloWand being visible at the ¼ mile
distance interval, its color and size were not perceived by the research team as
an early warning indicator for approaching traffic. The colors red, blue and
orange tend to convey a greater sense of caution or danger, while the green
does not.
Establishing a Temporary Traffic Control Zone
Although substantial guidance is provided for setting up traffic control
zones for highway maintenance, the extant literature is virtually silent regarding a
standardized method for an officer to immediately establish a safety zone at a
traffic crash. Frequently, accident vehicles remain in the roadway as traffic flows
uncontrolled around the scene. Often, secondary crashes occur and may serve

39
to exacerbate an already tenuous situation. The officer’s actions within the first
few moments upon arrival on a traffic accident scene may determine the
outcome for a series of events.
Upon arrival, the placement of the officer’s vehicle is often determined by
the responding officer’s agency policy. Most agencies generally suggest that the
officer’s marked vehicle be positioned in such a manner so as to protect the
crash scene and the personnel on scene. Typically the officer’s vehicle is initially
positioned at least fifteen feet behind the rear accident vehicle with the steering
wheel (tires) turned full right, or into the curb.
A common error made by officers is the creation of a smaller than
necessary transition area to taper the flow of traffic into another lane on the
roadway. During the testing of the flares, it became clear that a shorter transition
area was perceived as a solid, straight line of lights or cones. This transition
area was not clearly recognizable as a taper designed to direct traffic into a
different lane.
Certain strobe patterns gave the appearance that traffic should be directed
into the opposite direction needed. This flash pattern might cause a driver to
pass through the emergency work area and place personnel at risk. This
confusing effect appeared to diminish at approximately 300 feet. However, this
distance may not be sufficient to allow for reaction time and braking depending
on the oncoming vehicles speed, tire condition, drag coefficient and operator’s
response time. As a result, the driver may be well past the point of no return and
may not be able to successfully navigate the lane transition.
40
Taper Zone Configuration
In order to examine adequate stopping distances, the researchers tested a
number of different configurations of lights, cones, and strobes in order to
determine an optimal layout that an officer could deploy rapidly upon arrival at
the scene. The method and design (Figure 18) was created allowing a single
officer to create the most favorable safety zone within the shortest amount of
time.
Since time is of the essence to prevent additional crashes, officers should
immediately don a retro-reflective jacket or vest to become more visible and
place some type of emergency warning equipment at the rear of their vehicle.
This equipment will serve as a temporary measure while the establishment of a
proper warning and transition area is created. Although traffic cones are
awkward, they should be used as the foundation for the transition area. Cones
tend to be visible in both daytime and nighttime conditions and their retro-
reflective strips are visible at up to a half mile. Further, they can be used to
support other technology that can be placed or mounted on their highest point.
As shown earlier in this report, the performance of flare technology can be
greatly improved by elevation as a synergistic effect was observed.
Unfortunately, the placement of cones into the proper position is time
consuming because they are bulky and cumbersome. As a stopgap measure,
the smaller flare devices can be initially placed into the cone positions while the
cones are being moved.

41
To create a taper zone with sufficient distance, the researchers examined
various formulas to create this design. The most favorable formula utilized a 10-
1 ratio; for each ten paces away from the starting point, the cone was moved
over one pace. This created a transition zone that was 80 paces (approximately
240 feet long) and extended the length of a single lane of traffic. While this
formula used eight cones, the configuration can be modified to meet the needs of
the individual agency. The following illustration represents a basic taper zone
that places the cones and flares at a 10 pace distance interval away from the
emergency vehicle.
Figure 18. Taper Zone Diagram
Once the cones are in place, the additional flare technology should be
positioned on the top of the cones for the added height and visibility advantage.
Only one of the devices tested includes a mounting system that securely
attaches it to the cone. Thus, the officer must be careful when placing the

42
remaining flare technologies on top of the cone. The successful placement of a
flare on a cone is dependent on the size and weight of the individual flare
system.
CONCLUSIONS
Highway flares continue to be viewed as one of the most cost efficient
options for first responders. They can be quickly deployed and are visible at
great distances and under adverse conditions. The traditional highway flares
have an inherent height advantage created by the wire stand.
However, traditional highway flares have a number of disadvantages.
Upon completion of the burn, the remnants (the striker, cap, and unburned flare
remnants) need to be picked up and disposed of properly. This places the officer
in a position wherein they must find the appropriate disposal method for
potentially toxic material, which is rarely discussed in agency policies. A single
unburned 20-minute flare can potentially contaminate up to 2.2 acre-feet of water
(Sliva, 2003). As a result of these issues, chemical and battery operated flares
which are environmentally friendly, should be considered as viable alternatives.
A number of chemical lightsticks were tested and evaluated. It was
originally hoped that these Cyalume® sticks would offer a rapid and effective
deployment alternative. While the lightsticks provide a number of applications for
law enforcement, their lack of visibility during testing precluded them from being
competitive with the other products evaluated. The basic product design does
not allow for adequate placement above the ground and when affixed to the

43
cones tested, still did not supply adequate illumination to be sufficiently visible for
traffic control.
Electrical light and strobe systems offer an innovative alternative to
traditional highway flare systems. As shown in this report, their visibility and
utility vary greatly from product to product. When used in combination with traffic
and highway cones, they have the potential to outperform even a highway flare at
distances exceeding a mile. The obvious advantage of this technology is that it
is environmentally safe and does not pose a fire hazard. Further, the size of
these devices allows a first responder to quickly establish a safety zone and
reduce the potential for secondary crashes or collisions. Lastly, these devices
are highly portable, compact, and some models allow for recharging.
This project also examined several personal utility lights (Krill® and the
Cejay® GloWand), and the 5.11 Tactical Series™ ANSI Class III Reversible
Jacket. This technology was examined in the hope of identifying additional
safety devices, which would compliment flare deployments. It was theorized that
these items, when used in concert with a retro-reflective jacket, would create a
synergistic effect and allow the jacket wearer to be highly visible. This was not
the case, as the personnel utility lights did not improve the visibility of the retro-
reflective jacket.
Beyond the scope of this evaluation, the GloWand did provide a
substantial amount of light output considering its small size (2½ inches). These
devices could serve as an emergency work light with a runtime of approximately
70 hours and a cost of $12 per unit. During the course of this project, these

44
personal utility lights were issued to all personnel and utilized in a broad range of
tasks related to nighttime data collection. Obvious applications for personal utility
lights include emergency lighting during power outages, and low light reading in
conditions absent of light.
The single more important finding from this study was the discovery that
the relative height placement of the flares affected visibility the most. In ground
based and elevation based testing, all of the flare technologies under
examination scored higher on the visibility scale when elevated. The researchers
found this to be true for the testing at 36-inches of elevation. However, even a
slight elevation of a few inches above the ground resulted in a substantial
increase in visibility for all of the electrical and chemical flares. The wire stands
in the traditional highway flare allow the light source to be elevated (at initial
ignition) up to approximately 10 inches above the ground. All electronic and
chemical flares tested would benefit in this manner.
Lastly, during the course of this evaluation the researchers identified the
issue of directionality as an area for future research. It was found that complex
cone and flare configurations could cause confusion as to which way a driver
should turn when approaching a taper zone. Similarly, uncoordinated flash
patterns had the same effect. When taper zones were created using multiple
flare technologies, the effect of the taper was reduced as the taper line became
perceived as being perpendicular to the road. This gave the zone the
appearance of being a wall of light and the research team’s first instincts were to
stop completely instead of merging into another lane. This instinct may be

45
inherently more detrimental to the flow of traffic. Consequently, a traffic control
taper should be a simple design (with flare devices elevated if possible) to
increase visibility while creating the least amount of driver confusion.
46
REFERENCES
Agarwal, G. S. (1989). Visibility Index as a simple measure of the quantum effects in light propagation through a non-linear dispersive element. Optic Communications, 72(3-4), 253-255.
Allen, M. J., Miller, S. S., & Short, J. L. (1971). The Effects of Flares and Triangular Distress Signals on Highway Traffic. American Journal of Optometry, 50(4), 305-315.
Allen, M. J., Strickland, J., & Adams, A. J. (1997). Visibility of red, green, amber and white signal lights in a highway scene. American Journal of Optometry, 43(2), 105-109.
Carjunky.com. (2005). Car Safety-New Flameless Flares, Easier to use. Retrieved July 6, 2007, from http://news.carjunky.com/car_safety/new_flameless_flares_easier_safer_to_use_130.shtml
CDC/NIOSH. (2004). Fire Fighter Fatality Investigation Report (F2003-16). Retrieved August 29, 2007 from http://www.cdc.gov/niosh/fire/reports/face200316.html
Center for Transportation Research and Education (2002). Synthesis for Best Practice for Increasing Protection and Visibility for Highway Maintenance Vehicles (IOWA DOT Project TR-475 and CTRE Project 02-107). Ames, IA: Iowa State University.
Chatziastros, A., Readinger, W., & Bülthoff, H. (2003). Environmental variables in the "moth effect". Vision in Vehicles X.
Conti, R. S., Chasko, L. L., & Cool, J. D. (1991). An overview of technology and training simulations for mine rescue teams. Pittsburgh: National Institute for Occupational Safety and Health.
Conti, R. C., & Yewen, R. G. (1997). Evaluation of a Signaling and Warning System for Underground Mines (ISSN 1066-5552). Pittsburg, PA: U.S. Department of Health and Human Services.
Copp Organization, Inc. (1974). Safety considerations in traffic police work. Law and Order, 22(6), 44-46, 48.
Corey, J., Powell, F., Quesnel, T., Windsor, L., & Yanez, V. (2003). Tucson Arizona Flare Experiment. SWAFS Journal, 25(2), 27-34.
Crawford, A. (1963). The Perception of Light Signals: The Effect of Mixing Flashing and Steady Irrelevant Lights. Ergonomics, 6(3), 287-294.
47
De Lorenzo, R. A., & Eilers, M. A. (1991). Lights and Siren: A review of emergency vehicle warning systems. Annals of Emergency Medicine, 20(12), 1331-1325.
Department of Civil and Environmental Engineering. (2004). Traffic Signal Safety: Analysis of Red-Light Running in Maine (04469-5711). Orono, Maine: University of Maine.
Finkle, M. (1997, Summer). Luminance to Intensity Measurement Method. Journal of the Illuminating Engineering Society, 26, 13-19.
Ford Motor Company. (2007). Ford Fleet Showroom, CVPI Officer Safety: Markings and Conspicuity- Countermeasures. Retrieved August 7, 2007, from https://www.fleet.ford.com/showroom/CVPI/pdfs/BRP_Report_Out_Countermeasures.pdf
Hazina, H.G., Hazinb, F.H.V., Travassosb, P., Erzinia K., (2005).Effect of light-sticks and electralume attractors on surface-longline catches of swordfish (Xiphias gladius, Linnaeus, 1959) in the southwest equatorial Atlantic, Fisheries Research (72) 271–277.
Hickman, L. (1992). Alternative to Emergency Flares (TM-03-92). Canadian Police Research Centre.
Hill, A. (1972). Directional constancy. Perception & Psychophysics, 11, 175-178.
Jones-Lee, A., & Lee, G. F. (2004). Unrecognized Environmental Pollutants. Stormwater Runoff Water Quality Science/Engineering Newsletter, 7(3), 1.
Knapp, K. K. (1999). Literature Review of Highway-Railroad Grad Crossing Sight Distance Assumptions. ITE Journal, 69, 32.
Latham, F. E., & Trombly, J. W. (2003). Low Cost Traffic Engineering Improvements: A Primer (FHWA-OP-03-078). Washington, D.C.: The US Department of Transportation.
Lavdas, L. G., & Achtemeier, G. L. (1995). A Fog and Smoke Risk Index for Estimating Roadway Visibility Hazard. National Weather Digest, 20(1), 26-33.
Morgan, C. (1978). Constancy of egocentric visual direction. Perception & Psychophysics, 23, 61-68.
Narendran, N., & Deng, L. (2002). Solid State Lighting 2: Proceedings of SPIE. Troy, NY: Society of Photo-Optical Instrumentation Engineers.

48
National Institute of Occupational Safety and Health. (2003). Potassium Perchlorate. International Chemical Safety Card. http://www.cdc.gov/niosh/ipcsneng/neng0714.html
New Jersey Department of Health and Senior Services. (2004). Potassium
Chlorate. Poison Control Handbook.
Paaswell, R. E., Rouphail, N. M., Baker, R. F., & Kamga, C. (2006, July). Identification of Traffic Control Devices for Mobile and Short Duration Work Operations (FHWA-NJ-2006-006). New York: University Transportation Research Center City College of New York.
Pratt, S. G., Fosbroke, D. E., & Marsh, S. M. (2001). Building Safer Highway Zones: Measures to Prevent Workers Injuries from Vehicles and Equipment. Cincinnati, OH: National Institute for Occupational Safety and Health. Retrieved from http://www.CDC.gov/niosh
Pryor, S. C. (1996). Assessing Public Perception of Visibility for Standard Setting Exercises. Atmospheric Environment, 30(15), 2705-2716.
Riva, M. D., Garvey, P. M., & Pietrucha, M. T. (2006). Impact of Highway Safety Flares on Driver Behavior. Transportation Research Record, 1980(1), 39-48.
Safe Driver Training. (2004, August 22). Stopping Distance. Retrieved August 29, 2007, from http://www.sdt.com.au/STOPPINGDISTANCE.htm
Shannon, J. D., & Trexler, E. C. (1997). Modeling Visibility for Assessment. Atmospheric Environment, 31(22), 3719-3727.
Silva, M. A. (2003). Perchlorate from Safety Flares: Santa Clara Valley Water District Publications.
Sivak, M. (1984). Human Factors and Road Safety: Overview of Recent Research at the University of Michigan Transportation Research Institute. Ann Arbor: University of Michigan Transportation Research Institute.
Sivak, M., Flannagan, M. J., & Miyokawa, T. (2001). The use of parking and auxiliary lamps for traffic sign illumination. Journal of Safety Research, 32, 133-147.
Sunderman, C., Signer, S., & Johnson, J. (2003). A Miniature Data Acquisition System with LED Warning Lights (NIOSHTIC-2 No. 20024112). Retrieved August 29, 2007 from http:// www.cdc.gov/niosh/mining/pubs/pdfs/amdas.pdf
Taylor, L., & Sucov, E. (1974). The movement of people toward lights. Journal of the Illuminating Engineering Society, 3, 237-241.
49
Veeger, A., & Boving, T., (2004). Highway Flares and Runoff: a Potential Source for Perchlorate to Surface Water in Rhode Island (pp. 1-6). Kingston, R.I.
Veitch, J. A., & Newsham, G. R. (1998). Determinants of Light Quality I: State of the Science. Journal of Illuminating Engineering Society, (27), 92-106.
Younger, J. (1997) The Moth Effect and How to Beat It. Retrieved April 1, 2008 from http://www-afsc.saia.af.mil/magazine/htdocs/win98/mothefect.htm.
Zwahlen, H. T. (1995). Traffic Control Devices, Visibility, and Railroad Grade Crossings. Transportation Research Record(1495), 140-146.