evaluation of a momentum based impact model in frontal car
TRANSCRIPT
ORIGINAL PAPER Open Access
Evaluation of a momentum based impactmodel in frontal car collisions for theprospective assessment of ADASStefan Smit1*, Ernst Tomasch1, Harald Kolk1, Michael Alois Plank1, Jürgen Gugler1 and Hannes Glaser2
Abstract
Motivation: The advent of active safety systems calls for the development of appropriate testing methods that areable to assess their capabilities to avoid accidents or lower impact speeds and thus, to mitigate the injury severity.Up to now the assessment is mostly based on the decrease of the collision speed due to CMS (collision mitigationsystems). In order to assess the effects on injury severity developing methods, that are able to predict collisionparameters correlating with the risk of getting injured, such as delta-v, for different impact situations is a mandatorytask.
Objective: In this study a momentum based impact model is assessed in terms of reliability to solve the collisionmechanics and therefore to predict delta-v for frontal car collisions.
Method: Real accidents were re-simulated using pre-defined input parameters for the impact model (virtualforward simulation – VFS). Subsequently the impact model was analyzed for its sensitivity to specific inputparameters.
Conclusion: It was shown that VFS works for full impacts while improvements and optimizations are required forimpacts that include a sliding movement in the contact zone of the vehicles.
Keywords: Driver assistance systems, Collision mitigation systems, Effectiveness assessment, Impact mechanics,Point of impact, Momentum based impact model
1 IntroductionIn 2010 the European Commission [1] released a series ofprecautionary measures (focusing on vehicle safety, thesafety of infrastructure and road users’ behavior) to halvethe number of road deaths until 2020. Salmon et al. [2]point out that between 75% and 95% of all traffic accidentsare – at least partially – caused by human error. In thiscontext, the integration of collision mitigation systems(CMS) in new cars is a reasonable step towards enhancedoccupant safety. The purpose of CMS is to monitor thesurrounding traffic, detect critical events, to brief thedriver on the current traffic situation or to take actions ifthe driver is not responding. Hence, the driver can be par-tially unburdened from mental stress and his failure
probability can be reduced. CMS, such as autonomousemergency braking systems (AEB), aim to mitigate injuriesin traffic accidents, usually by reducing the impact velocityand therefore the kinetic energy of the vehicle. However,automatically triggered braking manoeuvers also affect thecollision configuration and the impact pattern. E.g. if theoverlap in frontal collisions is smaller, a lower delta-v cancause more severe injuries, due to high intrusion to thepassenger compartment [3].A number of different approaches is available to deter-
mine the efficacy of CMS – retrospective analysis of realaccident data and prospective analysis based either ontesting (driving simulator studies, field operational tests,naturalistic driving studies) or simulation (virtual test-ing). Especially for newer ADAS retrospective analysesare difficult, because the number of accidents involvingcars equipped with CMS is still too low to provide re-sults of high statistical significance. Thus, prospective
* Correspondence: [email protected] Safety Institute, Graz University of Technology, Inffeldgasse 23/I,8010 Graz, AustriaFull list of author information is available at the end of the article
European TransportResearch Review
© The Author(s). 2019 Open Access This article is distributed under the terms of the Creative Commons Attribution 4.0International License (http://creativecommons.org/licenses/by/4.0/), which permits unrestricted use, distribution, andreproduction in any medium, provided you give appropriate credit to the original author(s) and the source, provide a link tothe Creative Commons license, and indicate if changes were made.
Smit et al. European Transport Research Review (2019) 11:2 https://doi.org/10.1186/s12544-018-0343-3
investigations are needed. One possibility is to do phys-ical testing, using cars equipped with appropriate sys-tems, similar to the Euro NCAP (New Car AssessmentProgramme) tests. In these tests, restrictions are appliedto reduce the testing effort and to increase the repeat-ability. E.g. in the Euro NCAP AEB (autonomous emer-gency braking) testing procedure [4] only the reduction ofthe collision velocity is considered when calculating thefinal rating. Instead of physical testing, virtual testing (VT)can be done. VT offers the possibility to simulate a highnumber of different accident scenarios in a short period oftime. Thus, more accident scenarios can be addressed. InVT, it is necessary to introduce surrogate parameters forthe injury severity. One of these surrogate parameters isdelta-v, the change in velocity between the pre- andpost-crash trajectories of a vehicle [5]. It is obtained by re-solving the collision mechanics.In contrast to VT, retrospective analyses use statistical
approaches for determining the influence of specificsafety systems on the accident and injury occurrence.The basic data for these analyses is usually gathered viaaccident reconstruction. The main task of accident re-construction is to reproduce the accident sequence intime as well as in space. Detailed descriptions can befound in Johannsen [6] or Burg and Moser [7]. Accidentreconstruction utilizes data such as the damage patterns,the final positions of the vehicles, etc. Usually it is neces-sary to tune the pre-impact collision parameters (e.g.point of impact (POI), coefficient of restitution, etc.)after setting up the simulation to obtain the final posi-tions of the vehicles. The final vehicle positions and/oran estimation of EES (energy equivalent speed [8]) canthus be used to check the plausibility of the results [9].The reconstruction provides data like impact velocities,post- crash movements or delta-v.
VT can be done using the so called virtual forwardsimulation (VFS). VFS can be used to simulate traffic ac-cidents, starting within the pre-crash phase (with a suffi-cient time history before the collision, so that the CMScan take actions [10]). Within VFS, the vehicles can beequipped with generic ADAS to simulate their behavior.Studies carried out by Zauner et al. [11], Tomasch et al.[10] or Kolk et al. [12, 13] used the method of VFS torate the effects of CMS. Hence the collision configur-ation, like the relative vehicle positions or the impactvelocities, are manipulated by the CMS it is necessary topredict the pre-impact collision parameters for the im-pact model. The collision mechanics are then solvedusing these pre-impact parameters. In VFS, the data of areal accident i.e. final vehicle positions, damage patterns,damage depth, etc. are not known. Thus, they cannot beused to validate the results of the simulation.To understand the problem of VFS, an example of a
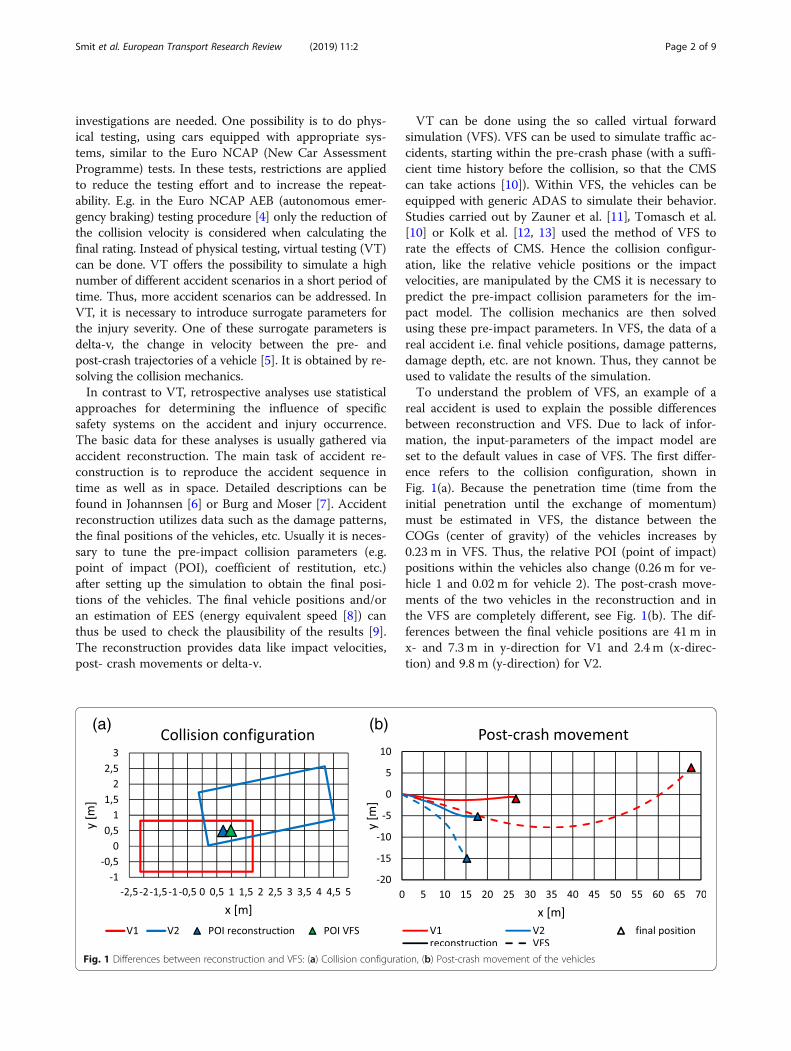
real accident is used to explain the possible differencesbetween reconstruction and VFS. Due to lack of infor-mation, the input-parameters of the impact model areset to the default values in case of VFS. The first differ-ence refers to the collision configuration, shown inFig. 1(a). Because the penetration time (time from theinitial penetration until the exchange of momentum)must be estimated in VFS, the distance between theCOGs (center of gravity) of the vehicles increases by0.23 m in VFS. Thus, the relative POI (point of impact)positions within the vehicles also change (0.26 m for ve-hicle 1 and 0.02 m for vehicle 2). The post-crash move-ments of the two vehicles in the reconstruction and inthe VFS are completely different, see Fig. 1(b). The dif-ferences between the final vehicle positions are 41 m inx- and 7.3 m in y-direction for V1 and 2.4 m (x-direc-tion) and 9.8 m (y-direction) for V2.
(a) (b)
Fig. 1 Differences between reconstruction and VFS: (a) Collision configuration, (b) Post-crash movement of the vehicles
Smit et al. European Transport Research Review (2019) 11:2 Page 2 of 9
2 ObjectiveThe first objective of this study is to assess the perform-ance of a momentum based impact model in terms ofaccuracy of the post-crash parameters e.g. delta-v,post-crash velocity or final positions of the vehicles. Thesecond objective is to analyze the model on its sensitivityto its input parameters, like initial speeds, position ofthe POI, angle of the contact plane (CP), coefficient ofrestitution or coefficient of friction.
3 Method3.1 Momentum based impact modelThe general purpose of impact modelling is to deter-mine the post-impact conditions of the system, pro-ceeding from given initial conditions (pre-impactconditions). The impact model used in this study isbased on the conservation of linear and angular mo-mentum during the crash phase. Detailed descriptionscan be found in Steffan and Moser [14], Gilardi andSharf [15] Brach and Brach [16], Burg and Moser [7]or Appel et al. [17]. The basic formulations of thismodel are based on Newton’s 1st and 2nd law andwere first used by Kudlich [18], Slibar [19], to analyzevehicle collisions. The model is capable of computingthe post-crash parameters (velocities, yaw rates, etc.)directly from the pre-impact conditions. In order tokeep the computational effort low, the following as-sumptions are made:
� The crash force between the interacting vehicles isexchanged in one discrete point – the POI
� Tire forces and the gravitational force are neglectedduring the crash
� The duration of the crash phase is infinitely small,therefore no acceleration pulses or vehicledeformations are computed
� The vehicles do not move during the crash phase� The vehicle bodies have linear stiffness behavior
3.1.1 Conservation of momentum – EquationsThe conservation of momentum can be derived by com-bining Newton’s 2nd and 3rd law and states that the totalmomentum in a closed system of n interacting bodiesremains constant, if no external forces are applied. The
total momentum equals the sum of momentums pi*
ofthe individual bodies (1):
p*¼ m v
*¼p1* þ p2
* þ…þ pn*¼
Xn
i¼1
pi*¼ const: ð1Þ
The same equation must also be satisfied by the angu-
lar momentum L*
(2):
L*¼L1
* þ L2* þ…þ Ln
*¼Xn
i¼1
Li*¼ const: ð2Þ
Analyzing equations (1) and (2) shows that the totalmomentum after the collision is still the same, but theenergy is transformed and transferred. During the firstphase of the collision, the kinetic energy is partially trans-formed into vehicle deformation (phase of compression).As in most physical systems, some of the deformation isretransferred into kinetic energy. This is called restitution.Thus, the collision can be split in two phases – the phaseof compression and the phase of restitution. The com-pression phase extends from the initial contact of the ve-hicles until the velocities of the contact points in normaldirection are equal. The latter extends from the end ofcompression until the bodies separate again. Followingthis definition, the momentum for each phase can be ob-tained by:
SC ¼Z t1
t0
F*
tð Þ dt ð3Þ
Equation (3) shows the calculation of the total mo-
mentum during the compression phase, where F* ðtÞ rep-
resents the acting force and t0 and t1 represent thebeginning and the end of the compression phase. Themomentum for the restitution phase SR can be evaluatedusing t1 and t2. At time t2 the vehicles separate again.To incorporate the elastic deformation the impulse ratioε (coefficient of restitution) is introduced as the ratio be-tween SR and SC (4). Using this definition, the entire ex-changed momentum can be calculated as shown in (5).
ε ¼ SRSC
ð4Þ
S ¼ SC þ SR ¼ SC 1þ εð Þ ð5ÞTaking the conservation of energy into account, there
are two limits for the impulse ratio. The first one is ε = 0representing a totally plastic impact, the second one is ε= 1 referring to a totally elastic impact. In car accidentsusually a default value of ε = 0.1 is used, because it is ap-plicable for a wide range of closing speeds. This valuedepends on the geometry of the bodies, the closingspeed and the material properties [6, 15, 20]. Addition-ally the POI, the angle of the CP and the coefficient offriction in the contact zone must be defined.The penetration depth can be obtained from the damage
patterns of the vehicles. To calculate the post-crash param-eters (velocities, yaw angles, etc.) a local coordinate system
Smit et al. European Transport Research Review (2019) 11:2 Page 3 of 9
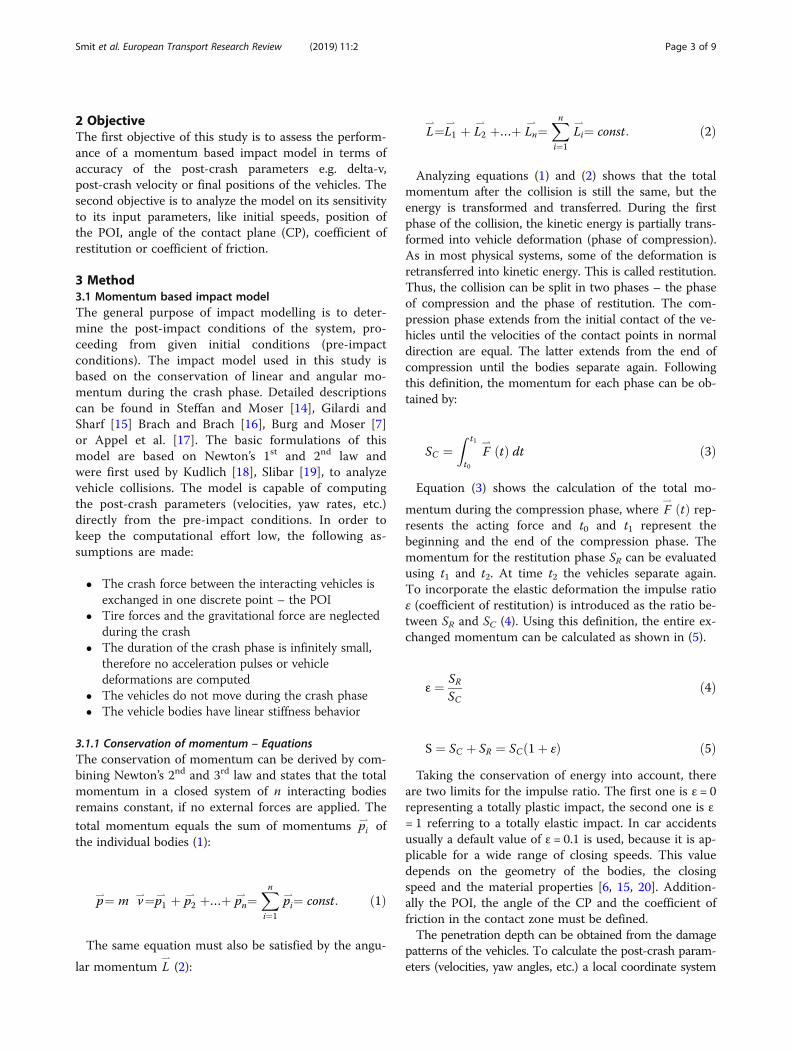
is erected in the POI (see: Fig. 2) and the acting forces aredetermined. Also a CP is defined, which specifies the direc-tion of the movement if sliding occurs. The definition ofthe CP influences the magnitude of the force componentsN (normal force) and T (friction force) and the correspond-ing levers ni and ti, responsible for the acting torque. Thedirection of the CP is crucial for the type of impact.Non-sliding (full) impacts or sliding impacts can occur.In accident reconstruction the pre-impact parame-
ters of the impact model (collision velocities, POI,angle of the CP, coefficient of restitution, coefficientof friction) need to be refined in a manner, that thevehicles reach their final positions. Additionally esti-mated parameters such as the EES value can be usedto verify the results.
3.1.2 Full impactA full impact occurs when the condition T ≤ μN issatisfied, meaning that the collision partners do notslide along each other in the contact zone. It alsomeans that the contact points reach the same vel-ocity at the end of the compression phase in normaland tangential direction. In this case, the angle ofthe CP does not influence the final results.
3.1.3 Sliding impactThe second option is that – in theory – T > μNholds. Thus this is not possible, T = μN holds, mean-ing that a sliding movement in the contact zone ofthe vehicles occurs. As a result, the contact pointsdo not reach a common velocity in tangential direc-tion at the end of the compression phase. In thiscase, the definition of the CP and the coefficient offriction must be estimated very carefully, because theresults (final positions, trajectories) show a high
dependency on these parameters [21]. Sliding im-pacts are identified as follows. The opening angle ofthe friction cone is calculated according toequation (6).
ρ ¼ arctan μð Þ ð6Þ
If the angle between crash force and normal directionn in Fig. 2(a) is equal to the opening angle of the frictioncone ρ, a sliding impact occurs.Many studies have been carried out to evaluate the
suitability of this impact model for accident reconstruc-tion. Bailey et al. [22] staged five different collisions andrecorded data such as delta-v, post-crash trajectories,impact speeds etc. After the tests, they validated the im-pact models using two different methods. First, they cal-culated the input parameters for the model from therecorded test data and compared the final positions andpost-crash trajectories. Second, they used the final posi-tions and post-crash trajectories to determine the initialconditions. Finally, they compared the obtained resultswith the measured data and found that the error of themodel stays within reasonable limits. Other investiga-tions on this topic were carried out by Cliff and Mont-gomery [23] and Cliff and Moser [24].
3.2 Virtual forward simulationThe VFS method has become more popular for the as-sessment of ADAS in recent years. One of the advan-tages of VFS is that a large number of scenarios can beevaluated in a short period of time. When implementinggeneric ADAS into a vehicle in VFS, the simulationstarts within the pre-crash phase to be able to simulatethe behavior of the ADAS during the pre-crash phase. In
(a) (b)
Fig. 2 Momentum based impact model (a) [37] and automatic definition of the POI and the CP (b) [13]
Smit et al. European Transport Research Review (2019) 11:2 Page 4 of 9
case the ADAS takes action, the collision configuration(velocities, impact pattern, etc.) might change. The loca-tion of the POI and the angle of the CP might thus alsobe changed. Additionally it is not possible to use finalpositions or estimation of EES to verify the results (asthese parameters could be used in accident reconstruc-tion). Therefore, the user has to find a way of determin-ing reasonable values for the input parameters (POI, CP,coefficient of restitution, etc.) of the impact model.In this study, the VFS was done using the simulation
tool X-RATE (Extended Effectiveness Rating of Ad-vanced Driver Assistance Systems) developed by Kolk[25]. X-RATE is a control platform that is capable of set-ting up driving dynamics simulations and run themautomatically. It is based on MATLAB® and utilizesPC-Crash™ as solver for the vehicle dynamics and colli-sion mechanics. The crash related parameters are thengathered and saved.
3.2.1 Definition of the POI and the CP using geometricalrulesFor reasons of simplicity, the vehicle outline is repre-sented by a rectangle with the same length and width asthe real vehicle. As required by the impact model, thevehicles penetrate each other before they reach the colli-sion configuration and the momentum is exchanged.The overlap region, shown in Fig. 2 (b), is representedby a polygon that can be calculated using the algorithmof Sutherland and Hodgman [26]. The corners of thispolygon either represent the corners of the vehicle orthe intersection points between the vehicle outlines. Thecentroid of the overlap region can be obtained as de-scribed by Nürnberg [27]. The area of the overlap poly-gon and the coordinates of the nodes of the polygon areused to obtain the coordinates of the centroid. Inaddition to the POI the CP is also defined using geomet-rical rules only. The direction of the CP is defined bythe intersection points of the simplified vehicle contours.It is then translated in parallel so that it is coincidentwith the POI, see Fig. 2 (b).
4 MaterialThe in-depth accident database CEDATU (Central Data-base for In-Depth Accident Study) developed byTomasch [28, 29] was the source for the basic accidentdata. The CEDATU data fields are based on the STAIRS(Standardization of Accident and Injury RegistrationSystems) protocol [30]. The fields were enhanced andextended in accordance with the results obtained in dif-ferent research projects, such as PENDANT (Pan-Euro-pean Coordinated Accident and Injury Databases, [31]),RISER (Roadside Infrastructure for Safer EuropeanRoads, [32]) and ROLLOVER (Improvement of RolloverSafety for Passenger Vehicles, [33]). Additionally datafields of the national statistics in Austria are incorpo-rated to make a direct comparison possible [34].
5 Sampling criteriaThe following sampling criteria were applied for thisstudy:
� Only fatalities involving two passenger carsproceeding in opposite directions
� No subsequent collisions of the vehicles whenmoving to the final positions
� The penetration depth is set constant� Frontal damage of the vehicles (according to the
STAIRS protocol [30])� PDoF (Principal Direction of Force): 1, 2, 10, 11, 12
(STAIRS protocol [30])� Random selection of accidents – no frequency
correlation with national statistics (bias of results)
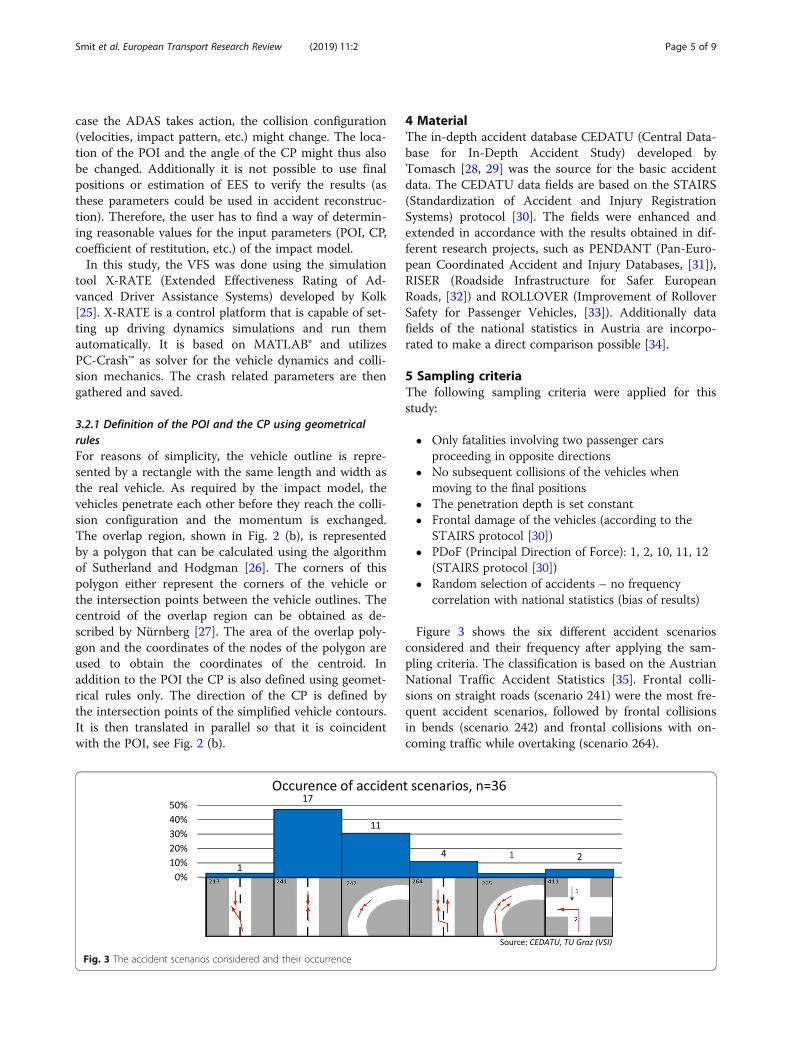
Figure 3 shows the six different accident scenariosconsidered and their frequency after applying the sam-pling criteria. The classification is based on the AustrianNational Traffic Accident Statistics [35]. Frontal colli-sions on straight roads (scenario 241) were the most fre-quent accident scenarios, followed by frontal collisionsin bends (scenario 242) and frontal collisions with on-coming traffic while overtaking (scenario 264).
Fig. 3 The accident scenarios considered and their occurrence
Smit et al. European Transport Research Review (2019) 11:2 Page 5 of 9

All of the accidents were reconstructed andre-simulated by VFS. Thirty-six accidents involving 72vehicles were analyzed.
6 Results and discussionFigure 4 shows the occurrence of full and sliding im-pacts in reconstruction and VFS as well as the changes(arrows) from full to sliding impacts. It can be seen thatthe VFS (POI and CP defined by geometrical rules) leadsto more sliding impacts than the accident reconstruc-tion. Using a Chi-squared test [36] shows that the differ-ence is highly significant (p ≤ 0.01). Because the accidentreconstruction can make use of the actual damage pat-terns and final positions of the involved vehicles tooptimize the POI and the CP, the detection of the im-pact type is easier than in VFS. Usually a sliding impactis expected to be more likely if the overlap (width of the
damaged area divided by the vehicle width) is smaller.Analyzing the reconstructed accidents, this can be vali-dated, because the mean overlap is 65.5% for full im-pacts compared to 32.5% for sliding impacts. Using VFSthe results are different. Here the mean overlap for fullimpacts is 77% and the mean overlap of sliding impactsis 50.3%. A number of 13 accidents led to full impacts inreconstruction as well as in VFS. Six accidents wereidentified as sliding impacts for both simulations. Calcu-lating the difference results in a number of 17 collisions,which show different results for reconstruction and VFS.The relative Position of the POI within the vehicle is
shown in Fig. 5. When applying the method of accidentreconstruction, the POIs for full impacts (blue circles)are distributed across the whole width, while the onesfor the sliding impacts (green circles) are close to theleft side of the vehicle. The cause of this is the regula-tion for driving on the right side of the road. Therefore,impacts with small overlaps mostly affect the left sideof the vehicle. For VFS the POIs for both – full andsliding impacts (red and yellow triangles) – are ran-domly distributed across the whole width of the vehicle.Additionally the distances between the POIs were ana-lyzed. The mean deviation over all vehicles is 0.190 m(n = 72). When both simulations resulted in full impactsthe mean distance between the POIs is 0.167 m (n =26), compared to 0.148 (n = 12) for sliding impacts. Thedistance between the POIs was the largest when thetype of impact (full or sliding impact) changed betweenthe simulation runs (0.222 m, n = 34).In the context of the final positions in full impacts, simi-
lar results are obtained for reconstruction and VFS. Forsliding impacts there is quite a big difference. Using VFS,the post-crash movement is shorter than in reconstruction.
Fig. 4 Occurrence of full and sliding impacts
Fig. 5 Relative position of the POI within the vehicle
Smit et al. European Transport Research Review (2019) 11:2 Page 6 of 9
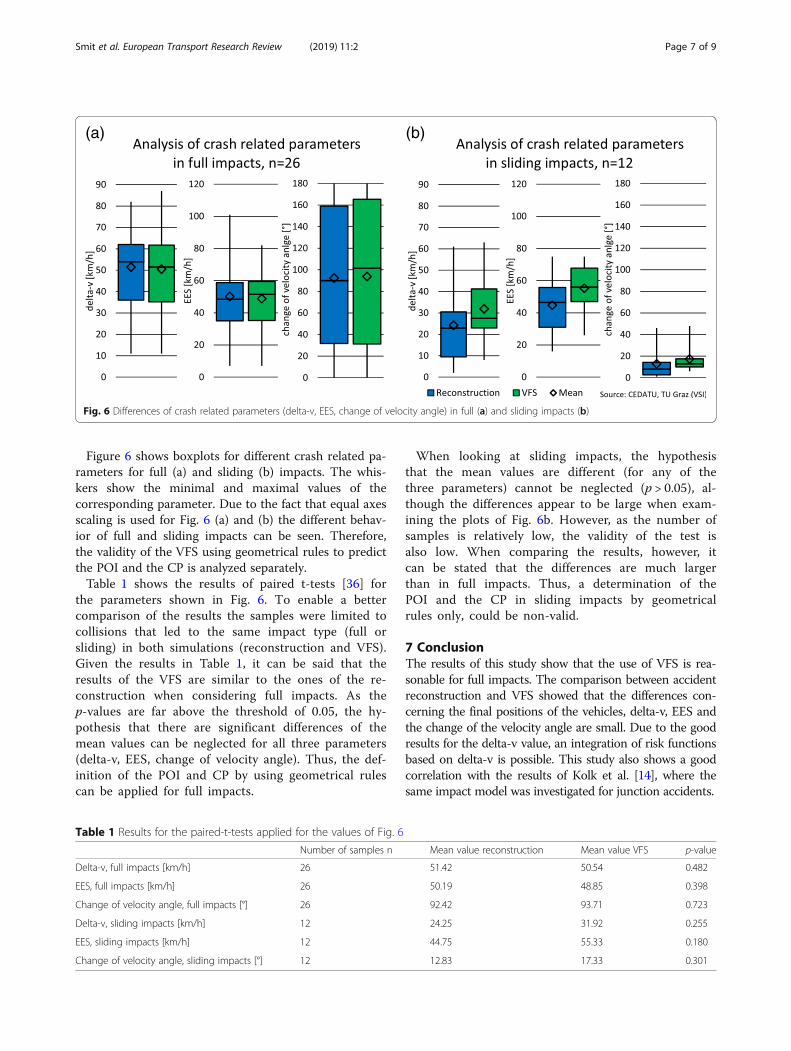
Figure 6 shows boxplots for different crash related pa-rameters for full (a) and sliding (b) impacts. The whis-kers show the minimal and maximal values of thecorresponding parameter. Due to the fact that equal axesscaling is used for Fig. 6 (a) and (b) the different behav-ior of full and sliding impacts can be seen. Therefore,the validity of the VFS using geometrical rules to predictthe POI and the CP is analyzed separately.Table 1 shows the results of paired t-tests [36] for
the parameters shown in Fig. 6. To enable a bettercomparison of the results the samples were limited tocollisions that led to the same impact type (full orsliding) in both simulations (reconstruction and VFS).Given the results in Table 1, it can be said that theresults of the VFS are similar to the ones of the re-construction when considering full impacts. As thep-values are far above the threshold of 0.05, the hy-pothesis that there are significant differences of themean values can be neglected for all three parameters(delta-v, EES, change of velocity angle). Thus, the def-inition of the POI and CP by using geometrical rulescan be applied for full impacts.
When looking at sliding impacts, the hypothesisthat the mean values are different (for any of thethree parameters) cannot be neglected (p > 0.05), al-though the differences appear to be large when exam-ining the plots of Fig. 6b. However, as the number ofsamples is relatively low, the validity of the test isalso low. When comparing the results, however, itcan be stated that the differences are much largerthan in full impacts. Thus, a determination of thePOI and the CP in sliding impacts by geometricalrules only, could be non-valid.
7 ConclusionThe results of this study show that the use of VFS is rea-sonable for full impacts. The comparison between accidentreconstruction and VFS showed that the differences con-cerning the final positions of the vehicles, delta-v, EES andthe change of the velocity angle are small. Due to the goodresults for the delta-v value, an integration of risk functionsbased on delta-v is possible. This study also shows a goodcorrelation with the results of Kolk et al. [14], where thesame impact model was investigated for junction accidents.
(a) (b)
Fig. 6 Differences of crash related parameters (delta-v, EES, change of velocity angle) in full (a) and sliding impacts (b)
Table 1 Results for the paired-t-tests applied for the values of Fig. 6
Number of samples n Mean value reconstruction Mean value VFS p-value
Delta-v, full impacts [km/h] 26 51.42 50.54 0.482
EES, full impacts [km/h] 26 50.19 48.85 0.398
Change of velocity angle, full impacts [°] 26 92.42 93.71 0.723
Delta-v, sliding impacts [km/h] 12 24.25 31.92 0.255
EES, sliding impacts [km/h] 12 44.75 55.33 0.180
Change of velocity angle, sliding impacts [°] 12 12.83 17.33 0.301
Smit et al. European Transport Research Review (2019) 11:2 Page 7 of 9
For sliding impacts, the use of VFS requiresoptimization and improvements. Within the comparisonof accident reconstruction and VFS the final vehicle po-sitions and delta-v showed a high sensitivity to the defin-ition of the POI and the CP and thus were quitedifferent. This is due to the fact, that the angle of thecontact plane has a great influence on the normal andtangential forces acting in the POI as well as on the le-vers for the angular momentum.
8 OutlookFuture research should also include the investigations onthe penetration depth that was set to a fixed value of 30ms in this study. The penetration influences the levers ofthe exchanged angular momentum in the impact model.In reconstruction, the depth of penetration can be ob-tained from the damage patterns. In VFS, it would benecessary to find a correlation between the closingspeed, the overlap and the penetration depth to be used.Further, the algorithm for the determination of the
POI and the CP in VFS needs further investigations spe-cifically because the use of geometrical relationshipsoften results in sliding impacts being identified insteadof full impacts.The prediction of the POI and CP for sliding impacts
must be analyzed in detail, because these impacts showa very sensitive behavior. In addition, the number of ac-cidents investigated should be increased to provide re-sults that are more reliable. Additionally, the analysescarried out in this context should also be applied forother types of vehicles and accident scenarios.An ANOVA could be used to find the most sensitive
pre-collision impact parameters in order to incorporatemultiple parameters i.e. overlap, POI, angle of the CP,penetration depth, masses of the vehicles and others inthe sensitivity analysis.
AbbreviationsADAS: Advanced driver assistance system; AEB: Autonomous emergencybraking; CEDATU: Central Database for In-Depth Accident Study;CMS: Collision mitigation system; COG: Center of gravity; CP: Contact plane;CS: Coordinate system; EES: Energy equivalent speed; NCAP: New CarAssessment Programme; POI: Point of impact; VFS: Virtual forward simulation;VT: Virtual testing; X-RATE: Extended Effectiveness Rating of Advanced DriverAssistance Systems
AcknowledgementsNot applicable.
FundingNot applicable.
Availability of data and materialsNot applicable.
Authors’ contributionsAll authors read and approved the final manuscript.
Competing interestsThe authors declare that they have no competing interests.
Publisher’s NoteSpringer Nature remains neutral with regard to jurisdictional claims inpublished maps and institutional affiliations.
Author details1Vehicle Safety Institute, Graz University of Technology, Inffeldgasse 23/I,8010 Graz, Austria. 2Consultant for accident reconstruction, Limbergstraße 54,3500 Krems a.d. Donau, Austria.
Received: 13 June 2018 Accepted: 19 December 2018
References1. Minsart, N. (2010). Road Safety Programme 2011–2020: detailed measures.2. Salmon, P., Regan, M., & Johnston, I. (2005). Human error and road transport:
Phase one – A framework for an error tolerant road transport system, Victoria.3. Rudd, R. W., Scarboro, M., & Saunders, J. (2011). Injury Analysis of Real-World
small overlap and oblique Frontal Crashes. In 22nd International TechnicalConference on The Enhanced Safety of Vehicles (ESV), Paper No 11–0384,Washington.
4. Euro, N. C. A. P. (2015). European New Car Assessment Programme: Testprotocol - AEB systems. Version 1.1.
5. Day, T. D., & Hargens, R. L. (1987). An Overview of the Way EDCRASHComputes Delta-V. In SAE International Congress and Exposition. Warrendale:SAE International400 Commonwealth Drive.
6. Johannsen, H. (2013). Unfallmechanik und Unfallrekonstruktion: Grundlagender Unfallaufklärung, 3., überarbeitete Auflage. ATZ/MTZ-Fachbuch. Wiesbaden:Springer Vieweg.
7. Burg, H., & Moser, A. (2017). Handbuch Verkehrsunfallrekonstruktion:Unfallaufnahme, Fahrdynamik, Simulation, 3. Aufl. 2017. ATZ/MTZ-Fachbuch.
8. Burg, H., & Zeidler, F. (1980). EES –Ein Hilfsmittel zur Unfallrekonstruktionund dessen Auswirkungen auf die Unfallforschung. In Der Verkehrsunfall (Vol.18, p. 75).
9. Wach, W., & Unarski, J. (2007). Uncertainty of calculation results in vehiclecollision analysis. Forensic Sci Int, 167(2–3), 181–188.
10. Tomasch, E., Kolk, H., Sinz, W., et al. (2015). Prospektive Bewertung derKollisionsschwere von L6e Fahrzeugen unter Berücksichtigung einesKollisionsminderungssystems. In 10. VDI-Tagung Fahrzeugsicherheit -Sicherheit 2.0: Berlin, 25. und 26. November 2015, Nichtred. Ms.-Dr, vol 2265(pp. 407–418). Düsseldorf: VDIVerlag.
11. Zauner, C., Tomasch, E., Sinz, W., et al. (2014). Assessment of theeffectiveness of Intersection Assistance Systems at urban and rural accidentsites. In ESAR - Expert Symposium on Accident Research.
12. Kolk, H., Kirschbichler, S. K., Tomasch, E., et al. (2016). Prospective evaluationof the collision severity of L7e vehicles considering a Collision MitigationSystem. In: Transportation Research Procedia. Elsevier.
13. Kolk, H., Sinz, W., Tomasch, E., et al. (2016). Evaluation of a momentumbased impact model and application in an effectivity study consideringjunction accidents. In ESAR (ed) 7th International Conference on ESAR "ExpertSymposium on Accident Research".
14. Steffan, H., & Moser, A. (1996). The Collision and Trajectory Models of PC-CRASH. In International Congress & Exposition. SAE International.
15. Gilardi, G., & Sharf, I. (2002). Literature survey of contact dynamics modelling.Mech Mach Theory, 37(10), 1213–1239. https://doi.org/10.1016/S0094-114X(02)00045-9.
16. Brach, R. M., & Brach, R. M. (2011). Vehicle accident analysis and reconstructionmethods (2nd ed.). Warrendale: SAE International.
17. Appel, H., Krabbel, G., & Vetter, D. (2002). Unfallforschung, Unfallmechanikund Unfallrekonstruktion, 2.Auflage. Wiesbaden: Vieweg+Teubner Verlag.
18. Kudlich, H. (1966). Beitrag zur Mechanik des Kraftfahrzeug-Verkehrsunfalls.Wien: Techn. Hochsch., Dissertation.
19. Slibar, A. (1966). Die mechanischen Grundsätze des Stoßvorganges freierund geführter Körper und ihre Anwendung auf den Stoßvorgang vonFahrzeugen. In Archiv für Unfallforschung, 2. Jg., H (Vol. 1, p. 31).
20. Antonetti, V. W. (1998). Estimating the Coefficient of Restitution of Vehicle-to-Vehicle Bumper Impacts, Warrendale, PA.
21. Steffan, H., & Moser, A. (1998). Automatic Optimization of Pre-ImpactParameters Using Post-Impact Trajectories and Rest Positions. SAE technicalpapers, 980373, 22.
22. Bailey MN, Lawrence JM, Fowler SJ et al. (2000) Data from Five Staged Carto Car Collisions and Comparison with Simulations, Warrendale, PA.
Smit et al. European Transport Research Review (2019) 11:2 Page 8 of 9
23. Cliff, W. E., & Montgomery, D. T. (1996). Validation of PC-Crash - AMomentum-Based Accident Reconstruction Program, SAE Technical Paper960885, https://doi.org/10.4271/96088.
24. Cliff, W. E., & Moser, A. (2001). Reconstruction of twenty staged collisions withPC-Crash's optimizer.
25. Kolk, H. (2016). X-RATE: Extended Effectiveness Rating of Advanced DriverAssistance Systems. University of Technology Graz: Vehicle Safety Institute.
26. Sutherland, I. E., & Hodgman, G. W. (1974). Reentrant Polygon Clipping, NewYork.
27. Nürnberg, R. (2013). Calculating the area and centroid of a polygon in 2D.28. Tomasch, E. (2007). Entwicklung und systematische Verwertung einer In-depth
Datenbank tödlicher Verkehrsunfälle.29. Tomasch, E., Steffan, H., & Darok, M. (2008). Retrospective accident
investigation using information from court. In TRA (ed) Transport ResearchArena Europe 2008 (TRA).
30. Ross, R., Thomas, P., Sexton, B., et al. (1998). An Approach to theStandardisation of Accident and Injury Registration Systems (STAIRS) inEurope. In 16th International Technical Conference on the Enhanced Safety ofVehicles (pp. 1298–1305).
31. Morris, A., & Thomas, P. (2003). PENDANT - Pan-European Co-ordinatedAccident and Injury Databases. In NHTSA (ed) The 18th ESV ConferenceProceedings.
32. RISER (2006) Roadside Infrastructure for Safer European Roads. Final Report.EC FP5 project RISER.
33. Gugler, J., & Steffan, H. (2005). ROLLOVER - Improvement of Rollover Safety forPassenger Vehicels: Final report.
34. Statistik Austria (2007) Erläuterungen und Definitionen zum Zählblatt übereinen Straßenverkehrsunfall.
35. Statistik Austria (2000) Unfalltypenkatalog, Wien.36. Mittag, H.-J. (2012). Statistik: Eine interaktive Einführung, 2. Aufl. 2012. Springer-
Lehrbuch. Berlin, Heidelberg: Springer.37. Moser, A. PC-Crash. (2013). Accident-Simulation Program, Operating Manual,
Version 10.0 Dr. Steffan Datentechnik Ges.m.b.H., Linz, Austria.
Smit et al. European Transport Research Review (2019) 11:2 Page 9 of 9