modelling of car dynamic crush behaviour in frontal impact o · · 2016-05-26modelling of car...
TRANSCRIPT

Modelling of Car Dynamic Crush Behaviour in Frontal Impact
O Riordain S. t. Val/et G. t. Wood D.P.t, Cesari D. t
t INRETS-LCB, t Wood+Associates, Dublin.
Abstract
The dynamic response of individual cars in the füll width barrier test describes the behaviour of the fully engaged front structure of each car. A simplified representation of the füll width barrier response is combined with hypothesised deformation behaviour in the Offset and 30-Degree Angled rigid barrier tests to provide a model of the dynamic response in these two tests for deformations up to maximum dynamic crush. The responses predicted for four individual cars in the Offset and 30-Degree Angled rigid barrier tests are compared with the actual test responses.
lntroductlon
Tue overall crush behaviour of individual cars has an important influence on crashworthiness and injury severity as it influences the deceleration levels irnposed on the occupants and the onset of intrusion into the occupant compartment. Detailed finite element modelling can now closely replicate actual frontal crush behaviour but requires the use of supercomputers and extended model development and processing time.
In this paper a different approach is used. This approach uses an idealisation of the füll width frontal rigid barrier response with a model ofthe dynamic crush behaviour in the offset and 30 degree angled rigid barrier tests to provide a method of predicting the car response up to maximum dynamic crush in these tests. Tue predicted responses are compared with the actual responses for four individual cars.
Backround
Emori(l) in 1968 computed the dynamic deceleration-displacement characteristics for a number offull width rigid barrier tests previously carried out by Severy and bis colleagues (2, 3). Emori concluded that the dynamic behaviour was independent of speed and that the dynamic frontal crush bahaviour to maximum dynamic crush could be approximated by a linear force-deflection model and a quarter sine deceleration-time model.
Campbell( 4) applied this approach to the energy absorption characteristics in full width barrier tests when using residual or permanent crush and showed that the behaviour could be represented by a linear force with initial offset. He also showed that the residual crush profile ofthe car after frontal irnpact in offset and angled barrier tests could be used to estimate the barrier irnpact speed.
This approach was developed by McHenry (5) into the CRASH program which uses residual crush to estimate collision severity. Here ·cars are divided into various categories by wheelbase size, specific · linear and offset force per unit width coefficients being assigned to each category.
The actual frontal crushing behaviour of cars is much more complex and different from these linear representations. Typically the bumper is crushed, followed by the front side members or struts, the first peak force coinciding with the onset ofbuckling and plastic collapse ofthe struts. The crushing forces then reduce sharply before rising again as the engine, subframe and rear front structure become involved ( 6). Sakuri (7) showed that the frontal crush characteristics could be represented as two constant force regimes with the transition as the deformation reaches the engine. Matsumoto (8) used a similar
- 1 83 ·-
approach but with an initial linear rise to the first stage constant force and a linear transition between the first and second contant force levels. Wood (9) combined the approach used by Sakuri (7) with a model for the overall crush and energy absorption behaviour of car fronts in eccentric and offset impacts and applied this model to speed estimation from residual crush.
/dealisation of full wiclth barrier response
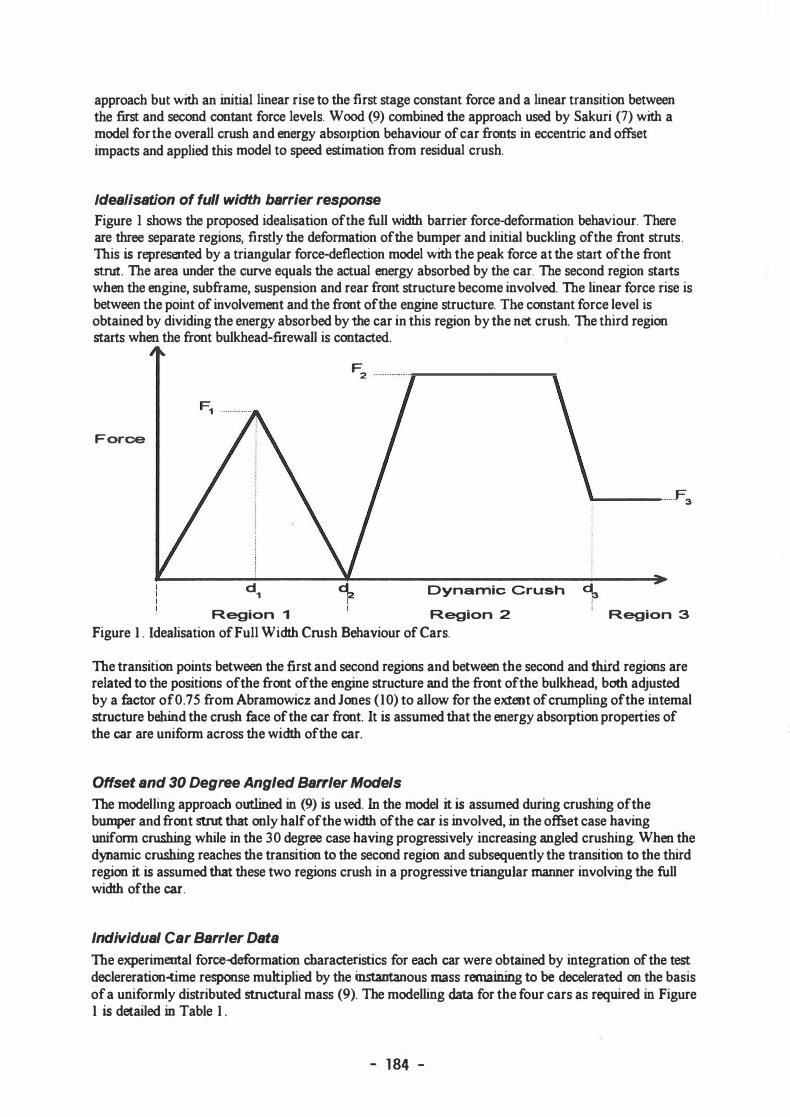
Figure 1 shows the proposed idealisation ofthe füll width barrier force-deformation behaviour. There are three separate regions, firstly the deformation ofthe bumper and initial buckling ofthe front struts. This is represented by a triangular force-deflection model with the peak force at the start of the front strut. Tue area under the curve equals the actual energy absorbed by the car. Tue second region starts when the engine, subframe, suspension and rear front structure become involved. Tue linear force rise is between the point of involvement and the front ofthe engine structure. Tue constant force level is obtained by dividing the energy absorbed by the car in this region by the net crush. The third region starts when the front bulkhead-firewall is contacted.
Force
F2
d1 � Dynamic Crush Region 1 Region 2
Figure 1 . Idealisation of Full Width Crush Behaviour of Cars.
------·-F3
� 1 Region 3
The transition points between the first and second regions and between the second and third regions are related to the positions ofthe front ofthe engine structure and the front ofthe bulkhead, both adjusted by a factor of0.75 from Abramowicz and Jones (10) to allow for the extent of crumpling ofthe intemal structure behind the crush face of the car front. lt is assumed that the energy absorption properties of the car are uniform across the width ofthe car.
Offset and 30 Degree Angled Barrler Models
The modelling approach outlined in (9) is used. In the model it is assumed during crushing ofthe bumper and front strut that only half of the width of the car is involved, in the offset case having uniform crushing while in the 30 degree case having progressively increasing angled crushing. When the dynamic crushing reaches the transition to the second region and subsequently the transition to the third region it is assumed that these two regions crush in a progressive triangular manner involving the füll width ofthe car .
Individual Car Barrler Data
The experimental force-deformation characteristics for each car were obtained by integration of the test declereration-time response multiplied by the instantanous mass remaining to be decelerated on the basis of a uniformly distributed structural mass (9). The modelling data for the four cars as required in Figure 1 is detailed in Table 1 .
- 1 84 -

------�
„„
............................. _____ ............
..........-.................. „ ...... „.._..„„
„ ..... -„„ .... „ ___ , .•. „,„„ .... „„„„„ ..... „„ .. _ .......... „ ... „ „
---���---·-··PL(1!1L .. ___ !?.? .. (�L ..... .!?.� .. J�2. ...... �-�---Q�NL .... �? .. �t ..... .f..3-.. �-----1 0 .13 0.25 0.65 1 85 202 93 2 0 . 1 8 0.28 0.74 192 203 96 3 0.20 0.26 0.66 132 25 1 66 4 0.35 0.47 0.86 3 1 9 467 160
Table 1 . Data for Idealisation of Full width Barrier Response, refer Figure 1 .
The extent to which the model represents the füll barrier behaviour can be evaluated by comparing the model and actual responses. Table 2 compares the computed maximum dynamic crush with the experimental füll width barrier results. This comparison shows that the computed maximum dynamic deformations are all greater than the experimental values but are within 3.6% ofthe experimental results. There is greater variability between the calculated and experiemental times to maximum dynamic deformation, the greatest difference being 8%.
__ f �_!: ___ y_�_�)__ __ !?.m!.{�). _______ Q��L{�)_ ___ pjff..{%) ___ !�� .. {�). _____ I.��--(�) ........ Q.iff.{%). __ .. l 57.4 0.66 0.68 +3.6 0.081 0.085 +4.8 2 56.5 0.73 0.74 + 1 .6 0.081 0.087 +7.0 3 57 . 1 0.62 0.63 -2.3 0.070 0.064 -8.0 4 58.5 0.73 0.74 +2.6 0.075 0.071 -5.5 -- ----
Table 2. Full Width Barrier : Comparison of Actual and Idealised Responses.
Predicted and Test Offset and 30-Degree Barrier Responses
Figures 2 to 5 compare the predicted and experimental force-deformation and deceleration-time responses up to maximum dynamic crush for the four cars in the Offset and 30 Degree Angled barrier tests. The experimental responses are obtained by passing the raw data th.rough a Class 60 filter. Tables 3 and 4 compare the computed and experimental maximum dynamic crush and time to maximum dynamic crush for the four cars.
Car V (km/h) D (m) Dca1c (m) Diff (%) T (s) Tca1c (s) Diff (%) -···················-�---···-·············------!'!9? ........... _______________________________________________ �----------------·--------------------·-------------------
1 50.0 0.78 0.71 -8.6 0. 1 1 7 0.088 -24.6 2 50.0 0.74 0.78 +4.6 0.086 0.094 +9.3 3 5 0 . 1 0.76 0.68 -10.6 0.108 0.079 -26.7 4 50.8 0.91 0.83 -8.4 0.103 0.086 -16.5
Table 3 . Offset Rigid Barrier : Comparison ofTest and Predicted Maximum Dynamic Deformation and Time.
Table 3 shows that the calculated maximum dynamic deflection for the Offset barrier is less than the test results for 3 of the 4 cars examined, the greatest difference being 0.08 m. For the fourth car the predicted maximum deformation and time are greater than the test values, the diffetences being 4.6% and 9 .3% respectively.
Examination ofFigures 2 to 5 shows that the magnitudes ofthe computed initial peak forces are similar to the experimental values. Tue initial experimental and calculated force rise rates on engagement of the engine are similar. However the model gives a smooth force characteristic whereas the experimental response contains the force fluctations due to successive buckling and inertia effects in real structures. Visual examination of Figures 2 to 5 shows that the average experimental high force levels are similar to the computed forces except for car 4 where the computed force is higher than the experimental values.
- 185 -

v.·-,,,...�,,.....,.,._,_,,,.,._,.,._...,...y.•1,,.-·-� ........... ,, .. __.. . ....,.,.,._.....,...,.,„.,.,_.„_,.,„_,...,,.,.„„,,...,,,.,.,,...IV<V,l,.....,.,••••"•'•-..-l'•-l'"' "'�.-rll.",.,.•'"•._",._"-'•'"'••••l',._•h•.•.•.i!'.-.•„,-.-.•„,-.•,•_. . ._.„„_.._. •• , ... _•.•.-.:-„,-.•J'JOl',,...J"o"••
... �.<lE .... .Y.�.�>. ........ P��„.J�) ........ J?��.J�L .... .J?i.f!(%) ........ 'I��-P. .. (S.) ........ T.c.a1� .. (S.) ... .... .J?if!(%) .... .
1 2 3 4
56.3 57.2 56.7 58.4
0.81 1 .04 0.93 1 .02
0.91 1 .03 0.94 1 .04
+12.9 -0.8
+ 1 . 1 + 1 .5
0.092 0. 1 1 7 0 . 1 15 0. 103
0. 104 0 . 1 1 5 0. 1 13 0 . 100
+12.7 -2.0 - 1 .2 -2.3
Table 4. 30 Degree Angled Barrier : Comparison ofTest and Predicted Maximum Dynamic Deformation and Time.
Exarnination ofthe 30 Degree Angled Barrier resuhs shows that the computed and experimental responses are very similar for car 2, 3 and 4. By comparison car 1 has considerably higher forces when the engine and rear front structure are engaged - in fact higher than those obtained experimentally in the füll width and offset barrier tests.
Discussion
Tue model proposed in this paper, which is based on idealisations of the füll width rigid barrier behaviour and of the general deformation behaviour of the car structure under eccentric impact, gives force-deformation and deceleration-time responses in the 30 degree and Offset tests for the four cars examined which are similar to the test resuhs. Tue model, which at its present stage of development only computes the response up to maximum dynamic crush, gives a smoothed force and deceleration characteristic. Actual car behaviour has force peaks and troughs due to buckling and inertia effects of the various parts ofthe structure.
Tue merit of the approach used here is that once the füll width barrier response data or idealisation of proposed structure are available then prediction of the car responses in the Offset and 30 Degree barrier test can be obtained rapidly. Further validation ofthe model is needed to confirm the accuracy of prediction of the Offset and 30-Degree rigid barrier tests and for tests at different speeds to those used here (50 and 56/58 km/h), for different overlaps and to include rebound predictions. A similar, related, approach to the development of an overall model is being used by Fossat (1 1). Tue uhimate objective is to apply this approach to car to car impacts, obtain the resuhant deceleration pulses for both cars and, using these, model the occupant responses and apply the model to car compatability studies.
References
1 . Emori R.I. "Analytical Approach to Automobile Collisions", Paper 680016, S.A.E. Congress, Detroit, Mich. Jan. 1968
2. Severy D.M. and Mathewson J.H. "Technical Find.ings from Automobile Impact Studies" S.A.E. Trans. Vol. 65, pp.70-83, 1957.
3 . Severy D.M. and Mathewson J.H. "Automobile.Head-On Collisions - Series 2" S.A.E. Trans. Vol 67, pp.238-262, 1959.
4. Campbell K.L. "Energy Basis for Collision Severity" Paper 740565, 3rd S.A.E. Int. Conf. on Occup. Prot. Troy, Mich. 1974.
5. McHenry R.R. "Computer aids for Accident Investigation" Paper 760776, 20th Stapp Car Crash Conf. Dearbom, Mich. 1976.
6 . Toyama A„ Hatamo K. and Murakami E . ''Numerical Analysis ofVehicle Frontal Crash Phenomena" Paper 920357, S.A.E. Congress, Detroit, Mich., 1992.
7. Sakuri T„ et a/. "On the Safety Body struucture offinite element analysis" 12th E.S.V. Conf. Goteborg, pp.327-333, 1989.
8 . Matsumoto H. et al. "A Parametric Evaluation ofVehicle Crash Performance" S.A.E. paper 900465, S.A.E. Congress, Detroit, Mich., 1990.
9. Wood D.P., Doody M. and Mooney S. "Application ofa Generalised Frontal Crush Model of the Car Population to Pole and Narrow Object Impacts" S.A.E. Paper 930894, S.A.E. Congress Detroit, Mich., 1993.
- 1 86 .-

10. Abramowicz W. and Jones N. "Dynamic Progressive Buckling ofCircular and Square Tubes" Int. J. of Impact Engng., Vol. 4, pp.243-270, 1986.
1 1 . Fossat E . "Mathematical Models to Evaluate Structural Forces in Frontal Crash Tests" 14th E.S.V. Conf. Munich, paper 94-58-0-04, 1994.
Comparison of Model and Test Responses for Car 1
Offset Rigid Barrier
0 . ,; : ,;
; . . ...... ... „ . ... _ „ ......... „„ .... „ z:--=::. _. . „ „ „„ . „ .„„„ . „„ „ . ::;::>„ „ ... „ .... „„ . ...
0 0
,; 0 . ....... . „ 0 0
0 �J 0 1 0 „ 0 ,;
= •....• „ •...... ..•.•. ••....... „„ .• ··'- :
&' 0 0
0 0 0 0 0 0 0 . 0 0 ,; ,; ,; ,; ,; ,; ,; ,; ,; ,; ,; 0 0 0 0 0 0 0 0 0
� 0 0 0 0 0 0 0 0 0 . 0 . 0 • 0 . 0 • „ 0 „ . „ : „ . „ „ „ - - -
-
30° Angled Barrier
1
�
...... „ ... .... j .•.••.. ,
0 „ ,; 0
..•.•••...•.•. .;.„ •• „ ...•..........• „ .......•..•..• .... „ . L e 0
" - . . - „„„. „„; . . ; „. . � :j �„ . . „ . „-„ ....... 0
;--._ „ ,;
0 „ ,; 0
0
0 L.__,.�-.-�...---,,..-....,.�....-�..---,�--r�-.-�...---'1--' o 0 0 0 0 0 0 0 0 0 0 ,; ,; 0 ,; ,; ,; ,; ,;
0 0 0 0 0 0 0 0 0 0 0 0 : 0 0 0 . 0 . 0 0 . 0 „ 0 „ . „ 0 „ . „ „
-Force (kN) - Crush (m)
0 0 ,;
t �I
II
�I
- 1 87 -
0 0
0 0
0 •
0 .;
0 0
0
0
0 0 oi 0
':'
0 ,; „
Acceleration (g) - Time (s)
0 0 0
0 ,; oi ':'
0 . 0 .;
0 . 0 .; JI
0 „ 0 ,;
0 „ 0 .;
0 0 0
0 ,; .; „

Comparison of Model and Test Responses for Car 2
Offset Rigid Barrier
j 1 ol ä
,; 0 0 0 0 „
-
Force (kN) - Crush (m)
30° Angled Barrier
0 • • . . . ,; ,; ,; ,; ,; 0 0 . 0 . 0 . 0 0 0 . 0 . . . . . . 0 � : = : „ . II
-
Force (kN) - Crush (m)
0 „ ,;
: ,; 0 . ,; 0
:1 0 „ ,;
: ,;
: ,; 0 0
0 ,; ,; 1
i ä
0 . ,;
: ,;
0 . ,;
.1 . ,;
0 . ,;
: ,;
0 0
• . ,;
�
- 1 88 -
-. ,;
·�
0 0 • 0 0 • 0 • 0 • - - „ „
0
Acceleration (g) - Time (s)
0 ••••••••"' '""""°''''"'"M''"''
0
,;
0 . 0 0
0 . 0 0
: 0
„ JI 0 . 0 0
0 „ 0 0
. 0 0 0
!1 0
: . 0
0 „ 0 ,;
: .._,.._��.....,.���"'"T'"���.,....���.-��--.���-'- o 0 0 0 . • ,; • ,; • ,; ,; 0
• - - ';' „
0
Acceleration (g) - Time (s)

Comparison of Model and Test Responses for Car 3
Offset Rigid Barrier
� 0
.•.•. , •....•.....•..... „ .•.. , ....•. „ . . , ......... .•...•....... , . ... + �
0 0 0 0 0 0 0 0
.; .; 0 0 .; .; ,; .; 0 0 0 0 0 0 0 0 0 0 0 0 0 0 0 0 0 0 0 0 . 0 . 0 . 0 . 0 . „ 0 „ : „ 0 „ . „ . . - -
11 äl -
Force (kN) - Crush (m)
30° Angled Barrier
0 0 .; .; . : „
0
: .;
0 •
01 : .;
0 „ .;
� ,; 0 0 .;
0 . .; 0 . .; � .; 0 . .;
:1 0 . 0
: .; 0 „ .; 0
0
0 11 '-T�-..�-..�-..�-..�-..�-..�---.�---.�---.�_,,_.. o 0 0 .; .; 0 0 0 0 0 . . " „ .
�
0 0 0 .; ,; .; 0 0 0 0 0 0 0 . 0 0 „ : „ -
-
Force (kN) - Crush (m)
0 0 0 : .
.;
i äl
l ä
189 -
1 I� 1
0 .;
0 0
l 0 ... : .. -...... „_ . ... � ·····- . :
.; „ •..... „ ........... „ ... „„ . ... . . .. �· ······
· o . ···- ········ ·····- 1·· ···-·-···-·'"'''''"' ' 0
.;
0 . 0 ,;J : 0 .;
0 „ 0 .; � 1
1 1 1 1 : 1 1 0 . 0 0 0 0 .; ,,; .; ,,; .; ,,; .; . „ „
0
Acceleration (g) - Time (s)
0 ,,; 0 ,,;
V
0 0
.;
: 0 •
0 �J 0
.„� 7.{ ..... „ .. �i:
0 0 0 ,,; „ .
0 .; .
.;
0 „ 0 .;
0 0 0 .;
Acceleration (g) - Time (s)

Comparison of Model and Test Responses for Car 4
Offset Rigid Barrier
i .; 0 0 0 . „
0 :: 0 :
0 :: 0 0 0 „
: 0 :
-
0 .; :: 0 0
Force (kN) - Ciush (m)
30° Angled Barrier
-············„·································-····· ..... „ ...... ·-···-···„.
� �I
: . :
0 0 0 .; .; .; 0 0 :: 0 0 0 0 0 0 . 0 „ „ „
-
0 .; 0 0 0 . -
0
.; :: 0 0 -
Force (kN) - Crush (m)
0 . .; :! .; : .; 0 . .; 0 „
0
0 „ 0
0 „ .; : .; 0 0
0 .; 0
0 .;
0 . .;
. „ .;
0 • .;
.1 „ .;
0 „ .;
1 � 1 0 0
0 .; .; 1
1 �
0 .;
- 1 90 -
0 0 .; .; .;
0
0 „
0 .; „
Acceleration (g) - Time (s)
0 : .;
0 . 0 .;
: .;J : 0 .;
0 ···-········· ...... :
0 .; „
.;
0 0 0 .;
0 0
.;
0 . 0 .;
0 . 0
····'··········•·············· ·-'·· . � .;J .•.. .•.•. o. •.•.......•..... .L .......... ___ ; ................. t..-........... -.: .......... L i
.;
0 ···�· ............ „.!········ .„ .• .„ .. .... „ ... -....... l:
/) 0 0 0
0 0 0 0 0 0 0 .; .; .; . .; .; 0 .; „ „ „ „
0
Acceleration (g) - Time (s)