evaluation guide for community safe routes to school programs
TRANSCRIPT

Created April 2008
This guide was developed by the Pedestrian and Bicycle Information Center and the National Center for Safe Routes to School (NCSRTS) of the University of North Carolina Highway Safety Research Center with funding from the National Highway Traffic Safety Administration (NHTSA). This guide is part of the Safe Routes to School Guide maintained by the NCSRTS at www.saferoutesinfo.org with funding from the Federal Highway Administration.
SafeRoutesNational Center for Safe Routes to School
Evaluation Guide for Community Safe Routes to School Programs
Identifying issues, improving activities and understanding results


ContentsEvaluation Guide for Community Safe Routes to School Programs
Overview....................................................................................................8-1
Benefits of Evaluation ............................................................................................... 8-1
Audience .................................................................................................................. 8-1
Purpose .................................................................................................................... 8-2
When.and.How.to.Evaluate..........................................................................8-3
The Timing of Evaluation ........................................................................................ 8-3
Options for Evaluation ..............................................................................................8-4
Collecting.Safe.Routes.to.School.Information............................................... 8-8
Kinds of Information to Collect ...............................................................................8-8
Ways to Collect Information ....................................................................................8-8
Evaluation.in.Six.Steps............................................................................... 8-12
Step 1: Plan the Program/Collect Information ....................................................... 8-12
Step 2: Write Objectives ..........................................................................................8-17
Step 3: Decide What, How and When to Measure .................................................8-19
Step 4: Conduct the Program and Monitor Progress ............................................... 8-22
Step 5: Collect Information and Interpret Findings ................................................ 8-23
Step 6: Use Results ................................................................................................. 8-25
Appendices................................................................................................ 8-27
A. Safe Routes to School Student Travel Tally ........................................................ 8-28
B. Safe Routes to School Parent Survey .................................................................. 8-29
C. Evaluation Worksheet ........................................................................................ 8-31
D. Example Completed Evaluation Worksheet ....................................................... 8-36
E. Working with an Evaluation Specialist ...............................................................8-44
F. Evaluation Designs.............................................................................................. 8-45
G. Writing Smart Objectives .................................................................................. 8-46
H. Data Collection, Storage and Management ........................................................ 8-47
I. Examples of What and How to Measure ............................................................. 8-48
J. Tips for Working with the Media ........................................................................ 8-49
Resources.................................................................................................. 8-50

Evaluation 8-1
Overview
Benefits.of.EvaluationEvery SRTS program, no matter the size, can benefit from evaluation. For local programs, evaluation allows for:
• Making.sure.that.the.underlying.problem.is.identified.so.that.proper.strategies.to.address.the. problem. are. picked. Sometimes a SRTS program begins without a good understanding of the underlying issues resulting in a less successful program.
• Setting.reasonable.expectations.about.what.the.program.can.do. By knowing the starting point, SRTS programs can set specific and reason-able objectives.
• Identifying. changes. that. will. improve. the.program. Part of evaluation is monitoring what happens throughout the life of a project so that mid-course corrections can be made, if needed, to improve chances of success.
• Determining. if. the. program. is. having. the.desired. results. This is a primary purpose of any evaluation and can be used to inform funding sources, the media, and the public to help build support for SRTS.
There are benefits that extend beyond an individual program. Data collected and shared by local programs can influence future funding at the local, state and national level. Today’s SRTS exists in part because of the evaluations of earlier programs. In the 1970s, Odense, Denmark, initiated SRTS efforts to combat the high rate of pedestrian and bicyclist injuries. Over a 20-year
period, the number of injured school children in Odense decreased 30-40 percent. That success helped lead to the establishment of SRTS programs in the U.S. — first in the Bronx in New York City, then Congressionally-funded pilot programs in Arlington, MA, and Marin County, CA, and then state-level programs in Texas and California, as well as others. Evaluation of the success of those early programs in increasing walking and bicy-cling to school and reducing the numbers of parents driving their children to school, combined with strong demand, spurred Congress to establish the $612 million National Safe Routes to School Program in 2005. Findings from evaluations conducted by local programs will play a similarly important role when policymakers at the national, state, and local levels decide whether and how to continue SRTS programs.
AudienceThis information is intended for all those who have an interest in the success of SRTS programs, particular-ly those seeking information about how to evaluate a local program. This information is written with local program implementers in mind — people who are busy and responsible for many tasks, who do not necessarily have experience with evaluation but are invested in the success of SRTS. It is not expected that readers intend to conduct a scientific research study. The information focuses on ways to gather information about a program’s progress, potential improvements and results that do not take lots of time or necessarily require a specialist.
Ideally, evaluation begins when the SRTS program is in the planning phase. However, the information in this
Around the country, communities are conducting Safe Routes to School (SRTS) programs in order to enable and encourage children to walk and bicycle safely to school. Communities tailor a combination of engineering, education, encouragement and enforcement strategies to address the specific needs of their schools. Evaluation is an important component of any SRTS program. Evaluation is used to determine if the aims of the strategies are being met and to assure that resources are directed toward efforts that show the greatest likelihood of success. Also, evaluation can identify needed adjustments to the program while it is underway. This information describes how to conduct a SRTS program evaluation that is tailored to that program’s objectives and strategies.

Evaluation 8-2
section can be helpful for those with programs at other points, too, such as:
• Applying for funding in order to justify the request.
• Identifying problems and potential solutions if a part of the program is not having the desired impact.
• Conducting or completing a program to be able to identify successes or needed adjustments.
PurposeThis information is designed primarily to assist in the development and implementation of a local SRTS program evaluation plan. It describes how the timing of evaluation corresponds to the life of a program; gives an overview of commonly used ways to collect data, including two ready-to-use data collection instruments (see the student travel tally in Appendix A and parent survey in Appendix B); and then outlines a six step process for SRTS program evaluations.
If initial planning meetings have already taken place or an application for funding has been submitted, it is likely that the first step has already been accomplished. A worksheet (Appendix C) provides a way for program implementers to organize their program information for each step and a completed worksheet (Appendix D) serves as an example.
Every effort has been made to condense this informa-tion to the most vital information needed for a local SRTS program. Readers interested in developing a deeper understanding of evaluation are encouraged to review the Resources section.
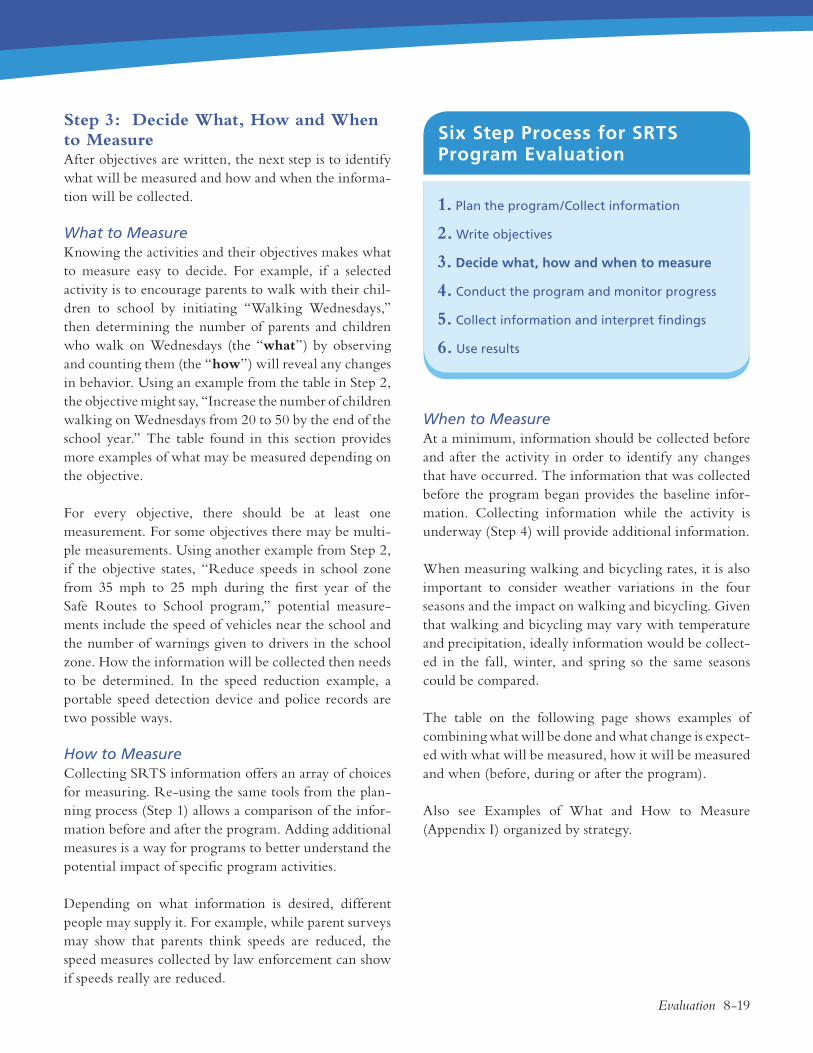
This guide outlines a six step
process along with tools and a
worksheet for developing an
evaluation plan.
1. Plan the program/Collect information
2. Write objectives
3. Decide what, how and when to measure
4. Conduct the program and monitor progress
5. Collect information and interpret findings
6. Use results
Six Step Process for SRTS Program Evaluation

Evaluation 8-3
When and How to Evaluate
Safe Routes to School (SRTS) evaluation plans come in different sizes and shapes to fit different program goals, strategies and resources. This section provides an overview of the times during a SRTS program when evaluation occurs and then provides two evaluation plan options based on those times. The options differ in amount of time and resources required. The bene-fits and drawbacks of each option are provided to assist program implementers in deciding what evaluation plan would work best for their situation.
The.Timing.of.EvaluationThe evaluation process mirrors the lifespan of a program. It ideally begins when the program is initially formu-lated and ends after a program ends. Evaluation helps in different ways at different times in the program’s life. Each time provides important information that can strengthen or improve a program.
Evaluation occurring:
• Before the program collects baseline information and helps plan the program.
• During the program identifies progress and/or challenges and areas needing improvements.
• After the program identifies changes in behav-iors, attitudes and/or the physical environment and informs decisions about the future of the program.
Before the Program Begins Understanding what is happening in a community and around a school requires the collection of baseline infor-mation in order to discover barriers and assets to walk-ing and bicycling and to understand the circumstances before a program takes place. Baseline data collection also serves as a reference point against which to compare conditions during and after the SRTS program, such as the number of walkers. This evaluation stage is also called formative assessment.
During the ProgramThis information gathering occurs while the program or a particular activity is underway. Monitoring what activities are being done during the program is a way to check that a program is doing what it planned to do and to identify improvements to make along the way. It can reveal what is working and what is not and can allow for quick fixes. For example, if the program includes crossing guards and the evaluation reveals that the parents are not obeying them, then there is the oppor-tunity to work toward solving that problem right away. Evaluation during the program usually includes count-ing things such as the number of education sessions taught, the number of walkability checklists completed or the number of fliers distributed — all related to what activities are being conducted. This kind of monitor-ing continues through the life of a program as a way to report on what took place. This evaluation stage is also called process evaluation.
Naples, Florida.
Evaluation ideally begins
when the program is initially
formulated and ends after a
program ends.

Evaluation 8-4
After the ProgramThis data collection occurs after the program or activ-ity is completed and can reveal the program’s effects. The same evaluation tools used to collect data before the program was implemented are used to gather data after the program’s completion. The evaluation consists of measuring changes in knowledge, attitudes, beliefs, behaviors, or the physical or social environment from before the SRTS activity or project occurred to after the activity or project ended (or yearly). This is also called outcome evaluation. Additionally, the project conclu-sion is when the data collected during the program are summarized in order to understand what took place and whether the planned activities were conducted as intend-ed. Summarizing this information helps make sense of the outcome evaluation results because it explains the context in which the results were achieved.
Options.for.EvaluationThis section discusses two evaluation methods for local programs to consider: standard and basic. The standard method of evaluation is the preferred method as it is more comprehensive and allows for adjustments during the program. However, it is understood that not every-one will have the resources for standard evaluation. Therefore, the basic evaluation will also be explained.
Standard.evaluation:Evaluation is done before, during, and after the program.
Basic.evaluation:Evaluation is done before and after the program.
Standard evaluation can be conducted by the program implementers or with the help of a professional evalua-tor. Standard evaluation is ideal since it provides infor-mation throughout the life of the program and can be used to examine the effectiveness of specific strategies. However, for some programs the ideal must be balanced with the time and the resources available. Basic evalua-
tion may be the choice that fits the circumstances.
This information is shaped around standard evalua-tion conducted by the program implementer, since it provides a more complete picture than basic evaluation and does not have the costs associated with engaging an evaluation specialist. However, the worksheets and evaluation tools can be used for either of these evalua-tion plans. Below are descriptions of these options.
Standard Evaluation:
• Data collection is done before, during and after the program (Steps 1, 4 and 5)
• Provides more information for improving the program along the way than basic evaluation
• Provides a better understanding of what worked in the program than basic evaluation
• Requires more time and resources than basic evaluation
The standard method of evaluation is the preferred method as it is
more comprehensive and allows for adjustments during the program.

Evaluation 8-5
Similar to basic evaluation, standard evaluation includes the information collected before and after the program. However, standard evaluation also requires monitor-ing program activities while they are underway. In addi-tion, programs may also choose to add questions to the parent survey or gather other information to learn more about specific issues relevant locally. For example, if speed around the school is believed to be a problem and a public education campaign to remind drivers about appropriate driving speed is planned, then gathering speed data before, during and after the program would make sense.
The diagram above shows how the timing of the data collection relates to the six steps for evaluation.
Standard Evaluation with the Assistance of a Professional Evaluator:
• Ideal for large, complex programs.
• Allows for a more rigorous research design for understanding what worked.
• Requires more resources than standard or basic evaluation conducted by the implementers.
A professional evaluator offers the opportunity for a more rigorous research design which often provides a more valid and reliable picture of what is happening
with the program, why it is happening, and the rela-tionship between the evaluation results and program activities. While involving an evaluator is not necessary or feasible for every program, for some, such as large, multi-component programs, it may be most appropriate. See Working with an Evaluation Specialist (Appendix E) for information on how to find and best use an evalua-tion specialist. More complex evaluation designs require additional considerations of what and how information will be collected. See Evaluation Designs (Appendix F) for more information.
Basic Evaluation:
• Data collection is done before and after the program (Steps 1 and 5)
• Provides the minimum amount of evaluation a program should conduct
• Requires the least amount of time and resources
Basic evaluation includes collecting baseline informa-tion using a student travel tally and parent survey and using these tools again when the program is over. This will enable program implementers to gain insights on attitudes, behaviors, and conditions before a program begins and what changes have taken place after the program. For example, changes in student travel tallies will reveal any increase or decrease in the number of
1. Plan the program/Collect information
2. Write objectives
3. Decide what, how and when to measure
4. Conduct the program and monitor progress
5. Collect information and interpret findings
6. Use results
Standard EvaluationCollects data during steps 1, 4 and 5.
BEf
oR
ED
uR
ing
AfT
ER
Six Step Process for SRTS Program Evaluation
1. Plan the program/Collect information
2. Write objectives
3. Decide what, how and when to measure
4. Conduct the program
5. Collect information and interpret findings
6. Use results
Basic EvaluationCollects data during steps 1 and 5.
BEf
oR
ED
uR
ing
AfT
ER

Evaluation 8-6
Basic Evaluation TipsWhen time and resources are very limited, some basic steps can help.
Local programs often have many responsibilities, just one of which is monitoring the progress and effects of their Safe Routes to School (SRTS) program. If time and resources are very limited, collecting data before and after the program can provide information to help guide program planning, understand the progress and identify next actions. This basic evalu-ation calls for data collection during Steps 1 and 5 of the standard evaluation process.
Note: Using the SRTS student travel tally (Appendix A) and parent survey (Appendix B) developed by National Center for Safe Routes to School enables programs to use online tools at www.saferoutesinfo.org/tracking to enter data, generate reports and summarize results.
Before the ProgramCollect Baseline InformationBefore starting any SRTS activities:
Use a student travel tally and parent survey to identify current student walking and bicycling rates and parent attitudes toward children walking or bicycling to school. Compile the information. Baseline information from the tools in this section can be entered onto Web-based tools at www.saferoutesinfo.org/tracking to summarize information and create basic reports. Ask the school principal to describe:
the main walking and bicycling routesany safety concernsany known pedestrian or bicyclist crashes in recent pastany rules relating to walking/bicycling to school
Assess the main walking and bicycling routes. Walk the main routes that students take or would take when walking of bicycling to school looking for any safety concerns and other potential barriers.
Use Results to Inform SRTS Program PlanUse information to determine strategies and goals. Correct unsafe conditions before conducting encouragement activities.
After the ProgramCollect Information Again at the End of the ProgramCollect the student travel tally and parent survey information again. Enter the data into the Web-based tools at www.saferoutesinfo.org/tracking. These tools can generate reports that compare findings. If engineering improvements were made, reassess the walking and bicycling routes affected with the audit checklist.
Compare Results Collected Before and After the Program to Identify ChangesDid walking and bicycling increase? Did parents’ attitudes change? Did safety improvements occur? Did parents recognize these improvements?
To plan and conduct a more thorough evaluation that could provide deeper insights on a program’s achievements and results, see standard evaluation.
•
•
•••••
•
students walking or bicycling to school, and the respons-es to the parent survey will reveal any changes in parent attitudes toward walking and bicycling to school.
The diagram on the previous page shows how the timing of the data collection relates to the six steps for evaluation.

Evaluation 8-7
Who Will Be Involved in the Evaluation? One person cannot do all the planning for evaluation alone. The group responsible for planning and conduct-ing the Safe Routes to School (SRTS) program will also most likely be responsible for evaluation. The following stakeholders all can play important roles.
Implementers:Those involved in running the SRTS program.
Partners:Those who support the program with resources, such as finances or time
Participants:Those served or affected by the program, including students, parents/caregivers or neighbors.
Decision-makers:Those in a position to do or decide something about the program.
Professional.evaluators:Those whose assistance is required if a complex research design or data analyses is planned. (See Appendix E.)
SRTS.program.leader:The person who oversees the evaluation process and convenes the stakeholders.
Sharing Information as it is CollectedSince each stage of evaluation provides important infor-mation that can strengthen or improve a program, the results need to be put to use as soon as possible at each stage:
Before.the.program:Helps inform the program objectives and activities so the findings can be shared with those who can get the program started.
During.the.program:Identifies what is or is not working while the program is being conducted. These results should be shared with those who can make mid-way changes to the program to improve it.
After.the.program:Highlights the changes since the program began. These results need to be shared with those that can re-fund the program or make other decisions about whether to expand or change the program.

Evaluation 8-8
Collecting Safe Routes to School Information
Now is when a program begins to consider what kind of information will be collected for evaluation. There are many ways to gather information that will inform and evaluate a Safe Routes to School (SRTS) program. This section describes the types of informa-tion collected and the methods for collecting it. The next section will integrate what these methods are and when these different methods might be used.
Kinds.of.Information.to.CollectThere are two kinds of information that will be collected:
NumbersThis is also called quantitative data. A good exam-ple of this type of data is tallies of how students arrive at school.
WordsThis is also called qualitative data. A good example of this type of data is what a principal says about traf-fic safety around the school during an interview.
Results of some data collection methods, such as surveys or observations, may be either numbers or words depend-ing on the type of questions asked. Quantitative data is sometimes easier to handle — numbers from surveys are entered, totaled and compared. However, qualitative data offers a richer understanding of the how or why behind quantitative findings. For example, interviews with parents who participate in a walking school bus help reveal why they choose to be involved and how the walking school bus improves their perception of traffic safety. Interview questions can collect personal opinions or experiences; however, the answers may not necessar-ily reflect reality. For example, the question “Do walking school buses keep children safe?” can best be answered with data rather than personal opinion. Both quanti-tative and qualitative data are useful and can inform each other so that together they paint a more complete picture. The type of information collected (quantitative or qualitative) becomes important later when it is time to interpret findings because they will be analyzed in different ways.
Ways.to.Collect.InformationThere are five ways often used by SRTS programs to collect information:
1. Tallies/counts2. Surveys3. Observations and audits4. Interviews5. Existing data sources
1. Tallies/CountsTally forms are simply ways to count numbers of people or things. Tally forms can answer a question that every SRTS program needs to be able to answer: How do students travel to and from school? Tallies can be used to count the number of children traveling to and from school using different modes of travel, such as walk-ing, bicycling, bus, private vehicle, etc. Travel behav-ior enables a program to measure changes after SRTS activities. It also provides a means of identifying which
Both quantitative and qualitative
data are useful and can inform
each other so that together they
paint a more complete picture.

Evaluation 8-9
modes of travel to target and gives a general understand-ing of the school travel environment.
School Travel Tally FormsStudent travel tally forms (Appendix A) developed by the National Center for Safe Routes to School are available for download and use. There is a 1-page tally sheet that teachers complete and online tools (www.saferoutesinfo.org/tracking) that generate a cumulative report for the entire school. Basic steps for use are to the right.
2. SurveysSurveys or questionnaires are commonly used in eval-uation. They provide a low-cost way to obtain infor-mation from many people in a relatively short amount of time, and they allow responses to be anonymous. Surveys may be distributed in many ways such as paper and pencil, telephone, e-mail messages, or over the Internet. Questions for a survey need to be carefully written and ideally pre-tested with potential respon-dents to be sure that the questions are understandable and that the answers will provide the kind of informa-tion sought. Entering survey data and generating results can be time consuming. The parent survey (described below and at box at right) developed by the National Center for Safe Routes to School has a Web-based entry tool (www.saferoutesinfo.org/tracking) that automati-cally summarizes results.
Parent surveys can answer the question: What are the attitudes and issues that may influence how students get to and from school? Understanding why students are or are not walking and bicycling is important. A survey may reveal that parents or caregivers perceive it is unsafe for their children to walk or bicycle. Then the job for a local program is to determine if the perception is reality. If safety is an issue, strategies to fix the unsafe conditions are needed. If it is a perception of a safety issue rather than a real danger, then strategies to correct such mispercep-tions are needed. Without this information, the local program might focus efforts on an issue that will not result in significant improvements.
Parent SurveyA parent survey (Appendix B) developed by the National Center for Safe Routes to School is available for down-
load and use. The survey includes questions about what affects parents’ decisions to let children walk or bicycle to school, the presence of factors that might influence parents’ decisions, and parents’ perceptions of safety related to walking or bicycling to school.
Completion of the survey requires about 5 to 10 minutes. Basic steps for use are above.
Instructions:
For two days of one week, teachers ask students how they got to school that day and how they got home the previous day.
Students raise their hands for each mode (walk, bike, car, etc) of travel and the teacher records the counts.
The in-class tally sheets are collected and the cu-mulative results are added up. This can be done by entering information into an online data entry tool (www.saferoutesinfo.org/tracking).
The summary tool also displays some basic analy-sis information, such as graphically comparing the amount of walking or biking during the morning and the afternoon.
•
•
•
•
Safe Routes to School Student Travel Tally forms
Instructions:
The survey can either be sent home with students for their parents or caregivers to complete or can be distributed as part of parent-teacher conferences.
Surveys are returned to teachers, who then submit them (often to the SRTS program implementer) to be summarized.
An online tool (www.saferoutesinfo.org/tracking) assists local program leaders in data entry and sum-marizing the survey results.
•
•
•
Safe Routes to School Parent Survey

Evaluation 8-10
3. Observations and AuditsInformation can be gathered by both observing the physical environment and the behaviors of people like pedestrians, bicyclists and drivers. There are many existing tools available, such as walkability and bike-ability checklists and instructions for conducting a walk or bicycle audit (go to www.saferoutesinfo.org/guide/ engineering and click on School Route Maps and the Tools to Create Them in the menu). The tools range from those designed for use by the general public to detailed, technical audits intended for transportation professionals.
4. InterviewsThis may include interviewing people one-on-one or in groups. Individual interviews may be informal, such as chatting with parents when they drop off children at school, or formal interviews with a principal, town planner, or another stakeholder using pre-planned ques-tions. A benefit of interviewing is that it will render more specific information about a person’s experience, opinions or knowledge than a survey. On the other hand, it can be time consuming and responses are not necessarily anonymous.
5. Existing Data SourcesExisting data sources can reveal important information, especially before a program begins. There are many potential sources with a variety of helpful information. Statistics about pedestrian and bicycle crashes may be available from local or state injury prevention programs, hospitals or law enforcement agencies. The school or town may already have a walking route map, and poten-tially, the school or local health agency may already ask students about their attitudes and behaviors regarding physical activity which would eliminate the need to collect some data. The school may also have records that reveal how many students live within walking and bicycling distance.
Evaluation StandardsThere are four important questions to consider during the entire process of evaluation. These four questions summarize key evaluation standards (see Resources) of utility, feasibility, accuracy and propriety which are important to consider before moving forward with an
evaluation plan.
Is the evaluation useful?The amount and type of information collected should meet the needs of those who intend to use the evalu-ation findings. If not, there is no need to collect the data. For example, collecting student body weight data would only make sense if the program included increas-ing physical activity among its goals.
Is the evaluation feasible?The evaluation should be possible and realistic to complete. The information must be collectable with-in the needed timeframe and costs must fall within a reasonable budget.
Is the evaluation accurate?The evaluation findings should be correct. For exam-ple, if an observation of student arrival only counted students arriving on one street but not another street,
One of the best ways to understand walking and bicy-cling safety issues at a particular school is by observing students arriving or departing during a normal school day. This includes observing children as they walk or bike the routes to school, how they cross streets, the interactions they have with cars and buses on the school campus, and how they make their way to the school door. The goal is to identify two main things:
The physical environment for walking and bicycling both on the school campus and in the surrounding area; and
The behaviors of pedestrians, bicyclists and motor-ists and buses.
A good way to start is in a neighborhood near the school. Follow the route the students are taking. Upon arrival on school campus, walk in a loop to observe all locations and forms of behavior. Jot down things that need to be addressed. Have an observer at the main entrance fifteen minutes prior to school starting and the first fifteen minutes when school is dismissed.
•
•
observation of a School: Student Arrival or Departure

Evaluation 8-11
then the findings would not be a complete, true picture of student travel.
Is the evaluation fair?The evaluation has to be conducted with awareness of the rights of the people involved in the program. For example, no one should be singled out or made to feel uncomfortable because of how they respond to a question.
Working with SchoolsData collection, such as student travel to and from school or surveys of parents, will require close coordination with the school. For example, schools may have rules about collecting information from students and it will require time from teachers, school staff and administra-tion in order for data collection to be a success.
Collecting data from students can be challenging. Be aware that data are routinely collected from students to meet state requirements and additional requests may be difficult to accommodate. Furthermore, parent permis-sion may be needed before surveying students. The following tips come from program implementers who have fostered relationships that have eased the way for data collection:
• Learn and act on the permission requirements early if students are to be surveyed.
• Develop a relationship with and gain the under-standing of the school board and school principal as to why Safe Routes to School (SRTS) is impor-tant and how data collection will help.
• Learn what data is already being collected in what manner and see if there is a way to coordinate efforts.
• Find a key supporter of the SRTS data collection efforts in the administrative office.

Evaluation 8-12
Evaluation in Six Steps
Step.1:.Plan.the.Program/Collect.InformationPlanning for evaluation should start when the program is in its very beginning phase. For programs already underway, the components of this step may already be accomplished. This step includes the following actions (not necessarily in this order):
• Defining the program’s goal(s)
• Collecting baseline data and understanding current walking and bicycling conditions
• Picking activities
If these actions are done, move on to Step 2. If not, this section will explain why and how to accomplish these tasks.
1a. Defining the Program’s Goal(s)Knowing what to evaluate requires that a local program knows what it wants to achieve in the long term. A goal is a broad statement of the program’s purpose. It may be the first decision made before launching a program. Sometimes baseline data and other information are collected first and those findings drive the goal.
Deciding on the program’s goal requires input from all stakeholders. A local program may have one or more goals. The goal(s) may be tailored to a community’s particular interests or needs or chosen from the stated purposes or desired outcomes of the Safe Routes to School National Program.
Planning for evaluation should
start when the program is in its
very beginning phase.
1. Plan the program/Collect information
2. Write objectives
3. Decide what, how and when to measure
4. Conduct the program and monitor progress
5. Collect information and interpret findings
6. Use results
Six Step Process for SRTS Program Evaluation
Ideally, planning a Safe Routes to School (SRTS) program and planning its evaluation are done together. For local programs just starting to talk about SRTS, it is the right time to be thinking about how progress and results will be measured. If a local program has already spent time developing a plan and collecting information about what is happening that is related to walking and bicycling to school, then the first step of evaluation most likely has occurred even if no one considered it to be evaluation.
A six step process for conducting an evaluation is described in detail in this section. Program implementers may choose to record their local program information on the downloadable blank worksheet (Appendix C). An example school (Appendix D) is used to demonstrate how an evaluation might be planned using the worksheet.

Evaluation 8-13
The purposes of the Safe Routes to School National Program stated in the Federal legislation are:
• To enable and encourage children, including those with disabilities, to walk and bicycle to school.
• To make walking and bicycling to school a safer and more appealing transportation alternative, thereby encouraging a healthy and active lifestyle from an early age.
• To facilitate the planning, development and implementation of projects and activities that will improve safety and reduce traffic, fuel consump-tion and air pollution in the vicinity of schools.
The desired outcomes of the Safe Routes to School National Program are:
• Increased bicycle, pedestrian and traffic safety
• More children walking and bicycling to and from schools
• Decreased traffic congestion
• Improved childhood health
• Reduced childhood obesity
• Encouragement of healthy and active lifestyles
• Improved air quality
• Improved community safety
• Reduced fuel consumption
• Increased community security
• Enhanced community accessibility
• Increased community involvement
• Improvements to the physical environment that increase the ability to walk and bicycle to and from schools
• Improved partnerships among schools, local municipalities, parents and other community groups, including non-profit organizations
1b. Understanding Local Walking and Bicycling ConditionsBefore beginning a SRTS program, it helps to have an understanding of current circumstances that may influ-
ence walking and bicycling to school. These include both assets that make a community supportive of chil-dren walking and bicycling, as well as barriers that make it difficult or unsafe. The information helps generate ideas about how to run the program in order to capital-ize on assets and overcome barriers. For example, assets revealed through this process may be financial support or resources, such as volunteers to help run the activities or a local media outlet or business that wants to cham-pion the cause.
Collecting data about the current situation is equally important and serves as baseline data that can be used for comparison after SRTS activities have been conducted. For example, the walkability of a particular route or parental attitudes toward walking and bicycling may be assessed before a program begins. These same measures should be repeated after the program has been imple-mented to see if a change occurred.
There are pieces of information to collect that will paint the picture of local conditions, including:
School.information:School information includes particular characteris-tics about a school and its circumstances that influ-ence walking and bicycling by students. Examples include policies, school district boundaries or stag-gered dismissal times.
Walking.and.bicycling.numbers:This information includes the number of students
Mike Cynecki
Anchorage, Alaska.

Evaluation 8-14
walking and bicycling to school and the number that live close enough that walking and bicycling would be an option if all other conditions, like safety or convenience, were met.
Safety.issues:Safety issues may include traffic, personal safety and lack of facilities, such as sidewalks, bike paths, cross-walks, or bicycle racks.
Attitudes.about.walking.and.bicycling:Parents, children and school staff all have attitudes about walking and bicycling that influence their behavior. For example, if parents believe that chil-dren are more attentive at school if they walk, then this may motivate them to walk to school with their child.
Other.assets:There can be financial support or resources, such as volunteers to help run the activities or a local media outlet that wants to champion the cause. Assets to consider include:• Sources for grant money• Sources for volunteer support• Local government resources (particularly needed
for built environment changes, such as sidewalks)• Local business support• Media interest
Tools to Use for Collecting Information:• The student travel tally will reveal current walk-
ing and bicycling counts. • The parent survey will uncover attitudes about
walking and bicycling and provide insight into what kinds of actions might increase the number of children walking and bicycling.
• The walking and bicycling route assessment is an important way to identify safety and other prob-lems on travel routes.
• An interview. with. the. school. principal or someone else who knows about children’s travel to and from school. Information to considering gath-ering includes:• The number of children who live within walk-
ing or bicycling distance• How the school district defines walking and
bicycling distance• School personnel who might be interested in
participating in a SRTS program• Rules or policies that impact travel to school
Other Ways to Learn About Current ConditionsThere are many other worthwhile ways to gather infor-mation about current conditions, including:
• Survey the community regarding their views on walking and bicycling to school.
• Interview different groups, including:• Stakeholders: Ask what they see as the strengths
and weaknesses in the community with regard to SRTS.
• Students: Ask what might persuade them to walk or bicycle to school.
• School Resource Officer or other local law enforcement officers: Ask them to identify potentially unsafe intersections or driver and pedestrian behaviors.
• School board members: Ask for their sugges-tions regarding strategies.
• School nurse: Ask about health and safety bene-fits and concerns related to walking or bicycling to school.
• Crash reports from the local police department• Student attitude surveys• Discussions with groups of parents or parent
interviews
Collecting data about the current situation is equally important and
serves as baseline data that can be used for comparison after Safe
Routes to School activities have been conducted.

Evaluation 8-15
Example School
In this example, the school knew their first goal was to increase safe conditions for walking and bicycling to school. The information collected about local conditions and issues helped them set their other goal to reduce traffic congestion.
Safe Routes to School Program Evaluation PlanSchool: High Hopes Elementary School
1. Program Planning Information
1a. Program goal(s):
Increase safe walking and bicycling to schoolReduce traffic congestion around school
1b. Local conditions and issues (formative assessment):
(1) School information:
Half of school enrollment lives within a mile of schoolSchool has no policies against walking or bicycling
(2) Walking and bicycling numbers:
10 percent of children walk or bicycle to school(3) Safety issues:
Principal stated that one child was hit by a car last year in the crosswalk.Police stated that speeding was a problem; using radar gun to determine speeds, they determined that the average driver is going 35 mph instead of 25 mph through school zone during morning arrival.Observation of school campus during morning arrival showed traffic congestion around drop-off area to be a problem for walkers and bicyclists.Walk audit of routes to school showed good conditions for walking.
(4) Attitudes affecting walking and bicycling:
Parent survey rated safety as main concernDiscussions with parents showed interest in their children being able to walk to school if adult supervision provided
(5) Other assets that can benefit the program:
Opportunity to receive grant to fund programParents willing to provide volunteer help
Conclusions:
Strategies to increase walking and bicycling to school should include adult supervision.Efforts are needed to reduce speeds around the school.Drop-off and pick-up area is a problem.
••
••
••
•
•
••
••
•••

Evaluation 8-16
1c. Activities or StrategiesThe program reaches its goals through activities or strat-egies. Examples of activities include initiating walking school buses, fixing broken sidewalks and focused speed-ing enforcement in school zones. There are many strate-gies that may be included in a SRTS program and more than one strategy may be needed to achieve any one goal. For example, to reach the goal of increased knowl-edge, educational strategies may be initiated. To achieve the more complex goal of the changing behaviors of drivers, pedestrians or bicyclists, education, encourage-ment, enforcement and engineering strategies together may be needed. The following are examples of some of the possible program activities divided into categories often used by SRTS programs: education, encourage-ment, engineering and enforcement. For more informa-tion see www.saferoutesinfo.org/guide.
Education Activities: • Safety games or safety trainings• Materials for parents to teach safety to children
• Classroom programs• Materials for drivers near schools or drivers’ safety
training
Encouragement Activities:• Walking school buses• Walk and Wheel Wednesdays• Incentive programs• Mileage clubs • Walk to School Day
Engineering Activities:• Sidewalks or paths• Signs or signals• Rerouting of pick-up and drop-off areas away
from walkers
Enforcement Activities:• Crossing guards• Campaign to reduce speeds around schools• Neighborhood Hotline
Example School
This school decided to take a comprehensive approach and identified more than one strategy for each of education, encouragement, engineering and enforcement.
Safe Routes to School Program Evaluation PlanSchool: High Hopes Elementary School
1. Program Planning Information
1c. Program Activities
Education Strategy:
Provide basic bicycle and pedestrian safety classroom lessons to school children, reinforced by take-home safety sheets for parents as well as a map of existing safe walking and biking routes.Encouragement Strategy:
Start a Walk and Wheel Wednesday program that includes organized walking school buses and an incentive program.Engineering Strategy:
Reroute parent drop-off area away from walkers and bicyclists, including improving the pedestrian crosswalk to school site.Enforcement Strategy:
Develop a Parent Driver Safety Campaign that includes a school zone speed enforcement program and a clear enforcement message.

Evaluation 8-17
Step.2:.Write.ObjectivesAt this point, the program’s goal(s) are set, information relating to current walking and bicycling has been exam-ined and activities have been selected. The next step is to write objectives for the activities. Objectives describe what is expected for both while the program is underway and after the program or an activity is completed. This information will ultimately help program implementers know if they have achieved what was intended.
There are two different kinds of objectives:
1. Those that describe what. will. be. done, such as Walk to School events, called process.objectives.
2. Those that describe what. change. is. expected or desired as a result of what has been done called outcome.objectives.
Selected program activities need to have both process and outcome objectives. In general, objectives should include specific information about what is to happen, to
Activity Objectives: What will be done Objectives: What change is expected
Initiate Walking Wednesday
Distribute 100 fliers announcing the Walking Wednesday program during first two months of the activity.
Increase the number of children walking on Wednes-days from 20 to 50 by the end of the school year.
Promote Safe Routes to School (SRTS)
Present information on the SRTS program at PTA meeting and place article in school news-letter during first two months of the activity.
Increase parental support of SRTS by 50% by the end of the school year as measured by changes to the parental support question in the parent survey.
Conduct Pedestrian Safety Education
Deliver safety presentations to all 4th grade classes within one year.
85% of 4th Graders pass a walking safety knowledge test within one year.
Promote Bicycle Helmet Use
Custom-fit 50 helmets for bicyclists during the fall semester.
Increase students wearing bicycle helmets from 20% to 60% by end of school year.
Install Sidewalks Get sidewalk improvements listed on city plan during the school year.
Complete all sidewalk gaps along the 4 major desig-nated safe routes to school within a three year period.
Install Bicycle Rack Install two bike racks at the school by end of the fall semester.
Increase the percent of children bicycling to school from 1% to 5% within 3 years.
Conduct Bicycle Security Education
Teach 80% of bicycle riders how and why to properly lock their bicycles by the end of fall semester.
Decrease the percent of parents from 18% to 10% who identify “security concerns” as a barrier to allow-ing their child to ride a bicycle to school by the end of the spring semester.
Encourage Speed Reduction
Hold one news conference and deliver infor-mational fliers to all school parents within two months of start of the activity.
Reduce speeds in school zone from 35 mph to 25 mph during the first year of the SRTS program.
Enforce Parking Regulations
Place 50 information cards on illegally parked cars during the first three months of activities.
Reduce illegal parking during arrival and dismissal by 60% by the end of the school year.
1. Plan the program/Collect information
2. Write objectives
3. Decide what, how and when to measure
4. Conduct the program and monitor progress
5. Collect information and interpret findings
6. Use results
Six Step Process for SRTS Program Evaluation
whom, by when, and in what amount. These are some-times called SMART (specific, measurable, achievable, relevant, time-bound) objectives (see Appendix G). The table below provides examples of the two types of objectives that can be tailored to fit a local program.

Evaluation 8-18
Example School
The example shows how the school is developing the evaluation plan for their encouragement strategies. Objectives are divided into “What will be Done” and “What Change is Expected.” The time frame for when this will happen is also filled in. The completed worksheet shows the evaluation plan for all the strategies. In the next step, “What will be Measured” and “How and When It will be Measured” will be completed.
Safe Routes to School Program Evaluation PlanSchool: High Hopes Elementary School
Encouragement Strategy:Start a Walk and Wheel Wednesday program that includes organized walking school buses and an incentive program.
Time Frame:
Kick-off in October (International Walk to School Month) and promote weekly through school year
Data Collectors:
What will be Done What will be Measured How and When it will be Measured
Five walking school buses established
An average of 50 students participate in Walk and Wheel Wednesdays program
A six-week long incentive program with 50 children participating
Change Expected What will be Measured How and When it will be Measured
20 percent increase in children walking or bicycling to school on Wednesdays
Notes:
Evaluation 8-19
Step.3:..Decide.What,.How.and.When.to.MeasureAfter objectives are written, the next step is to identify what will be measured and how and when the informa-tion will be collected.
What to MeasureKnowing the activities and their objectives makes what to measure easy to decide. For example, if a selected activity is to encourage parents to walk with their chil-dren to school by initiating “Walking Wednesdays,” then determining the number of parents and children who walk on Wednesdays (the “what”) by observing and counting them (the “how”) will reveal any changes in behavior. Using an example from the table in Step 2, the objective might say, “Increase the number of children walking on Wednesdays from 20 to 50 by the end of the school year.” The table found in this section provides more examples of what may be measured depending on the objective.
For every objective, there should be at least one measurement. For some objectives there may be multi-ple measurements. Using another example from Step 2, if the objective states, “Reduce speeds in school zone from 35 mph to 25 mph during the first year of the Safe Routes to School program,” potential measure-ments include the speed of vehicles near the school and the number of warnings given to drivers in the school zone. How the information will be collected then needs to be determined. In the speed reduction example, a portable speed detection device and police records are two possible ways.
How to MeasureCollecting SRTS information offers an array of choices for measuring. Re-using the same tools from the plan-ning process (Step 1) allows a comparison of the infor-mation before and after the program. Adding additional measures is a way for programs to better understand the potential impact of specific program activities.
Depending on what information is desired, different people may supply it. For example, while parent surveys may show that parents think speeds are reduced, the speed measures collected by law enforcement can show if speeds really are reduced.
When to MeasureAt a minimum, information should be collected before and after the activity in order to identify any changes that have occurred. The information that was collected before the program began provides the baseline infor-mation. Collecting information while the activity is underway (Step 4) will provide additional information.
When measuring walking and bicycling rates, it is also important to consider weather variations in the four seasons and the impact on walking and bicycling. Given that walking and bicycling may vary with temperature and precipitation, ideally information would be collect-ed in the fall, winter, and spring so the same seasons could be compared.
The table on the following page shows examples of combining what will be done and what change is expect-ed with what will be measured, how it will be measured and when (before, during or after the program).
Also see Examples of What and How to Measure (Appendix I) organized by strategy.
1. Plan the program/Collect information
2. Write objectives
3. Decide what, how and when to measure
4. Conduct the program and monitor progress
5. Collect information and interpret findings
6. Use results
Six Step Process for SRTS Program Evaluation

Objectives What to Measure How and When to Measure
Initiate Walking Wednesday
Distribute 100 fliers to parents announcing the Walking Wednesday program within the first 3 months of school. (What will be done)
Number of fliers distributed Count of distributed fliers (During)
Increase the number of children walking on Wednesdays from 20 to 50 within 1 year. (Change expected)
Number of students walk-ing on Wednesdays
Classroom travel survey on WednesdaysObservational count of students walking on Wednesdays (Before*, during and after)
••
Install Sidewalks
Get sidewalk improvements on city plan within 1 year. (What will be done)
Presence of sidewalk im-provements on city plan
Existing data on city plan (During)
Complete gaps in sidewalks along routes to school within 2 years. (Change expected)
Presence and quality of sidewalks
ObservationWalkability assessment (Before* and after)
••
Install Bicycle Rack
Install two bike racks at the school within 1 year. (Change expected)
Number of bike racks at the school
ObservationSchool audit (Before* and after)
••
Encourage Speed Reduction
Hold one news conference and deliver infor-mational fliers to all school parents regarding speed awareness campaign within the first 3 months. (What will be done)
Number of news confer-ences and fliers distributed
Count of news conferences and fliers distrib-uted (During)
Reduce average speeds in school zone from 35 mph to 25 mph within 1 year. (Change expected)
Speed of vehicles near schoolNumber of citations given
•
•
Portable speed detection deviceRecords from local law enforcement agency (Before*, during and after)
••
Enforce Parking Regulations
Place information cards on illegally parked cars warning drivers of the danger they create during first 6 months. (What will be done)
Number of cards distributed Count of cards distributed (After)
Stop illegal parking during arrival and dis-missal within 1 year. (Change expected)
Number of illegally parked cars
Observational count (Before*, during and after)
Conduct Pedestrian Safety Education
Deliver safety presentations to all 4th grade classes within 1 year. (What will be done)
Number of classes receiving presentations
Count of presentations (After)
All 4th graders pass a walking knowledge quiz within 1 year. (Change expected)
Score on quiz Paper and pencil quiz (Before* and after)
Promote Bicycle Helmet Use
50 helmets are custom fit for students within 1 year. (What will be done)
Number of helmets fitted Count of helmets distributed (After)
Increase percentage of student bicyclists wearing helmets from 20% to 60% within 1 year. (Change expected)
Number of bicyclists with helmets
Observational count of bicyclists with helmetsSurvey of bicyclists (Before*, during and after)
••
Encourage Yielding to Pedestrians
Distribute 100 fliers about meetings and activities to neighborhood during first month of school. (What will be done)
Number of neighborhood residents who attend meet-ings
Sign in sheet at meetings (During)
Improve percent of drivers yielding to pe-destrians from 30% to 70% within 1 year. (Change expected)
Driver behavior around school at school arrival and departure times
Observation of drivers yielding to students within school zones at school arrival and depar-ture times (Before* and after)
* Use the student tally and parent survey to capture this information before the program begins.
Evaluation 8-21
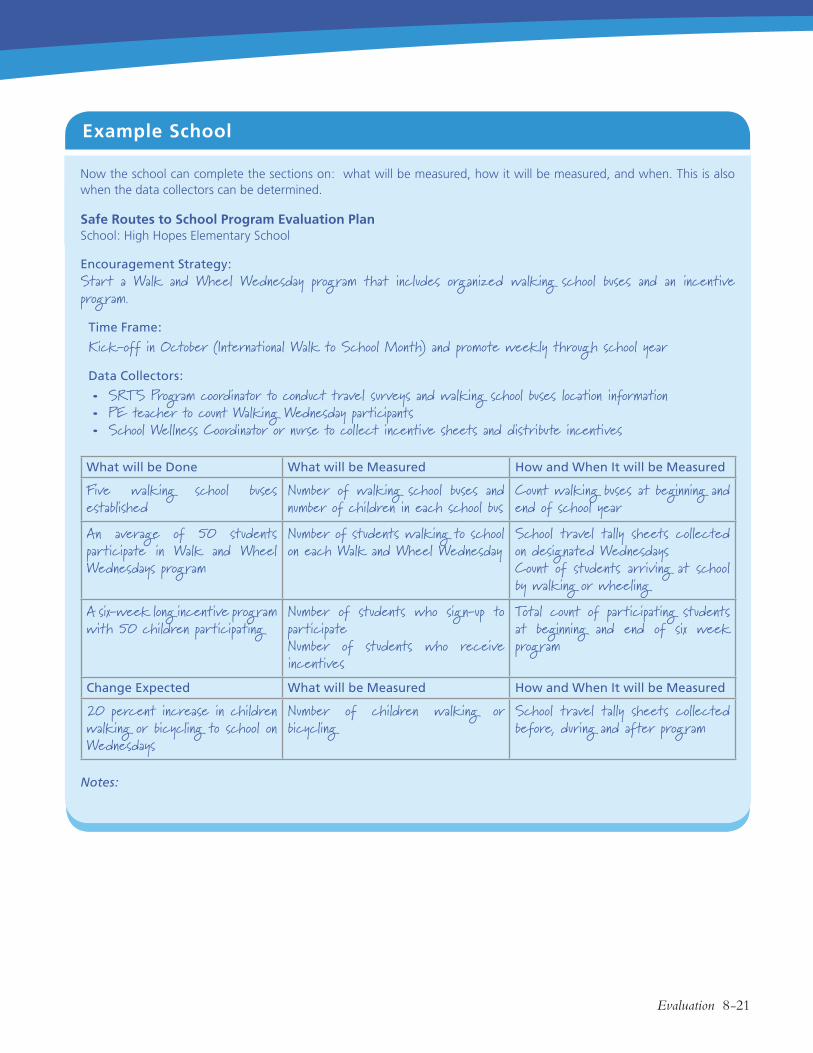
Example School
Now the school can complete the sections on: what will be measured, how it will be measured, and when. This is also when the data collectors can be determined.
Safe Routes to School Program Evaluation PlanSchool: High Hopes Elementary School
Encouragement Strategy:Start a Walk and Wheel Wednesday program that includes organized walking school buses and an incentive program.
Time Frame:
Kick-off in October (International Walk to School Month) and promote weekly through school year
Data Collectors:
SRTS Program coordinator to conduct travel surveys and walking school buses location informationPE teacher to count Walking Wednesday participantsSchool Wellness Coordinator or nurse to collect incentive sheets and distribute incentives
What will be Done What will be Measured How and When It will be Measured
Five walking school buses established
Number of walking school buses and number of children in each school bus
Count walking buses at beginning and end of school year
An average of 50 students participate in Walk and Wheel Wednesdays program
Number of students walking to school on each Walk and Wheel Wednesday
School travel tally sheets collected on designated Wednesdays Count of students arriving at school by walking or wheeling
A six-week long incentive program with 50 children participating
Number of students who sign-up to participateNumber of students who receive incentives
Total count of participating students at beginning and end of six week program
Change Expected What will be Measured How and When It will be Measured
20 percent increase in children walking or bicycling to school on Wednesdays
Number of children walking or bicycling
School travel tally sheets collected before, during and after program
Notes:
•••

Evaluation 8-22
Step.4:.Conduct.the.Program.and.Monitor.ProgressStep 4 is when the program’s progress will be monitored using the process developed in Step 3. Monitoring or tracking usually involves counting or describing activi-ties. Examples include:
• Counting participants at a bicycle rodeo event.
• Observing crossing guard locations to determine improved safety or increased use.
• Observing a student pick-up location for improved safety or reduced numbers of vehicles.
• Interviewing a walking school bus leader to learn about safety issues or whether parents and students are enjoying the walking school bus.
The intent is to put results into action to improve the program while the program is underway. For example, counting participants at a bicycle rodeo event may reveal that the number of participants is lower, higher or about the same as what was planned. If participant numbers were low, having this information would allow for
Example School
For this school, the interim results indicate that the strategies may be starting to work but that more effort needs to be put into informing parents.
Safe Routes to School Program Evaluation PlanSchool: High Hopes Elementary School
4. Conduct the Program and Monitor Progress
Findings during the program:
Students were unaware of safe walking and bicycling behaviorStudents and families were unaware of existing safe routes to schoolThree walking school bus routes establishedPolice report speeding is reduced by some but not all driversParents interviewed unaware of speed enforce-mentIncentive program increases participation in Walk and Wheel Wednesday programParents do not yield to pedestrians in crosswalk
•
•
••
•
•
•
additional promotion or other strategies to address the shortfall before the next bicycle rodeo. Finding partici-pation to be higher than planned may mean that addi-tional volunteers or equipment will be needed for the next rodeo. When the program ends, this tracking will also make it possible to summarize all activities.
1. Plan the program/Collect information
2. Write objectives
3. Decide what, how and when to measure
4. Conduct the program and monitor progress
5. Collect information and interpret findings
6. Use results
Six Step Process for SRTS Program Evaluation
Recommendations for adjustments:
Reinforce student safety presentations with hands-on safety eventsIdentify two more routes for walking school busesGet media coverage of enforcement effortsSend information home to parents about enforcement effortsIntroduce different incentive programs throughout the school yearCrossing guard needs to be stationed at crosswalk
•
•••
•
•

Evaluation 8-23
Step.5:.Collect.Information.and.Interpret.FindingsWhen the program is over or at a logical evaluation point, like the end of the school year, it is time to exam-ine both whether activities were carried out as intended and whether the results met expectations. This is when data collected in Step 1 is collected again in the same manner as originally collected. Once data are collected, the results are interpreted.
The Interpretation ProcessInterpreting results, also called data analysis, does not have to be hard or complex. The process for analy-sis mainly depends on whether the data is words (like quotes from interviews) or numbers (like responses to survey questions). Some forms of data require little to no analysis, such as direct quotes from an interview with a traffic engineer before and after a traffic improvement.
A brief summary of how to analyze results is included here. More complex analyses may require working with an evaluation specialist.
Interpreting Number-Based InformationThe basic steps include:
1. Entering the data into Microsoft Excel, Access, Epi Info or other programs.
2. Checking for data entry errors. A common meth-od is to enter all or some of the data twice to see if it matches and fix any errors detected.
3. Tabulating the data (e.g., calculate the number of participants or percentage of participants who walked to school every day or at least one day per week).
4. Sorting data by sub-groups (like grade or gender).
5. Making comparisons with program objectives, with a comparison site (if one has been identified), or with other Safe Routes to School programs.
Adapted from the CDC Physical Activity Evaluation Handbook (www.cdc.gov/nccdphp/dnpa/physical/ handbook).
Interpreting Word-Based InformationBasic analysis of word-based information (respondents’ verbal answers in interviews, focus groups, or written commentary on surveys) includes:
• Reading through all the data.
• Organizing comments into similar categories (e.g., concerns, suggestions, strengths, weaknesses, similar experiences, recommendations, etc.).
• Labeling the categories or themes.
• Attempting to identify patterns in the themes. For example, parents who walked a particular route with their child to school all felt the route was safe.
Adapted from the Basic Guide to Program Evaluation (www.managementhelp.org/evaluatn/fnl_eval.htm# anchor1665834).
1. Plan the program/Collect information
2. Write objectives
3. Decide what, how and when to measure
4. Conduct the program and monitor progress
5. Collect information and interpret findings
6. Use results
Six Step Process for SRTS Program Evaluation
Interpreting results, also called
data analysis, does not have to
be hard or complex.

Evaluation 8-24
Once the analysis is complete, conclusions can be drawn and outcomes summarized. Below are a few examples of possible findings.
(1) Program Activity: Using a Frequent Walker Punch Card to encourage students to walk or bicycle to school.
Finding A: More students walking and bicycling and parents’ surveys show more positive attitudes toward the benefits and feasibility of these travel modes.
Finding B: More children are not walking or bicycling and parent surveys reveal some of the reasons.
(2) Program Activity: Conducting an education and enforcement campaign to decrease speed-ing in school zones.
Finding A: Speeds reduced, parents aware of campaign and feel safer.
Finding B: Speeds reduced, parents unaware of campaign and do not feel safer.
Finding C: Speeds not reduced, parents unaware of campaign and do not feel safer.
Each of these findings would lead to different conclu-sions and recommendations which will be discussed in the next step.
Example School
In this example, the school was able to show an increase in students walking to school and identified some strategies that could improve the program.
Safe Routes to School Program Evaluation PlanSchool: High Hopes Elementary School
5. Collect Information and Interpret Findings
Results:
Students walking to school increased from 50 to 75, a 50 percent increase50% increase in helmet usage among students bi-cycling to schoolFour walking school buses started; 5th bus to start next fallParent surveys show awareness of speed campaign but not more willing to let children walkNearly all (90%) of parents use new drop-off site
•
•
•
•
•
If objectives were not met, what explanations are there? Were activities conducted as planned? Were any neces-sary changes made along the way? Were there external factors that might have worked against the Safe Routes to School program? For example, perhaps students were redistricted so that fewer lived within walking or bicycling distance compared to when the program began, or there may have been an event that had a huge impact, such as a pedestrian injury. Consider the context in which the results took place before drawing any conclusions.
When Results Do not Match Expectations
Recommendations:
Continue walking school bus programContinue Walk and Wheel to School daySecure source for free bicycle helmetsContinue speed enforcement program with more effort to inform parents at the start of school next year
••••

Evaluation 8-25
Step.6:.Use.ResultsThis is where all the work to collect and interpret the findings pays off. It is an opportunity to build off of what is working, change what is not working as well as it could and announce successes. This step includes: preparing the products of the evaluation like recom-mendations and reports, sharing them with stakehold-ers and other audiences, and following up to promote maximum use.
Formulating RecommendationsThe first task is to create recommendations based on the evaluation findings. When developing recommendations:
• Align recommendations with stakeholders’ and funders’ priorities when possible.
• Share draft recommendations with stakeholders and solicit feedback before finalizing the report.
• Target recommendations appropriately for each audience. For example, a local health department might be most interested in increased physical activity levels, while local law enforcement might be more interested in decreased traffic violations.
Using the example program’s goals and findings from Step 5, a sample of potential recommendations was developed.
(1) Program Activity: Using a Frequent Walker Punch Card to encourage students to walk or bicycle to school.
Finding A: More students walking and bicycling and parents’ surveys show more positive attitudes toward the benefits and feasibility of these travel modes.
Recommendation: Continue use of the Frequent Walker Punch Card.
Finding B: More children are not walking or bicycling and parent surveys reveal some of the reasons.
Recommendation: Adjust activity to address barriers identified by the parents.
(2) Program Activity: Conducting an education and enforcement campaign to decrease speed-ing in school zones.
Finding A: Speeds reduced and parents aware of campaign and feel safer.
Recommendation: Continue campaign and moni-tor to see if the effect is maintained.
Finding B: Speeds reduced, parents unaware of campaign and do not feel safer.
Recommendation: Keep the enforcement program in place, but modify the educational outreach.
Finding C: Speeds not reduced, parents unaware of campaign and do not feel safer.
Recommendation: A different enforcement or education technique is needed as well as other changes.
Sharing Results and RecommendationsThere are several reasons to share results, including:
• Providing positive reinforcement for everyone involved, including children, families, stakehold-ers and funders.
• Offering a newsworthy “hook” that can result in media coverage of the program.
• Providing a way to share lessons learned.
• Communicating next steps and additional needs, thus moving the program forward.
1. Plan the program/Collect information
2. Write objectives
3. Decide what, how and when to measure
4. Conduct the program and monitor progress
5. Collect information and interpret findings
6. use results
Six Step Process for SRTS Program Evaluation

Evaluation 8-26
Channels for information sharing include:
• School or community newsletters and Web sites
• Stories in the local media (see Tips for Working with the Media in Appendix J for tips on getting media coverage, or for more in-depth informa-tion, see the Media and Visibility chapter)
• Reports to the local decision-makers and political leaders in the community
• Meeting or conference presentations
For example, community leaders may be reached through a short report presented at a town council meeting with the media invited. Results also are shared with funders as progress reports or to solicit additional
Example School
Below shows how the school organized how they would share their program results according to the audience.
Safe Routes to School Program Evaluation PlanSchool: High Hopes Elementary School
6. Plan for Using Results
Individual or Organization with Whom to Share Results
Format in which the Results will be Shared
Channel by which the Results will be Shared
Which Results or Recommendations will be Shared
School parents Report PTA meetingArticle in newsletter
••
Speeding reducedWalking buses a successMore students walking
•••
Community Media story Local newspaperRadio station
••
Speeding reducedWalking buses a successMore students walking
•••
Community officials Report Town Council meeting Speeding reducedWalking buses a successMore students walking
•••
Students Presentation School assembly and classrooms
Walking buses now a way to get to schoolMore students walking
•
•
Local business contributors Presentation Chamber of Commerce meeting
More students walkingPart of encouragement programs
••
Funders Presentation/ Report
News conference with funders present
More students walkingSafer because of reduced speedsHow program should be continued with recommendations
•••
funds. Knowing the positive impacts of a Safe Routes to School program will help to keep the program alive.
The primary purpose of sharing evaluation findings is for local program partners to know what is work-ing and what changes to make to improve the program and to celebrate successes. Local evaluation results can have other benefits. Documented successes are needed as communities struggle to identify the best approaches for improving walking and bicycling to school. Local program leaders cite case studies as one of the most helpful types of information. Schools with programs or strategies that are evaluated to be successful are encour-aged to share their results with the National Center for Safe Routes to School so that these programs can be shared with the rest of country.

Evaluation 8-27
Appendices
A..Safe.Routes.to.School.Student.Travel.TallyThis form will help measure how students get to school and whether the SRTS program affects trips to and from school. Teachers can use this form to record specific information about how children arrive and depart from school each day for a week. The information this form helps collect will be used to help track the success of SRTS programs across the country. Also available online at www.saferoutesinfo.org/resources under the Evaluation heading.
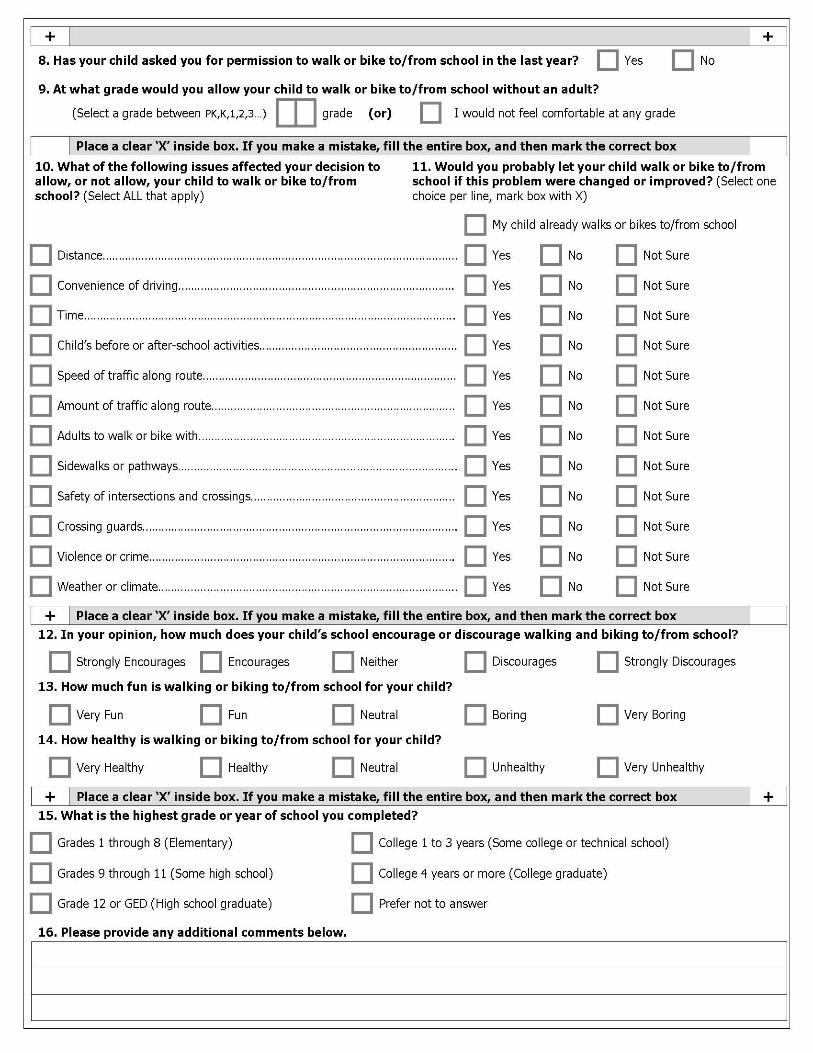
B..Safe.Routes.to.School.Parent.SurveyThis survey asks for information about what factors affect whether parents allow their children to walk or bike to school, the presence of key safety-related conditions along routes to school, and related background information. The survey results will help determine how to improve opportunities for children to walk or bike to school, and measure parental attitude changes as local SRTS programs occur. Also available online at www.saferoutesinfo.org/resources under the Evaluation heading.
C..Evaluation.WorksheetThis worksheet follows the format of the six steps presented in this guide. Program implementers may choose to use it to record their local program information and evaluation plan development. Also available online at www.saferoutesinfo.org/guide/evaluation in Appendix C.
D..Example.Completed.Evaluation.WorksheetThis example worksheet demonstrates how a local program could use it to plan and conduct its evaluation. Also avail-able online at www.saferoutesinfo.org/guide/evaluation in Appendix D.


Safe Routes to School Program Evaluation Worksheet Page 1 of 5
Program Evaluation Plan Worksheet
1. Program Planning Information
1A. PROGRAM GOAL(S):
1B. LOCAL CONDITIONS AND ISSUES (FORMATIVE ASSESSMENT):
(1) School information:
(2) Walking and bicycling numbers:
(3) Safety issues:
(4) Attitudes affecting walking and bicycling:
(5) Other assets that can benefit the program:
Conclusions:

Safe Routes to School Program Evaluation Worksheet Page 2 of 5
1C. PROGRAM ACTIVITIES
Education Strategy:
Encouragement Strategy:
Engineering Strategy:
Enforcement Strategy:
2. Objectives
For each strategy, write at least one objective that describes what will be done (also called a process objective) and another objective that describes the change expected (also called an outcome objective). See the next page.
3. What, How and When to Measure
Next to each objective, fill in what will be measured, how it will be measured, and when (before, during or after the program). See the next page.

Copy this page as needed.
Safe Routes to School Program Evaluation Worksheet Page 3 of 5
STRATEGY:
Time Frame:
Data Collectors: What will be Done What will be Measured How and When it will be Measured
Change Expected What will be Measured How and When it will be Measured
Notes:

Safe Routes to School Program Evaluation Worksheet Page 4 of 5
4. Conduct the Program and Monitor Progress
FINDINGS DURING THE PROGRAM:
RECOMMENDATIONS FOR ADJUSTMENTS:
5. Collect Information and Interpret Findings
RESULTS:
RECOMMENDATIONS:

Safe Routes to School Program Evaluation Worksheet Page 5 of 5
6. Plan for Using Results
Individual or Organization with Whom to Share Results
Format in which the Results will be Shared
Channel by which the Results will be Shared
Which Results or Recommendations will be Shared

Safe Routes to School Program Evaluation Worksheet Page 1 of 8
Example Completed Worksheet Program Evaluation Plan Worksheet
1. Program Planning Information
1A. PROGRAM GOAL(S): Increase safe walking and bicycling to school. Reduce traffic congestion around school.
1B. LOCAL CONDITIONS AND ISSUES (FORMATIVE ASSESSMENT):
(1) School information: Half of school enrollment lives within a mile of school School has no policies against walking or bicycling
(2) Walking and bicycling numbers: 10 percent of children walk to bicycle to school
(3) Safety issues: Principal stated that one child was hit by a car last year in the crosswalk Police stated that speeding was a problem; using radar gun to determine speeds, they
determined that the average driver is going 35 mph instead of 25 mph through school zone during morning arrival.
Observation of school campus during morning arrival showed traffic congestion around drop-off area to be a problem for walkers and bicyclists.
(4) Attitudes affecting walking and bicycling: Parent survey rated safety as main concern Discussions with parents showed interest in their children being able to walk to school if adult
supervision provided
(5) Other assets that can benefit the program: Opportunity to receive grant to fund program Parents willing to provide volunteer help
Conclusions: Strategies to increase walking and bicycling to school should include adult supervision. Efforts are needed to reduce speeds around the school. Drop-off and pick-up area is a problem.

Safe Routes to School Program Evaluation Worksheet Page 2 of 8
1C. PROGRAM ACTIVITIES
Education Strategy: Provide basic bicycle and pedestrian safety classroom lessons to school children, reinforced by take-home safety sheets for parents as well as a map of existing safe walking and biking routes.
Encouragement Strategy: Start a Walk and Wheel Wednesday program that includes organized walking school buses and an incentive program.
Engineering Strategy: Reroute parent drop-off area away from walkers and bicyclists, including improving the pedestrian crosswalk to school site.
Enforcement Strategy: Develop a Parent Driver Safety Campaign that includes a school zone speed enforcement program and a clear enforcement message.
2. Objectives
For each strategy, write at least one objective that describes what will be done (also called a process objective) and another objective that describes the change expected (also called an outcome objective). See the next page.
3. What, How and When to Measure
Next to each objective, fill in what will be measured, how it will be measured, and when (before, during or after the program). See the next page.

Copy this page as needed.
Safe Routes to School Program Evaluation Worksheet Page 3 of 8
EDUCATION STRATEGY: Provide basic bicycle and pedestrian safety classroom lessons to school children, reinforced by take-home safety sheets for parents as well as a map of existing safe walking and biking routes.
Time Frame: Year-long with focus on month before start of Walking Wednesday program
Data Collectors: Safe Routes to School Coordinator to count number of presentations scheduled Classroom teachers to count number of students at presentations Safe Routes to School Taskforce to do traffic counts
What will be Done What will be Measured How and When it will be Measured All 4th–6th grade classes receive bicycle and pedestrian safety presentations
Number of presentations
Number of children present
Count number of presentations and children in attendance
Take-home bicycle and pedestrian safety sheets for parents via backpack mail (500 sheets)
Safety Sheets distributed Count number of safety sheets created and distributed
Map of existing routes sent to all parents via backpack mail
Number of maps distributed
Number of maps created and distributed
Change Expected What will be Measured How and When it will be Measured 90 percent of 4th-6th graders will increase knowledge of safe behavior
Student safety knowledge Count number of students who receive presentations.
Score on student knowledge surveys
Observe student safety behavior during Walk and Wheel days
50 percent of parents will increase their knowledge of safe behavior
Parent safety knowledge Count number of parents who receive safety sheets
Count number of parent-driver violations before and after distribution of safety sheets
20 percent of students and families will identify a safe walking and bicycling route
Students walking and wheeling to school
Number of students using existing walking routes through traffic counts before, during and at the end of the school year
Notes:
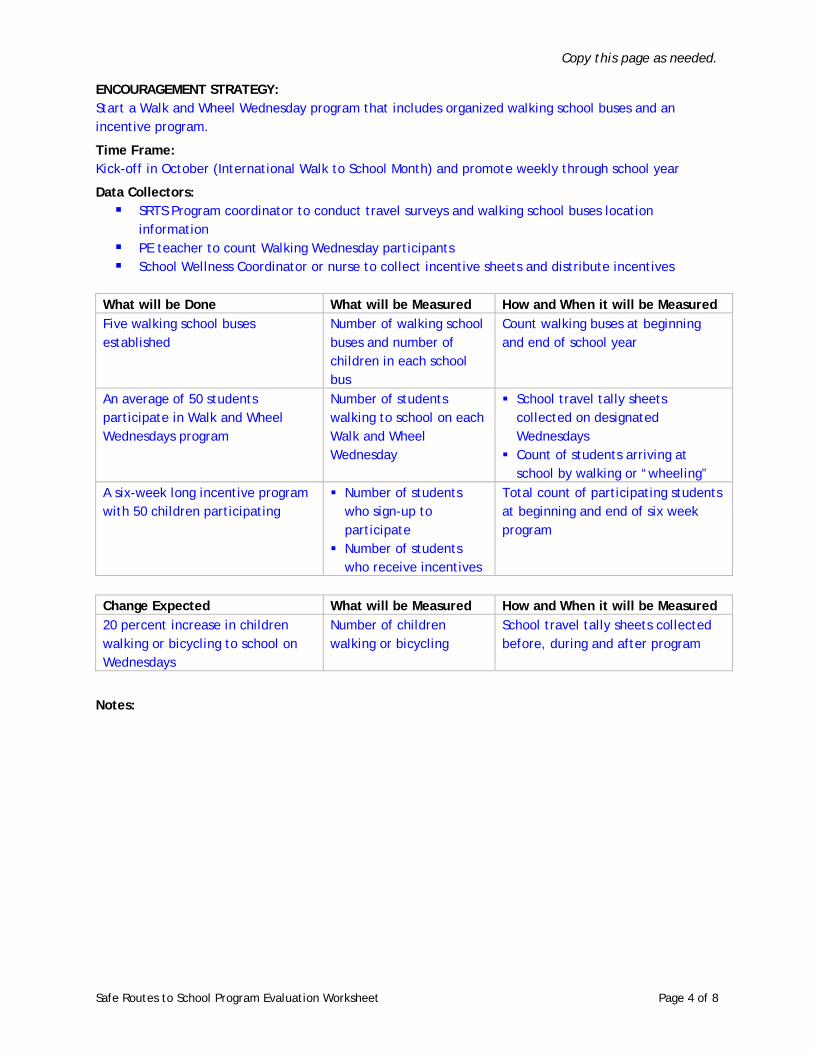
Copy this page as needed.
Safe Routes to School Program Evaluation Worksheet Page 4 of 8
ENCOURAGEMENT STRATEGY: Start a Walk and Wheel Wednesday program that includes organized walking school buses and an incentive program.
Time Frame: Kick-off in October (International Walk to School Month) and promote weekly through school year
Data Collectors: SRTS Program coordinator to conduct travel surveys and walking school buses location
information PE teacher to count Walking Wednesday participants School Wellness Coordinator or nurse to collect incentive sheets and distribute incentives
What will be Done What will be Measured How and When it will be Measured Five walking school buses established
Number of walking school buses and number of children in each school bus
Count walking buses at beginning and end of school year
An average of 50 students participate in Walk and Wheel Wednesdays program
Number of students walking to school on each Walk and Wheel Wednesday
School travel tally sheets collected on designated Wednesdays
Count of students arriving at school by walking or “wheeling”
A six-week long incentive program with 50 children participating
Number of students who sign-up to participate
Number of students who receive incentives
Total count of participating students at beginning and end of six week program
Change Expected What will be Measured How and When it will be Measured 20 percent increase in children walking or bicycling to school on Wednesdays
Number of children walking or bicycling
School travel tally sheets collected before, during and after program
Notes:

Copy this page as needed.
Safe Routes to School Program Evaluation Worksheet Page 5 of 8
ENGINEERING STRATEGY: Reroute parent drop-off area away from walkers and bicyclists, including improving the pedestrian crosswalk to school site.
Time Frame: Over the upcoming school year
Data Collectors: Town engineer/planner to evaluate current conditions Safe Routes Taskforce to collect traffic counts
What will be Done What will be Measured How and When it will be Measured A new parent drop-off area is designated away from walkers and bikers
New drop-off site is designated and promoted
The way the new drop-off site is publicized (number of new signs, announcements)
Crosswalk is improved Improvements made to crosswalk
Way crosswalk was improved (paint signage, etc.)
Change Expected What will be Measured How and When it will be Measured 100 percent of parent-drop-offs are rerouted to new site
Number of parents who use new drop-off site
Traffic counts at before and after rerouting
100 percent of students who walk and bicycle have access to a safe crosswalk to the school
Number of students using crosswalk
Number of pedestrian and bicycle accidents involving a motor vehicle at crosswalk site
Traffic counts before and after crosswalk improvement
Police data of accident reports six months after improvement
Anecdotal data from Principal six months after improvement
Notes:

Copy this page as needed.
Safe Routes to School Program Evaluation Worksheet Page 6 of 8
ENFORCEMENT STRATEGY: Develop a Parent Driver Safety Campaign that includes a school zone speed enforcement program and a clear enforcement message.
Time Frame: Month-long fall campaign to be repeated in the spring
Data Collectors: Police to measure speeds Police to report enforcement activities and citations issued Safe Routes to School Team to collect enforcement
What will be Done What will be Measured How and When it will be Measured Student Safety Poster and message contest
Number of student poster submissions
Selection of 1 message and poster
Count posters Count number of times safe
message is replicated in safety campaign materials
Distribute 500 fliers/stickers to parent drivers with enforcement message
Number of fliers/stickers distributed
Number of fliers/stickers distributed at end of month-long campaign
Site speed trailer in high-traffic school zone area
Number of speeding cars and average speeds
Record number of cars that are over speed limit and speed (single day count)
Police conduct enforcement activity 3 days each month of the campaign
Number of days of enforcement activity
Number of traffic violators
Count number of police enforcement days
Count number of citations
Conduct 1 news conference Number of media that are present at news conference
Media stories from news conference
Change Expected What will be Measured How and When it will be Measured Reduce average speed from 35 mph to 25 mph during arrival and departure times
Reduced speeds Speed data from speed trailer during one-day counts
Number of traffic violations during police enforcement days
Increase parent driver awareness and improve driver behavior
Number of traffic violations (cited and observed)
Observations during Walk and Wheel Wednesdays at beginning and end of month-long campaign
Police data collected at end of month-long campaign
Notes:

Safe Routes to School Program Evaluation Worksheet Page 7 of 8
4. Conduct the Program and Monitor Progress
FINDINGS DURING THE PROGRAM: Students were unaware of safe walking and bicycling behavior Students and families were unaware of existing safe routes to school Three walking school bus routes established Police report speeding is reduced by some but not all drivers Parents interviewed unaware of speed enforcement Incentive program increases participation in Walk and Wheel Wednesday program Parents do not yield to pedestrians in crosswalk
RECOMMENDATIONS FOR ADJUSTMENTS: Reinforce student safety presentations with hands-on safety events Identify two more routes for walking school buses Get media coverage of enforcement efforts Send information home to parents about enforcement efforts Introduce different incentive programs throughout the school year Crossing guard needs to be stationed at crosswalk
5. Collect Information and Interpret Findings
RESULTS: Students walking to school increased from 50 to 75, a 50 percent increase 50% increase in helmet usage among students bicycling to school Four walking school buses started; 5th bus to start next fall Parent surveys show awareness of speed campaign but not more willing to let children walk Nearly all (90%) of parents use new drop-off site
RECOMMENDATIONS: Continue walking school bus program Continue Walk and Wheel to School day Secure source for free bicycle helmets Continue speed enforcement program with more effort to inform parents at the start of school
next year
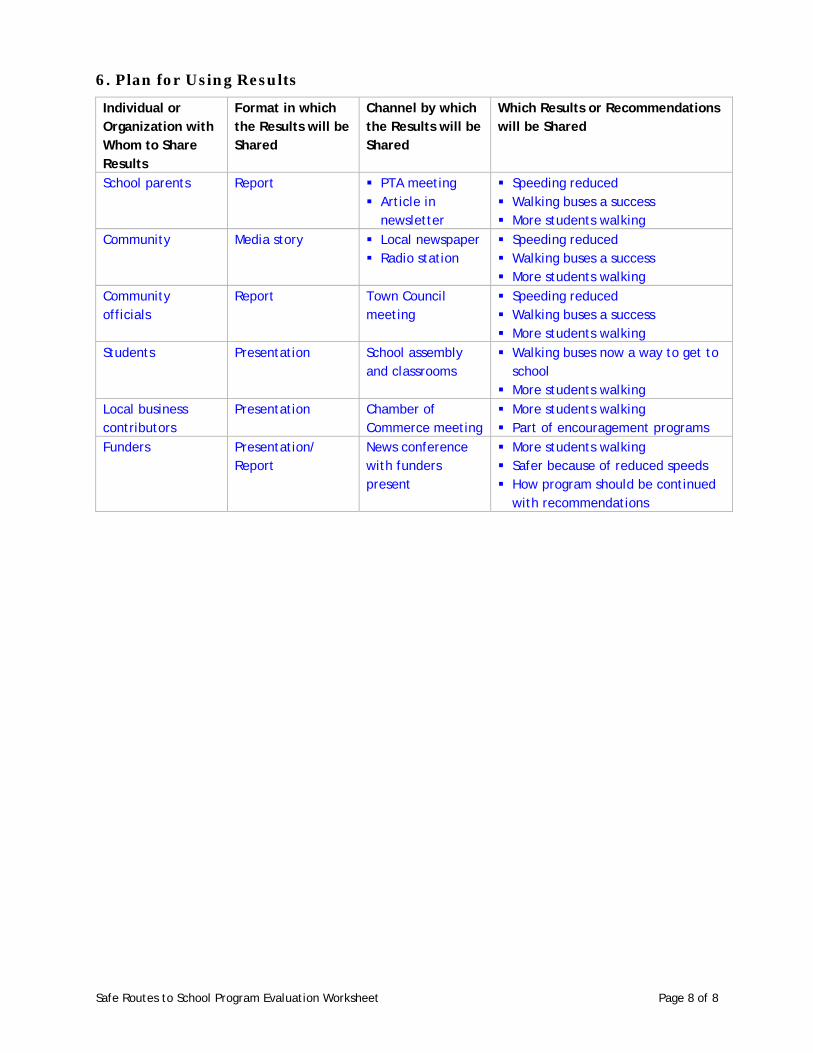
Safe Routes to School Program Evaluation Worksheet Page 8 of 8
6. Plan for Using Results
Individual or Organization with Whom to Share Results
Format in which the Results will be Shared
Channel by which the Results will be Shared
Which Results or Recommendations will be Shared
School parents Report PTA meeting Article in
newsletter
Speeding reduced Walking buses a success More students walking
Community Media story Local newspaper Radio station
Speeding reduced Walking buses a success More students walking
Community officials
Report Town Council meeting
Speeding reduced Walking buses a success More students walking
Students Presentation School assembly and classrooms
Walking buses now a way to get to school
More students walking Local business contributors
Presentation Chamber of Commerce meeting
More students walking Part of encouragement programs
Funders Presentation/ Report
News conference with funders present
More students walking Safer because of reduced speeds How program should be continued
with recommendations

Evaluation 8-44
The Role of an Evaluation SpecialistIf a program plans to use an evaluation specialist, the specialist should be included from the very beginning. The specialist can help identify what can be measured and what questions an evaluation will be able to answer. The evaluation specialist can anticipate potential future problems that may arise when gathering or analyzing particular types of data. For example, the evaluator will recognize the potential effect of seasonal differences in the number of walkers, or the impact political changes might have on enforcement activities. Beyond recog-nizing the potential problems, however, the evaluator will also know how to deal with them.
A specialist may perform the following tasks:• Design the evaluation • Identify and train data collectors • Collect the data • Provide interim feedback during the program • Analyze data and present the findings • Provide input on recommendations
The evaluator can determine survey tools, train data collectors and decide how to analyze results. Program implementers need to stay in communication with the evaluator to make sure that the processes and products align with expectations.
Finding an Evaluation SpecialistFor Safe Routes to School programs, a local college or university will most likely be the best source of evalu-ators or leads on where to find someone. When seek-ing an evaluator, consider the following list of desirable characteristics:
• Explains evaluation and related processes in under-standable terms.
• Demonstrates previous evaluation experience, particularly in use of observations, surveys, and analysis of existing data.
• Writes technical information in a clear, logi-cal manner and uses graphics to help explain findings.
• Knows where to access needed data, such as pedes-trian and bicycle injury and fatality rates.
• Has experience working with non-professional data collectors.
• Statistical analyses may be appropriate, depending on what is going to be measured. Describe what is known about the planned program activities and ask the evaluator what he or she would recom-mend. Ask for a description of situations which would not require statistical analyses. If the answer is “Statistical analyses are always required,” that may indicate a problem.
E..Working.with.an.Evaluation.SpecialistSome programs will have the resources and interest in conducting a more comprehensive, complex evaluation and will seek the assistance of a specialist in order to do so. The role of an evaluation specialist and tips for creating a successful product are described here.
Adapted from the National Highway Transportation Administration’s Art of Appropriate Evaluation (www.nhtsa.dot.gov/people/injury/research/ArtofAppEvWeb/pages/5GettingHelp.htm).

Evaluation 8-45
Common Evaluation Designs for Program Evaluation
Pre and Post One-Sample Tests: For example, assess how many students walk to school before a kick off event takes place and how many students walk after the event.
Strength:Easy to conduct, it is the most feasible design.
Weakness:Results may not be accurate as there is no control for outside factors that may explain the findings even in the absence of the SRTS program.
Pre and Post Two-Sample Tests: For example, measure how many students walk or bike before and after SRTS has been in place for 6 months and measure at those same points in time in a similar school elsewhere that did not take part in SRTS.
Strength:Fairly easy to conduct, better control than the one-sample test, especially if the second school is similar with regard to outside factors.
Weakness:No two schools are exactly alike with regard to outside factors; some unmeasured difference between the two schools may still explain the result rather than the SRTS program itself.
Time-Series Design: For example, measure rates of walking and bicycling before the SRTS program, then every other month for one year. A time-series design is most feasible with one sample (the school where the program occurs). However, it is more accurate when it includes a comparison school to rule out the possibility of other explanations (beyond the SRTS program) for the changes.
Strength:The strongest of the three designs presented here when it includes a comparison group. Provides infor-mation over time.
Weakness:More costly to conduct and because the comparison school will not be exactly the same, some differences in the results will still not be explained just by the presence of the SRTS program.
Adapted from Physical Activity Evaluation Handbook DHHS, CDC, 2002.
Note: All of these designs require baseline data (data collected before the SRTS program begins). This is another reason it is important to identify conditions before the program starts.
F..Evaluation.DesignsThe quality of an evaluation varies by design. The most rigorous design is a randomized trial, which requires random-ly assigning individuals or groups to either intervention or control status. This is probably not feasible or appropriate for a community-level Safe Routes to School (SRTS) program. Less rigorous designs have strengths and weaknesses to consider when choosing among them.

Evaluation 8-46
G..Writing.Smart.ObjectivesPlanning for a program, and the evaluation of that program, is made easier by carefully creating objectives that include specific information about what is to happen to whom by when in what amount. Following the “SMART” acronym helps create objectives that are measurable and attainable. The meaning behind each letter of SMART is described below.
SpecificA specific objective guides measurement while a vague objective is hard to measure. For example, to find out whether a Safe Routes to School (SRTS) program increased students’ well-being is harder to measure than whether the program increased the number of steps they took before school.
MeasurableTo qualify as measurable, there should be a tool, like a tally form, or methodology to capture the needed information.
AchievableObjectives should be attainable. If only 25 percent of the students live within 2 miles of school, it is not realistic to expect that a SRTS program will result in walking and bicycling by 50 percent of all students. It is important to consider all the information gathered before the program to derive realistic objectives.
RelevantWhile it may seem obvious, the objective should relate to the intended activities. For example, if a SRTS program is focused on engineering improvements on one particular route to school, it is not relevant to have walkability of the entire community as the objective.
Time-BoundAn objective needs to have a time frame. If not, it may be arguable that an objective is yet to be met some time in the future, or someone may expect the objective be met sooner than is realistic. A date or time frame eliminates these uncertainties.
For examples of SMART objectives, see Step 2: Write Objectives.
Specific
Measurable
Achievable
Relevant
Time-bound
“SMART” objectives

Evaluation 8-47
1. From Whom Will Information Be Collected?If information from parents is desired, will data from all parents with children at a particular school be collected? If information from students is needed, will all students be surveyed or interviewed or observed? Selecting a smaller group of people to represent the entire group of interest (like parents or children) can make data collec-tion much easier. However, it can be tricky because the appropriate size (sometimes called the sample size) may vary depending on the question. For example, if the number of children walking or bicycling to school is desired, the appropriate group from which to collect data may be the subset of students who live within two miles of school. If awareness of safety issues is to be measured, the entire student body (and their parents) may be the appropriate sample. If gathering information from the entire student body is not possible, a representative sample is needed, which may require stratified random sampling. While this term may sound complex, it only means separating students by grade, sex, race/ethnicity or another variable and randomly selecting some from each sub-group (for example, ten boys and ten girls from each grade, randomly selected as every third boy or girl who enters the classroom on data collection day).
2. Data CollectorsConsideration must be given to who will collect the data and how they will they be trained. Good training helps ensure consistent data collection from different data collectors. Without this, it is difficult or impos-sible to ensure that results are accurate. Common errors, such as entering the wrong information, may arise out of boredom or fatigue. Ideally, having a second person enter all the data or a fraction of it again helps to avoid this error by testing how frequently errors are occur-ring and working to fix the problem. If an evaluation specialist has been hired, he or she will be responsible for training data collectors and making a plan to prevent errors.
3. Protecting ConfidentialityConfidentiality is often of concern to schools and many districts have their own policies and procedures that must be followed. For example, if any data will be collected from students, informed consent from the parents is often required.
4. Data StorageIn most cases, data will be stored electronically in a spreadsheet or database. This is helpful because once raw data from paper forms (tally sheets, surveys, etc.) has been converted to a reliable electronic format it can be transferred to other software programs for analyses and/or graphic design.
H..Data.Collection,.Storage.and.ManagementPlanning for data collection includes making important decisions about the people involved and the data itself. Consider the following:

Evaluation 8-48
I..Examples.of.What.and.How.to.MeasureThe examples below are organized by strategy. “How to measure” column also indicates in bold the type of method it is. For more information about these methods in general, see Ways to Collect Information on page 8-8.
Topic What to measure How to measure
Engineering Topics
Install bicycle racks Construction of bicycle racks observation
Construct sidewalks Prioritization on local improvement plan Existing records from city
Construction of sidewalks observation
Improve intersection near school Installation of signage and devices observation
Build walking and bicycling paths Presence of walking and/or bicycling paths Auditobservation
Enforcement Topics
Driver education campaign to en-courage slowing down
Number of fliers distributed Number of media stories
observation
Number of warnings or citations given near school
Data from police department
Using a speed trailer Speed of vehicles near school Portable speed detection deviceExisting data or log
Beginning a school safety patrol Number of safety patrol volunteers training observation
Enforcing no parking in drop-off and pick-up areas
Number of fliers placed on illegally parked cars observation
Number of tickets for illegally parked cars Records from Law Enforcement
Number of illegally parked cars observation
Education Topics
Teach pedestrian or bicyclist safety to students
Score on a knowledge survey SurveyStudent interviews
Practice pedestrian or bicyclist safety skills with students.
Percent of helmeted bicyclists observation
Percent of pedestrians crossing properly observation
Educate parents about laws requiring yielding to pedestrians and bicyclists
Score on survey question Survey
Number of parent driver violations observation
Develop an “Eyes on the Street” program
Number of volunteers in program Tally
Encouragement Topics
Hold a Walk to School event Number of participants interview with school staff personSurvey of students
Media coverage Existing data from newspaper
Conduct a walking school bus/bicycle train program
Number of participants observation
Training of students and volunteers Survey of students
Parents’ attitudes about walking and bicycling to school
interview with leaderWritten or telephone survey
Use a Frequent Walker Punch Card Number of cards distributed Number of prizes given
Tallies
Promote a Morning or Recess Mile program
Number of participants observation

Evaluation 8-49
J..Tips.for.Working.with.the.Media
• Make.sure.there’s.something.newsworthy.to.say.. The story should “hook” onto a newswor-thy element, such as an existing national or state-level event or involvement of a local official or celebrity.
• Think.visually. Student-made posters or school mascots provide great visuals for the media, and they make photos of events more appealing.
• Prepare. for. an. interview. Use talking points to ensure a consistent message about your Safe Routes to School program. Think ahead of time about people who might speak to the media for an interview and obtain their permission to share their contact information.
• It.is.okay.to.pick.up.the.phone.and.talk.to.a.reporter.or. editor. about. the.program. Find out who covers a beat related to Safe Routes to School (education, physical activity, local issues, etc.) For television, the best time to call is between 10am-2pm and 7pm-10pm to avoid peak news broadcast hours.
• Be.available. Make it a priority to answer requests when possible.
• Limit.the.length.of.news.releases.and.adviso-ries..When writing a news release or media advi-sory, keep the length to one or two pages and offer more detailed information on a Web site or through supplemental materials. It is important to include accurate and complete contact information.
• Establish.media.partnerships. Approach local media to discuss opportunities for partnering on the promotion of Safe Routes to School. Contact the community affairs department to discuss potential partnerships, such as public service announcements.
For template media materials and resources, see www.saferoutesinfo.org/resources/index.cfm.
For more information, see the Media and Visibility chapter of the SRTS Guide (www.saferoutesinfo.org/guide/media).
Adapted from the National Center for Safe Routes to School Media Tip Sheets (www.saferoutesinfo.org/resources/marketing_tip-sheets.cfm).

Evaluation 8-50
General.Resources
• Demonstrating Your Program’s Worth: A Primer on Evaluation for Programs to Prevent Unintentional Injury, 2000 (www.cdc.gov/ncipc/pub-res/demonstr.htm)
• Art of Appropriate Evaluation (www.nhtsa.dot.gov/people/injury/research/ArtofAppEvWeb/index.htm)
• Safe Routes to School: Practice and Promise (www.nhtsa.dot.gov/people/injury/pedbimot/bike/Safe-Routes-2004/pages/section-3-ExperienceField.htm)
• Physical Activity Evaluation Handbook, 2002 (www.cdc.gov/nccdphp/dnpa/physical/handbook/pdf/handbook.pdf )
• CDC Evaluation Working Group Resource List (www.cdc.gov/eval/resources.htm)
• Guiding Principles for Evaluators (www.eval.org/Publications/GuidingPrinciples.asp)
Evaluation.StandardsJoint Committee on Standards for Educational Evaluation Program. Evaluation standards: How to assess evaluations of educational programs. 2nd ed. Thousand Oaks, CA: Sage Publications, 1994.
Evaluation.Texts
• Handbook of Practical Program Evaluation, 2nd ed, Wholey and Newcomer, 2004.
• Evaluation: A Systematic Approach, 7th ed, Rossi, et al, 2005.
• Case Study Research; Design and Methods, 3rd ed, Yin, Robert K., Sage Publications, London, 2003.
Resources
This information can be used to develop most desired types of evaluation, but it is limited by the enormous poten-tial scope of activities that might be part of a Safe Routes to School program and by the scope of program evaluation and evaluation research. The following resources are for readers interested in developing a better understanding of evaluation, either for their own benefit or to conduct more complex evaluation.