evaluation and research reports effectiveness of quality assurance - census · effectiveness of...
TRANSCRIPT

JOBNAME: No Job Name PAGE: 1 SESS: 20 OUTPUT: Thu Sep 16 14:03:37 1993 / pssw01/ disk2/ 90dec/ cphe/ 2/ cvrtpsp
1990 CPH-E-2
1990 Census ofPopulation and Housing
Evaluation and Research Reports
Effectiveness ofQuality Assurance
U.S. Department of CommerceEconomics and Statistics AdministrationBUREAU OF THE CENSUS

JOBNAME: No Job Name PAGE: 1 SESS: 58 OUTPUT: Thu Sep 16 13:38:42 1993 / pssw01/ disk2/ 90dec/ cphe/ 2/ ack
The Decennial Planning Division, Susan M. Miskura, Chief, coordinatedand directed all census operations. Patricia A. Berman, Assistant DivisionChief for Content and Data Products, directed the development andimplementation of the 1990 Census Tabulation and Publication Program.Other assistant division chiefs were Robert R. Bair, Rachel F. Brown,James L. Dinwiddie, Allan A. Stephenson, and Edwin B. Wagner, Jr.The following branch chiefs made significant contributions: Cheryl R.Landman, Adolfo L. Paez, A. Edward Pike, and William A. Starr. Otherimportant contributors were Linda S. Brudvig, Cindy S. Easton, Avis L.Foote, Carolyn R. Hay, Douglas M. Lee, Gloria J. Porter, and A. NisheaQuash.
The Decennial Operations Division, Arnold A. Jackson, Chief, wasresponsible for processing and tabulating census data. Assistant divisionchiefs were: Donald R. Dalzell, Kenneth A. Riccini, Billy E. Stark, andJames E. Steed. Processing offices were managed by Alfred Cruz, Jr.,Earle B. Knapp, Jr., Judith N. Petty, Mark M. Taylor, Russell L.Valentine, Jr., Carol A. Van Horn, and C. Kemble Worley. The followingbranch chiefs made significant contributions: Jonathan G. Ankers,Sharron S. Baucom, Catharine W. Burt, Vickie L. Cotton, Robert J.Hemmig, George H. McLaughlin, Carol M. Miller, Lorraine D. Neece,Peggy S. Payne, William L. Peil, Cotty A. Smith, Dennis W. Stoudt, andRichard R. Warren. Other important contributors were Eleanor I. Banks,Miriam R. Barton, Danny L. Burkhead, J. Kenneth Butler, Jr., Albert A.Csellar, Donald H. Danbury, Judith A. Dawson, Donald R. Dwyer,Beverly B. Fransen, Katherine H. Gilbert, Lynn A. Hollabaugh, Ellen B.Katzoff, Randy M. Klear, Norman W. Larsen, Peter J. Long, Sue Love,Patricia O. Madson, Mark J. Matsko, John R. Murphy, Dan E. Philipp,Eugene M. Rashlich, Willie T. Robertson, Barbara A. Rosen, Sharon A.Schoch, Imelda B. Severdia, Diane J. Simmons, Emmett F. Spiers,Johanne M. Stovall, M. Lisa Sylla, and Jess D. Thompson.
The Housing and Household Economic Statistics Division, Daniel H.Weinberg, Chief, developed the questionnaire content, designed the datatabulations, and reviewed the data for the economic and housing charac-teristics. Gordon W. Green, Jr., Assistant Division Chief for EconomicCharacteristics, and Leonard J. Norry, Assistant Division Chief for Hous-ing Characteristics, directed the development of this work. The followingbranch chiefs made significant contributions: William A. Downs, Peter J.Fronczek, Patricia A. Johnson, Enrique J. Lamas, Charles T. Nelson,and Thomas S. Scopp. Other important contributors were EleanorF. Baugher, Jeanne C. Benetti, Robert L. Bennefield, Robert W.Bonnette, William S. Chapin, Higinio Feliciano, Timothy S. Grall,Cynthia J. Harpine, Selwyn Jones, Mary C. Kirk, Richard G. Kreinsen,Gordon H. Lester, Mark S. Littman, Wilfred T. Masumura, John M.McNeil, Diane C. Murphy, George F. Patterson, Thomas J. Palumbo,Kirby G. Posey, John Priebe, Anne D. Smoler, and Carmina F. Young.
The Population Division, Paula J. Schneider, Chief, developed thequestionnaire content, designed the data tabulations, and reviewed thedata for the demographic and social characteristics of the population.Philip N. Fulton, Assistant Division Chief for Census Programs, directedthe development of this work. Other assistant division chiefs wereNampeo R. McKenney and Arthur J. Norton. The following branch andstaff chiefs made significant contributions: Jorge H. del Pinal, Campbell J.Gibson, Roderick J. Harrison, Donald J. Hernandez, Jane H. Ingold,Martin T. O’Connell, Marie Pees, J. Gregory Robinson, Phillip A.Salopek, Paul M. Siegel, Robert C. Speaker, Gregory K. Spencer, andCynthia M. Taeuber. Other important contributors were Celia G. Boertlein,Rosalind R. Bruno, Janice A. Costanzo, Rosemarie C. Cowan, ArthurR. Cresce, Larry G. Curran, Carmen DeNavas, Robert O. Grymes,Kristin A. Hansen, Mary C. Hawkins, Rodger V. Johnson, Michael J.Levin, Edna L. Paisano, Sherry B. Pollock, Stanley J. Rolark, A. DianneSchmidley, Denise I. Smith, and Nancy L. Sweet.
The Data User Services Division, Gerard C. Iannelli, then Chief,directed the development of data product dissemination and information toincrease awareness, understanding, and use of census data. Marie G.Argana, Assistant Chief for Data User Services, directed preparation ofelectronic data products and their dissemination. Alfonso E. Mirabal,Assistant Chief for Group Information and Advisory Services, directedactivities related to the National Services Program, State Data Centers, andpreparation of training materials. The following branch chiefs made signif-icant contributions: Deborah D. Barrett, Frederick G. Bohme, Larry W.
Carbaugh, James P. Curry, Samuel H. Johnson, John C. Kavaliunas,and Forrest B. Williams. Other important contributors were MollyAbramowitz, Celestin J. Aguigui, Barbara J. Aldrich, Delores A.Baldwin, Albert R. Barros, Geneva A. Burns, Carmen D. Campbell,James R. Clark, Virginia L. Collins, George H. Dailey, Jr., Barbara L.Hatchl, Theresa C. Johnson, Paul T. Manka, John D. McCall, Jo AnnNorris, David M. Pemberton, Sarabeth Rodriguez, Charles J. Wade,Joyce J. Ware, and Gary M. Young.
The Geography Division, Robert W. Marx, Chief, directed and coor-dinated the census mapping and geographic activities. Jack R. George,Assistant Division Chief for Geoprocessing, directed the planning anddevelopment of the TIGER System and related software. Robert A.LaMacchia, Assistant Division Chief for Planning, directed the planningand implementation of processes for defining 1990 census geographicareas. Silla G. Tomasi, Assistant Division Chief for Operations, managedthe planning and implementation of 1990 census mapping applicationsusing the TIGER System. The following branch chiefs made significantcontributions: Frederick R. Broome, Charles E. Dingman, Linda M.Franz, David E. Galdi, Dan N. Harding, Donald I. Hirschfeld, David B.Meixler, Peter Rosenson, Joel Sobel, Brian Swanhart, and RichardTrois. Other important contributors were Gerard Boudriault,Desmond J. Carron, Anthony W. Costanzo, Paul W. Daisey,Beverly A. Davis, Carl S. Hantman, Christine J. Kinnear, Terence D.McDowell, Linda M. Pike, Rose J. A. Quarato, Lourdes Ramirez,Gavin H. Shaw, Daniel L. Sweeney, Timothy F. Trainor, Phyllis S.Willette, and Walter E. Yergen.
The Statistical Support Division, John H. Thompson, Chief, directedthe application of mathematical statistical techniques in the design andconduct of the census. John S. Linebarger, Assistant Division Chief forQuality Assurance, directed the development and implementation ofoperational and software quality assurance. Henry F. Woltman, Assis-tant Division Chief for Census Design, directed the development andimplementation of sample design, disclosure avoidance, weighting, andvariance estimation. Howard Hogan and David V. Bateman werecontributing assistant division chiefs. The following branch chiefs madesignificant contributions: Florence H. Abramson, Deborah H. Griffin,Richard A. Griffin, Lawrence I. Iskow, and Michael L. Mersch. Otherimportant contributors were Linda A. Flores-Baez, Larry M. Bates,Somonica L. Green, James E. Hartman, Steven D. Jarvis, AlfredoNavarro, Eric L. Schindler, Carolyn T. Swan, and Glenn D. White.
The 1990 Census Redistricting Data Office, Marshall L. Turner, Jr.,Chief, assisted by Cathy L. Talbert, directed the development andimplementation of the 1990 Census Redistricting Data Program.
The Administrative and Publications Services Division, Walter C.Odom, Chief, provided direction for the census administrative services,publications, printing, and graphics functions. Michael G. Garland was acontributing assistant division chief. The following branch and staff chiefsmade significant contributions: Bernard E. Baymler, Albert W. Cosner,Gary J. Lauffer, Gerald A. Mann, Clement B. Nettles, Russell Price,and Barbara J. Stanard. Other important contributors were Barbara M.Abbott, Robert J. Brown, David M. Coontz, and John T. Overby.
The Data Preparation Division, Joseph S. Harris, Chief, providedmanagement of a multi-operational facility including kit preparation,procurement, warehousing and supply, and census processing activities.Plummer Alston, Jr., and Patricia M. Clark were assistant divisionchiefs.
The Field Division, Stanley D. Matchett, Chief, directed the censusdata collection and associated field operations. Richard L. Bitzer,Richard F. Blass, Karl K. Kindel, and John W. Marshall were assistantdivision chiefs. Regional office directors were William F. Adams, John E.Bell, LaVerne Collins, Dwight P. Dean, Arthur G. Dukakis, Sheila H.Grimm, William F. Hill, James F. Holmes, Stanley D. Moore, Marvin L.Postma, John E. Reeder, and Leo C. Schilling.
The Personnel Division, David P. Warner, Chief, provided manage-ment direction and guidance to the staffing, planning pay systems, andemployee relations programs for the census. Colleen A. Woodard wasthe assistant chief.
The Technical Services Division, C. Thomas DiNenna, Chief, designed,developed, deployed, and produced automated technology for censusdata processing.
ACKNOWLEDGMENTS

JOBNAME: No Job Name PAGE: 2 SESS: 21 OUTPUT: Thu Sep 16 14:03:37 1993 / pssw01/ disk2/ 90dec/ cphe/ 2/ cvrtpsp
1990 CPH-E-2
1990 Census ofPopulation and HousingEvaluation and Research Reports
Effectiveness ofQuality Assurance
U.S. Department of CommerceRonald H. Brown, Secretary
Economics and Statistics AdministrationPaul A. London, Acting Under Secretary
for Economic Affairs
BUREAU OF THE CENSUSHarry A. Scarr, Acting Director

JOBNAME: No Job Name PAGE: 1 SESS: 92 OUTPUT: Thu Sep 16 14:03:57 1993 / pssw01/ disk2/ 90dec/ cphe/ 2/ roster
BUREAU OF THE CENSUSHarry A. Scarr, Acting Director
Charles D. Jones, Associate Director forDecennial Census
William P. Butz, Associate Director forDemographic Programs
Bryant Benton, Associate Director forField Operations
Clifford J. Parker, Acting Associate Directorfor Administration
Peter A. Bounpane, Assistant Director forDecennial Census
Economics and StatisticsAdministration
Paul A. London, Acting Under Secretaryfor Economic Affairs
Special Acknowledgments
This report was prepared by Maribel Aponte, Somonica L. Green, Philip M. Gbur, G. Machell Kindred,John S. Linebarger, Michael L. Mersch, Michele A. Roberts, Chad E. Russell, Jimmie B. Scott, LaTanyaF. Steele, and Kent T. Wurdeman, under the general supervision of John H. Thompson, Chief, DecennialStatistical Studies Division. Important contributions were made by Chris Boniface, Alan Boodman, EdwardBrzezinski, Nancy J. Corbin, Jeffrey Corteville, Bonnie J. DeMarr, James Dunnebacke, JamesHartman, Todd Headricks, Kenneth Merritt, Chris Moriarity, Robert Peregoy, Robert Perkins, JoycePrice, Barbara Rehfeldt, Thomas Scott, Carnelle E. Sligh, Robert Smith, Robert Stites, Martha L. Sutt,Glenn White, Dennis Williams, and Eric Williams, former and current staff of the Decennial StatisticalStudies Division; Judy Dawson, Randy Klear, Sungsoo Oh, William Peil, Dennis Stoudt, and MichaelWharton of the Decennial Management Division; Fred McKee of the Data Preparation Division; and RobertE. Fay of the Director staff. (Note that in 1992, the Statistical Support Division was renamed the DecennialStatistical Studies Division and Decennial Planning Division merged with the Decennial Operations Divisionto form the Decennial Management Division.)
For sale by the Superintendent of Documents, U.S. Government Printing Office,Washington, DC 20402.

JOBNAME: No Job Name PAGE: 1 SESS: 31 OUTPUT: Mon Sep 20 08:22:35 1993 / pssw01/ disk2/ 90dec/ cphe/ 2/ contents
CHAPTER 1. INTRODUCTION AND BACKGROUND------------------------------------------ 3
GENERAL QUALITY ASSURANCE PHILOSOPHY FOR 1990 ------------------------------ 3ORGANIZATION OF THE REPORT ----------------------------------------------------------- 7
CHAPTER 2. PREPARATORY OPERATIONS-------------------------------------------------- 9
SHORT-FORM PACKAGE PRODUCTION ---------------------------------------------------- 9LONG-FORM PACKAGE PRODUCTION ------------------------------------------------------ 12PRELIST ----------------------------------------------------------------------------------------- 17
CHAPTER 3. DATA COLLECTION OPERATIONS--------------------------------------------- 23
TELEPHONE ASSISTANCE-------------------------------------------------------------------- 23CLERICAL EDIT--------------------------------------------------------------------------------- 26NONRESPONSE FOLLOWUP REINTERVIEW ----------------------------------------------- 30
CHAPTER 4. DATA CAPTURE/ PROCESSING OPERATIONS ------------------------------- 35
EDIT REVIEW ----------------------------------------------------------------------------------- 35Split -------------------------------------------------------------------------------------------- 35Markup ---------------------------------------------------------------------------------------- 39Telephone Followup -------------------------------------------------------------------------- 43Repair ----------------------------------------------------------------------------------------- 49
CODING ----------------------------------------------------------------------------------------- 54Industry and Occupation --------------------------------------------------------------------- 54General and 100-Percent Race Coding ----------------------------------------------------- 61Place-of-Birth, Migration, and Place-of-Work ----------------------------------------------- 63
DATA KEYING ---------------------------------------------------------------------------------- 70Race Write-In --------------------------------------------------------------------------------- 70Long Form ------------------------------------------------------------------------------------ 741988 Prelist ----------------------------------------------------------------------------------- 76Precanvass------------------------------------------------------------------------------------ 79Collection Control File ------------------------------------------------------------------------ 83
CHAPTER 5. OTHER OPERATIONS ------------------------------------------------------------ 85
SEARCH/ MATCH ------------------------------------------------------------------------------- 85QUALITY ASSURANCE TECHNICIAN PROGRAMS ----------------------------------------- 89
Regional Census Centers -------------------------------------------------------------------- 89Processing Offices---------------------------------------------------------------------------- 92Printing ---------------------------------------------------------------------------------------- 95
APPENDIXES
A. Glossary -------------------------------------------------------------------------------------- 99B. 1990 Decennial Census Forms ------------------------------------------------------------- 105
CONTENTS
Page
1EFFECTIVENESS OF QUALITY ASSURANCE

JOBNAME: No Job Name PAGE: 1 SESS: 33 OUTPUT: Thu Sep 16 14:01:59 1993 / pssw01/ disk2/ 90dec/ cphe/ 2/ chapter1
CHAPTER 1.Introduction and Background
GENERAL QUALITY ASSURANCE PHILOSPHYFOR 1990
In the early 1980’s, the Census Bureau looked at itsquality control approach and the analyses for 1980 censusoperations attempting to answer several questions. Whatwas the quality of the product? What were the errors andwhat were the deficiencies in the process? Particularinterest was placed on the quality control techniques usedand, where problems existed, what were these problemsand how could they have been prevented? In this light,what should be the approach for the 1990 census?
The Census Bureau recognized the problems of relyingon the inspection and repair method that was used for1980 operations. This approach had not been completelysuccessful. It was decided that the Deming philosophy withits approach toward total quality improvement would betterserve the decennial census program.
Four major components to the 1990 quality assuranceapproach were decided upon, namely: build quality into thesystem; constantly improve the system; integrate respon-sibility for quality with production; and, clearly differentiatebetween quality assurance and quality control.
To ‘‘build quality in’’ an operation as large as a decen-nial census is not easy. It was necessary to identify ways toapproach such a large-scale operation completed by atemporary workforce during a very short period of time.Several areas were identified:
• Design operations to be straight-forward and efficient
• Train the staff
• Measure what has been learned during training
• Measure performance and give feedback during theoperation
• Assume the staff wants to do a good job; it is ourresponsibility to give them the tools to improve
The operations were designed with the intent that thesystem could be constantly improved. However, a systemcannot constantly improve in such a decentralized envi-ronment unless tools are provided to the staffs andsupervisors to do so. A major challenge was to design asystem where it was possible to measure the quality of thework, quantify error characteristics, and provide the infor-mation back to management in a time frame where it couldbe used.
The integration of the responsibility for quality withproduction grew out of experience in 1980 when theproduction and quality responsibilities resided in differentmanagement areas. Production was the responsibility ofone group in one part of the organization, while quality wasthe responsibility of the quality control area in another partof the organization. Management always asked how thingswere going, but it was perceived in terms of quantity, notquality, of work. Therefore, the perceived priority within theorganization’s structure was on the production side. Thequality control staffs seemed to always be a ‘‘thorn’’ to theproduction staffs. This promoted an adversarial relation-ship within the organization.
To eliminate this antagonism, the production side wasmade responsible for quality, also. With this added respon-sibility, not only did the job have to get done; the job, now,had to be done well.
Quality assurance is different from quality control. But, itis difficult for most people to understand the difference.The Census Bureau has long implemented quality controland has applied it to virtually all operations. Quality assur-ance is a much broader idea. It includes the whole conceptof management responsibility for how well an operationfunctions. Quality assurance includes all components ofmanagement: production, timeliness, and accuracy. Qual-ity assurance is the responsibility of everyone—no one isexempt. Quality control is only one part of the broaderquality assurance concept.
The Census Bureau employs a lot of the separatecomponents of quality assurance, but integrating it underone umbrella was a change in philosophy and manage-ment approach. This change was one of the most difficultaspects of the new philosophy to implement during the1990 decennial census.
Quality Assurance for 1990
To support the new philosophy, a concerted effort wasmade to design quality inspection plans integral to anoverall quality assurance approach. Staff consulted andmet with sponsors and users of the specifications. Certainaspects were specified to enable measurement of learn-ing, continued performance improvement, and overall pro-cess quality. Staff also specified and assisted in thedevelopment of systems, both manual and automated, toprovide management and supervisors with information.This information supported continual improvement of theprocess, of a unit of clerks, and of an individual.
It was necessary to sell the new philosophy by educat-ing both management and staff through the use of semi-nars on this approach. Several pilot programs, outside the
3EFFECTIVENESS OF QUALITY ASSURANCE

JOBNAME: No Job Name PAGE: 2 SESS: 33 OUTPUT: Thu Sep 16 14:01:59 1993 / pssw01/ disk2/ 90dec/ cphe/ 2/ chapter1
decennial area, were undertaken to show the effects of thenew approach on the process. The various aspects of theapproach were tested during the census test cycle. It wasnecessary to be constantly vigilant as it was a culturalchange for all—and it was easy to revert to the old ways.There was success on some fronts and less success onothers.
To obtain both timely and accurate measurements ofperformance, was one of the Census Bureau’s majorgoals. To achieve this, an attempt was made to simplifymanual records and summaries, and software was devel-oped to support the quick capture of data quality. An activequality inspection activity was maintained to measure theperformance, both during training and during production.
Another goal of the new approach was to make suretrainees understood their job before leaving training. Animportant aspect of ‘‘building quality in’’ is to train theworker well on what they are to do. Staff worked hard onspecifying what was to be covered in training. It wasimportant to make sure the trainees understood the jobbefore they left the training room. To achieve this goal,practice work was instituted wherever possible and testswere developed to be given after training to obtain ameasure of learning.
Another goal, and perhaps the most visible, was toprovide timely feedback. Without effective feedback thesystem would remain static. Feedback makes the workeraware that others are interested in how well their job isgoing. Effective feedback enables the worker to know howwell he/ she is performing, and in what areas there can beimprovement. For feedback to be effective, it must betimely and relevant to the main components of the tasksbeing performed. Feedback given 2 weeks after the workhas been completed or on components of the system overwhich a worker has no control is of little benefit to anyone.
The new quality assurance approach was pervasivethroughout the census. It was integrated at all levels andacross virtually all operations. The remainder of this sec-tion will focus on the areas of automation, communication,training, and measurement techniques to illustrate some ofthe specific actions taken to bring about improvement intotal quality.
Automation—The increased use of automation made itpossible to apply the new quality assurance approach toareas that would have been impossible in 1980. With theplacement of automation equipment at the field districtoffice level, more consistent application of procedurescould be expected. The software would do the morecomplicated tasks the diversified staffs could not be expectedto do throughout the country. Here, consistency in imple-mentation is equated to quality. Automation and the asso-ciated ability to control the materials by identificationnumber permitted the census materials to be processed ona flow basis as they were received. In 1980, all forms for adefined geographic area had to be collected before any
questionnaire could be processed. This allowed the pro-cessing in both the district offices and the processingoffices to proceed; thus enhancing productivity directly andquality indirectly.
The increased use of automation made it possible forthe Census Bureau to improve the capture, analysis, anddissemination of information on the status of the opera-tions. For example, in the processing offices there was theComputer Assisted Tracking System (CATS) to monitormaterial work flow. Software and computer facilities enabledthe Census Bureau to perform extensive analysis of dataincorporating statistical techniques in the decision mech-anisms and making the results available on a timely basisto the processing and field management staff as well asheadquarters. The keying operations in the processingoffices and the clerical edit operation and reinterviewprogram in the field were operations where the computerplayed major roles.
For keying, sample selection, quality decisions on workunits, and information reports on keyers and errors wereproduced by the computer. The computer calculated theappropriate statistics from the inspected data during veri-fication. This information was provided to supervisorsimmediately and stored for headquarters’ personnel formonitoring.
In the clerical edit operation, the computer aggregateddata and generated output on the quality level and char-acteristics of errors for the supervisors to review.
For operations in the field where enumerators wererequired to visit housing units to obtain information, areinterview program was established to detect falsificationof data. One component of this operation involved thecomputer analysis of content and workflow data for eachenumerator’s geographic area. From this analysis, enumer-ators with workflow or content characteristics significantlydifferent from coworkers in the same geographic areawere identified for reinterview, unless the situation couldbe explained by the supervisor. This system enabled theCensus Bureau to expand coverage and to minimize fieldreinterview cost.
One of the basic properties for an effective qualityassurance program is the speed with which feedback isgiven. Automation provided a means by which data and itsinterpretation could be turned around rapidly. During pro-cessing of the 1980 census, it was not unusual for themanual recordkeeping to have a backlog of several weeks,making the value of such data worthless for feedback.Automation also improved production because operationswere accomplished in much less time. Check-in of the mailreturns was faster and better. We generated new listingsfor nonresponse followup, and did not have to use thesame address register over and over again.
Communication—One of the elements for a successfulquality assurance program is effective communication.This includes the ability to obtain, evaluate, interpret, anddistribute information to improve the planning and design
4 EFFECTIVENESS OF QUALITY ASSURANCE
JOBNAME: No Job Name PAGE: 3 SESS: 33 OUTPUT: Thu Sep 16 14:01:59 1993 / pssw01/ disk2/ 90dec/ cphe/ 2/ chapter1
of an operation, as well as to help identify problems andtheir causes during implementation. In general, good com-munication is one of the keys to producing the best productpossible.
Working Groups—Working groups at the headquarterslevel was one effort to maintain good communication.Interagency groups were important during the planningand implementation of quality assurance operations thatrequired the assistance of outside agencies. Workinggroups were established with the Government PrintingOffice for the printing of the 1990 questionnaires andforms, and with the U.S. Postal Service for the variouspostal operations such as the Advance Post Office Checkand Casing operations.
These working groups’ initial focus was to bring togetherrepresentatives from each agency to plan and design thebest system possible. This was accomplished by reviewingideas, understanding each agency’s guidelines, and takingadvantage of the experience and expertise within eachagency. These working groups met periodically to discussassignments, set priorities, and review specifications andprocedures. This type of cooperation established respectand a better understanding of the operation and eachagency’s responsibility. Once the various operations started,the working groups stayed intact. The emphasis thenchanged to monitoring the operation and resolving prob-lems. All problems were discussed with each member ofthe working group to develop the best solution.
Internal census working groups were developed to planand design the best system possible for various operationsfor which the Census Bureau had sole responsibility.Working groups normally consisted of an analyst fromeach discipline necessary to design and implement aspecific operation. These individuals made up the commu-nication team to plan and monitor the implementation ofthe operation. Their functions included evaluating ideas,defining objectives and requirements, reviewing specifica-tions and procedures, as well as monitoring and problemsolving.
Reduced Supervisor Ratio—To improve employees’ per-formance, supervisors must provide timely and accuratefeedback. One barrier to doing this is the lack of enoughtime. After reviewing the supervisor’s tasks, the CensusBureau decided to require first line supervisors to managefewer employees. This enabled each supervisor to havemore time for reviewing employees’ work, interpreting thefeedback data, and providing the necessary counselingand retraining to improve workers’ weaknesses.
Quality Circles—By definition, a quality circle is the con-cept of management and employees, as a team, periodi-cally discussing quality status, issues, and problem reso-lutions.This concept was primarily used in the processingoffices. The quality circle group for a specific operationgenerally met once a week. The results from each meeting
were documented and distributed to all employees andmanagement staff. Suggestions were implemented wherepossible. This was especially useful in the coding opera-tions.
On-Site Observers—Another organizational component estab-lished to improve operational performance was on-siteobservers in both field and processing offices. This observerwas referred to as a quality assurance technician (qualityassurance technician). Their primary responsibilities includedenhancing local management’s awareness of quality assur-ance objectives and importance, as well as assisting inmonitoring the adherence to the quality assurance require-ments.
A quality assurance technician was in each of the 13Regional Census Centers and each of the 7 processingoffices. To perform their responsibilities, each quality assur-ance technician performed analysis and on-site observa-tion to monitor the quality assurance requirements. If aquality assurance technician identified inconsistencies, theinformation was articulated in person, or by telephone, tolocal management for investigation and appropriate action.The quality assurance technician also acted as a consult-ant. This was especially important in assisting local man-agement to make administrative or operational decisionsthat did not adversely affect quality assurance require-ments.
The primary skills essential to performing their taskswere a thorough knowledge of the operations and theirquality assurance requirements and the ability to effec-tively communicate these. All recommendations, problemidentification, advice, and status reports had to be com-municated orally to management and documented.
Problem Resolution—In the processing offices, a problemresolution system was established. The purpose of thissystem was two-fold; first, it provided local managementwith a vehicle to identify problems or request clarificationto procedures or software and receive quick resolution.Secondly, it allowed appropriate headquarter divisions anopportunity to participate in the decision to minimize anynegative affect on their specific requirements.
All problems were documented and transmitted to head-quarters for review. The Decennial Operations Divisionconsulted with the sponsoring division who generated thespecification. After a solution was reached, it was docu-mented and sent to various subject matter divisions forclearance. Upon clearance, the resolution was transmittedto all processing offices.
Training—One component of the total quality assuranceconcept is the education and training of production staff.The goal as management was to institute training on thejob. The census created over 400,000 temporary jobs inmore than 2 dozen major field and processing operations.The majority of the jobs were for field enumerators. Westrengthened enumerator training, pay, and management.Enumerator training was more interesting and relevant to
5EFFECTIVENESS OF QUALITY ASSURANCE
JOBNAME: No Job Name PAGE: 4 SESS: 33 OUTPUT: Thu Sep 16 14:01:59 1993 / pssw01/ disk2/ 90dec/ cphe/ 2/ chapter1
the job. It included learn-by-doing exercises and moretraining on map-reading. The Census Bureau improved thelevel of supervision given the enumerators by reducing theratio of enumerators to crew leaders. Crew leaders reviewedenumerators’ work daily to detect errors in the earlyphases of work.
The Census Bureau worked to improve the trainingmaterials for all 1990 census operations. Training ses-sions, held during the test censuses and the 1988 DressRehearsal, were observed and recommendations weremade for improvements. Many of the training sessionsused a multimedia format. The Census Bureau prepared aseries of video tapes for many of the operations in theprocessing offices, including a general quality assuranceoverview video. Two divisions, Field Division and Geogra-phy Division, used computer-based instruction for part oftheir training. The computer-based instruction helped stan-dardize the training that was held at multiple sites. Thecomputer-based training also improved the quality of anyadditional training necessitated by staff turnover while theoperations were underway.
As part of the Census Bureau’s training to prepare toprocess the questionnaires, a 3-week integrated test washeld in January 1990 at the Baltimore Processing Office.One purpose of the test was to train supervisors from theseven processing offices with hands-on implementation ofsoftware and work flow procedures. Comments and obser-vations from the test were reviewed and adjustments tooperations were made to improve the efficiency of theprocessing.
Measurement Techniques—Regardless of the operation,one of the basic objectives of a successful quality assur-ance system is the ability to accurately measure perfor-mance by identifying errors, documenting the characteris-tics of the errors, and providing information to managementon error level and characteristics so that feedback can begiven. Due to the diversity of decennial operations, themethodologies used to meet this objective differed. Thefollowing discussion focuses on the primary techniquesused.
Pre-Operational Sampling—For some census operationsneither a prior sample frame existed nor time constraintsallowed for sampling completed work. The address listdevelopment operations are such an example.
For the Prelist operation, since the listers were creatingthe address list, no prior lists existed from which a samplecould be selected. Selecting a sample after the workunitwas completed also was not feasible due to operationalconstraints which included: (1) verification of a sampleafter the initial listing would require the lister to be idlewhile this listing was done and the quality decision deter-mined; (2) any decision would be reached after a substan-tial amount of work already would have been completed;and, (3) such an approach would require an independentstaff of quality assurance listers in the field at the sametime as the regular listers presenting a difficult manage-ment and public perception problem.
These characteristics resulted in the development of anearly sample of work done prior to the actual start of theoperation. A body of work was used to match to the actualdata as it was done, thereby providing immediate measure-ment of the quality of the job. The benefits of this approachwere: (1) quality assurance listings were completed weeksahead of time, managed under their own organizationalstructure and controls; (2) quality assurance data wereimmediately available to supervisory personnel to be usedto measure the quality of the listing work; and (3) the initialidentification of the sample was used as a means for listingmanagers to gain experience prior to the start of theoperation.
If a workunit showed an unacceptable level of errors,the supervisors researched the case to determine if theenumerator was indeed accountable for the error, and ifso, took the appropriate action ranging from a discussionof the specific case to retraining or reassignment to adifferent area. In severe cases the workunit would bereworked by a different individual.
Data on all aspects of the quality assurance operationwere maintained for both concurrent monitoring and thecreation of a post-operational database for analysis.
A variant of this technique was used for the codingoperations. A sample of the non-computer coded caseswas selected prior to coding, replicated three times anddistributed among three workunits and coded indepen-dently. A measure of the individual coding quality level foreach coder was obtained by comparing the coding resultsfor this sample against the ‘‘true’’ codes determined by thethree coders using the majority rule to decide on differ-ences among the coders.
Post-Operational Sampling—For the majority of the cen-sus processing operations, it was possible to measure thequality and provide feedback by selecting a sample fromthe workunit subsequent to the operation. These opera-tions included most of the clerical and all of the data entryoperations.
The quality assurance was independent or dependentbased on the level of automation of the processing oper-ation. Automation allowed for an independent verificationin all of the data entry operations. Other clerical processingoperations were dependently verified.
During independent verification sample cases wereselected, the operation replicated, and the results com-pared to the original data. If the number of detecteddifferences exceeded a predetermined tolerance, the workunitwas rejected and was redone.
For the dependent verification, a sample of work wasreviewed to determine the level of errors. If this numberexceeded a predetermined tolerance, the workunit wasrejected.
The quality statistics were monitored at both the workunitand clerk level. Workunit data was used to determineworkunit acceptance. The clerk data provided characteris-tics of errors at the individual clerk level. It then was used
6 EFFECTIVENESS OF QUALITY ASSURANCE

JOBNAME: No Job Name PAGE: 5 SESS: 33 OUTPUT: Thu Sep 16 14:01:59 1993 / pssw01/ disk2/ 90dec/ cphe/ 2/ chapter1
to identify areas of difficulty where additional training maybe required or where procedures may be incomplete.
Post-operational sampling using independent verifica-tion was used for all data entry operations. Post-operationalsampling using dependent verification was used for mostclerical processing jobs. Some of these included: EditReview, Search/ Match, Microfilm Duplication, and theFACT 90 operations.
Concurrent Monitoring—For some operations either theredid not exist an adequate sample frame from which toselect a pre-operational sample or the selection of such asample would have interfered with the actual enumerationprocess. The selection of a post-operational sample alsowould have interfered with the enumeration process.
In these situations a procedure was designed to verifythat the census employee understood the proper censusprocedures before being allowed to work independently.For theseoperations,supervisorypersonnelmonitored/ observedthe census employee’s work for a specified period. At theend of this period, based on the number of errors detected,a decision was made as to whether the employee couldwork independently or should be reassigned.
The operations where this technique was used included:Urban Update/ Leave, Update/ Leave, and Telephone Assis-tance.
Reinterview—The enumeration method used in most ofthe country was either Mailout/ Mailback or Update/ Leavewith self-enumeration. Approximately 60 percent of thehousing units were enumerated by the household mailingback the census questionnaire. In the remaining 40 per-cent, consisting of list/ enumerate and nonresponse cases,the enumeration was conducted by census enumerators.
To protect against census enumerators falsifying dataduring the enumeration process, a sample of work wasselected daily from the enumerators to be reinterviewed.By comparing the reinterview responses to the originalresponses for selected roster items, it was determinedwhether potential data falsification occurred. The casesthat showed evidence of potential data falsification wereresearched by the supervisory staff to determine if actualfalsification had occurred and, if so, appropriate adminis-trative action was taken.
Suppression of Pre-Operational Sample—The suppres-sion of addresses to measure the proportion of addressesadded by enumerators was used in the Precanvass oper-ation. Enumerators were instructed to canvass their geo-graphic area, adding and updating the address list, asnecessary . A measure of the ability to perform wasobtained by measuring the proportion of suppressed addressesreturned as adds.
Contents of the Report
This publication is one in a series of evaluation andresearch publications for the 1990 Census of Populationand Housing. This report presents results of evaluationsfor a variety of 1990 decennial census quality assuranceoperations. This report provides results from census pre-paratory operations, data collection operations, datacapture/ processing operations, and other operations, suchas search/ match and the quality assurance tech pro-grams.
The quality assurance program was implemented toimprove the quality of the operations and increase produc-tivity. This report describes the analysis of each operationand the effectiveness of each quality assurance plan. Theresults from these analyses can be used to improve theoverall design of future operations required to conduct ahigh quality decennial census.
ORGANIZATION OF THE REPORT
The organization of this report focuses on the analysisof the major operations for which quality assurance planswere utilized. Chapters include preparation for the census,data collection, data capture/ processing activities, and‘‘other’’ operations.
The chapters are organized into two or three majorheadings and the appendixes A and B. Within each majorheading and its component part, there are six sections: theintroduction and background, methodology, limitations,results, conclusions, and reference. The first section pre-sents background and a brief description of the qualityassurance operation being discussed. The second sectiongives the sample design and statistical technique(s) usedto analyze the operation. The third section discuss anyconstraints and/ or limitations that might have impact oninterpreting the results. The fourth section gives the resultsof the evaluation of the quality assurance process. Thefifth section of each chapter presents a summary of thedata and any major recommendations for the future. Thefinal section will reference any documentation needed tobroaden the understanding of the topic.
Finally, in appendix A, there is a glossary of terms thatmay be found throughout the report. It is hoped that thereport is written in understandable terms, but it is impossi-ble to cover these topics without the use of some wordsunique to the census or the quality assurance environ-ment. The appendix B has facsimiles of all forms usedthroughout this publication.
7EFFECTIVENESS OF QUALITY ASSURANCE

JOBNAME: No Job Name PAGE: 1 SESS: 113 OUTPUT: Mon Sep 20 08:22:22 1993 / pssw01/ disk2/ 90dec/ cphe/ 2/ chapter2
CHAPTER 2.Preparatory Operations
The conduct of the 1990 decennial census requiredmuch effort during the preparatory phase. Since the cen-sus was taken primarily by households receiving a ques-tionnaire, one major preparatory operation was the produc-tion of the questionnaire packages. This chapter includesdiscussions of the activities for the preparation of bothquestionnaire packages made up for the short and the longforms.
Another critical preparatory activity is the creation of theaddress list. For some areas of the country, an address listwas purchased from a commercial vendor. In other areas,where a commercial list was not available or could not beused, census enumerators created the address list in anoperation, called the Prelist. This chapter also includes adiscussion of the quality assurance for the Prelist opera-tion.
SHORT-FORM PACKAGE PRODUCTION
Introduction and Background
For the 1990 decennial census, approximately 82.9million short-form packages consisting of a short-formquestionnaire (see form D-1 in appendix B), instructionguide, motivational insert, and a return and an outgoingenvelope were produced. These materials were producedusing the following process: printing and imaging of thequestionnaires, printing of the instruction guides and moti-vational inserts, construction of the outgoing and returnenvelopes, and assembly and packaging of the pieces.After the contract for this process was awarded, theCensus Bureau met with the Government Printing Officeand the contractor to discuss any adjustments to thequality assurance requirements or production system tooptimize efficiency of the short-form package production.
Before printing the questionnaires, a prior-to-productionrun was performed by the contractors to demonstrate theirability to produce a large-scale, full-speed production runthat would meet specifications. This included using a testaddress file containing bogus addresses.
During production, representatives of the Census Bureauor the Government Printing Office repeatedly visited thecontractor’s sites to ensure that the contractor followedthe quality assurance specifications and to monitor thequality of the various processes. This included reinspec-tion of the contractor’s samples by the government repre-sentative to confirm the contractor’s findings.
Methodology
The quality assurance plan consisted of visual andmechanical on-line verification of samples of the package
components during each stage of the production process.A systematic sample of clusters of two or three consecu-tive package components was used as the quality assur-ance samples. If a systematic error was detected, a cleanout (expanded search) was performed forward and back-ward of the defective sample cluster to isolate the prob-lem. The contractors corrected all errors and recorded theresults of the inspection on the appropriate quality assur-ance recordkeeping forms. The results were used forfeedback, process improvement, and later analysis.
An independent verification was performed by the DataPreparation Division in Jeffersonville, Indiana, where asubsample of the inspected questionnaires was selectedand reinspected.
Limitations
The reliability of the evaluation for the operation wasaffected by and dependent upon the following:
1. The correctness of the quality assurance recordsprovided by the contractor.
2. The legitimacy of the samples delivered by the con-tractor.
3. The sampled questionnaires at the end of the rolls (forthe roll-to-roll printing) representing the questionnairesthroughout the roll.
4. The use of the number of random errors detected asthe numerator in calculating the outgoing error rates. Ifno random errors were detected, the estimated out-going error rate was 0.0 percent.
5. The assumption of simple random sampling in calcu-lating estimated error rate standard errors.
Results
The technical specifications for printing forms to befilmed traditionally have been highly demanding with respectto the quality of paper, printing, and finishing work (address-ing, trimming, folding, etc). These rigorous technical require-ments were driven by the data conversion system and bythe need to safeguard against the introduction of dataerrors in processing questionnaires. While selected print-ing specifications for the forms to be filmed were relaxedsomewhat for the 1990 census, the printing contractspecifications—monitored by means of quality assurance
9EFFECTIVENESS OF QUALITY ASSURANCE

JOBNAME: No Job Name PAGE: 2 SESS: 113 OUTPUT: Mon Sep 20 08:22:22 1993 / pssw01/ disk2/ 90dec/ cphe/ 2/ chapter2
requirements that were an integral part of the contracts—gavethe Census Bureau a wide ‘‘margin of safety,’’ ensuring atop quality product and minimizing the introduction of dataerrors at conversion.
In view of the fact that development of the 1990software for the filming equipment was not finalized untilafter the conclusion of all printing, the margin of safety wasconsiderably wider than in the 1980 census or thananticipated for 1990. Despite the detection of errors doc-umented in this report, no forms processing or dataconversion problems attributable to bad printing (or othermanufacturing steps) are known to have occurred with the1990 forms. In addition to ensuring against widespreadrandom or systematic errors, the quality assurance con-tractual requirements served to guard against any escala-tion in the degree (or seriousness) of errors to the pointwhere the ‘‘true’’ (but unknown) tolerances might havebeen strained or exceeded.
For the roll-to-roll printing process, the questionnaireswere offset printed on a web press. A large roll of paperwas run through the press and, upon printing approxi-mately 48,000 questionnaires, the paper was immediatelyre-rolled.
The results for the inspected questionnaires were recordedon Form D-854, Roll-to-Roll Questionnaire Printing Verifi-cation Quality Assurance Record. (See form in appendixB.)
Of the 2,381 printed rolls of questionnaires, 5.1 percent(122 rolls) were detected to be in error. Due to the 100percent verification of every roll, there is no standard error.The rolls were either ‘‘cleaned out’’ or rejected entirely.
Figure 2.1 shows the distribution of the types of errorsdetected. Some individual samples contained more thanone type of error. The error types were as follows:
Code Description
C Any unprinted spot in the index squares orvertical bars is out-of-tolerance.
E Poor type quality or uniformity.B Any measurement of the circle wall thickness
is out-of-tolerance.A Any measurement of the black ink density is
out-of-tolerance.J Other, specify.G Black and blue inks are out-of-register.D Any black spot is out-of-tolerance.F Image is misplaced or skewed.H Show-through is out-of-tolerance.
The most frequently occurring error was out-of-toleranceunprinted spots in the index squares or vertical bars. Poortype quality or uniformity was the second most frequenterror. Most of these errors occurred during the first half ofthe operation. The quality assurance plan enabled earlydetection of the errors and helped reduce the problem.
For the imaging, trimming, and folding process, thequestionnaires were addressed and encoded using iondeposition imagers. Variable respondent addresses, an
interleaved 2 of 5 bar code, a census identification number,a binary coded decimal code, variable return addresseswith corresponding postnet bar codes, and synchroniza-tion control numbers were imaged on each questionnaire.
The results of the post-imaging inspection were recordedon Form D-856, Addressed 100 Percent (Short) Question-naire Verification Quality Assurance Record. (See form inappendix B.)
The post-imaging estimated incoming error rate was 3.1percent, with a standard error of 0.2 percent. The esti-mated outgoing error rate was 0.8 percent, with a standarderror of 0.1 percent. Figure 2.2 gives the distribution of thetypes of errors detected during this inspection. Someclusters contained more than one type of error. The errortypes were as follows:
Code Description
T Other, specify (relative to personalization).L BCD code not within specifications.C Any unprinted spot in the index squares or
vertical bars is out-of-tolerance.J Other, specify (relative to printing).D Any black spot is out-of-tolerance.K Bar code not within specifications.B Any measurement of the circle wall thickness
is out-of-tolerance.A Any reading of the black ink density is
out-of-tolerance.M Postnet bar code not within specifications.E Poor type quality or uniformity.X Other, specify (relative to finishing).
10 EFFECTIVENESS OF QUALITY ASSURANCE

JOBNAME: No Job Name PAGE: 3 SESS: 113 OUTPUT: Mon Sep 20 08:22:22 1993 / pssw01/ disk2/ 90dec/ cphe/ 2/ chapter2
Code Description
U Improperly trimmed.G Black and blue inks are out-of-register.N Misplaced or skewed image.V Improperly folded.W Torn or damaged.F Imaged is misplaced or skewed.O Poor type quality or uniformity.
Error type T, mostly wrinkled forms and scumming(black grease or oil) during printing, was the most fre-quently occurring error. The second most frequent errorwas the binary coded decimal code not within specifica-tions followed by out-of-tolerance unprinted spots in theindex squares or vertical bars. The other error types, notdirectly related to imaging, were able to ‘‘slip’’ through thepre-imaging inspection because the quality assurance planwas designed to detect systematic, not random, errors.
No quality assurance records were received for theprinting of the instruction guides and motivational inserts.The reason for this is not known.
The results of the inspected outgoing and return enve-lopes were recorded on Form D-852, Envelope Printing/ Con-struction Verification Quality Assurance Record. (See formin appendix B.)
No quality assurance records were received from one ofthe plants that constructed some of the envelopes. Thereason for this is not known. For the records received, fromthe 1,988 samples inspected, the estimated incoming error
rate was 4.8 percent, with a standard error of 0.5 percent.The estimated outgoing error rate was 3.3 percent, with astandard error of 0.4 percent.
Over 80 percent of the errors were attributed to poortype quality or uniformity. However, these errors were notcritical. The other detected errors were uniformly distrib-uted.
For the assembly process of the packages, a question-naire, instruction guide, return envelope, and motivationalinsert were inserted into the outgoing envelope.
The results of the inspected packages were recordedon Form D-853, Sample Package Assembly VerificationQuality Assurance Record. (See form in appendix B.)
Based on the 5,382 samples inspected, the estimatedincoming error rate was 9.0 percent, with a standard errorof 0.4 percent. The estimated outgoing error rate was 6.7percent, with a standard error of 0.3 percent. Figure 2.3shows the distribution of the types of errors detected. Thetypes of errors were as follows:
Code Description
C Any material is torn or damaged.D Other, specifyE Error unspecified.B Mailing package does not contain the proper
contents.
Over 60 percent of the errors detected were attributedto torn or damaged material. These defective pieces werenot critical to usage, but were discarded. Bad print quality
11EFFECTIVENESS OF QUALITY ASSURANCE

JOBNAME: No Job Name PAGE: 4 SESS: 114 OUTPUT: Mon Sep 20 08:22:22 1993 / pssw01/ disk2/ 90dec/ cphe/ 2/ chapter2
of the envelopes was the second most frequent error.Regarding the E error type, these samples were detectedto be in error, but the type of error was not annotated onthe quality assurance form. The contractor’s inspectorswere very meticulous, even the most minor of defects werecounted as errors.
For the packaging verification, there were two types ofpackages: Mail-Out/ Mail-Back and Update/ Leave. For themail-out/ mail-back packages, a sample of ZIP Codes andthe 5-digit and residual sorts within the sampled ZIP Codeswere inspected. For the update/ leave packages, the mate-rials were sorted by the appropriate field district office. Asample of address register areas within each district officewas inspected.
The results of the inspection were recorded on FormD-802, Packaging Verification: Mail-Out/ Mail-Back QualityAssurance Record and Form D-803, Packaging Verifica-tion: Update/ Leave Quality Assurance Record. (See formsin appendix B.)
For the mail-out/ mail-back packages, approximately 8.1percent of the sampled ZIP Codes (74 samples out of 915samples) contained missing mailing packages. The stan-dard error on this estimate is 0.8 percent. The missingmailing packages accounted for 0.06 percent of the sam-pled mailing packages. The standard error on this estimateis 0.0 percent.
For the update/ leave packages, approximately 12.6percent of the sampled address register areas (131 sam-ples out of 1,041 samples) contained missing packages.The standard error on this estimate is 1.0 percent. Themissing packages accounted for 0.04 percent of thesampled packages. The standard error on this estimate is0.0 percent.
The missing packages for both the mail-out/ mail-backand update/ leave packages consisted of questionnairesdamaged during the imaging and/ or assembly operations.The sequence numbers of the damaged questionnaireswere recorded and materials were regenerated. The regen-erated packages were shipped as individual packagesrather than as bulk for the appropriate ZIP Codes. Thus,the missing packages were accounted for in the sampledZIP Codes and address register areas.
Conclusions
The contractors were very cooperative with the on-sitegovernment inspectors in allowing use of their equipment,access to their facilities, and implementing the qualityassurance plan.
The quality assurance system had a positive effect onthe production of the short-form packages. The qualityassurance system allowed for the detection and correctionof systematic as well as random errors at each phase ofthe production of the packages. The on-line verificationperformed by the contractors during each stage of produc-tion worked well. This on-line verification made it easy torectify unacceptable work and improve the productionprocess over time.
The technical requirements for the production of theshort-form packages were more stringent than necessaryto process the questionnaires. Thus, regardless of theseemingly high error rates, the quality of the production ofthe packages was sufficient for the process.
As a result of the analysis of the production of theshort-form packages, the following are recommended:
1. Completion and receipt of the quality assurance formsneeds to be monitored closely to ensure the forms foreach production phase are completed correctly andreceived on a timely basis at the Census Bureau.
2. Continue the practice of periodically having govern-ment trained personnel on site to ensure the qualityassurance specifications are correctly followed and tomonitor the quality of the production of the packages.
3. Require the contractor to produce prior-to-productionsamples.
4. Even though this was not a problem with the produc-tion of the short-form packages, a method to controladdresses changed or deleted by the contractor shouldbe developed for future printing jobs requiring address-ing.
5. Maintain the printing standards by which defects aregauged. However, to further reduce the outgoing errorrate, the sampling interval for the verification of thepackaging of the questionnaires should be decreasedto detect missing pieces.
6. Since the collection of the sequence numbers of thedamaged questionnaires was sometimes confusing, amore acceptable method of recording, regenerating,and inserting the damaged questionnaires back intothe flow should be developed.
Reference
[1] Green, Somonica L., 1990 Preliminary Research andEvaluation Memorandum No. 103, ‘‘Quality AssuranceResults of the Initial Short-Form Mailing Package Produc-tion for the 1990 Decennial Census.’’ U.S. Department ofCommerce, Bureau of the Census. December 1991.
LONG-FORM PACKAGE PRODUCTION
Introduction and Background
For the 1990 decennial census, approximately 17.2million long-form packages consisting of a long-form ques-tionnaire (see form D-2 in appendix B), instruction guide,motivational insert, and a return and an outgoing envelopewere produced. These materials were produced using thefollowing multi-step process: printing and imaging of theouter leafs (pages 1, 2, 19, and 20) of the questionnaires;printing of the inside pages (pages 3-18) of the question-naires; printing of the instruction guides and motivational
12 EFFECTIVENESS OF QUALITY ASSURANCE
JOBNAME: No Job Name PAGE: 5 SESS: 114 OUTPUT: Mon Sep 20 08:22:22 1993 / pssw01/ disk2/ 90dec/ cphe/ 2/ chapter2
inserts; printing and construction of the outgoing andreturn envelopes; gathering, stitching, and trimming of thequestionnaires; and assembly and packaging of the pieces.After the contract for this process was awarded, theCensus Bureau met with the Government Printing Officeand the contractor to discuss any adjustments to thequality assurance requirements or production system tooptimize efficiency of the long-form package production.
Before printing the questionnaires, a prior-to-productionrun was performed by the contractors to demonstrate theirability to produce a large-scale, full-speed production runthat would meet specifications. This included using a testaddress file containing bogus addresses.
During production, representatives of the Census Bureauor the Government Printing Office repeatedly visited thecontractors’ sites to ensure that the contractors followedthe quality assurance specifications, and to monitor thequality of the various processes.
Methodology
The quality assurance plan consisted of visual andmechanical on-line verification of samples of the packagecomponents during each stage of the production process.A systematic sample of clusters of two or three consecu-tive package components was used as the quality assur-ance samples. If a systematic error was detected, a cleanout (expanded search) was performed forward and back-ward of the defective sample cluster to isolate the prob-lem. The contractors corrected all errors and recorded theresults of the inspection on the appropriate quality assur-ance recordkeeping forms. The results were used forfeedback, process improvement, and later analysis.
The contract required the selection of a sample ofquestionnaires; some were inspected and the others werenot. The sampled questionnaires were shipped to theCensus Bureau’s Data Preparation Division in Jefferson-ville, Indiana, where a subsample of the inspected ques-tionnaires was selected and reinspected. This served asan independent verification of the quality of the productionof the packages. The uninspected questionnaires servedas the ‘‘Blue Label’’ samples; that is, randomly selectedcopies packed separately and inspected only by the Gov-ernment Printing Office when there was a problem. How-ever, for this printing process, the Census Bureau wasgiven a dispensation by the Government Printing Office toallow review of the samples by the Data PreparationDivision, if necessary.
Limitations
The reliability of the evaluation for the operation wasaffected by and dependent upon the following:
1. The correctness of the quality assurance recordsprovided by the contractors.
2. The calibration and accuracy of the equipment used tomeasure the printing attributes.
3. The legitimacy of the samples delivered by the con-tractors.
4. The re-creation and re-insertion into the work schemeof all questionnaires containing actual addresses thatwere used as samples for the binding and assemblyoperations.
5. The representation of the outer leafs throughout theroll (for the roll-to-roll printing) by the sampled outerleafs at the end of the rolls.
6. The use of the number of random errors detected asthe numerator in calculating the outgoing error rates. Ifno random errors were detected, the estimated out-going error rate was 0.0 percent.
7. The assumption of simple random sampling in calcu-lating estimated error rate standard errors.
ResultsThere was a cooperative effort between the Govern-
ment Printing Office and the Census Bureau (especially theAdministrative and Publications Services Division, the Decen-nial Planning Division, and the Statistical Support Division)in producing the long-form packages. This joint effortallowed for the best experience in this type of printing, withspecial emphasis regarding quality assurance, that theCensus Bureau has seen in a decennial setting.
The technical specifications for printing forms to befilmed traditionally have been highly demanding with respectto the quality of paper, printing, and finishing work (address-ing, trimming, folding, etc). These rigorous technical require-ments were driven by the data conversion system and bythe need to safeguard against the introduction of dataerrors in processing questionnaires. While selected print-ing specifications for the forms to be filmed were relaxedsomewhat for the 1990 census, the printing contractspecifications—monitored by means of quality assurancerequirements that were an integral part of the contracts—gavethe Census Bureau a wide ‘‘margin of safety,’’ ensuring atop-quality product and minimizing the introduction of dataerrors at conversion.
In view of the fact that development of the 1990software for the filming equipment was not finalized untilafter the conclusion of all printing, the margin of safety wasconsiderably wider than in the 1980 census or thananticipated for 1990. Despite the detection of errors doc-umented in this report, no forms processing or dataconversion problems attributable to bad printing (or othermanufacturing steps) are known to have occurred with the1990 forms. In addition to ensuring against widespreadrandom or systematic errors, the quality assurance con-tractual requirements served to guard against any escala-tion in the degree (or seriousness) of errors to the pointwhere the ‘‘true’’ (but unknown) tolerances might havebeen strained or exceeded.
The quality assurance system had a positive effect onthe production of the packages. It allowed for the detectionand correction of systematic errors at each phase of theproduction of the packages.
13EFFECTIVENESS OF QUALITY ASSURANCE

JOBNAME: No Job Name PAGE: 6 SESS: 113 OUTPUT: Mon Sep 20 08:22:22 1993 / pssw01/ disk2/ 90dec/ cphe/ 2/ chapter2
The overall quality of the printing of the questionnairesand production of the packages was better than originallyanticipated.
For the roll-to-roll printing process, the outer leafs(pages 1, 2, 19, and 20) of the questionnaires to be filmedwere offset printed on a web press. A large roll of paperwas run through the press and, upon printing approxi-mately 36,000 outer leafs, the paper was immediatelyre-rolled.
The results for the inspected outer leafs were recordedon Form D-854, Roll-to-Roll Questionnaire Printing Verifi-cation Quality Assurance Record. (See form in appendixB.) Of the 1,185 printed rolls of outer leafs, 9.2 percent(109 rolls) were detected to be in error. Due to the 100percent verification of every roll, there is no standard error.Figure 2.4 shows the distribution of the types of errors. Theerror types were as follows:
Code Description
J Other, specify.A Any measurement of the black ink density
is out-of- tolerance.C Any unprinted spot in the index squares or
vertical bars is out-of-tolerance.G Black and blue inks are out-of- register.E Poor type quality or uniformity.D Any black spot is out-of-tolerance.
Error type J, mostly due to paper shrinkage and scum-ming (black grease or oil) during printing, was the mostfrequently occurring error. Out-of-tolerance black ink den-sity readings and out-of-tolerance unprinted spots in the
index squares or vertical bars were the second and thirdmost frequent errors, respectively.
For the imaging process of the outer leafs, the outerleafs were addressed and encoded using inkjet spray.Variable respondent addresses, an interleaved 2 of 5 barcode, a census identification number, a binary codeddecimal code, variable return addresses with correspond-ing postnet bar codes, synchronization control numbers,and an imaging alignment character (‘‘X’’) were imaged oneach outer leaf.
The results of the post-imaging inspection were recordedon Form D-863, Addressed Sample Questionnaire OutsideLeaf Verification Quality Assurance Record. (See form inappendix B.)
The post-imaging estimated incoming error rate was 2.4percent, with a standard error of 0.7 percent. The esti-mated outgoing error rate was 0.0 percent. Figure 2.5 givesthe distribution of the types of errors detected during thisinspection. The error types were as follows:
Code Description
A Any reading of the black ink density isout-of-tolerance.
J Other, specify (relative to printing).T Other, specify (relative to personalization).D Any black spot is out-of-tolerance.N Misplaced or skewed image.P Code numbers do not match.
Error types A (out-of-tolerance black ink density read-ings) and J (mostly attributed to paper shrinkage) were the
14 EFFECTIVENESS OF QUALITY ASSURANCE
JOBNAME: No Job Name PAGE: 7 SESS: 115 OUTPUT: Mon Sep 20 08:22:22 1993 / pssw01/ disk2/ 90dec/ cphe/ 2/ chapter2
most frequently occurring errors. The third most frequenterror, error type T, was due to tracking (trails of ink) on theforms during imaging.
Most of the errors were found during the roll-to-rollprinting stage rather than from the imaging process. Thisimplies that either the errors were random or went unde-tected during the roll-to-roll printing phase.
For the inside pages (pages 3-18) of the questionnaires,a large roll of paper was run through the press printing theinside pages. After being printed, the inside pages weretrimmed and folded.
The results for the inspected signatures (entire groupingof inside pages 3-18) were recorded on Form D-862,Sample FOSDIC Questionnaire Signature Printing Verifica-tion Quality Assurance Record. (See form in appendix B.)
The estimated incoming error rate was 3.2 percent, witha standard error of 0.4 percent. The estimated outgoingerror rate was 0.0 percent. Figure 2.6 shows the distribu-tion of the types of errors detected. The error types wereas follows:Code Description
D Any black spot is out-of-tolerance.C Any unprinted spot in the index squares or
vertical bars is out-of-tolerance.B Any measurement of the circle wall thickness
is out-of-tolerance.J Other, specify.E Poor type quality or uniformity.A Any measurement of the black ink density is out-of-
tolerance.G Black and blue inks are out-of-register.
Out-of-tolerance black spots (type D) was the mostfrequently occurring error. Out-of-tolerance unprinted spots
in the index squares or vertical bars (type C) was thesecond most frequent error. Out-of-tolerance circle wallthickness measurements (type B) and error type J (blackgrease or oil during printing) were the next most frequenterrors.
Quality assurance records were received for the printingof the motivational inserts, but not for the instructionguides. The reason for this is not known.
The results for the inspected items were recorded onForm D-851, Instruction Guide and Motivational InsertPrinting Verification Quality Assurance Record. (See formin appendix B.)
For the printing of the motivational inserts, elevenclusters out of 1,239 inspected clusters were detected tobe in error. The estimated incoming error rate was 0.9percent, with a standard error of 0.3 percent. The esti-mated outgoing error rate was 0.0 percent. Unfortunately,the type of errors detected for the defective clusters werenot specified on the quality assurance forms.
The results of the inspected outgoing and return enve-lopes were recorded on Form D-852, Envelope Printing/ Con-struction Verification Quality Assurance Record. (See formin appendix B.)
Quality assurance records for only 109 samples (lessthan 5 percent of the envelopes produced) were received.None of the samples were detected to be in error. How-ever, since all of the samples were selected in the sametime frame instead of throughout the process, no inferencecan be made about the production of the envelopes.
The binding operation consisted of gathering the innerpages into the outer leaf, stitching (stapling the pagestogether on the spine), trimming, and folding. The resultsfor the inspected questionnaires were recorded on FormD-849, Sample FOSDIC Questionnaire Gathering, Stitch-ing, and Trimming Verification Quality Assurance Record.(See form in appendix B.)
The estimated incoming error rate was 1.6 percent, witha standard error of 0.2 percent. The estimated outgoingerror rate was 0.3 percent, with a standard error of 0.1percent.
Figure 2.7 shows the distribution of the types of errorsdetected. Some clusters contained more than one type oferror. The error types were as follows:
Code Description
D Missing staple(s).F Improperly applied staple(s).E Misplaced staple(s).H Improperly trimmed.C Other, specify (relative to gathering).I Other, specify (relative to trimming).B Unsequential pages.G Other, specify (relative to stitching).J Error Unspecified.
The most frequently occurring error was missing sta-ples. Improperly applied staples was the second most
15EFFECTIVENESS OF QUALITY ASSURANCE

JOBNAME: No Job Name PAGE: 8 SESS: 115 OUTPUT: Mon Sep 20 08:22:22 1993 / pssw01/ disk2/ 90dec/ cphe/ 2/ chapter2
frequent error followed by misplaced staples and improp-erly trimmed questionnaires. The errors were not critical tousage and were manually corrected.
The assembly operation consisted of inserting a ques-tionnaire, an instruction guide, a return envelope, and amotivational insert into the outgoing envelope. The resultsof the inspected packages were recorded on Form D-853,Sample Package Assembly Verification Quality AssuranceRecord. (See form in appendix B.)
Based on the 12,688 samples inspected, the estimatedincoming error rate was 0.3 percent, with a standard errorof 0.1 percent. The estimated outgoing error rate was 0.03percent, with a standard error of 0.02 percent.
Figure 2.8 shows the distribution of the types of errorsdetected. Some sampled packages contained more thanone type of error. The types of errors were as follows:
Code Description
D Other, specifyC Any material is torn or damaged.B Mailing package does not contain the proper con-
tents.A Address on the questionnaire is not visible through
the window of the outgoing envelope.
Almost 65 percent of the errors detected were attributedto the envelopes not sealing properly due to the inserterapplying either too much or too little water on the glue flapof the envelopes. Torn or damaged material was thesecond most frequent error. These errors were minor andnot critical to usage. All errors found were corrected.
For the packaging verification, there were two types ofpackages: Mail-Out/ Mail-Back and Update/ Leave. For themail-out/ mail-back packages, a sample of boxes fromeach pallet was inspected. For the update/ leave pack-ages, a sample of address register areas within eachdistrict office was inspected.
The results of the inspection were recorded on FormD-802, Packaging Verification: Mail-Out/ Mail-Back QualityAssurance Record and Form D-803, Packaging Verifica-tion: Update/ Leave Quality Assurance Record. (See formsin appendix B.)
For the mail-out/ mail back packages, approximately 3.4percent of the sampled boxes contained missing mailingpackages. The standard error on this estimate is 0.3percent.
The missing mailing packages consisted of question-naires either damaged or selected during the imaging,binding, and/ or assembly operations and not yet replaced.During the operations, the sequence numbers of anydamaged questionnaires found were recorded and mate-rials were regenerated. These regenerated packages weremailed out as individual packages rather than with the bulkmaterial for the appropriate ZIP Codes. Thus, the missingmailing packages in the sampled ZIP Codes noted in thisreport were accounted for and replaced.
The contractor experienced several problems with thisarea of the packaging verification for the update/ leavepackages. They were unable to effectively perform theverification or store the packages for postal pick-up. Staffmembers from the Census Bureau and the Government
16 EFFECTIVENESS OF QUALITY ASSURANCE

JOBNAME: No Job Name PAGE: 9 SESS: 123 OUTPUT: Mon Sep 20 08:22:22 1993 / pssw01/ disk2/ 90dec/ cphe/ 2/ chapter2
Printing Office performed the verification at the plant sothat the questionnaires would be dispatched. Due to theseverity of the problems, the staff members from theCensus Bureau and the Government Printing Office per-formed a revised inspection of the packages (describedbelow) and no quality assurance records were maintained.
First, the sequencing of the packages was checked inthree consecutive boxes per pallet. The first and lastsequence numbers in the middle box were checked againstthe last sequence number in the first box and the firstsequence number in the third box, respectively.
Second, each pallet was weighed. The weight of allpallets for a district office, minus the estimated weight ofthe skids (wooden or rubber supports on the bottom of thepallet), was divided by the average weight per package.This gave an estimate of the total number of packages ina district office. This estimate was compared to the expectednumber of packages for each district office. If the differ-ence between the expected and estimated number ofpackages was less than 2 percent, the district office wasshipped. If the difference was greater than 2 percent, thewarehouse was searched for any missing pallet(s). Due totime constraints, if no other pallets were found, the districtoffice was shipped as is.
Also, because of time constraints and the contractor’sineffectiveness to perform the verification, the requirementfor the contractor to regenerate spoiled or missing pack-ages was waived. The Census Bureau’s Field Divisionhandled the missing packages by using the added unitspackages.
Conclusions
The Census Bureau’s improved working relationshipwith the Government Printing Office greatly improved theprinting process from previous decennial experiences. Inturn, the contractors were cooperative with the on-sitegovernment inspectors (as specified in the contract) byallowing use of their equipment, access to their facilities,and implementing the quality assurance plan.
The quality assurance system had a positive effect onthe production of the long-form packages. The qualityassurance system allowed for the detection and correctionof systematic errors at each phase of the production of thepackages. The on-line verification performed by the con-tractors during each stage of production worked well. Thison-line verification made it easy to rectify unacceptablework and improve the production process over time bydetecting defective materials before they reached latersteps in the process.
The contractor lost control of the packaging verificationprocess. If staff members from the Census Bureau and theGovernment Printing Office had not performed the verifi-cation of the Update/ Leave packages, serious problemswould have been encountered by the Census Bureau’sField Division personnel. However, even though manyproblems were encountered during the packaging verifica-tion process, the overall quality of the production of thepackages was sufficient for the process.
As a result of the analysis of this process, the followingare recommended:
1. Continue the practice of periodically having govern-ment trained personnel on site to ensure the qualityassurance specifications are correctly followed and tomonitor the quality of the production of the packages.
2. Continue to require the contractor to produce prior-to-production samples. This enabled the Census Bureauand the Government Printing Office to determine if thecontractor had the capability, and identified problemsthat could be corrected before production began.
3. Even though this was not a problem with the produc-tion of the long-form packages, a method to controladdresses changed or deleted by the contractor shouldbe developed for future printing jobs requiring address-ing.
4. Since the the collection of the sequence numbers ofthe damaged questionnaires was sometimes confus-ing, an easier method of recording, regenerating, andinserting the damaged questionnaires back into theflow needs to be developed.
5. Maintain the printing standards by which defects aregauged.
6. Completion and receipt of the quality assurance formsfor every phase of the production process need to bemonitored closely or automated to ensure the formsare completed correctly and received on a timely basisat the Census Bureau.
Reference
[1] Green, Somonica L., 1990 Preliminary Research andEvaluation Memorandum No. 138, ‘‘Quality AssuranceResults of the Initial Long-Form Mailing Package Produc-tion for the 1990 Decennial Census.’’ U.S. Department ofCommerce. Bureau of the Census. April 1992.
PRELIST
Introduction and Background
The 1988 Prelist operation was performed in smallcities, suburbs and rural places in mailout/ mailback areaswhere vendor address lists could not be used. During the1988 Prelist, enumerators listed housing units in theirassignment areas to obtain a complete and accuratemailing address for each living quarter, to record locationdescription for non-city delivery addresses, to annotatecensus maps to show the location of all living quarters, andto assign each living quarter to its correct 1990 censuscollection geography. This operation provides mailingaddresses for the census questionnaire mailout.
During the 1988 Prelist, a quality assurance operationwas designed to meet the following objectives: 1) to buildquality into the system rather than relying on inspection toprotect against major errors, 2) to control coverage errors
17EFFECTIVENESS OF QUALITY ASSURANCE

JOBNAME: No Job Name PAGE: 10 SESS: 116 OUTPUT: Mon Sep 20 08:22:22 1993 / pssw01/ disk2/ 90dec/ cphe/ 2/ chapter2
in listing addresses, and 3) to provide feedback to enumer-ators and managers on errors to improve the qualityperformance of the operation.
The first objective was accomplished by providing asystem that minimizes the occurrence of errors. Thesecond objective was accomplished by implementing anindependent sample to identify mistakes and estimate thequality performance. The third objective was accomplishedby analyzing errors to identify the type, magnitude, andsource of errors on a flow basis.
The prelist operation was conducted in four wavescontrolled geographically by the following Regional Cen-sus Centers (RCC’s): Atlanta, San Francisco Bay Area,Boston, Charlotte, Chicago, Dallas, Denver, Detroit, Kan-sas City, Los Angeles, New York, Philadelphia, and Seat-tle. The 1988 Prelist operation occurred from July 11, 1988thru January 6, 1989, and included 65,593 Address Reg-ister Areas with 27,895,927 total housing units, for anaverage of 425 housing units per Address Register Area.More detailed information on the 1988 Prelist operationcan be found in [1].
Methodology
To help the supervisor monitor the quality of the listing,sampled addresses were listed in advance in sampledblocks within the address register areas, as well as mapspotted. During production, each enumerator listed andmap spotted all living quarters within his/ her assignedgeographic area. To identify possible coverage and con-tent errors, the field supervisor matched the sample addressesobtained during the advance listing operation to the addresseslisted by the enumerators during the actual operation.
If the number of nonmatches was greater than one, thefield supervisor reconciled all nonmatches to determinewhether the advance lister or enumerator was accountablefor the errors. If the enumerator was judged to be respon-sible, the supervisor rejected the work and either providedadditional training of the enumerator or released theenumerator if prior additional training had already beenconducted. In either case, the work was reassigned toanother enumerator for recanvassing.
This quality assurance operation was initially conductedon the first block of the first address register area com-pleted by each enumerator so that problems could beidentified early in the operation and corrective action takenbefore they became widespread. Thereafter, the qualityassurance operation was conducted in predeterminedsubsequent address register areas after their completion.During the reconciliation, the field supervisor documentedthe reasons for the listing errors. This information, alongwith other data that may prove helpful, was regularlycommunicated to the enumerators.
The results of the quality assurance program weredocumented on the Form D-169, Quality Control Listingand Matching Record (see form in appendix B). The FormD-169 was used to indicate the advance listing results bythe field operation supervisor and the matching results bythe enumerator’s supervisor.
A summary of the matching operation along with theaction taken by the crew leader was collected on the FormD-169A, Summary of Matching (see form in appendix B).
All information on the quality assurance Form D-169and D-169A were transmitted to the Census Bureau’s DataPreparation Division. The Data Preparation Division editedand keyed all pertinent information. After keying the data,software was developed in Data Preparation Division toestablish a database. The database processed the qualityassurance data used for this report. For more detaileddescription on the data edited and keyed, see [3] and [4]..
Limitations
1. Estimates in this report relating to the accuracy of themailing address information are under-estimated. Thecriteria for an address being correct during qualityassurance of Prelist may be different than what wasneeded for mail delivery. For example, if the house-hold name was missing during Prelist and the advancelisting also did not provide a name for a rural typeaddress, the listing could be considered correct underthe quality assurance definition. However, the addresswould be rejected during computer editing that wasdone prior to sending the addresses to the post officefor validation. In most cases the consistency theorythat quality assurance used to detect errors andestimate quality worked very well.
2. The statistical analysis and results are based on thedata captured from form D-169 only.
Results
The quality of the information gathered for the livingquarters is expressed in the term of ‘‘listing error rate.’’This is an estimate of the proportion of the living quartersmissed or the living quarters listed with incorrect locationinformation. The location information relates to the mailingaddress and geography data such as block number, mapspotting and location description. Table 2.1 provides dataon the estimated number of listing errors, listing error rateand the relative standard error at the national and regionallevels. The relative standard error provides the relativereliability of both estimates; thus, the standard error can becalculated for each estimate.
The national listing error rate was 2.40 percent whichindicated that approximately 665,645 living quarters wereinitially listed incorrectly. The data indicated that the regionalcensus centers of Boston and Seattle experienced extremelyhigh listing problems with a listing percentage error rate of11.79 (most of the errors occurred at the beginning of theoperation) and 6.15 percent, respectively. In fact these twoareas accounted for 65 percent of the listing errors recorded.The combined listing error rate for these two areas was8.97 percent. The data appeared to indicate that Bostonexperienced difficulties in obtaining correct block numbersand street designations. On the other hand, Seattle seemedto have difficulties obtaining accurate location description.
18 EFFECTIVENESS OF QUALITY ASSURANCE
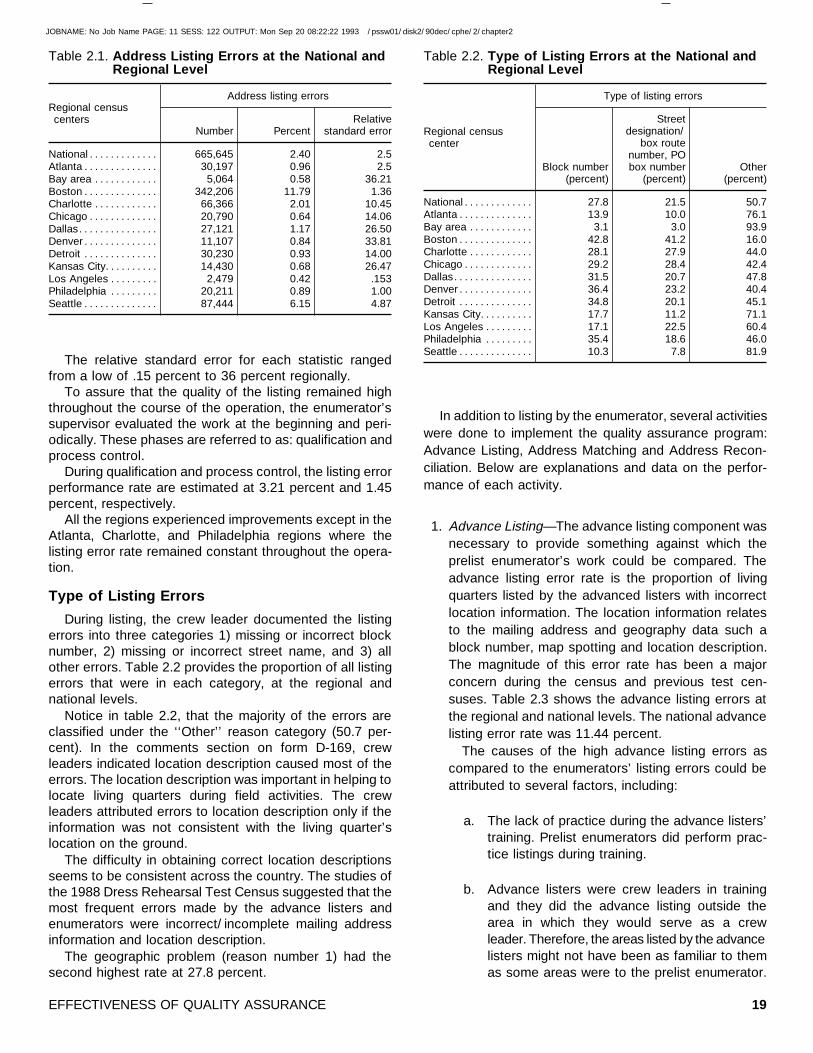
JOBNAME: No Job Name PAGE: 11 SESS: 122 OUTPUT: Mon Sep 20 08:22:22 1993 / pssw01/ disk2/ 90dec/ cphe/ 2/ chapter2
The relative standard error for each statistic rangedfrom a low of .15 percent to 36 percent regionally.
To assure that the quality of the listing remained highthroughout the course of the operation, the enumerator’ssupervisor evaluated the work at the beginning and peri-odically. These phases are referred to as: qualification andprocess control.
During qualification and process control, the listing errorperformance rate are estimated at 3.21 percent and 1.45percent, respectively.
All the regions experienced improvements except in theAtlanta, Charlotte, and Philadelphia regions where thelisting error rate remained constant throughout the opera-tion.
Type of Listing Errors
During listing, the crew leader documented the listingerrors into three categories 1) missing or incorrect blocknumber, 2) missing or incorrect street name, and 3) allother errors. Table 2.2 provides the proportion of all listingerrors that were in each category, at the regional andnational levels.
Notice in table 2.2, that the majority of the errors areclassified under the ‘‘Other’’ reason category (50.7 per-cent). In the comments section on form D-169, crewleaders indicated location description caused most of theerrors. The location description was important in helping tolocate living quarters during field activities. The crewleaders attributed errors to location description only if theinformation was not consistent with the living quarter’slocation on the ground.
The difficulty in obtaining correct location descriptionsseems to be consistent across the country. The studies ofthe 1988 Dress Rehearsal Test Census suggested that themost frequent errors made by the advance listers andenumerators were incorrect/ incomplete mailing addressinformation and location description.
The geographic problem (reason number 1) had thesecond highest rate at 27.8 percent.
In addition to listing by the enumerator, several activitieswere done to implement the quality assurance program:Advance Listing, Address Matching and Address Recon-ciliation. Below are explanations and data on the perfor-mance of each activity.
1. Advance Listing—The advance listing component wasnecessary to provide something against which theprelist enumerator’s work could be compared. Theadvance listing error rate is the proportion of livingquarters listed by the advanced listers with incorrectlocation information. The location information relatesto the mailing address and geography data such ablock number, map spotting and location description.The magnitude of this error rate has been a majorconcern during the census and previous test cen-suses. Table 2.3 shows the advance listing errors atthe regional and national levels. The national advancelisting error rate was 11.44 percent.
The causes of the high advance listing errors ascompared to the enumerators’ listing errors could beattributed to several factors, including:
a. The lack of practice during the advance listers’training. Prelist enumerators did perform prac-tice listings during training.
b. Advance listers were crew leaders in trainingand they did the advance listing outside thearea in which they would serve as a crewleader. Therefore, the areas listed by the advancelisters might not have been as familiar to themas some areas were to the prelist enumerator.
Table 2.1. Address Listing Errors at the National andRegional Level
Regional censuscenters
Address listing errors
Number PercentRelative
standard error
National . . . . . . . . . . . . . 665,645 2.40 2.5Atlanta . . . . . . . . . . . . . . 30,197 0.96 2.5Bay area . . . . . . . . . . . . 5,064 0.58 36.21Boston . . . . . . . . . . . . . . 342,206 11.79 1.36Charlotte . . . . . . . . . . . . 66,366 2.01 10.45Chicago . . . . . . . . . . . . . 20,790 0.64 14.06Dallas. . . . . . . . . . . . . . . 27,121 1.17 26.50Denver . . . . . . . . . . . . . . 11,107 0.84 33.81Detroit . . . . . . . . . . . . . . 30,230 0.93 14.00Kansas City. . . . . . . . . . 14,430 0.68 26.47Los Angeles . . . . . . . . . 2,479 0.42 .153Philadelphia . . . . . . . . . 20,211 0.89 1.00Seattle . . . . . . . . . . . . . . 87,444 6.15 4.87
Table 2.2. Type of Listing Errors at the National andRegional Level
Regional censuscenter
Type of listing errors
Block number(percent)
Streetdesignation/
box routenumber, PObox number
(percent)Other
(percent)
National . . . . . . . . . . . . . 27.8 21.5 50.7Atlanta . . . . . . . . . . . . . . 13.9 10.0 76.1Bay area . . . . . . . . . . . . 3.1 3.0 93.9Boston . . . . . . . . . . . . . . 42.8 41.2 16.0Charlotte . . . . . . . . . . . . 28.1 27.9 44.0Chicago . . . . . . . . . . . . . 29.2 28.4 42.4Dallas. . . . . . . . . . . . . . . 31.5 20.7 47.8Denver . . . . . . . . . . . . . . 36.4 23.2 40.4Detroit . . . . . . . . . . . . . . 34.8 20.1 45.1Kansas City. . . . . . . . . . 17.7 11.2 71.1Los Angeles . . . . . . . . . 17.1 22.5 60.4Philadelphia . . . . . . . . . 35.4 18.6 46.0Seattle . . . . . . . . . . . . . . 10.3 7.8 81.9
19EFFECTIVENESS OF QUALITY ASSURANCE
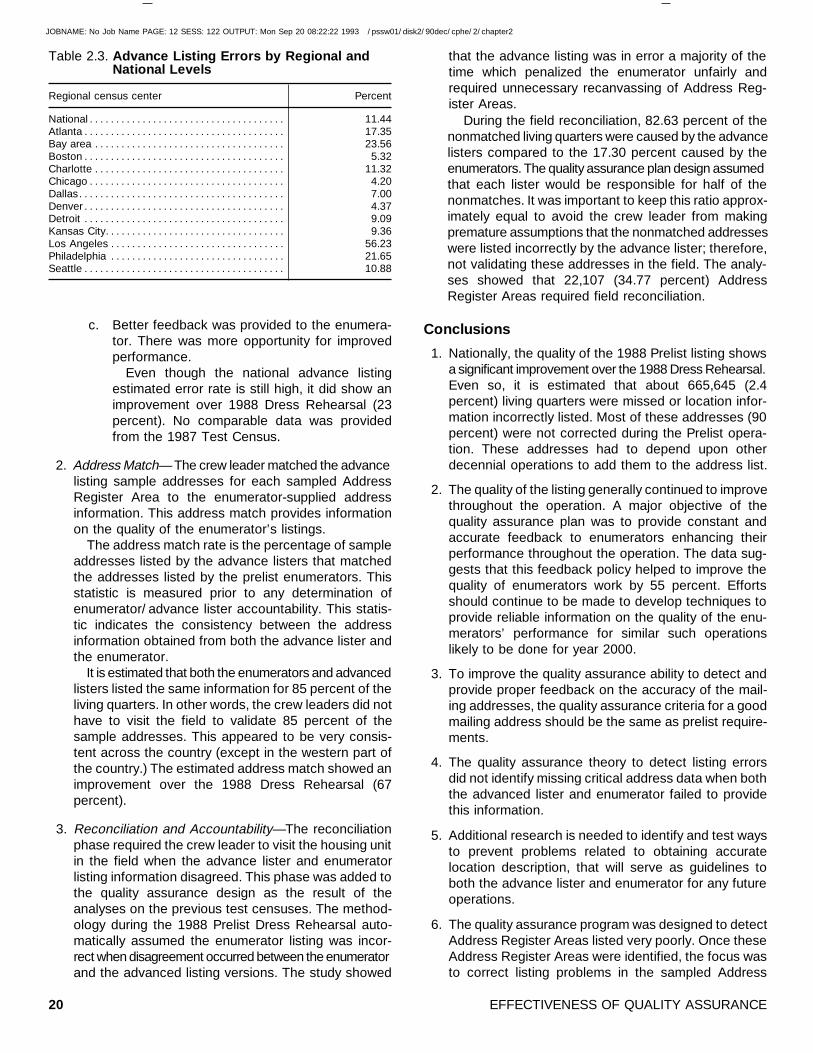
JOBNAME: No Job Name PAGE: 12 SESS: 122 OUTPUT: Mon Sep 20 08:22:22 1993 / pssw01/ disk2/ 90dec/ cphe/ 2/ chapter2
c. Better feedback was provided to the enumera-tor. There was more opportunity for improvedperformance.
Even though the national advance listingestimated error rate is still high, it did show animprovement over 1988 Dress Rehearsal (23percent). No comparable data was providedfrom the 1987 Test Census.
2. Address Match— The crew leader matched the advancelisting sample addresses for each sampled AddressRegister Area to the enumerator-supplied addressinformation. This address match provides informationon the quality of the enumerator’s listings.
The address match rate is the percentage of sampleaddresses listed by the advance listers that matchedthe addresses listed by the prelist enumerators. Thisstatistic is measured prior to any determination ofenumerator/ advance lister accountability. This statis-tic indicates the consistency between the addressinformation obtained from both the advance lister andthe enumerator.
It is estimated that both the enumerators and advancedlisters listed the same information for 85 percent of theliving quarters. In other words, the crew leaders did nothave to visit the field to validate 85 percent of thesample addresses. This appeared to be very consis-tent across the country (except in the western part ofthe country.) The estimated address match showed animprovement over the 1988 Dress Rehearsal (67percent).
3. Reconciliation and Accountability—The reconciliationphase required the crew leader to visit the housing unitin the field when the advance lister and enumeratorlisting information disagreed. This phase was added tothe quality assurance design as the result of theanalyses on the previous test censuses. The method-ology during the 1988 Prelist Dress Rehearsal auto-matically assumed the enumerator listing was incor-rect when disagreement occurred between the enumeratorand the advanced listing versions. The study showed
that the advance listing was in error a majority of thetime which penalized the enumerator unfairly andrequired unnecessary recanvassing of Address Reg-ister Areas.
During the field reconciliation, 82.63 percent of thenonmatched living quarters were caused by the advancelisters compared to the 17.30 percent caused by theenumerators. The quality assurance plan design assumedthat each lister would be responsible for half of thenonmatches. It was important to keep this ratio approx-imately equal to avoid the crew leader from makingpremature assumptions that the nonmatched addresseswere listed incorrectly by the advance lister; therefore,not validating these addresses in the field. The analy-ses showed that 22,107 (34.77 percent) AddressRegister Areas required field reconciliation.
Conclusions
1. Nationally, the quality of the 1988 Prelist listing showsa significant improvement over the 1988 Dress Rehearsal.Even so, it is estimated that about 665,645 (2.4percent) living quarters were missed or location infor-mation incorrectly listed. Most of these addresses (90percent) were not corrected during the Prelist opera-tion. These addresses had to depend upon otherdecennial operations to add them to the address list.
2. The quality of the listing generally continued to improvethroughout the operation. A major objective of thequality assurance plan was to provide constant andaccurate feedback to enumerators enhancing theirperformance throughout the operation. The data sug-gests that this feedback policy helped to improve thequality of enumerators work by 55 percent. Effortsshould continue to be made to develop techniques toprovide reliable information on the quality of the enu-merators’ performance for similar such operationslikely to be done for year 2000.
3. To improve the quality assurance ability to detect andprovide proper feedback on the accuracy of the mail-ing addresses, the quality assurance criteria for a goodmailing address should be the same as prelist require-ments.
4. The quality assurance theory to detect listing errorsdid not identify missing critical address data when boththe advanced lister and enumerator failed to providethis information.
5. Additional research is needed to identify and test waysto prevent problems related to obtaining accuratelocation description, that will serve as guidelines toboth the advance lister and enumerator for any futureoperations.
6. The quality assurance program was designed to detectAddress Register Areas listed very poorly. Once theseAddress Register Areas were identified, the focus wasto correct listing problems in the sampled Address
Table 2.3. Advance Listing Errors by Regional andNational Levels
Regional census center Percent
National . . . . . . . . . . . . . . . . . . . . . . . . . . . . . . . . . . . . . 11.44Atlanta . . . . . . . . . . . . . . . . . . . . . . . . . . . . . . . . . . . . . . 17.35Bay area . . . . . . . . . . . . . . . . . . . . . . . . . . . . . . . . . . . . 23.56Boston . . . . . . . . . . . . . . . . . . . . . . . . . . . . . . . . . . . . . . 5.32Charlotte . . . . . . . . . . . . . . . . . . . . . . . . . . . . . . . . . . . . 11.32Chicago . . . . . . . . . . . . . . . . . . . . . . . . . . . . . . . . . . . . . 4.20Dallas. . . . . . . . . . . . . . . . . . . . . . . . . . . . . . . . . . . . . . . 7.00Denver . . . . . . . . . . . . . . . . . . . . . . . . . . . . . . . . . . . . . . 4.37Detroit . . . . . . . . . . . . . . . . . . . . . . . . . . . . . . . . . . . . . . 9.09Kansas City. . . . . . . . . . . . . . . . . . . . . . . . . . . . . . . . . . 9.36Los Angeles . . . . . . . . . . . . . . . . . . . . . . . . . . . . . . . . . 56.23Philadelphia . . . . . . . . . . . . . . . . . . . . . . . . . . . . . . . . . 21.65Seattle . . . . . . . . . . . . . . . . . . . . . . . . . . . . . . . . . . . . . . 10.88
20 EFFECTIVENESS OF QUALITY ASSURANCE
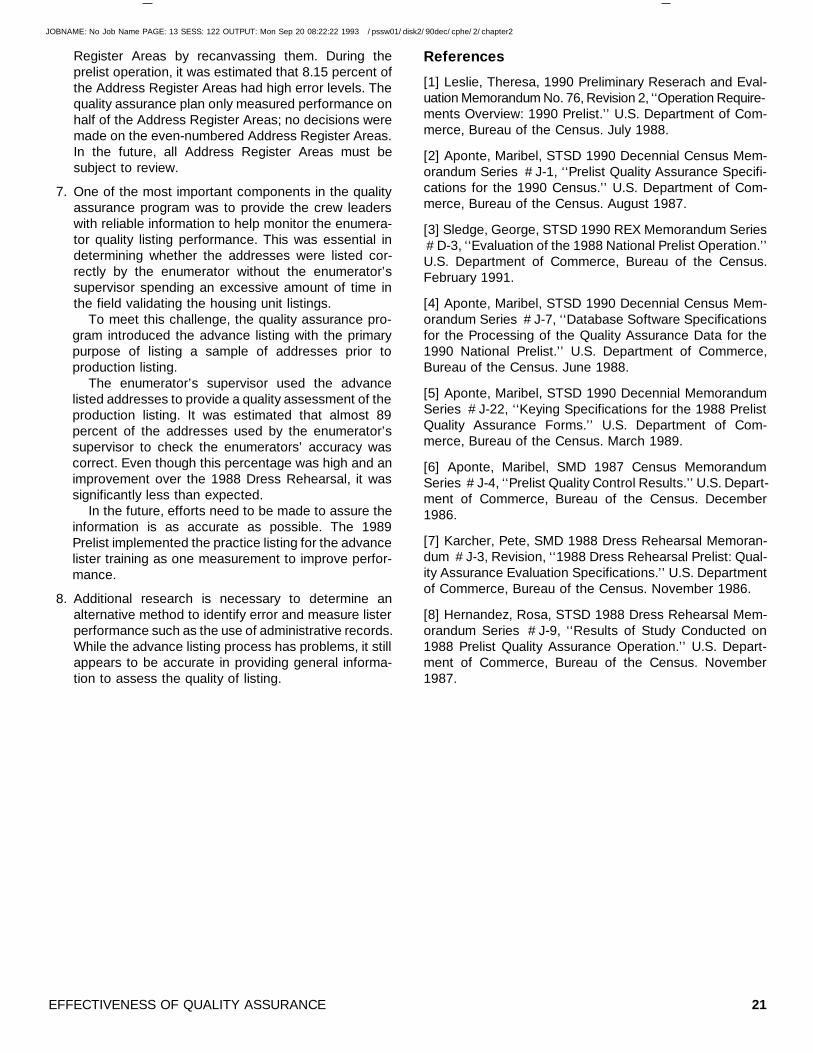
JOBNAME: No Job Name PAGE: 13 SESS: 122 OUTPUT: Mon Sep 20 08:22:22 1993 / pssw01/ disk2/ 90dec/ cphe/ 2/ chapter2
Register Areas by recanvassing them. During theprelist operation, it was estimated that 8.15 percent ofthe Address Register Areas had high error levels. Thequality assurance plan only measured performance onhalf of the Address Register Areas; no decisions weremade on the even-numbered Address Register Areas.In the future, all Address Register Areas must besubject to review.
7. One of the most important components in the qualityassurance program was to provide the crew leaderswith reliable information to help monitor the enumera-tor quality listing performance. This was essential indetermining whether the addresses were listed cor-rectly by the enumerator without the enumerator’ssupervisor spending an excessive amount of time inthe field validating the housing unit listings.
To meet this challenge, the quality assurance pro-gram introduced the advance listing with the primarypurpose of listing a sample of addresses prior toproduction listing.
The enumerator’s supervisor used the advancelisted addresses to provide a quality assessment of theproduction listing. It was estimated that almost 89percent of the addresses used by the enumerator’ssupervisor to check the enumerators’ accuracy wascorrect. Even though this percentage was high and animprovement over the 1988 Dress Rehearsal, it wassignificantly less than expected.
In the future, efforts need to be made to assure theinformation is as accurate as possible. The 1989Prelist implemented the practice listing for the advancelister training as one measurement to improve perfor-mance.
8. Additional research is necessary to determine analternative method to identify error and measure listerperformance such as the use of administrative records.While the advance listing process has problems, it stillappears to be accurate in providing general informa-tion to assess the quality of listing.
References
[1] Leslie, Theresa, 1990 Preliminary Reserach and Eval-uation Memorandum No. 76, Revision 2, ‘‘Operation Require-ments Overview: 1990 Prelist.’’ U.S. Department of Com-merce, Bureau of the Census. July 1988.
[2] Aponte, Maribel, STSD 1990 Decennial Census Mem-orandum Series # J-1, ‘‘Prelist Quality Assurance Specifi-cations for the 1990 Census.’’ U.S. Department of Com-merce, Bureau of the Census. August 1987.
[3] Sledge, George, STSD 1990 REX Memorandum Series# D-3, ‘‘Evaluation of the 1988 National Prelist Operation.’’U.S. Department of Commerce, Bureau of the Census.February 1991.
[4] Aponte, Maribel, STSD 1990 Decennial Census Mem-orandum Series # J-7, ‘‘Database Software Specificationsfor the Processing of the Quality Assurance Data for the1990 National Prelist.’’ U.S. Department of Commerce,Bureau of the Census. June 1988.
[5] Aponte, Maribel, STSD 1990 Decennial MemorandumSeries # J-22, ‘‘Keying Specifications for the 1988 PrelistQuality Assurance Forms.’’ U.S. Department of Com-merce, Bureau of the Census. March 1989.
[6] Aponte, Maribel, SMD 1987 Census MemorandumSeries # J-4, ‘‘Prelist Quality Control Results.’’ U.S. Depart-ment of Commerce, Bureau of the Census. December1986.
[7] Karcher, Pete, SMD 1988 Dress Rehearsal Memoran-dum # J-3, Revision, ‘‘1988 Dress Rehearsal Prelist: Qual-ity Assurance Evaluation Specifications.’’ U.S. Departmentof Commerce, Bureau of the Census. November 1986.
[8] Hernandez, Rosa, STSD 1988 Dress Rehearsal Mem-orandum Series # J-9, ‘‘Results of Study Conducted on1988 Prelist Quality Assurance Operation.’’ U.S. Depart-ment of Commerce, Bureau of the Census. November1987.
21EFFECTIVENESS OF QUALITY ASSURANCE
JOBNAME: No Job Name PAGE: 1 SESS: 159 OUTPUT: Thu Sep 16 14:02:20 1993 / pssw01/ disk2/ 90dec/ cphe/ 2/ chapter3
CHAPTER 3.Data Collection Operations
Data collection for the 1990 decennial census tookplace out of district offices throughout the United States.Because of expected problems in the more densely pop-ulated areas, the mail returns for the areas covered by thetype 1 district offices were sent into six of the sevenprocessing offices. The mail returns for the other non-type1 district offices were sent directly to the district offices.
For 1990, the Census Bureau attempted to providetelephone assistance to those persons requesting help incompleting the questionnaire. The telephone assistancewas conducted out of the offices to which questionnaireswere returned by mail. In this chapter, the quality assur-ance plan for the assistance operation carried out in the sixprocessing offices is discussed. No quality assurance wasimplemented for the assistance conducted out of thedistrict offices.
When the questionnaires were received in the districtoffices, they underwent a clerical edit for completenessand consistency. A quality assurance plan was developedand what was learned is discussed in this chapter.
Not all households returned the questionnaire by mail.Nonresponse Followup was the field operation for collect-ing information from those households that did not returnthe questionnaire by mail. A reinterview program wascreated to protect against purposeful data falsification bythe Nonresponse Followup enumerator. The results fromthis program are discussed in this chapter.
TELEPHONE ASSISTANCE
Introduction and Background
The Telephone Assistance operation was a processwhere respondents from type 1 areas (areas which coverthe central city for the larger cities) called the processingoffice for clarification and/ or assistance in filling out theirquestionnaire. There was no telephone assistance imple-mented in the Kansas City Processing Office, which onlyreceived questionnaires from type 2 areas (areas whichcover cities and suburban areas) and type 3 areas (areaswhich cover the more rural areas of the West and the farNorth). The telephone assistance operation was imple-mented for 16 weeks (April through July 1990). Themajority of the processing offices completed the operationby week 11.
Three reasons for conductng the Telephone Assistanceoperation were: 1) to assist the respondents by answeringquestions they may have had regarding their question-naire, 2) to fill out the questionnaire over the telephone, if
the questionnaire identification number could be providedand the respondent insisted, and 3) to inform the respon-dent that an enumerator would come to their household tocomplete the questionnaire, if the questionnaire identifica-tion number could not be provided.
The effectiveness of the Telephone Assistance opera-tion was measured by a quality assurance plan which dailymonitored a sample of telephone calls from a sample ofclerks. The purposes for monitoring the clerks’ calls were:1) to make sure proper procedures were followed inassisting respondents who called for help, and 2) toprovide feedback to aid clerks having difficulties assistingthe respondents.
The telephone assistance calls were rated by the mon-itors on a scale of 1 to 5; that is, 1—poor, 2—fair,3—satisfactory, 4—good, and 5—excellent, based on howwell the telephone assistance clerks performed the threecharacteristics listed below.
The quality level of each clerk was rated based on thesethree characteristics: 1) proper introduction, 2) questionsanswered properly, and 3) quality of speech. No ‘‘errors’’were recorded for this operation. The ratings betweenmonitors within a processing office and between process-ing offices were subject to variability since monitors inter-preted standards differently. Steps were taken duringtraining to limit this variability. However, some subjectivitymay still exist and care must be exercised when interpret-ing any differences found in between-office comparisons.
Methodology
The quality assurance plan used a sample, dependentverification scheme. The following sampling procedureswere implemented.
1. Sampling Scheme—For the first week of the opera-tion, a sample of eight telephone assistance clerks,per telephone assistance unit/ subunit, per shift, perday were selected for monitoring. Four supervisor-selected clerks were identified first and then fourclerks were selected randomly. The clerks selected bythe supervisor were chosen based on the clerks’deficiencies suspected by the supervisor. After thefirst week, two supervisor-selected clerks and tworandomly selected clerks were monitored each day. Aclerk could have been selected by the supervisormultiple times.
2. Monitoring—For each clerk sampled, four telephonecalls were monitored at random for the day and shiftthey were selected. A quality assurance monitoringrecordkeeping form was completed for each moni-tored clerk, indicating how well the clerk performed thefollowing:
23EFFECTIVENESS OF QUALITY ASSURANCE

JOBNAME: No Job Name PAGE: 2 SESS: 166 OUTPUT: Thu Sep 16 14:02:20 1993 / pssw01/ disk2/ 90dec/ cphe/ 2/ chapter3
a. Introduction—properly introduced and identifiedhimself or herself to the respondent.
b. Questions answered properly—gave correct andappropriate answers for all questions and fol-lowed procedures correctly.
c. Speech quality—spoke clearly and at an accept-able pace and volume.
3. Recordkeeping/ Feedback—All quality assurance mon-itoring records were completed as the monitoring tookplace. Quality assurance output reports (daily andweekly) were generated for the supervisors to use toprovide feedback to the clerks. The telephone assis-tance monitors were supposed to write comments onthe quality assurance monitoring records for any belowsatisfactory ratings given. These comments were usedto provide feedback to the clerks. (See an example ofForm D-2291, Quality Assurance Monitoring Recordfor Telephone Assistance, in appendix B.)
A 20-percent sample of all completed recordkeepingtelephone assistance forms were received at headquartersfrom the processing offices. Seventy-five quality assur-ance forms from each processsing office were selectedfrom the 20- percent sample to evaluate the operation
Limitations
The reliability of the analysis and concusions for thequality assurance plan depends on the following:
• Accuracy of the clerical recording of quality assurancedata.
• Accuracy of keying the quality assurance data into theAutomated Recordkeeping System.
• The evaluation of the clerks for the monitoring operationwas subjective.
• One clerk may be in the sample mulitple times causngnegative bias in the data due to the supervisor selectingclerks with problems.
• The monitor’s desk was often within view of the tele-phone assistance clerk being monitored.
Results
Overall, data were available for 2,900 monitored clerks.(Note: clerks were counted once each time they weremonitored.)
Summary of the Automated Recordkeeping SystemData—Table 3.1 is a comparison of the quality level of theassistance clerks’ monitored calls. For each clerk moni-tored, there should have been 12 ratings given; that is, 4calls per clerk times 3 characteristics per call. On theaverage, the processing offices did not monitor 4 calls per
clerk. Over all processing offices, there were approxi-mately 2.2 percent below satisfactory ratings, and 88.8percent above satisfactory ratings issued. Feedback wasgiven to each clerk whose rating was below satisfactory onthe measurement scale.
Summary of Quality Levels of All MonitoringCharacteristics—The quality levels of all characteristicswere measured on an ordinal level measurement scale of1 to 5. The below satisfactory total included both poor andfair ratings combined. The above satisfactory total includedboth good and excellent ratings combined.
Figure 3.1 shows that the Jacksonville Processing Officereported the largest percentage of below satisfactoryratings with 5.0 percent. This office also reported the
Table 3.1. Number of Clerks, Monitored Calls, andRatings by Processing Office
Processingoffice
Numberof
clerksmoni-tored
Averagenumberof calls
moni-tored
perclerk1
Number of ratings
Total
Belowsatis-
factorySatis-
factory
Abovesatis-
factory
Baltimore . . . . 234 3.4 2,398 39 167 2,192Jacksonville . . 614 2.7 5,064 254 1,225 3,585San Diego . . . 832 3.5 8,662 61 521 8,080Jeffersonville . 668 2.8 5,593 21 169 5,403Austin . . . . . . . 297 3.7 3,338 140 234 2,964Albany. . . . . . . 255 2.1 1,587 58 86 1,443
Total . . . . 2,900 3.1 26,642 573 2,402 23,667
Note: The Kansas City Processing Office is not included in this tablebecause the telephone assistance operation was not implemented in thatoffice.
1The average number of calls monitored was computed as follows:total number of ratings divided by three characteristics per call divided bythe number of monitored clerks.
24 EFFECTIVENESS OF QUALITY ASSURANCE

JOBNAME: No Job Name PAGE: 3 SESS: 167 OUTPUT: Thu Sep 16 14:02:20 1993 / pssw01/ disk2/ 90dec/ cphe/ 2/ chapter3
smallest percentage of above satisfactory ratings at 70.8percent. These percentages were significantly differentcompared to the other five offices at the alpha= .10 level.The Census Bureau believes this is mostly due to thesubjective nature of the monitoring process. It is knownthat for the first week and part of the second week,monitoring was not conducted as specified in the Jackson-ville office because of the high volume of Spanish lanuagecalls received. The office reporting the smallest percent-age of below satisfactory ratings was the JeffersonvilleProcessing Office with 0.4 percent. This office also reportedthe most above satisfactory ratings at 96.6 percent. Thesepercentages were significantly different compared to theother processing offices.
Learning Curve for Above Satisfactory Ratings—Figure3.2 shows a downward trend in the above satisfactoryratings issued during weeks 2 to 4. This happened becausenot all processing offices were included, and also therewere untrained clerks assisting with calls. The processingoffices hired what they believed was a sufficient number ofassistance clerks. In the first few weeks, there were morecalls than clerks hired to handle them. The processingoffices used clerks who had not had telephone assistancetraining and gave them a quick overview of the operation.This caused the above satisfactory ratings to decreaseslightly until the new, less trained clerks became morefamiliar with their new assignment.
In weeks 11 to 14, not all processing offices wereincluded. The San Diego Processing Office assisted a
large number of Hispanic and Asian Pacific Islander call-ers. This is one reason why they had more above satisfac-tory ratings than the other processing offices. There is noknown reason why the Jeffersonville and JacksonvilleProcessing Offices had a smaller number of above satis-factory ratings, except that they monitored fewer calls thanthe San Diego Processing Office during these weeks.
In weeks 15 and 16 there was a decrease in the numberof above satisfactory ratings because not all processingoffices were receiving calls. Also, there was a smallersample size used by those processing offices still conduct-ing the operation.
Sampled Quality Assurance Forms DataSummary
A sample of the quality assurance Monitoring Records,Form D-2291, was selected from each office. The sampleddata were used to determine the distribution of ratings forthe three characteristics.
For each call, a clerk was given a rating of 1 to 5depending on their performance. For analysis purposes,the poor/ fair ratings were labeled below satisfactory andthe good/ excellent ratings were labeled above satisfac-tory. The totals of all ratings for each characteristic are notalways the same. This is because some processing officesdid not rate each characteristic for every call.
The characteristics most detected with below satisfac-tory ratings were ‘‘proper introduction’’ and ‘‘questionsanswered properly.’’ These characteristics each had about38 percent of the below satisfactory ratings issued for the3 characteristics used. Tables 3.2, 3.3, and 3.4 are adistribution of ratings for monitoring characteristics foreach processing office.
Summary of Quality Assurance Data
A goodness-of-fit test was used to test whether or notthe data summary tables fit the automated recordkeepingsystem data distribution in figure 3.1. When comparing byprocessing office, there was sufficient evidence at thealpha= .10 level to indicate a significant difference for theJacksonville office. There was no significant difference forthe remaining offices. The quality assurance summary datafor these offices were a good representation of the auto-mated recordkeeping system summary data. The Jackson-ville office showed a significant difference because thesample selected from the recordkeeping forms containedmore below satisfactory ratings than the automated record-keeping system data revealed.
Conclusions
Overall, the processing offices did a good job monitor-ing the clerks. However, there were problems in thebeginning of the operation because procedures called for
25EFFECTIVENESS OF QUALITY ASSURANCE

JOBNAME: No Job Name PAGE: 4 SESS: 163 OUTPUT: Thu Sep 16 14:02:20 1993 / pssw01/ disk2/ 90dec/ cphe/ 2/ chapter3
decreasing by half the number of clerks to be monitoredafter the first week. This caused the processing offices toassume they could decrease the number of calls to bemonitored as well. In addition, fewer clerks were monitoredthan specified because of a lack of monitoring equipment,and the heavy volume of calls requiring many additionalclerks to answer incoming calls. After the operation stabi-lized, most offices began implementing the quality assur-ance plan as specified.
The monitoring records were not always completed asspecified in the procedures. The supervisor assisted thoseclerks needing extra help interacting with the respondents.
The operation was successful because it allowed theCensus Bureau to fully answer the respondent question(s).It also enabled the Census Bureau to fulfill the request fora questionnaire to be completed by phone, mailed to therespondent, or instructions to be given so the process
would be implemented correctly. The telephone assis-tance quality assurance monitoring was appropriate becauseit assured the Census Bureau that the respondents werereceiving the necessary information.
The quality assurance plan helped identify those clerkswho had problems with 1) assisting the respondents and 2)meeting the standards of the three monitoring character-istics. The supervisors/ monitors provided positive andnegative feedback to the assistance clerks in a timelymanner.
This was a subjective quality assurance plan and thereports analyzed are very subjective in nature. Due to thissubjectivity, it is difficult to measure the impact the planhad on the operation. However, based on the analysis, thefollowing recommendations were suggested for similarfuture operations:
• Provide sufficient monitoring stations and install theequipment before the telephone operation begins. Earlyand complete monitoring provides the best opportunityfor improvement.
• Change the measurement levels on the recordkeepingforms to have three rating levels (poor, average, andgood) rather than five (poor, fair, satisfactory, good, andexcellent). This would make it easier for the monitor torate the clerks.
• Place monitors’ desk out of view of the clerks. This willeliminate the clerks from knowing when they are beingmonitored.
• Monitor how often and what type of incorrect informationis given out to the respondents.
Reference
[1] Steele, LaTanya F., STSD 1990 Qualit Assurance REXMemorandum Series # N2, ‘‘Summary of Quality Assur-ance Results for the 1990 Telephone Assistance Opera-tion.’’ U.S. Department of Commerce, Bureau of the Cen-sus. May 1991.
CLERICAL EDIT
Introduction and Background
Mail return questionnaires in type 2 (areas which covercentral city for the larger cities), type 2A (areas whichcover cities, suburban, rural, and seasonal areas in thesouth and midwest), and type 3 (areas which cover themore rural areas of the west and far north) district officeswere reviewed in the clerical edit operation to ensure allrecorded information was clear and complete, and allrequired questions were answered. A quality assurancecheck was designed to provide information on the fre-quency and types of errors made so feedback could beprovided to the edit clerks. In this way, large problemscould be avoided and all staff could continuously improve.
Table 3.2. Number of Ratings (Percent) for ‘‘ProperIntroduction’’
Processingoffice
Belowsatisfactory
(percent)Satisfactory
(percent)
Abovesatisfactory
(percent)PO totals(percent)
Baltimore . . . . 2 (0.7) 20 (6.6) 279 (92.7) 301 (100.0)Jacksonville . . 13 (6.2) 71 (33.8) 126 (60.0) 210 (100.0)San Diego . . . 0 (0.0) 25 (9.3) 245 (90.7) 270 (100.0)Jeffersonville . 2 (0.9) 2 (0.9) 215 (98.2) 219 (100.0)Austin . . . . . . . 16 (7.5) 12 (5.7) 184 (86.8) 212 (100.0)Albany. . . . . . . 9 (3.9) 10 (4.4) 210 (91.7) 229 (100.0)
Total . . . . 42 (2.9) 140 (9.7) 1,259 (87.4) 1,441 (100.0)
Table 3.3. Number of Ratings (Percent) for ‘‘Ques-tions Answered Properly’’
Processingoffice
Belowsatisfactory
(percent)Satisfactory
(percent)
Abovesatisfactory
(percent)PO totals(percent)
Baltimore . . . . 7 (2.3) 24 (8.0) 270 (89.7) 301 (100.0)Jacksonville . . 12 (5.9) 85 (41.5) 108 (52.7) 205 (100.0)San Diego . . . 0 (0.0) 17 (4.6) 252 (68.3) 269 (100.0)Jeffersonville . 1 (0.5) 17 (7.8) 200 (91.7) 218 (100.0)Austin . . . . . . . 11 (5.3) 11 (5.3) 187 (89.5) 209 (100.0)Albany. . . . . . . 10 (4.5) 16 (7.1) 198 (88.4) 224 (100.0)
Total . . . . 41 (2.9) 170 (11.9) 1,215 (85.2) 1,426 (100.0)
Table 3.4. Number of Ratings (Percent) for ‘‘Qualityof Speech’’
Processingoffice
Belowsatisfactory
(percent)Satisfactory
(percent)
Abovesatisfactory
(percent)PO totals(percent)
Baltimore . . . . 0 (0.0) 23 (7.6) 279 (92.4) 302 (100.0)Jacksonville . 13 (6.3) 72 (34.6) 123 (59.1) 208 (100.0)San Diego . . . 0 (0.0) 13 (4.8) 256 (95.2) 269 (100.0)Jeffersonville . 0 (0.0) 8 (3.7) 211 (96.3) 219 (100.0)Austin . . . . . . . 7 (3.3) 13 (6.2) 191 (90.5) 211 (100.0)Albany . . . . . . 5 (2.2) 11 (4.8) 212 (93.0) 228 (100.0)
Total . . . . 25 (1.7) 140 (9.7) 1,272 (88.5) 1,437 (100.0)
26 EFFECTIVENESS OF QUALITY ASSURANCE

JOBNAME: No Job Name PAGE: 5 SESS: 164 OUTPUT: Thu Sep 16 14:02:20 1993 / pssw01/ disk2/ 90dec/ cphe/ 2/ chapter3
Methodology
The questionnaires were clustered into work units,consisting of a maximum of 30 long-form or 100 short-formquestionnaires each. A sample of questionnaires wasselected from each work unit for verification.
For the first 10 working days of the operation, thesampling rate was 10 percent. After the first 10 workingdays of the operation, the sampling rate was reduced to 2percent for short-form questionnaires and 3.3 percent forlong-form questionnaires.
Each edit clerk or verifier trainee was given a maximumof two work units to determine whether training wassuccessful. These work units were 10 percent verified. Awork unit was unacceptable if it had an estimated error rategreater than 50 percent on an item basis. If the first workunit was unacceptable, feedback on the type of error(s)was given by the supervisor. The work unit was then givento a qualified edit clerk to be re-edited, and a second workunit was given to the trainee clerk. If the second work unitwas also unacceptable, the work unit was given to aqualified edit clerk to be re-edited, and the trainee wasremoved from the clerical edit operation. If either of the twowork units was acceptable, the trainee was assumed tohave successfully completed training and was qualified toperform the clerical edit operation.
The sample questionnaires were verified using a depen-dent verification scheme. During verification the verifierassigned an error for:
1. An item not being edited, but should have been.
2. An item being edited incorrectly.
3. An item being edited, but should not have been.
Verifiers corrected all detected errors on the samplequestionnaires.
For each work unit, the verifier completed a record,indicating the number of edit actions and the number ofedit errors, and identifying the question on which the erroroccurred and the type of error. All data from these recordswere keyed into a computer system located in the districtoffice. The computer system generated cross-tabulationreports, outlier reports, and detailed error reports. Thesupervisors used these reports to identify types and sourcesof errors. The supervisors also used the cross-tabulationreports, outlier reports, detailed error reports, and com-pleted quality assurance records to provide feedback tothe edit clerks and verifiers to try to resolve any problems.
Limitations
Quality assurance records were received from approxi-mately 70 percent of the type 2, 2A, and 3 district offices.Data for the remaining 30 percent of the type 2, 2A, and 3district offices are assumed to be similar to those recordsthat were received.
A total of 120 edit clerks were used to estimate the errorrate for the entire operation. One clerk was selected fromeach of the 120 sample district offices. It is assumed thatthere was no bias in the selection of clerks, and the 120clerks chosen represent all clerks from all type 2, 2A, and3 district offices.
The 120 district offices and sample clerks from thesedistrict offices were selected using simple random sam-pling. The standard errors were calculated assuming sim-ple random sampling.
The estimated error rate for a particular type of error iscomputed as the number of errors for that particular typedivided by the total number of edit actions. Since an editaction could be taken with no error occurring, the sum ofthe estimated error rates by type does not equal 100percent.
This report assumes that the verifier is correct. Since averifier was not necessarily a more experienced or expertedit clerk, an item determined by the verifier to be in errormay have been a difference in opinion or interpretation ofprocedures.
Results
Before analyzing the data, each clerical edit qualityassurance record underwent a weighting process. Sinceonly a sample of questionnaires in each work unit wasverified, each record received a weighting factor in order toestimate the error rate for the entire operation rather thanthe sample error rate. The weighting factor for a work unitwas computed as the number of questionnaires in the workunit divided by the number of questionnaires verified in thework unit rounded to the nearest whole number.
Operational Error Rates by Week
The overall weighted, estimated incoming error rate wasapproximately 7.4 percent with a standard error of 0.51percent. Table 3.5 shows the sample number of work unitsedited, sample number of questionnaires verified, weightedestimated error rates, and standard errors for each week.
Figure 3.3 illustrates the weighted estimated weeklyerror rates. The estimated error rate increased fromMarch 11 to March 25 and decreased from March 25 toMay 6. The estimated error rate increased again from May6 to May 20 and decreased from May 20 to July 8. Noapparent reasons can be given for these increases anddecreases.
Table 3.6 shows the sample number of work unitsedited, sample number of questionnaires verified, and theweighted estimated error rates for each of the 3 districtoffice types. The weighted estimated error rates for type 2,2A, and 3 district offices were approximately 7.9, 5.5, 7.8percent, respectively. The estimated error rate for type 2Adistrict offices is statistically different from the estimatederror rates from type 2 and 3 district offices.
27EFFECTIVENESS OF QUALITY ASSURANCE

JOBNAME: No Job Name PAGE: 6 SESS: 165 OUTPUT: Thu Sep 16 14:02:20 1993 / pssw01/ disk2/ 90dec/ cphe/ 2/ chapter3
Learning Curve
A learning curve was determined by assigning all editclerks the same starting week in the operation regardlessof when they began. A learning curve reflects the durationof time worked regardless of date. The 582 sample workunits edited during learning curve week 1 represent thefirst week of work for all sample clerks regardless of whenthey started.
Table 3.7 shows the sample number of work unitsedited, sample number of questionnaires verified, weightedestimated error rates, and standard errors for each learn-ing curve week.
Figure 3.4 illustrates the weighted estimated weeklylearning curve error rates.
The curve shows there was learning throughout. Thereis no known explanation for the large jump seen in weeks7 and 8.
Types of Errors
Errors committed by edit clerks were classified as oneor more of the following types of errors: (1) erase, (2) fill, or(3) followup. An erase error occurred if an edit clerk failed
to erase stray marks or write-in answers which crossed twoor more Film Optical Sensing Device for Input into Com-puter (FOSDIC) circles. For example, if a respondent wrotein ‘‘father’’ across two or more FOSDIC circles and filledthe circle corresponding to ‘‘father/ mother,’’ the edit clerkshould have erased the word ‘‘father.’’ If this was not done,the edit clerk was charged with an erase error.
A fill error occurred if an edit clerk failed to fill an item.For example, if the questionnaire passed edit, the edit clerkshould have filled the ‘‘ED’’ box in item E of the ‘‘ForCensus Use’’ area. If this was not done, the edit clerk wascharged with a fill error.
Table 3.7. Estimated Weekly Learning Curve ErrorRates
WeekSample
number ofwork units
edited
Samplenumber ofquestion-
nairesverified
Weightedestimatederror rate(percent)
Standarderror
(percent)
1 . . . . . . . . . . . . . . . . . . . 582 4,171 11.3 2.62 . . . . . . . . . . . . . . . . . . . 1,020 5,626 11.0 1.33 . . . . . . . . . . . . . . . . . . . 934 3,161 6.3 0.94 . . . . . . . . . . . . . . . . . . . 778 2,004 5.9 0.95 . . . . . . . . . . . . . . . . . . . 576 1,349 4.9 1.56 . . . . . . . . . . . . . . . . . . . 416 913 4.0 1.77 . . . . . . . . . . . . . . . . . . . 353 745 5.4 1.58 . . . . . . . . . . . . . . . . . . . 296 668 8.3 1.49 . . . . . . . . . . . . . . . . . . . 254 638 3.8 1.510 . . . . . . . . . . . . . . . . . . 276 650 2.4 1.511 . . . . . . . . . . . . . . . . . . 199 406 3.0 1.712 . . . . . . . . . . . . . . . . . . 121 185 4.6 2.013 . . . . . . . . . . . . . . . . . . 65 74 0.5 0.514-16 . . . . . . . . . . . . . . 61 63 0.4 2.8
Overall . . . . . . . . . . 5,931 20,653 6.9 0.5
Table 3.6. Estimated Error Rates By District OfficeType
District office typeSample
number ofwork units
edited
Samplenumber ofquestion-
nairesverified
Weightedestimatederror rate(percent)
Standarderror
(percent)
Type 2 . . . . . . . . . . . . . . 1,894 6,682 7.9 0.9Type 2A. . . . . . . . . . . . . 2,187 7,180 5.5 0.5Type 3 . . . . . . . . . . . . . . 1,850 6,791 7.8 1.0
Overall . . . . . . . . . . 5,931 20,653 6.9 0.5
Table 3.5. Estimated Weekly Error Rates
Date (1990)Sample
number ofwork units
edited
Samplenumber ofquestion-
nairesverified
Weightedestimatederror rate(percent)
Standarderror
(percent)
March 11-17 . . . . . . . . . 11 67 2.8 3.1March 18-24 . . . . . . . . . 54 343 6.9 1.7March 25-31 . . . . . . . . . 379 2,719 14.6 4.0April 1-7. . . . . . . . . . . . . 791 4,286 9.7 1.5April 8-14. . . . . . . . . . . . 889 3,728 7.6 1.0April 15-21 . . . . . . . . . . 821 2,647 6.0 0.8April 22-28 . . . . . . . . . . 602 1,592 5.3 0.9April 29-May 5 . . . . . . . 418 1,034 4.4 1.7May 6-12 . . . . . . . . . . . . 222 503 4.0 1.2May 13-19. . . . . . . . . . . 302 757 6.5 3.2May 20-26. . . . . . . . . . . 354 727 8.0 1.5May 27-June 2 . . . . . . . 276 707 5.6 1.4June 3-9 . . . . . . . . . . . . 307 689 5.1 1.5June 10-16 . . . . . . . . . . 211 396 4.7 1.7June 17-23 . . . . . . . . . . 149 247 2.7 1.2June 24-30 . . . . . . . . . . 74 113 0.7 0.5July 1-7 . . . . . . . . . . . . . 44 46 0.5 3.9July 8-August 4(4 weeks) . . . . . . . . . . 27 52 0.4 0.4
Overall . . . . . . . . . . 5,931 20,653 6.9 0.5
28 EFFECTIVENESS OF QUALITY ASSURANCE

JOBNAME: No Job Name PAGE: 7 SESS: 157 OUTPUT: Thu Sep 16 14:02:20 1993 / pssw01/ disk2/ 90dec/ cphe/ 2/ chapter3
A followup error occurred if an edit clerk failed to circlethe question number for any housing question and/ orpopulation question which was not properly answered bythe respondent. A followup error also occurred if an editclerk failed to write the question number above the personcolumn for any incomplete population question on the 100-percent portion of the questionnaire. A circled questionnumber or question number written above a person col-umn indicated the question should be asked during thefollowup operation if the questionnaire failed edit and wassent to telephone followup.
More than one type of error may occur on an item. Theestimated error rate for a particular type of error is com-puted as the number of errors for that particular typedivided by the total number of edit actions for a time period.Since an edit action could be taken with no error occurring,the sum of the estimated error rates by type does not equal100 percent.
The most common type of error committed by editclerks was followup errors. The estimated error rate forfollowup errors was 4.5 percent. The estimated error ratesfor fill and erase errors were 3.7 percent and 2.5 percent,respectively. Table 3.8 illustrates the estimated error ratesby type of error for learning curve weeks 1-2, 3-16, and theentire operation.
The comparison of the estimated error rates betweeneach type are statistically different.
Errors By Item
Figure 3.5 illustrates the items which accounted forapproximately 73 percent of all errors by item. The error
Table 3.8. Estimated Error Rates by Type
Estimated error rate(percent)
Type of error
Learning curveweeks 1-2
Learning curveweeks 3-16
Entireoperation
Erase. . . . . . . . . . . . . . 3.3 2.0 2.5Fill . . . . . . . . . . . . . . . . 5.6 2.6 3.7Followup. . . . . . . . . . . 6.8 3.3 4.5
Item Legend
2 Relationship
4 Race5 Age and year of birth7 Spanish/ Hispanic origin14 Migration22 Place of work28 Industry29 Occupation31 Work experience in 198932 Income in 19892 Relationship99 This was recorded when an error occurred but could
not be charged to a specific item.A For Census Use Area—total number of personsB For Census Use Area—type of unitDEC Decision whether the questionnaire passes or fails editE For Census Area containing the ‘‘ED’’ circleF For Census Area—coverageH1 CoverageH5 Property sizeH7 Monthly rentH20 Yearly utility cost
29EFFECTIVENESS OF QUALITY ASSURANCE

JOBNAME: No Job Name PAGE: 8 SESS: 165 OUTPUT: Thu Sep 16 14:02:20 1993 / pssw01/ disk2/ 90dec/ cphe/ 2/ chapter3
frequency for an item is computed as the frequency that anitem occurred in error divided by the sum of frequencies forall unique items in error. The estimated item error ratecannot be calculated because the number of times an itemwas answered is not available.
The DEC, A, E, F, and H1 errors may be related. ItemDEC represents the decision whether the questionnairepasses or fails edit. Item A pertains to the ‘‘For CensusUse’’ (FCU) area in which clerks determine the totalnumber of persons on the questionnaire. Item A is codedas the greater of the number of names listed on thehousehold roster (question 1a) and the number of com-pleted person columns. Item E pertains to the ‘‘For CensusUse’’ area in which clerks filled in the ‘‘ED’’ box if thequestionnaire passed edit. Item F pertains to the ‘‘ForCensus Use’’ area coverage items. Question H1 asks therespondent if the names of all persons living in thehousehold are listed on the household roster.
Conclusions
The purpose of the quality assurance plan was toestimate the quality of the operation, determine and cor-rect source(s) of errors, and provide information useful forgiving feedback to the edit clerks. The quality assuranceplan fulfilled these purposes. The operational error ratesand learning curve show a general decrease in error ratesover time. This implies that feedback was given andperformance improved.
Based on data from the first 2 weeks of the operation(learning curve data), it is estimated that, without feedback,the error rate would have been approximately 11.1 per-cent. The actual operational weighted, estimated, errorrate was approximately 6.9 or 7.4 percent. Therefore, theestimated error rate decreased approximately 37.8 per-cent, at least partially as the result of feedback. Theestimated error rates for each type of error decreased fromthe first 2 weeks to the remaining weeks of the operation.
References
[1] Williams, Eric, 1990 Preliminary Research and Evalua-tion Memorandum No. 173, ‘‘1990 Decennial CensusQuality Assurance Results for the Stateside Clerical EditOperation.’’ U.S. Department of Commerce, Bureau of theCensus. August 1992.
[2] Schultz, Tom, STSD 1990 Decennial Census Memo-randum Series # B-18, ‘‘1990 Decennial Census QualityAssurance Specifications for the Clerical Edit Operation.’’U.S. Department of Commerce, Bureau of the Census.November 1988.
NONRESPONSE FOLLOWUP REINTERVIEW
Introduction and Background
The Nonresponse Followup operation was conducted inmail-back areas for the purpose of obtaining accurateinformation from households that did not return a ques-tionnaire. During the Nonresponse Followup operation,
enumerators visited each nonresponse unit to determinethe occupancy status of the unit on Census Day. Based onthe status, the enumerator completed the appropriateitems on the census questionnaire, even if the householdrespondent said that he/ she returned a questionnaire bymail.
This operation was conducted in 447 out of the 449district offices. The two district offices that did not conductNonresponse Followup were List/ Enumerate areas only.The operation lasted from April 26, 1990, through July 27,1990. During that period of time, the Nonresponse Fol-lowup enumerators interviewed over 34 million housingunits.
The primary function of census enumerators duringNonresponse Followup was to visit each housing unit andgather data according to specific procedures. The enumer-ators under no circumstances were to ‘‘make up’’ data. Ifthey did, this was referred to as fabrication or falsificationand was, of course, illegal, punishable by termination ofemployment and possible fines.
The reinterview program was a quality assurance oper-ation whose major objective was to detect NonresponseFollowup enumerators who were falsifying data and toprovide the information to management so the appropriateadministrative action could be taken to correct the prob-lem.
Methodology
This section provides information on the quality assur-ance design and implementation for Nonresponse Fol-lowup operation [1].
Reinterview Program—During Nonresponse Followup, areinterview program was instituted where a reinterviewenumerator verified the housing occupancy status andhousehold roster from a sample of cases. Reinterview wasnot conducted on the cases completed during closeout ofthe district offices. The objectives of the reinterview pro-gram were to detect data falsification as quickly as possi-ble and to encourage the enumerators’ continuous improve-ment over time. To meet these objectives, a sample ofenumerators’ completed questionnaires were reviewedand the corresponding housing units reinterviewed. Thequestionnaires were selected based on one of two samplemethods, random and administrative.
Sampling Methods—The random sample was designedto identify early fabrication when not much data existed formonitoring fabrication. Each original enumerator’s assign-ment was sampled for reinterview every other day for thefirst 16 days of the Nonresponse Followup operation. Itwas believed this sample would catch those enumeratorsthat would fabricate early in the operation and wouldprovide information to deter other enumerators from start-ing this type of behavior. The administrative sample wasdesigned to take advantage of control and content data, toidentify those enumerators whose work was significantly
30 EFFECTIVENESS OF QUALITY ASSURANCE

JOBNAME: No Job Name PAGE: 9 SESS: 157 OUTPUT: Thu Sep 16 14:02:20 1993 / pssw01/ disk2/ 90dec/ cphe/ 2/ chapter3
‘‘different’’ that it might indicate potential fabrication ofdata. This sample was to start in the third week ofNonresponse Followup when there was expected to beenough data on the enumerators to indicate trends. Thereinterview staff selected questionnaires from only thoseenumerators who had vacancy rate, average householdsize, miles per case, and/ or cases per hour significantlydifferent from other enumerators in their same assignmentarea that could not be explained by the supervisor.
Reinterview and Fabrication Validation Process—Afterthe sample was selected, the reinterviewer proceeded toverify the household status and the household roster onCensus Day by telephone or personal visit. Once thereinterviewer obtained the information from the respon-dent, a preliminary decision (accept or reject) was made onthe potential of fabrication. The decision on ‘‘suspectedfabrication’’ (reject) was based on the following criteria.
1. The unit status from the original interview was differentfrom the unit status obtained during reinterview.
2. The household roster from the original interview con-tained at least a 50 percent difference from thehousehold roster obtained during reinterview.
Limitations
The data in this report are based on a sample of recordsfrom district offices across the country. There were limita-tions encountered while analyzing the data which are givenbelow:
The reliability of all estimates was dependent upon thequality of the data entered on the Reinterview Form andproper implementation of the reinterview procedures.
All estimates were based on information from the ran-dom sample phase of the reinterview program. Randomselection of cases was continued throughout the Nonre-sponse Followup operation within some district offices.Data from the administrative sample were not used toobtain the Nonresponse Followup estimates because ofunmeasured biases due to improper implementation andthe sample not being random. The administrative samplewill be assessed separately from these estimates.
Data from type 3 district offices were not included tocompute the Nonresponse Followup estimates. Type 3district offices conducted both the Nonresponse Followupand List/ Enumerate operations and the data was to beincluded in the List/ Enumerate evaluation.
Results
Based on data from the reinterview program, it wasestimated, overall, that enumerators intentionally providedincorrect data for 0.09 percent of the housing units in theNonresponse Followup operation. This indicated that between20,000 and 42,000 Nonresponse Followup questionnaireswere fabricated during the 1990 census at the 90 percentconfidence level.
The overall estimate of 0.09 percent can be comparedto the ‘‘erroneous fictitious’’ persons estimate of 0.5percent (standard error of 0.10 percent) for the PostEnumeration Survey [2]. Data for the Post EnumerationSurvey estimate were taken from a combination of censusoperations, such as Field Followup, Vacant Delete Check,and Nonresponse Followup, not just for NonresponseFollowup. Also, the Post Enumeration Survey estimation isof persons, while the Nonresponse Followup Reinterviewestimate is of households. Based on these data, it can beconcluded that data falsification was not a significantproblem within the census data collection process.
Four types of offices conducted the Nonresponse Fol-lowup operation; type 1 (metropolitan areas containingapproximately 175,000 housing units), type 2 (usually asuburban area containing approximately 260,000 housingunits), type 2A (suburban, rural, and seasonal areas in thesouth and midwest containing approximately 270,000 hous-ing units), and type 3 (rural areas of the west and far northcontaining approximately 215,000 housing units). Type 3district offices were not selected in the evaluation samplebecause the List/ Enumerate operation also took place inthose district offices. Figure 3.6 provides the estimatedfabrication rate for each of the three district office types.
The degree of reported fabrication was stable acrossthe country, except in type 2 district office areas (suburbanareas with approximately 260,000 housing units or more)which experienced an estimated fabrication rate of 0.05percent. The estimated fabrication rate in type 2 districtoffices was ‘‘greatly’’ different from the national estimate.It was expected that metropolitan areas (type 1 districtoffices) would have a higher fabrication rate than suburban
31EFFECTIVENESS OF QUALITY ASSURANCE

JOBNAME: No Job Name PAGE: 10 SESS: 165 OUTPUT: Thu Sep 16 14:02:20 1993 / pssw01/ disk2/ 90dec/ cphe/ 2/ chapter3
or rural areas, but in fact, type 1 district offices do not havea significantly different estimate from type 2A districtoffices.
The time between the start and end of the NonresponseFollowup operation were divided into three time periods(approximately 3 weeks each) as follows:
• Period 1 = Beginning of the operation throughMay 13th.
• Period 2 = May 14th through June 3rd.
• Period 3 = June 4th through the end of theoperation.
The estimated fabrication rate ranged from 0.09 percentthe first 3 weeks to 0.12 percent the last 3 weeks. Eventhough the point estimate for the last weeks was higherthan the other weeks the difference was not found to besignificant.
The enumerator completed one of three forms duringNonresponse Followup; long form, short form, or deletionrecord. The long form and short form were predesignatedfor occupied and vacant units. The deletion records wereused to account for address listings no longer in existence.Figure 3.7 provides a pictorial presentation on the degreeof fabrication in each of the form types at the national anddistrict office type levels.
As shown in figure 3.7, the data indicate that, across thecountry regardless of the type of area, a higher percent ofdeletion records were fabricated compared to the long orshort forms. The differences between the deletion recordsand both the long and short forms were greatly significant.
The data also suggest no significant difference betweenshort and long forms. This implies that in many cases, anenumerator fabricated by classifying a housing unit asnon-existent.
One concern was whether fabrication occurred morefrequently, based on type of housing unit. Three types ofunits was defined; occupied, vacant, and non-existent (nota living quarters). The housing unit type represented thefinal housing unit status listed during the reinterview oper-ation.
The data suggested, nationally, that there was nosignificant difference in the fabrication rate by type ofhousing unit (occupied 0.09 percent, vacant 0.09 percent,and not a living quarters 0.10 percent). In type 2A districtoffices, non-existent housing units had a point estimate(0.32 percent) above the national estimate but it was notsignificantly different.
The Nonresponse Followup enumerator was to conductthe interview with someone living in the household. If theenumerator was unable to locate anyone in the householdafter numerous attempts, the enumerator was allowed tointerview neighbors, landlords, etc.
The national fabrication rate for those cases where thehousing information was collected from a proxy is 0.14percent and 0.09 percent for cases where the informationis collected from an actual household member. No signif-icant difference was found at the 90 percent confidencelevel at the national level or for the district office type data.
The reinterviewer dependently verified the householdroster obtained by the original enumerator. Another item ofinterest was whether there was an effect on fabricationdue to the number of household members listed on theroster by the census enumerator.
Table 3.9 shows that the household roster which con-tained six or more household members was the least likelyto be fabricated and the household roster with zero (vacantor delete) members was the most likely to have beenfabricated. The household roster with zero was more likelyto have been fabricated than those households with two ormore members, but is not more likely than a householdwith one member. A household roster with one householdmember is greatly significant from a household rosterwhich contains five, six, or more household members. Thissuggests that more work should be done to study house-hold rosters with zero or one persons.
Once enumerators were confirmed to have falsifieddata, it is estimated that 37.0 percent were released, 21.0percent resigned, 20.0 percent were warned or advised,and 7.0 percent were recorded as no action taken. It wasexpected that more than 50 percent of the enumeratorswould be released. The status of the remaining cases (15.0percent) could not be assessed from the data. In the futurethe reinterview program should be designed to assure thatproper action is taken on enumerators who had fabricatedcases.
It was estimated (shown in table 3.10) that the enumer-ators provided incorrect housing unit status (occupied,vacant, or delete) or incorrect household rosters for 3.82
32 EFFECTIVENESS OF QUALITY ASSURANCE

JOBNAME: No Job Name PAGE: 11 SESS: 157 OUTPUT: Thu Sep 16 14:02:20 1993 / pssw01/ disk2/ 90dec/ cphe/ 2/ chapter3
percent of the housing units during Nonresponse Follow-up. When these problems existed, the housing unit wasinvestigated further to see if the problem was due tofabrication. The data suggest that only a very small per-centage of enumerator errors (.09 percent) was inten-tional. The estimated enumerator error rate is lower thanthe 1988 Nonresponse Followup Dress Rehearsal rate of4.1 percent [3].
The enumerator error rate remained constant from thebeginning to the end of the 1990 Reinterview operation.The estimated enumerator error rate was above average(4.68 percent), but not significantly different in the type 2Aareas. The main reason for the enumerator errors was thedifference in the housing unit status (58.96 percent) recordedby the original enumerator and the reinterviewer. This wasless than the housing unit status differences of 81.82percent during the 1988 Nonresponse Followup DressRehearsal.
During the Nonresponse Followup operation, the rein-terview program sampled 4.8 percent of the NonresponseFollowup questionnaires. Even though this sampling ratewas equal to what was projected, there was bias in thesampling universe of the random and administrative phase.The random phase continued throughout the operation ascompared to the first 2 weeks and the data suggested thatthere was no consistent pattern in the implementation ofthe administrative sample. This resulted in 82 percent ofquestionnaires being selected at random. The remaining18 percent of the questionnaires were selected based onthe enumerator’s performance as compared to other enu-merators in the same assignment area (the administrativesample). It was projected that 40 percent of the reinterviewquestionnaires would be sampled during the administrativephase.
The reinterview was to take place as close to the date ofthe original interview as possible. It was estimated that theaverage time between the original interview and the rein-terview was approximately 5.1 days, greater than thedesired lag time of less than 4 days. Even though the 5.1days was higher than planned, it is significantly less thanthe 16.8 days experienced during 1988 Dress Rehearsal.
Conclusions
The data indicate that no extensive fabrication tookplace at the national level. The majority of the question-naires targeted as suspected fabrication were not falsified.This indicates that research should be done to refine ourdefinition of ‘‘suspected’’ fabrication. There should be abetter method of detection than the current method of the‘‘Fifty-Percent Rule’’ and the difference in housing unitstatus.
A reinterview system must be designed to detect enu-merators with a lower degree of fabrication at a higherconfidence level. Whether the system design is random,administrative, or a combination of the two, the system’sreliability should be significant for all degrees of fabrica-tion.
In addition to identifying fabrication, the reinterviewoperation should provide information on the accuracy ofthe population assigned to each household. Immediatereconciliation should be designed to correct under/ overcoverage of Nonresponse Followup.
The use of administrative analysis must be refined topredict instances of fabrication. Research should continueon better identifying variables as well as the use ofstatistical models to predict instances of fabrication. Thiswill enhance our coverage and ability to identify enumera-tors that falsify census data in a more cost effectivemanner. A concurrent evaluation should be used to eval-uate the effectiveness of the administrative sample. Thisstudy will help to evaluate and refine the administrativemodel used to detect fabrication.
To further improve the reinterview program, the auto-mation capability to monitor the reinterview process andresults from the beginning to the end of the operation mustbe emphasized. This may help the managers to monitoreach reinterview case more effectively and provide appro-priate information to the district offices/ regional censuscenter’s such as falsification, lag time, workload, numberof cases completed, etc.
Within the analysis, there were indicators of fabricationthat should be studied further, such as households withzero or one person and delete households.
Last resort cases were originally thought of as indicatorsof fabrication, but the data showed that there was not aproblem of fabrication with those cases.
Even though the lag time between the original interviewand reinterview was an improvement over the experienceof the 1988 Dress Rehearsal, work is needed to improve.Perhaps the use of telephone capabilities will improve this.
Table 3.9 Fabrication by Number of Persons inHousehold
Number of personsin household
Fabrication
Percent Standard error
0 . . . . . . . . . . . . . . . . 0.17 0.0361 . . . . . . . . . . . . . . . . 0.10 0.0342 . . . . . . . . . . . . . . . . 0.04 0.0143 . . . . . . . . . . . . . . . . 0.08 0.0224 . . . . . . . . . . . . . . . . 0.06 0.0205 . . . . . . . . . . . . . . . . 0.01 0.0076+ . . . . . . . . . . . . . . . 0.02 0.012
Table 3.10. Enumerator Error Rate at the Nationaland District Office Type Levels
Districtoffice type
Roster/ unit statuserrors Reasons for errors
PercentStandard
errorRoster
percent
Unitstatus
percent
Relativestandard
error
National . 3.82 0.550 41.04 58.96 1.506Type 1 . . 3.44 0.416 43.39 56.61 4.428Type 2 . . 3.53 1.110 39.69 60.31 2.175Type 2A. 4.68 0.652 41.31 58.69 2.422
33EFFECTIVENESS OF QUALITY ASSURANCE

JOBNAME: No Job Name PAGE: 12 SESS: 165 OUTPUT: Thu Sep 16 14:02:20 1993 / pssw01/ disk2/ 90dec/ cphe/ 2/ chapter3
References
[1] Williams, Dennis, STSD 1990 Decennial MemorandumSeries # O-2 Revision 1, ‘‘Specification for the 1990Nonresponse Followup Opeation.’’ U.S. Department ofCommerce, Bureau of the Census. July 1989.
[2] Griffin, Deborah and Moriarity, Chris, 1990 PreliminaryResearch and Evaluation Memorandum No. 179. ‘‘Char-acteristics of Census Errors.’’ U.S. Department of Com-merce, Bureau of the Census. September 1992.
[3] Williams, Dennis, STSD 1988 Dress Rehearsal Memo-randum Series # O-8, ‘‘1988 Nonresponse Followup Rein-terview Results.’’ U.S. Department of Commerce, Bureauof the Census. January 1990.
34 EFFECTIVENESS OF QUALITY ASSURANCE

JOBNAME: No Job Name PAGE: 1 SESS: 281 OUTPUT: Thu Sep 16 14:02:31 1993 / pssw01/ disk2/ 90dec/ cphe/ 2/ chapter4
CHAPTER 4.Data Capture/ Processing Operations
Once the questionnaires were collected and were in theseven processing offices, the data were captured. Allquestionnaires for the 1990 decennial census were datacaptured by camera and processed through the CensusBureau developed Film Optical Sensing Device for Input toComputers equipment. After capture and scanning, thedata were sent through an edit program. A clerical opera-tion, called Edit Review, was carried out to channel thequestionnaires through the edit process and remedy editproblems. The quality assurance program for the fourcomponents of the Edit Review operation is discussed inthis chapter.
While most of the responses on the questionnaire wereself-coded by the respondent (responses had specificanswer cells marked by the respondent), there wereseveral questions that elicited responses that could not becoded by the respondent. These items required clericaloperations to convert the responses to machine readablecodes. The coding operations took place in several officesby computer or by clerks. This chapter covers the qualityassurance programs for the three coding operations.
Most of the data from the questionnaires were capturedduring the filming operations, and some data was capturedthrough data keying. These capture operations rangedfrom the capture of addresses obtained during the listing(Prelist) and updating operations, to the capture of responseson the questionnaires that required conversion to codes. Inthis chapter, quality assurance for data keying for the 1988Prelist, the Precanvass, the 100- Percent Race Write-In,the Collection Control File, and the Long Form datacapture operations are covered.
EDIT REVIEW
Split
Introduction and Background—This section documentsthe results from the quality assurance plan implementedfor the 1990 Decennial Census Edit Review QuestionnaireSplit operation. The Split operation and its associatedquality assurance were scheduled to last from April 2through December 18, 1990, however, records were receivedwith dates from March 28 through December 28, 1990.The operation took place in all seven processing offices.
In the split process, after questionnaires were filmed,run through a Film Optical Sensing Device for Input toComputers, and processed through the computer edit, thequestionnaires were sorted into four categories:
1. Accept—These questionnaires passed all edits andwere not part of the Post Enumeration Survey sample.The questionnaires went to the census questionnairelibrary.
2. Post Enumeration Survey—These questionnaires passedall edits but were designated for Post EnumerationSurvey processing and sent to the Post EnumerationSurvey library.
3. Repair—These questionnaires failed the automatededits and were sent to the Repair operation.
4. Markup—These questionnaires failed content and cov-erage edits and were sent to the Markup operation.
The sorting was performed by clerks wanding barcodesor keying the identification number of each questionnaireand following the instructions on a computer terminal as towhich of the four categories a questionnaire should beincluded.
The purpose of the quality assurance plan was: (1) toidentify the causes of errors and provide feedback to theclerks in order to improve the subsequent quality of theSplit operation and (2) to identify the batches that failed thequality criteria in order to rectify these batches.
Methodology—A work unit consisted of the question-naires from one camera unit. Each camera unit consistedof 4 boxes of questionnaires, approximately 1,800 shortforms or 400 long forms.
The clerks were trained to scan the barcode and/ orkey-in the questionnaire identification number and to placethe questionnaires into the pile as instructed by the com-puter. The supervisors were instructed on how to interpretthe quality assurance output and give effective feedback.
In order to qualify for the Split operation, a clerk had tohave one of their first three work units pass verification. Ifa clerk failed on each of their first three work units, theywere reassigned to another operation. Otherwise, theyremained on the Split operation.
In order for a work unit to pass the quality assurance, itmust have had a critical error rate (see below for adescription of error types) less than 1 percent and a totalerror rate less than 5 percent.
The method of splitting a camera unit was a two-waysplit method. This involved placing the questionnaires froma camera unit into two piles: Accept, Markup, Post Enu-meration Survey, or Repair and ‘‘others.’’ This methodrequired a series of four passes. At each pass all ques-tionnaires not yet separated were wanded or keyed. The
35EFFECTIVENESS OF QUALITY ASSURANCE

JOBNAME: No Job Name PAGE: 2 SESS: 280 OUTPUT: Thu Sep 16 14:02:31 1993 / pssw01/ disk2/ 90dec/ cphe/ 2/ chapter4
computer determined the largest remaining category andthen indicated to the clerk how to separate that question-naire category from ‘‘others.’’ The questionnaries from theseparated category were then boxed until no more ques-tionnaries remained. The computer also determined if theexpected number of questionnaires in a work unit wereplaced in the correct box. In essence, this was a 100-percent computer verification. Each split acted as a verifi-cation on the previous split with the remaining question-naires being rewanded.
Questionnaires which were placed in the incorrect pilewere considered to be in error. There were two types ofincorrect placement errors: critical and non-critical.
Critical Errors—A critical error occurred when a ques-tionnaire was placed in an incorrect pile such that the errorcould not be corrected or the Post Enumeration Surveyoperation was adversely impacted.
Non-Critical Errors—A non-critical error occurred whena questionnaire was placed in an incorrect pile such thatthe error could be corrected or the error was inconsequen-tial.
Although missing questionnaires are not counted as anerror, they contribute to the critical and total error rates.Moreover, a large percentage of missing questionnairesmight tend to indicate a poorly split work unit.
Questionnaires which were not expected by the com-puter (within a camera unit) but were wanded or keyedduring the split were extra questionnaires. These werequestionnaires that were boxed in incorrect camera units.Clerks were alerted to extra questionnaires by a flashingscreen with an appropriate message. Extra questionnaireswere not counted as questionnaires going to Repair or aserrors. These questionnaires were sent to Repair for thepurpose of being rerouted through the filming processwhere they were assigned a new camera unit identificationnumber. There are no data available on extra question-naires nor are they represented in any of the counts.
The critical error rate is defined as the number ofquestionnaires found in incorrect piles (counted as criticalerrors, as defined above), divided by the number of ques-tionnaires that were supposed to be in the camera unit, asdetermined by the computer.
The total error rate is defined as the sum of all errorsdivided by the total number of questionnaires that weresupposed to be in the camera unit, as determined by thecomputer.
Questionnaires which were expected by the computerbut were not wanded or keyed during the split wereclassified as missing. The percentage of missing question-naires was defined as the number of questionnaires expectedbut not seen by the computer during the Split operationdivided by the total number of expected questionnaires forthe camera unit.
A work unit required further review by the supervisor forany of three reasons. The latter two of these reasonsconstituted a failure of the work unit. All work units whichfailed were resplit.
1. Missing Questionnaires—When the number of missingquestionnaires exceeded 2 percent of the expectednumber of questionnaires in a work unit (as countedduring filming), the supervisor was instructed to searchfor the missing questionnaires. If all questionnaireswere found, the clerk who split the work unit wouldwand/ key the newly found questionnaires. If they werenot found, the supervisor weighed the forms to deter-mine a revised expected number of questionnaires. Ifsome were found and some were not, the clerk wouldwand/ key the questionnaires that were found and thesupervisor then weighed all the forms again to deter-mine the revised expected number of questionnaires.This revised expected number was not used in any ofthe error rates in this report.
2. Critical Errors—A work unit was rejected when thecritical error rate exceeded 1 percent.
3. Total Errors—A work unit was rejected when the totalerror rate exceeded 5 percent.
A clerk was given a warning after each rejected workunit. Feedback was given regarding the types of errors andclerks were retrained when necessary. If a clerk received awarning on three consecutive work units, it was recom-mended the clerk be removed from the operation.
All rejected work units were resplit by the same clerk.
All quality assurance data were compiled by computer.No clerical recordkeeping was necessary.
For each split work unit, a computer file was generatedcontaining the number of missing questionnaires and thenumber of incorrectly placed questionnaires by clerk. If awork unit exceeded any of the decision criteria, the super-visor provided feedback to clerks regarding the types oferrors made. The supervisors also were able to identify theclerks having the most difficulties and the types of errorsthat occurred most frequently.
The Decennial Operations Division generated printoutsfor each work unit that contained the number of question-naires that should be in each pile according to the auto-mated edits. Someone other than the clerk who performedthe split checked that the number of questionnaires ineach pile looked reasonable. This included checking thatthe largest pile corresponded to the pile on the list havingthe greatest number of questionnaires, the second largestpile corresponded to the second greatest number ofquestionnaires, and so on. The clerk also verified that theprintout, which contained the number of questionnairesthat should be in the pile, was attached to the appropriatebox.
Limitations—The reliability of the evaluation for the Splitoperation is affected by the following:
• The accuracy in transferring the data files from theDecennial Operations Division to the Decennial Statisti-cal Studies Division.
36 EFFECTIVENESS OF QUALITY ASSURANCE
JOBNAME: No Job Name PAGE: 3 SESS: 282 OUTPUT: Thu Sep 16 14:02:31 1993 / pssw01/ disk2/ 90dec/ cphe/ 2/ chapter4
• The revised expected number of questionnaires werenot included in the file that was generated by theDecennial Operations Division.
Results—The error rate estimates in this section are from100-percent inspection and thus there is no variance onthese estimates.
Table 4.1 summarizes the overall critical and totalestimated error rates for all questionnaires by processingoffice. The quality of the Split operation was good in thatthe overall critical and total estimated error rates of 0.20and 0.34 percent, respectively, were very low.
Table 4.2 shows the critical and total estimated errorrates for short forms by processing office.
Table 4.3 shows the estimated critical and total longform error rates by processing office. The critical and totalerror rates on a questionnaire basis, were greater for longform (0.21 and 0.42 percent, respectively) than short form(0.20 and 0.32 percent, respectively) questionnaires.
Table 4.4 provides data on the distribution of correctlyand incorrectly split questionnaires, as well as, missingquestionnaires. The diagonal of the table displays thenumber of questionnaires that were correctly split bycategory. The cells above the diagonal represent non-critical errors while the cells below the diagonal presentcritical errors (except the Repair/ Markup error which isnon-critical). The table also shows the number of missingquestionnaires by the pile the questionnaire was supposedto be in.
The number of questionnaires which passed throughthe Split operation was 122,446,453. The number ofmissing questionnaires was 471,249 (0.4 percent). Thesewere questionnaires expected by the computer but notwanded or keyed during the operation. Of the missingquestionnaires, 421,784 (89.5 percent) were accepts. Ofthe non-missing questionnaires 106,652,511 (87.1 per-cent) were supposed to be accepts.
Overall, 99.3 percent of the questionnaires were splitcorrectly. Of the remaining 0.7 percent of questionnaires,0.2 percent resulted in a critical error, 0.1 percent in anoncritical error, and 0.4 percent were classified as miss-ing.
The most frequent type of error was a critical error, theRepair/ Accept error (questionnaire should have been sentto Repair but was placed in the Accept pile). These errorsmade up about 48 percent of all errors and almost 82percent of all critical errors.
The most frequent type of non-critical error was theAccept/ Repair error. These errors made up almost 18percent of all errors and about 42 percent of all non-criticalerrors.
Approximately 2.8 percent of all work units had to beresplit as a result of exceeding the acceptable qualitycriteria. About 1.6 percent of the work units were rejectedonly for a critical error rate that exceeded one percent. Atotal of 0.09 percent of the work units were rejected only
for a total error rate that exceeded five percent. Approxi-mately 1.0 percent of the work units exceeded both thecritical and total error rate tolerances. These percentagesdo not add up to 2.8 percent because of rounding.
Figure 4.1 depicts a quality learning curve representedby production error rates for the average clerk for criticalerrors. The quality learning curve for total errors is similarto the critical learning curve.
Table 4.1. Overall Error Rates by Processing Office
Processingoffice
Expectednumber of
questionnairesCritical error
rate (percent)Total error rate
(percent)
Baltimore. . . . . . 15,645,306 0.29 0.55Jacksonville . . . 21,116,671 0.22 0.38Kansas City. . . . 17,362,804 0.22 0.35Albany . . . . . . . . 14,518,911 0.17 0.30Jeffersonville . . 18,066,459 0.17 0.30Austin. . . . . . . . . 19,427,629 0.17 0.28San Diego . . . . . 16,779,922 0.15 0.25
Total . . . . . . 122,917,702 0.20 0.34
Table 4.2. Overall Short Form Error Rates by Pro-cessing Office
Processingoffice
Expectednumber of
questionnairesCritical error
rate (percent)Total error rate
(percent)
Baltimore. . . . . . 12,680,184 0.29 0.51Jacksonville . . . 17,732,608 0.22 0.36Kansas City. . . . 13,587,771 0.21 0.33Albany . . . . . . . . 11,645,205 0.17 0.27Austin. . . . . . . . . 16,018,913 0.17 0.27Jeffersonville . . 14,656,117 0.17 0.29San Diego . . . . . 14,169,421 0.15 0.23
Total . . . . . . 100,490,219 0.20 0.32
Table 4.3. Overall Long Form Error Rates by Pro-cessing Office
Processingoffice
Expectednumber of
questionnairesCritical error
rate (percent)Total error rate
(percent)
Baltimore. . . . . . 2,965,122 0.32 0.72Jacksonville . . . 3,384,063 0.23 0.45Kansas City. . . . 3,775,033 0.23 0.39Austin. . . . . . . . . 3,408,716 0.20 0.35Albany . . . . . . . . 2,873,706 0.19 0.40Jeffersonvillle . . 3,410,342 0.17 0.35San Diego . . . . . 2,610,501 0.16 0.34
Total . . . . . . 22,427,483 0.21 0.42
Table 4.4. Distribution of Correct, Incorrect, andMissing Questionnaires
Pile question-naire issupposedto be in
Pile questionnaire placed in
Missing ACC PES MAR REP
ACC . . . . . . . . 421,784 106,567,856 3,757 7,539 73,359PES. . . . . . . . . 10,414 21,184 2,792,274 3,799 53,674MAR . . . . . . . . 7,782 12,939 1,522 2,535,712 17,917REP. . . . . . . . . 31,269 200,064 9,231 13,984 10,131,642
ACC-Accept; PES-Post Enumeration Survey; MAR-Markup; andREP-Repair.
37EFFECTIVENESS OF QUALITY ASSURANCE

JOBNAME: No Job Name PAGE: 4 SESS: 280 OUTPUT: Thu Sep 16 14:02:31 1993 / pssw01/ disk2/ 90dec/ cphe/ 2/ chapter4
The points on the x-axis represent the expected numberof questionnaires in the split population.There were 122,917,702questionnaires that were split by the clerks. The chartillustrates a cumulative and an interval quality learningcurve. The cumulative curve represents the ongoing aver-age error rates of all clerks after a certain number ofquestionnaires were split. Therefore, if a particular clerkworked on only one questionnaire, he/ she is representedin this cumulative learning curve. The overall critical errorrate was 0.20 percent. The interval curve represents theaverage error rates between two consecutive points on thex-axis. For example, the point ‘‘70000’’ on the x-axis of thecritical interval curve represents the average clerk’s errorrate after completing at least 60,000 questionnaires butfewer than 70,000 questionnaires.
Clerks’ interval quality learning curve estimated errorrates followed an overall downward trend through a clerk’sfirst 50,000 questionnaires. However, the average clerkseemed to stop learning since quality deteriorated afterhaving split at least 50,000 questionnaires.
It is estimated that, without quality assurance, thecritical and total error rates for split would have been about0.24 and 0.44 percent, respectively. The operational criti-cal error rate was 0.20 percent; therefore, out of the122,917,702 questionnaires in the split population, approx-imately 50,062 more questionnaires (0.04 percent) weresplit without critical errors due to the quality assuranceplan. The total error rate was 0.34 percent; therefore, outof the 122,917,702 questionnaires in the split population,approximately 121,869 more questionnaires (0.10 percent)were split correctly because of the quality assurance plan.
Conclusions—There were 111,485 (97.2 percent) workunits that did not fail critical or total tolerances. Withinthese work units there were an estimated 168,148 criticalerrors that remained in the system after the Split operation.These errors were never corrected. There were also anestimated 88,173 non-critical errors that were needlesslyrecycled.
The computer generated data file was a very efficient,automated recordkeeping file. The file contained accurateand detailed data on missing questionnaires and on themisfiling of questionnaires. There were zero duplicaterecords and only very few records had inconsistent data.
Feedback appeared to improve the quality level, asevidenced by a continual decrease in clerks’ estimatederror rates through the first 50,000 questionnaires split.
The critical quality learning curve indicates a steadyincrease in error rates for critical interval error rates after aclerk had split 50,000 questionnaires. This increase maybe attributed to two factors:
1. A sense of monotony may have set in at this point dueto the tedious and routine process of the Split opera-tion.
2. Split clerks were temporarily assigned to assist withbacklogs in other operations because of a decreasedworkload in the Split operation.
For any similar operation in the future, it is recom-mended that new clerks be trained and replace an ‘‘old’’clerk after the ‘‘old’’ clerk splits 50,000 questionnaires. The
38 EFFECTIVENESS OF QUALITY ASSURANCE

JOBNAME: No Job Name PAGE: 5 SESS: 288 OUTPUT: Thu Sep 16 14:02:31 1993 / pssw01/ disk2/ 90dec/ cphe/ 2/ chapter4
critical quality learning curve indicates that learning ceasedand quality deteriorated after a clerk had split about 50,000questionnaires. This indicates that if it is possible, movethese split clerks to another operation at this point andtrain others with no prior split experience to replace theoriginal split clerks. Train a third set of clerks again whenthese new clerks split 50,000 questionnaires. Overlapbetween the groups of clerks would allow the overall errorrates to be minimized.
Reference—
[1] Boniface, Christopher J., 1990 Preliminary Researchand Evaluation Memorandum No. 197. ‘‘Quality AssuranceResults of the Edit Review Questionnaire Split Operation.’’U.S. Department of Commerce, Bureau of the Census.November 1992.
Markup
Introduction and Background—This section describesand documents the results from the quality assurance planimplemented for the 1990 decennial census edit review—questionnaire Markup operation. The Markup operationand its associated quality assurance lasted from March 26through October 6, 1990. The operation took place in six ofthe seven decennial census processing offices with theexception being the Kansas City Processing Office, whichdid not service any type 1 district offices (areas whichcover the central city for the larger cities).
Edit Review Markup was the clerical operation whichreviewed questionnaires that were completed and mailedin by respondents or completed by enumerators duringnonresponse followup in type 1 districts and failed theautomated edits for coverage or content. This operationonly received questionnaires which failed the edit due toincomplete or incorrectly marked items. Questionnairessent to Markup, for which the items that failed the editscould be completely repaired, were returned to camerapreparation for reprocessing. The remaining question-naires were sent to Telephone Followup.
The purpose of the quality assurance plan was toensure clerks were performing the operation as intendedand to identify areas of difficulty. Feedback was providedto assist the clerks and to continually improve the process.The quality assurance plan also identified work units thatneeded to be redone.
Methodology—A clerk had to qualify to work on theoperation. Qualification for the operation was based on‘‘live’’ work units. (A work unit consisted of all question-naires in a camera unit failing the coverage or contentedits, for a reason other than processing error.) A work unithad a variable number of questionnaires and included onlyshort forms or long forms. If there were 30 or fewer shortforms or 10 or fewer long forms in a work unit, allquestionnaires were verified in that work unit. If there weremore than 30 short forms or 10 long forms in a work unit,
a sample of 30 short-form or 10 long-form questionnaireswere selected for qualification. A clerk qualified if his/ hererror rate was less than 5 percent on either of the first twowork units completed. Any clerk who failed to qualify afterthe second work unit was either retrained or removed fromthe operation.
For work units done by qualified clerks, a 5-percentsample of questionnaires within a work unit were depen-dently verified. The quality assurance clerks examined thesampled questionnaires using the same procedure as theMarkup clerks. The quality assurance clerks verified thateach item requiring review either had been fixed or theappropriate indication had been made on the question-naire.
Two types of errors were defined: omissions and incor-rect edit actions. Omission errors indicate actions whichthe Markup clerk failed to follow. Each edit action whichwas omitted counted as one error. Incorrect action errorsindicate actions which the Markup clerk performed errone-ously. Each incorrect action was counted as one error.
The following formula was used to estimate error rates:
Number of omitted edit actions $ Number of incorrect edit actions
Total number of edit actions
Incoming error rates estimated the quality of the workperformed by the clerks. Outgoing error rates estimatedthe quality of the data as it left the operation after alldetected errors in the sampled questionnaires had beencorrected.
Work units with an error rate of greater than 3 percentwere reworked. If the clerk’s cumulative error rate for aweek was greater than 3 percent, he/ she was given awarning and retrained. After retraining, a ‘‘qualification’’work unit was given to the clerk. If the clerk’s error rate wasless than 5 percent, he/ she was able to continue workingin the Markup unit. Otherwise, the clerk was removed fromthe operation.
The Markup recordkeeping system was clerical. Verifi-cation results were recorded on the Markup OperationQuality Record (see form D-1984 in appendix B). Theoriginal copy of each quality record was used by thesupervisor for feedback to the clerk and to keep on file. Acopy was sent to the processing office’s quality assurancesection for data capture and production of a summaryrecord for use by the supervisor of each Markup unit. Thesupervisors used these reports to identify both the clerkswith the highest error rates and the types of errors thatoccurred most frequently. The supervisor also used thisinformation to provide feedback to the clerks.
To calculate standardized statistics for determining out-liers (processing office(s) significantly different from theothers), it was assumed that the six processing offices area sample from a population of processing offices and thus,the estimate of the variance is as follows:
σ2 =$$pi-p$2
n-1
39EFFECTIVENESS OF QUALITY ASSURANCE

JOBNAME: No Job Name PAGE: 6 SESS: 280 OUTPUT: Thu Sep 16 14:02:31 1993 / pssw01/ disk2/ 90dec/ cphe/ 2/ chapter4
where:
pi= the proportion of sample questionnaires that are incor-rect in the ith processing office;
p = the proportion of the overall number of sample ques-tionnaires that are incorrect; i.e., the sample estimatederror rate; and
n = sample size.
Thus, asymptotically standard normal statistics are cal-culated as follows:
Xi =pi$p
$$$pi$p$2
n$1
The resulting standardized statistics are ranked from lowto high and, in that ranking, the kth value is referred to asthe kth order statistic. The standardized statistics werecompared to a table of expected values for standardizedorder statistics at the α= .10 level of significance. For moreinformation on this methodology, see [1].
Limitations—The reliability of the evaluation for the oper-ation was affected by the following:
• Accuracy of clerical recording of quality assurance dataonto the form D-1984.
• Accuracy of keying the quality assurance data into theAutomated Recordkeeping System.
• Consistency in implementation of the procedures byeach processing office.
• The assumption of simple random sampling in standarderror calculations.
Results—Table 4.5 summarizes the overall estimatederror rates for all questionnaires by processing office. Theoverall incoming and outgoing estimated error rates for theMarkup operation were both 1.3 percent. The estimatederror rates ranged from 0.7 percent to 1.9 percent in theBaltimore and Albany Processing Offices, respectively.There were no statistical differences among the six pro-cessing offices. Thus, the processing office error rateswere from the same distribution.
Table 4.6 shows the estimated short form error rate byprocessing office. The overall estimated error rate forshort- form questionnaires within all six processing officeswas 2.2 percent. There were no statistical differencesamong the six processing offices. Thus, the processingoffice error rates were from the same distribution.
Table 4.7 shows the estimated long form error rate byprocessing office. The overall estimated error rate for long-form questionnaires for all six processing offices was 1.0percent. There were no statistical differences among thesix processing offices. Thus, the processing office errorrates are from the same distribution.
Figure 4.2 compares short-form and long-form esti-mated error rates within each processing office. Thedifference between the estimated error rates for shortforms and long forms ranged from a high of 1.7 percentagepoints in Jeffersonville to a low of 0.5 percentage points inBaltimore. Overall, and for each of the six processingoffices, there was sufficient evidence at the α= .10 level toindicate a significant difference between short forms andlong forms.
Table 4.8 provides data on the distribution of errortypes, omission and incorrect action, for short forms byprocessing office.
Table 4.9 shows the distribution of error types, omissionand incorrect action, for long forms by processing office.
Table 4.5 Overall Estimated Error Rates by Process-ing Office
Processingoffice
Numberof itemsverified
Numberof itemsin error
Esti-mated
error rate(percent)
Stan-dardized
error rate
Standarderror
(percent)
Albany. . . . . . . 251,166 4,773 1.9 + 1.3 .03Austin . . . . . . . 280,708 4,319 1.5 + 0.5 .02Jeffersonville . 229,974 3,363 1.5 + 0.3 .03Jacksonville . . 185,003 2,320 1.3 -0.2 .03San Diego . . . 192,226 2,062 1.1 -0.6 .02Baltimore . . . . 231,659 1,633 0.7 -1.5 .02
Total . . . . 1,370,736 18,478 1.3 NA .01
NA = not applicable
Table 4.6. Error Rates by Processing Office for ShortForms
Processingoffice
Numberof itemsverified
Numberof itemsin error
Esti-mated
error rate(percent)
Stan-dardized
error rate
Standarderror
(percent)
Albany. . . . . . . 85,048 2,511 3.0 + 1.2 1.90Jeffersonville . 64,280 1,702 2.7 + 0.7 .06Jacksonville . . 54,248 1,294 2.4 + 0.3 .07San Diego . . . 59,332 1,168 2.0 -0.3 .06Austin . . . . . . . 122,329 2,374 1.9 -0.4 .04Baltimore . . . . 53,533 586 1.1 -1.7 .05
Total . . . . 438,770 9,635 2.2 NA .02
NA = not applicable
Table 4.7. Error Rates by Processing Office for LongForms
Processingoffice
Numberof itemsverified
Numberof itemsin error
Esti-mated
error rate(percent)
Stan-dardized
error rate
Standarderror
(percent)
Albany. . . . . . . 166,118 2,262 1.4 + 1.3 .03Austin . . . . . . . 158,379 1,945 1.2 + 0.9 .03Jeffersonville . 165,694 1,661 1.0 + 0.2 .02Jacksonville . . 130,755 1,034 0.8 -0.5 .02San Diego . . . 132,894 894 0.7 -0.9 .02Baltimore . . . . 178,126 1,047 0.6 -1.2 .02
Total . . . . 931,966 8,843 1.0 NA .01
NA = not applicable
40 EFFECTIVENESS OF QUALITY ASSURANCE
JOBNAME: No Job Name PAGE: 7 SESS: 284 OUTPUT: Thu Sep 16 14:02:31 1993 / pssw01/ disk2/ 90dec/ cphe/ 2/ chapter4
Both short form and long form results show the samestatistical differences. The results of a chi-square test,indicate that errors (both omissions and incorrect actions)are independent of the processing offices.
A t-test at the α= .10 level indicates a significantdifference between the two totals for long form omissionand incorrect action errors. Additionally, a Wilcoxon RankSum Test at the α= .10 level indicates that the omissionand incorrect action error rate distributions are shiftedaway from one another. Thus, overall, the omission esti-mated error rate is significantly higher than that for incor-rect actions.
Figure 4.3 represents the average estimated error ratefor all clerks by week starting with each clerks’ first weekfor short- and long-form questionnaires. The first week aclerk worked is denoted by week 1, regardless of whenthey began working on the operation. For example, a clerkthat starts in week 10 of the operation is starting his/ herfirst individual week. Week 11 of the operation is thatclerk’s second week, etc. The chart shows that both shortand long form estimated error rates continued to decreaseover time indicating that learning took place. The bulk ofthe learning for both long- and short-form questionnaireswas accomplished in the first 10 weeks the individual wason the job.
Figure 4.4 shows the overall operational learning curvefor all clerks for both short-and long-form questionnairesstarting with week 1 of the operation. The chart represents
Table 4.8. Distribution of Short Form Error Types byProcessing Office
Processingoffice Number
ofomis-sions
Numberof
incor-rect
actions
Omissionestimated error
rate
Incorrect actionestimated error
rate
Per-cent
Stan-darderror
Per-cent
Stan-darderror
Albany. . . . . . . 1,774 737 2.1 .05 0.9 .03Jeffersonville . 1,222 480 1.9 .05 0.8 .04Austin . . . . . . . 1,682 692 1.4 .03 0.6 .02Jacksonville . . 703 591 1.3 .05 1.1 .04San Diego . . . 679 489 1.1 .04 0.8 .04Baltimore . . . . 367 219 0.7 .04 0.4 .03
Totals . . . 6,427 3,208 1.5 .02 0.7 .01
Table 4.9. Distribution of Long Form Error Types byProcessing Office
Processingoffice Number
ofomis-sions
Numberof
incor-rect
actions
Omissionestimated error
rate
Incorrect actionestimated error
rate
Per-cent
Stan-darderror
Per-cent
Stan-darderror
Albany. . . . . . . 1,519 743 0.9 .02 0.5 .02Jeffersonville . 1,309 352 0.8 .02 0.2 .01Austin . . . . . . . 1,405 540 0.9 .02 0.3 .01Jacksonville . . 715 319 0.6 .02 0.2 .01San Diego . . . 473 421 0.4 .02 0.3 .02Baltimore . . . . 813 234 0.5 .02 0.1 .01
Totals . . . 6,234 2,609 0.7 .01 0.3 .01
41EFFECTIVENESS OF QUALITY ASSURANCE

JOBNAME: No Job Name PAGE: 8 SESS: 284 OUTPUT: Thu Sep 16 14:02:31 1993 / pssw01/ disk2/ 90dec/ cphe/ 2/ chapter4
the overall estimated error rates for each particular weekof the operation; whereas, figure 4.3 displayed the overallestimated error rates for each particular week of theindividual clerk. The highest mean estimated error rates forshort and long forms were 6.3 and 3.7 percent, respec-tively (both during the first week of the operation). Overall,estimated error rates followed a downward trend fromweek 1 to week 28 of the operation. Estimated error ratesincreased for both short and long forms from weeks 3-5and 17-19. The reason for these increases may be that thenumber of new clerks was highest during these particularweeks.
It is estimated that, without quality assurance, theestimated error rates for short and long forms would havebeen about 3.5 and 1.8 percent, respectively. The weightedoperational short form estimated error rate was 2.5 per-cent; therefore, out of the 8,705,455 short-form items inthe Markup population, approximately 89,421 more short-form items (1.0 percent) were ‘‘marked-up’’ correctly dueto the quality assurance plan. The weighted operationallong form estimated error rate was 1.0 percent; therefore,out of the 18,451,319 long form items in the Markuppopulation, approximately 145,897 more long-form items(0.8 percent) were ‘‘marked-up’’ correctly because of thequality assurance plan.
Conclusions—The quality assurance plan fulfilled its pur-pose. The individual learning curve shows that learningtook place. Estimated error rates for clerks decreasedsteadily over time. This implies that feedback on types oferrors was given to clerks on a timely basis and resulted in
improved quality. Supervisors were able to identify areas ofdifficulty for clerks using the daily Automated Recordkeep-ing System reports and the Markup Operation QualityRecord.
Estimated error rates were low for both short forms (2.2percent) and long forms (1.0 percent) and were understatistical control. These facts suggest that to furtherimprove the quality of the process, the process wouldrequire changing.
One possible reason for the short form estimated errorrates being higher than the long form estimated error ratesis the relatively high item non-response rate on long-formquestionnaires for items not asked on the short-formquestionnaire. This high non-response rate would tend tomake long forms easier to markup, since most of the itemswould be blank and the clerks only had to circle the items.Thus, nonresponse on long forms would increase the totalnumber of long form items verified with a very low numberof errors among these items, which would lower the longform error rate.
Overall, omission errors made up 68.5 percent of allerrors (short and long forms). The fact that this percentageis high indicates that clerks may not have had a thoroughunderstanding of the operation. Omission errors by defini-tion indicate that clerks failed to take action. A reason thatmany clerks failed to act is probably because they did notknow what action to take, due to some deficiencies intraining them.
In all processing offices, the clerks more frequentlyfailed to act (thereby committing an omission error) thanthey committed an incorrect action. One possible reasonfor this difference may be because ‘‘Person Item’’ omis-sion errors tend to occur in clusters. ‘‘Person Item’’ refersto the seven population questions for each person onpages 2 and 3 of both the short- and long-form question-naires and the additional population questions per personbeginning on pages 6 and 7 on the long form. If clerks werenot thoroughly trained on ‘‘Person Item’’ error flags, theywould tend to commit an omission error for each personlisted on the form.
There were early differences in the interpretation of thequalification procedures by all of the processing offices. Atthe beginning of the operation, some clerks’ work was tobe 100 percent verified; that is, short form work units with30 or fewer questionnaires or long form work units with 10or fewer questionnaires were all checked. This was notalways done. Moreover, at least one processing office hadclerks processing additional work units while waiting fortheir qualifying results. This might have had serious qualityimplications. For example, if a clerk failed the qualifyingwork unit, those additional work units processed by theclerk may contain large numbers of similar errors. If thework unit passed sample verification and moved on to thenext processing unit, unchecked errors might have appearedin subsequent processing operations.
42 EFFECTIVENESS OF QUALITY ASSURANCE

JOBNAME: No Job Name PAGE: 9 SESS: 291 OUTPUT: Thu Sep 16 14:02:31 1993 / pssw01/ disk2/ 90dec/ cphe/ 2/ chapter4
The Markup Operation Quality Records were not alwaysfilled out properly. Two of the processing offices did a goodjob in completing the forms; the other four processingoffices did not always list the specific items that were inerror. Therefore, it is uncertain exactly how the processingoffices used the records for feedback.
Training, especially at the start of the operation, needsto be improved. Clerks need to have a thorough under-standing of the operation. The fact that 68.5 percent of allerrors were omission errors indicate that clerks may nothave had a thorough understanding of the operation.
Standardized test decks (a set of work prepared tocover the types of situations a clerk will encounter) shouldbe created for qualification, as originally planned. The lateswitch to ‘‘live’’ work units for qualification caused confu-sion at all the processing offices and may have adverselyaffected quality at the beginning of the operation. If testdecks had been used, clerks would have been qualified atthe start and there would have been no backlog of work tobe verified at the beginning of the operation. In addition, awider range of error flags and items could have beenchecked with test decks.
Qualification procedures should be clear at the start ofthe operation. The clerks should be assigned the qualifyingwork units ahead of the other work units and not bepermitted to process work units until they are qualified.
Clerks should be trained thoroughly in filling out thequality assurance forms at the start of the operation. Thesupervisors should, also, inspect the quality assuranceforms at the beginning of the operation to see if theverifiers are completing the forms properly. This will helpensure that quality assurance records are filled out com-pletely and accurately. In turn, this will aid the supervisorsin seeing what types of difficulties each clerk is experienc-ing.
References
[1] Gupta, Shanti S., ‘‘Percentage Points and Modes ofOrder Statistics from the Normal Distribution,’’ AnnualMathematical Statistician. Volume 32. pp. 888-893. 1961.
[2] Boniface, Christoper J., 1990 Preliminary Research andEvaluation Memorandum No. 107, ‘‘1990 Decennial Cen-sus:QualityAssuranceResultsof theEdit Review—QuestionnaireMarkup Operation.’’ U.S. Department of Commerce, Bureauof the Census. December 1991.
Telephone Followup
Introduction and Background— For the Telephone Fol-lowup operation, clerks telephoned a questionnaire respon-dent to obtain omitted information or to clarify existingresponses. The Telephone Followup operation was imple-mented for 24 weeks. Although telephone followup wasdone in both district offices and processing offices, aquality assurance operation was applied only in the proc-essing offices; this report presents results from this oper-ation.
The quality assurance plan for the Telephone Followupoperation consisted of two parts, a monitoring process anda resolution process, which are analyzed separately. Themonitoring, implemented in all processing offices exceptthe Kansas City Processing Office, was used to determinehow clerks conducted themselves on the phone. The maingoal of monitoring was to identify specific areas whereclerks performed poorly and provide feedback to improvetheir performance. The resolution part was used to evalu-ate clerks based on how well they resolved items markedfor followup. The primary goal was to determine abnor-mally high or low rates of unresolved actions, or respon-dent refusals, by telephone followup clerks, and use thisinformation to provide feedback where appropriate.
Methodology—The quality assurance plan used a sampleindependent verification scheme. . The following samplingprocedures were implemented for the monitoring andresolution processes of the Telephone Followup opera-tion.
1. Monitoring
a. Sampling Scheme—For the first week of theoperation, a sample of eight telephone followupclerks per telephone followup unit/ subunit, pershift, were selected each day for monitoring.Four supervisor-selected clerks were identifiedfirst and then four additional clerks were selectedrandomly. The clerks selected by the supervisorwere chosen based on any deficiencies sus-pected by the supervisor. In subsequent weeks,four clerks (two supervisor-selected and tworandomly-selected clerks) were monitored eachday per unit/ subunit, per shift. A clerk couldhave been selected by the supervisor multipletimes.
b. Monitored Characteristics—For each clerk sam-pled, four telephone calls were to be monitoredat random throughout the day. A quality assur-ance record was completed for each monitoredclerk, indicating how well the clerk performedthe following:
1. Introduction—properly introduced and iden-tified him or herself to the respondent.
2. Speech Quality—spoke clearly and at anacceptable pace and volume.
3. Asked Questions Properly—asked ques-tions as worded to obtain correct or omit-ted answers for all edit items; probing,when necessary, was neutral and to thepoint; and procedures were followed.
c. Recordkeeping/ Feedback —The Form D-1986,Telephone Followup Monitoring Quality Report,was completed as the monitoring took place(see form in appendix B). Quality assuranceoutput reports (daily and weekly) were gener-ated for the supervisors to use in providing
43EFFECTIVENESS OF QUALITY ASSURANCE
JOBNAME: No Job Name PAGE: 10 SESS: 286 OUTPUT: Thu Sep 16 14:02:31 1993 / pssw01/ disk2/ 90dec/ cphe/ 2/ chapter4
feedback to the clerks. The telephone followupmonitors were to write comments on the qualityassurance monitoring records for any belowsatisfactory ratings given. These comments wereused to provide additional feedback to theclerks.
2. Resolution
a. Quality Assurance Sample—The quality assur-ance sample for this process consisted of fiverandomly selected questionnaires, short and/ orlong, per clerk, per day. The five questionnaireswere inspected to ensure the completeness ofthe work, and to obtain resolution rate esti-mates.
b. Sampling Scheme—Each day, one completedquality assurance sample was selected at ran-dom from each clerk. There was to be at leastone quality assurance sample completed perday, from each clerk. If a clerk failed to com-plete a quality assurance sample (five question-naires) for a given day, all questionnaires forthat clerk were checked. The sampling schemecalled for at least one long form questionnaireto be included in each clerk’s quality assurancesample.
c. Recordkeeping/ Feedback—The Form D-1998,Telephone Followup Resolution Quality Record,was completed for each clerk’s quality assur-ance sample (see form in appendix B). Qualityassurance output reports were generated dailyand weekly for the supervisor to use in provid-ing feedback to the clerks).
The processing offices sent a 20-percent sample of allcompleted quality assurance monitoring and resolutionforms to headquarters. From that sample, approximately110 forms were selected for analyzing the monitoringoperation and 100 forms for the resolution operation perprocessing office
Limitations—The reliability of the analysis and conclu-sions for the two parts of the quality assurance plandepends on the following:
• Accuracy of the clerical recording of quality assurancedata.
• Accuracy of keying the quality assurance data into theAutomated Recordkeeping System.
• The evaluation of the clerks for the monitoring operationwas subjective.
• One clerk may be in sample multiple times causingnegative bias in the data due to the supervisor selectingclerks with problems.
• The monitors’ desk was often within view of the tele-phone followup clerk being monitored.
• There was variation among the processing offices in theway they implemented the sampling scheme.
• The frequency with which any particular housing orpopulation question item was investigated during theresolution process is unknown; only the frequency withwhich that item was left unresolved or refused is known.
• Standard errors were calculated assuming simple ran-dom sampling.
Results—The data used to analyze the Telephone Fol-lowup operation came from the Automated RecordkeepingSystem and a sample of the Quality Assurance Monitoringand Resolution Records. Overall, Automated Recordkeep-ing System data were available for 8,088 monitored clerks(note that clerks were counted once each time they weremonitored).
The quality levels of all monitoring characteristics weremeasured on an ordinal measurement scale of 1 to 5. Thebelow satisfactory total included both poor and fair ratings(1 and 2) combined. The above satisfactory total includedboth good and excellent ratings (4 and 5) combined.
1. Summary of the Automated Recordkeeping SystemMonitoring Data
a. Overview—Table 4.10 presents the number ofclerks, monitored calls, and clerk ratings byprocessing office. Overall, the monitoring clerksissued approximately 3.9 percent below satis-factory ratings, and 78.8 percent above satis-factory ratings. The estimate of the minimumnumber of clerks to be monitored over theentire Telephone Followup monitoring opera-tion by each processing office was 1,200. Theprocessing offices that monitored fewer thanthe expected amount were Baltimore, with 1,097,and Austin, with 385. These results are exam-ined further in the following sections.
Table 4.10. Number of Clerks, Monitored Calls, andClerk Ratings by Processing Office
Processingoffice Number
of clerksmoni-tored
Esti-mated1
averagenumberof calls
moni-tored
per clerk
Number of ratings
Total
Belowsatisfac-
torySatisfac-
tory
Abovesatis- fac-
tory
Baltimore . . . . . 1,097 1.7 5,507 166 1,171 4,170Jacksonville . . . 1,451 3.5 15,226 550 2,574 12,102San Diego. . . . . 1,839 3.8 21,008 650 4,549 15,809Jeffersonville . . 1,797 3.2 16,994 389 1,726 14,879Austin . . . . . . . . 385 3.7 4,255 244 402 3,609Albany . . . . . . . 1,519 3.3 15,095 1,066 3,064 10,965
Total . . . . . 8,088 3.2 78,085 3,065 13,486 61,534
Note: The Kansas City Processing Office is not included in this table becausethe monitoring part of telephone followup was not implemented in that office.
1The estimated average number of calls monitored was computed as follows:total number of ratings divided by three (characteristics per call) divided by thenumber of monitored clerks.
44 EFFECTIVENESS OF QUALITY ASSURANCE
JOBNAME: No Job Name PAGE: 11 SESS: 286 OUTPUT: Thu Sep 16 14:02:31 1993 / pssw01/ disk2/ 90dec/ cphe/ 2/ chapter4
b. Summary of Quality Levels of All MonitoringCharacteristics—Figure 4.5 shows the frequencywith which each rating was assigned. The Albanyprocessing office reported the largest percentof below satisfactory ratings issued with 7.1percent. The largest percent of satisfactoryratings were issued in the San Diego Process-ing Office, with 21.7 percent, with the Baltimoreprocessing office close behind at 21.3 percent.The variation in rating assignment across pro-cessing offices is probably due to the subjectivenature of the monitoring process.
2. Headquarters Sample Monitoring Data Summary—Thesampled monitoring quality assurance data were usedto determine the distribution of ratings for the threecharacteristics: 1) proper introduction, 2) questionsasked properly (probing), and 3) quality of the clerks’speech. The total number of ratings for each charac-teristic are not always the same. This is because someprocessing offices did not rate each characteristic forevery call. This is perhaps due to the clerk not gettinga chance to ask the respondent for the omittedinformation before the respondent decided not toanswer the question(s).
Of the three characteristics, the one with the mostbelow satisfactory ratings was ‘‘Proper Introduction.’’This characteristic had approximately 44.4 percent ofthe below satisfactory ratings issued for the threecharacteristics. Tables 4.11 to 4.13 provide distribu-tions of ratings for the monitoring characteristics byprocessing office.
A chi-square goodness-of-fit test was used to testwhether the quality assurance summary data in tables4.11 to 4.13 fit the Automated Recordkeeping System
Monitoring data distribution in table 4.10. When com-paring processing offices, at the 10-percent signifi-cance level, there is a statistically significant differenceonly for the Albany Processing Office. Thus, the qualityassurance summary data for the other five processingoffices were a good representation of the AutomatedRecordkeeping System Monitoring summary data. TheAlbany Processing Office showed a statistically signif-icant difference because the sample selected from thequality assurance forms contained more below satis-factory and satisfactory ratings than the AutomatedRecordkeeping System data.
3. Summary of the Automated Recordkeeping SystemResolution Data—There were 47,793 resolution datarecords entered into the Automated RecordkeepingSystem, showing that 1,766,720 edit actions neededto be resolved. Approximately 3.8 percent of these edit
Table 4.11. Number of Ratings (Percent) for ‘‘ProperIntroduction’’
Processingoffice
Belowsatisfactory
(percent)Satisfactory
(percent)
Abovesatisfactory
(percent)Total
(percent)
Baltimore . . . . 10 (3.3) 48 (15.9) 244 (80.8) 302 (100.0)Jacksonville . . 21 (5.1) 92 (22.4) 297 (72.4) 410 (100.0)San Diego . . . 11 (2.5) 101 (22.5) 336 (75.0) 448 (100.0)Jeffersonville . 31 (8.7) 40 (11.2) 287 (80.2) 358 (100.0)Austin . . . . . . . 58 (14.1) 38 (9.2) 316 (76.7) 412 (100.0)Albany. . . . . . . 46 (9.5) 128 (26.4) 310 (64.0) 484 (100.0)
Total . . . . 177 (7.3) 447 (18.5) 1,790 (74.2) 2,414 (100.0)
Table 4.12. Number of Ratings (Percent) for ‘‘Ques-tions Asked Properly’’
Processingoffice
Belowsatisfactory
(percent)Satisfactory
(percent)
Abovesatisfactory
(percent)Total
(percent)
Baltimore . . . . 4 (1.3) 42 (13.5) 266 (85.3) 312 (100.0)Jacksonville . . 17 (4.2) 59 (14.5) 330 (81.3) 406 (100.0)San Diego . . . 6 (1.4) 95 (21.4) 342 (77.2) 443 (100.0)Jeffersonville . 5 (1.4) 47 (13.1) 306 (85.5) 358 (100.0)Austin . . . . . . . 17 (4.1) 55 (13.3) 340 (82.5) 412 (100.0)Albany. . . . . . . 106 (19.3) 140 (25.5) 302 (55.1) 548 (100.0)
Total . . . . 155 (6.3) 438 (17.7) 1,886 (76.1) 2,479 (100.0)
Table 4.13 Number of Ratings (Percent) for ‘‘Qualityof Speech’’
Processingoffice
Belowsatisfactory
(percent)Satisfactory
(percent)
Abovesatisfactory
(percent)Total
(percent)
Baltimore . . . . 3 (1.0) 38 (12.2) 271 (86.9) 312 (100.0)Jacksonville . . 16 (3.9) 63 (15.5) 328 (80.6) 407 (100.0)San Diego . . . 6 (1.4) 96 (21.6) 342 (77.0) 444 (100.0)Jeffersonville . 4 (1.1) 41 (11.5) 313 (87.4) 358 (100.0)Austin . . . . . . . 8 (1.9) 40 ( 9.7) 364 (88.3) 412 (100.0)Albany. . . . . . . 30 (6.3) 103 (21.5) 346 (72.2) 479 (100.0)
Total . . . . 67 (2.8) 381 (15.8) 1,964 (81.4) 2,412 (100.0)
45EFFECTIVENESS OF QUALITY ASSURANCE

JOBNAME: No Job Name PAGE: 12 SESS: 287 OUTPUT: Thu Sep 16 14:02:31 1993 / pssw01/ disk2/ 90dec/ cphe/ 2/ chapter4
actions were unresolved and 2.4 percent receivedrefusals from respondents.
Table 4.14 presents the number of resolution clerks,edit actions, unresolved items, and refusal items usedduring the Telephone Followup operation. Clerks werecounted once each time their quality assurance sam-ple was turned in and a quality assurance resolutionrecord was completed for their workload. The process-ing office with the most edit actions was Jeffersonvillewith 27.9 percent of all actions. The Baltimore Pro-cessing Office had the highest estimated percentageof unresolved edit actions, 28.9 percent. The Jeffer-sonville Processing Office had the highest estimatedpercentage of refusal edit actions, 22.4 percent, withthe Kansas City Processing Office close behind at 22.2percent.
4. Headquarters Sample Resolution Data Summary —Thesampled resolution quality assurance data were usedto determine 1) the estimated unresolved and refusalrates, and 2) the number of items detected in error.Based on 2,972 resolution data records, there were aweighted estimated 988,235 edit actions that neededresolution. Approximately 5.0 percent of these editactions were unresolved, and 2.4 percent were refus-als.
Table 4.15 presents the number of resolution clerksand weighted estimated edit actions, unresolved, andrefusal actions from the quality assurance sample. Theclerks were counted once each time a quality assur-ance record was turned in. The processing office withthe most edit actions was Jeffersonville with 29.0percent of all actions. The Baltimore Processing Officehad the highest percent of unresolved edit actions,29.3 percent. The Kansas City Processing Office hadthe highest percent of refusal edit actions, 32.8 per-cent.
a. Questionnaire Items—Below is an item legendlisting the census questionnaire items referredto in this section.
Item Legend
Housing Questions
H1 Anyone not added to questionnaire thatshould be added
H2 Description of buildingH6 Value of propertyH7 Monthly rentH20 Yearly cost of utilities and fuelsH22 Annual insurance payment on property
Population Questions
P1 Household roster and usual home else-where
P2 RelationshipP32 Work experience/ income received in 1989
b. Unresolved Data—Pareto diagrams were cre-ated using the census questionnaire housingand population questions and questions of unknowntype to identify errors that happened more oftenthan others. Figure 4.6 is the pareto chart forhousing questions. Based on this chart, housingquestion 22 (H22) was unresolved most fre-quently. This question was left unanswered15.9 percent of the time.
Figure 4.7 presents the pareto chart for thepopulation questions. Population question 32(P32) was unresolved most frequently. Thisquestion was left unanswered 11.4 percent ofthe time.
There were a total of 531 unresolved items inerror. Of these, 52.4 percent were populationquestions and 15.6 percent were housing ques-tions. The type of question for the other 32.0percent of the errors was not identified on thequality assurance forms.
Table 4.14. Number of Resolution Clerk, Unresolved,and Refusal Edit Actions by ProcessingOffice
Processingoffice Num-
ber ofclerks
Totalnumberof edit
actions
Unresolvedactions
Refusalactions
Esti-mated
per-cent
of re-solved
Num-ber
Per-cent
Num-ber
Per-cent
Kansas City . . 6,300 170,879 14,061 8.2 9,340 5.5 86.3Baltimore . . . . 9,464 329,097 19,657 6.0 7,219 2.2 91.8Jacksonville . . 6,817 256,053 14,133 5.5 4,947 1.9 92.6San Diego . . . 6,353 175,942 2,290 1.3 2,911 1.7 97.0Jeffersonville . 10,765 492,190 5,745 1.2 9,444 1.9 96.9Austin . . . . . . . 7,179 290,440 9,522 3.3 6,949 2.4 94.3Albany. . . . . . . 915 52,119 2,543 4.9 1,353 2.6 92.5
Total . . . . 47,793 1,766,720 67,951 3.8 42,163 2.4 93.8
Note: The Kansas City Processing Office assisted the Albany Pro-cessing Office with their resolution workload for the Telephone Followupoperation. This is the only part of the Telephone Followup operation theKansas City Processing Office implemented.
Table 4.15. Number of Sampled Resolution Clerksand Weighted Unresolved and RefusalEdit Actions by Processing Office
Processingoffice Num-
ber ofclerks
Totalnumberof edit
actions
Unresolvedactions
Refusalactions
Esti-mated
per-cent of
re-solved
Num-ber
Per-cent
Num-ber
Per-cent
Kansas City . . 263 114,485 14,175 12.4 7,910 6.9 80.7Baltimore . . . . 400 171,300 14,550 8.5 4,950 2.9 88.6Jacksonville . . 423 130,960 6,880 5.3 1,320 1.0 93.7San Diego . . . 483 110,400 840 0.8 1,040 0.9 98.3Jeffersonville . 478 286,800 7,860 2.7 7,440 2.6 94.7Austin . . . . . . . 435 145,480 4,400 3.0 1,360 0.9 96.1Albany. . . . . . . 490 28,810 970 3.4 120 0.4 96.2
Total . . . . 2,972 988,235 49,675 5.0 24,140 2.4 92.6
46 EFFECTIVENESS OF QUALITY ASSURANCE

JOBNAME: No Job Name PAGE: 13 SESS: 287 OUTPUT: Thu Sep 16 14:02:31 1993 / pssw01/ disk2/ 90dec/ cphe/ 2/ chapter4
Figure 4.8 is the pareto chart for questionswithout housing/ population status identified. Ques-tion 1 was left without housing or populationstatus information entered on the quality assur-ance forms 38.0 percent of the time. In figures4.6 and 4.7, the housing and population ques-tion 1 was missed only four and two times,respectively. Figure 4.9 shows that if the hous-ing and population status were known, it wouldaffect the unresolved frequencies for question 1in figures 4.7 and/ or 4.8. The frequencies forhousing and population question 1 could changethe items listed as the most frequent unre-solved items.
Note: any item number not shown in figures 4.7or 4.8 were completely resolved during tele-phone followup. Items for which neither theperson number nor item number were known,were not analyzed separately.
5. Refusal Data—Pareto diagrams were constructedfor refusal data to identify items with a greaterrefusal frequency. Separate figures were createdfor housing and population questions and questionsof unknown type. Figure 4.9 presents the data forthe housing questions. Housing questions H6, H7,and H20 were most frequently refused. These ques-tions were left unanswered 12.7 percent of the time.
47EFFECTIVENESS OF QUALITY ASSURANCE
JOBNAME: No Job Name PAGE: 14 SESS: 280 OUTPUT: Thu Sep 16 14:02:31 1993 / pssw01/ disk2/ 90dec/ cphe/ 2/ chapter4
Figure 4.10 presents the pareto chart for the pop-ulation questions. Population question 32 (P32) wasmost frequently refused. This question was leftunanswered 28.4 percent of the time.
There were a total of 276 items not answered becauseof respondent refusal. Of these, 63.8 percent were popu-lation questions and 19.9 percent were housing questions.The other 16.3 percent of the refusals were of unknowntype. As these only represent 22 refusals, they were notanalyzed separately.
Conclusions—Overall, the quality assurance monitoringand resolution processes went well. However, there wereproblems with the monitors/ supervisors not completingthe quality assurance forms as instructed in the proce-dures. The quality assurance forms were turned into the
quality assurance sections in a timely manner. Someprocessing offices experienced a backlog of telephonefollowup calls and had insufficient staff to monitor therequired number of clerks.
The quality assurance monitoring and resolution recordswere not always completed as specified in the procedures.For the monitoring portion of the Telephone Followupoperation, it did appear as though feedback was given tothe clerks as needed.
The Telephone Followup operation was successful be-cause it allowed the Census Bureau to obtain omitted datafrom the questionnaires and keep record of any editactions not resolved by the telephone followup clerks orrespondent(s).
The quality assurance monitoring plan helped identifythose clerks who had problems with 1) obtaining the
48 EFFECTIVENESS OF QUALITY ASSURANCE

JOBNAME: No Job Name PAGE: 15 SESS: 296 OUTPUT: Thu Sep 16 14:02:31 1993 / pssw01/ disk2/ 90dec/ cphe/ 2/ chapter4
necessary omitted data, and 2) meeting the standards ofthe three monitoring characteristics. The quality assuranceresolution plan helped determine 1) which clerks were notgetting answers for all unresolved edit actions, and 2) howmany and which questions were being refused by therespondent(s). Positive and negative feedback was pro-vided by the supervisors/ monitors in a timely manner.
The Census Bureau is unable to demonstrate if theyachieved the purpose of the quality assurance plan andthe resulting feedback, that is, to improve subsequentperformance by the individual telephone followup clerk. Itis believed, though, that those clerks that remained through-out the operation did improve through feedback.
The quality assurance plan did have an impact on thequality of the telephone followup resolution operation byproviding the estimated percentage of unresolved andrefusal edit actions marked for followup. The quality assur-ance plan impacted the quality of the monitoring Tele-phone Followup operation by providing feedback to theclerks.
For similar future operations, the following suggestionsare recommended:
• Train all staff that will be monitoring telephone calls orchecking the resolution of completed questionnaires,how to properly complete quality assurance forms.
• Change the measurement levels on the monitoringquality assurance forms to have three rating levels(poor, average, and good) rather than five (poor, fair,satisfactory, good, and excellent). This would make iteasier for the monitor to rate the clerks.
• Add a column on the resolution quality assurance formto enter the total number of housing and/ or populationquestion(s) marked for telephone followup.
• Place monitors’ desk out of view of the clerks. This willeliminate the clerks from knowing when they are beingmonitored.
• On the quality assurance recordkeeping form be able toidentify whether a clerk was selected for quality assur-ance by the supervisor or at random.
Reference—
[1] Steele, LaTanya F., 1990 Preliminary Research andEvaluation Memorandum No. 117, ‘‘Summary of QualityAssurance Results for the Telephone Followup OperationConducted Out of the Processing Offices.’’ U.S. Depart-ment of Commerce, Bureau of the Census. January 1992.
Repair
Introduction and Background—This section documentsthe results from the quality assurance plan implementedfor the 1990 decennial census Edit Review—QuestionnaireRepair operation. The Repair operation and its associatedquality assurance were scheduled to last from April 2through December 18, 1990; however, records were receivedwith dates from March 26 to December 27, 1990. Theoperation took place in all seven 1990 decennial censusprocessing offices.
Edit Review Repair was the clerical operation whichreviewed all questionnaires that failed a limited automatededit due to a Film Optical Sensing Device for Input toComputers misread or identification number problem.
The quality assurance plan monitored the clerks byexamining a sample of questionnaires daily. The purposeof the quality assurance plan was to ensure that clerkswere performing the operation as intended by identifying
49EFFECTIVENESS OF QUALITY ASSURANCE

JOBNAME: No Job Name PAGE: 16 SESS: 289 OUTPUT: Thu Sep 16 14:02:31 1993 / pssw01/ disk2/ 90dec/ cphe/ 2/ chapter4
areas where they were having difficulty and enablingfeedback on problems identified. In addition, the qualityassurance data allowed supervisors to provide feedback tothe clerks. The quality assurance plan also identifiedextremely poor quality work that needed to be redone.
Methodology—A clerk had to qualify to work on theoperation. Test decks (a set of work prepared to cover thetypes of situations a clerk will encounter) were originallyscheduled to be used for qualification, but they were notdeveloped in time for the operation. Therefore, qualifica-tion for the Repair operation was based on ‘‘live’’ workunits. (A work unit consisted of all questionnaires from acamera unit which were sent to the Repair unit.) Each workunit had a variable number of questionnaires, based ontypes of failures, and included only short-form or long-formquestionnaires. If there were 50 or fewer questionnaires(either short form or long form) in a Repair work unit, allquestionnaires were verified in that work unit. If there weremore than 50 questionnaires in a work unit, a sample of 50questionnaires was selected for qualification. A clerk qual-ified if his/ her error rate was less than 10 percent on eitherof their first 2 work units. Any clerk who failed to qualifyafter the second work unit was either retrained and requal-ified or removed from the operation.
For each work unit, the Repair clerk, after editing andcorrecting the forms, placed questionnaires into severalpiles depending on where each questionnaire was to gonext. The quality assurance clerk selected a 5 percentsample of short-form questionnaires and a 10 percentsample of long-form questionnaires within a work unit. Thequality assurance clerks examined the sampled question-naires using the same procedures as the Repair clerks.The quality assurance clerks verified that all sampledquestionnaires had been properly repaired according toprocedures. For questionnaires that the production clerkdid not repair, the quality assurance clerk verified that thequestionnaire could not be repaired. Moreover, the qualityassurance clerks verified that the questionnaires wereplaced in the right pile. All detected errors were corrected.
A Repair clerk was charged with one error for eachquestionnaire that was repaired incorrectly or placed in thewrong pile. A clerk could receive a maximum of one erroron any questionnaire. The edit failures which were sent tothe Repair unit were coded M, X, XP, A, and G and definedas follows.
M: Mechanical error—The questionnaire could not beread by the computer.
X: The identification number was either missing orinvalid.
XP: The identification number was valid, but the ques-tionnaire was from another processing office’sjurisdiction.
A: Item A, in the FOR CENSUS USE area of thequestionnaire, and the number of data definedpersons differed.
G: Short form Age ‘‘grooming’’ failure—There was awritten entry but the P2 circles were not filled forAge (item E).
The following formula was used to calculate error rates:
number of questionnaires in error
total number of questionnaires verifiedx 100
Work units were rejected if two or more errors weredetected.
If a clerk’s weekly error rate was greater than 2 percent,he/ she was given a warning and retrained. After retraining,a ‘‘qualification’’ work unit was given to the clerk. If theclerk’s estimated error rate was less than 10 percent,he/ she was able to continue working in the Repair unit.Otherwise, the clerk was removed from the operation.
The Repair quality assurance recordkeeping systeminvolved manually recording the quality assurance data ona three-part nocarbon required Questionnaire Repair Qual-ity Record, Form D-2011 (see form in appendix B). Theoriginal of each quality record was used by the supervisorfor feedback to the clerk and kept on file in the unit. A copywas sent to the processing office’s quality assurancesection for data capture and generation of daily and weeklysummary reports for use by the Repair unit supervisor.
The supervisor used the reports to identify the clerkswith the highest error rates and the types of errors thatoccurred most frequently. The supervisor used this infor-mation to provide feedback to the clerks highlighting theweak points.
To calculate standardized statistics for determining out-liers (processing office(s) significantly different from theothers), it is assumed that the seven processing offices area sample from a population of processing offices and thus,the estimate of the variance is as follows:
σ2 =$$pi-p$2
n-1
where:
pi = the proportion of sample questionnaires that areincorrect in the ith processing office;
p = the proportion of the overall number of samplequestionnaires that are incorrect; i.e., the sampleestimated error rate; and
n = sample size.
Thus, asymptotically standard normal statistics are cal-culated as follows:
Xi =pi$p
$$$pi$p$2
n$1
50 EFFECTIVENESS OF QUALITY ASSURANCE

JOBNAME: No Job Name PAGE: 17 SESS: 289 OUTPUT: Thu Sep 16 14:02:31 1993 / pssw01/ disk2/ 90dec/ cphe/ 2/ chapter4
The resulting standardized statistics are ranked fromlow to high and, in that ranking, the kth value is referred toas the kth order statistic. The standardized statistics werecompared to a table of expected values for standardizedorder statistics at the α= .10 level of significance. For moreinformation on this methodology, see [1].
Limitations—The reliability of the evaluation for the Repairoperation is affected by the following:
• The accuracy of clerical recording of quality assurancedata onto form D-2011.
• The accuracy of keying the quality assurance data.
• All standard errors are calculated assuming simplerandom sampling.
• Varying conditions of the materials received in theprocessing offices may have impacted the estimatedquality of work in various operations. For example, thequality of the questionnaires received in one processingoffice may have been poorer than those received inanother processing office. Thus, the Repair operationwould have been more difficult in the first processingoffice which may lead to higher error rates for thatprocessing office.
• The assumption that the verifier is correct. Hence, whatis referred to as an error may really be a difference inopinion or interpretation of procedures.
Results—Table 4.16 summarizes the overall estimatederror rates for all questionnaires by processing office. Theoverall estimated incoming error rate for the Repair oper-ation was 2.5 percent. The estimated incoming error ratesranged from 1.4 percent (Baltimore) to 5.0 percent(Albany).
The normalized estimated error rates are shown in thestandardized error rate column in table 4.16. There wereno statistical differences among the seven processingoffices. Thus, the processing office error rates were fromthe same distribution.
Table 4.17 shows the estimated error rates of shortforms by processing office. The overall estimated errorrate for short form questionnaires across all seven pro-cessing offices was 2.4 percent.
Table 4.18 shows the estimated error rates of longforms by processing office. The overall estimated errorrate for long form questionnaires across all seven process-ing offices was 3.0 percent.
For both short forms and long forms, at the .10 level ofsignificance, there was no statistical difference among theseven processing offices. Thus, the processing office errorrates are from the same distribution.
Table 4.19 provides data on the distribution of errortypes for the short forms among the processing offices.The total number of short form errors for each error type is
Table 4.16. Overall Estimated Error Rates by Pro-cessing Office
Processingoffice
Numberof ques-
tionnairesverified
Numberof ques-
tionnairesin error
Esti-mated
error rate(percent)
Standarderror
(percent)
Standard-ized error
rate
Albany. . . . . . . 95,232 4,715 5.0 .07 + 1.9Jacksonville . . 253,423 7,739 3.1 .03 + 0.4Austin . . . . . . . 92,716 2,700 2.9 .06 + 0.3Jeffersonville . 83,189 1,600 1.9 .05 -0.5Kansas City . . 140,095 2,604 1.9 .04 -0.4San Diego . . . 101,284 1,459 1.4 .04 -0.9Baltimore . . . . 118,121 1,605 1.4 .03 -0.9
Total . . . . 884,060 22,422 2.5 .02 NA
NA = not applicable.
Table 4.17. Estimated Error Rates by ProcessingOffice for Short Forms
Processingoffice
Numberof ques-
tionnairesverified
Numberof ques-
tionnairesin error
Esti-mated
error rate(percent)
Standarderror
(percent)
Standard-ized error
rate
Albany. . . . . . . 67,509 3,216 4.8 .08 + 1.9Austin . . . . . . . 65,181 1,885 2.9 .06 + 0.4Jacksonville . . 199,233 5,522 2.8 .04 + 0.3Jeffersonville . 60,844 1,017 1.7 .05 -0.6San Diego . . . 73,307 1,084 1.5 .04 -0.7Kansas City . . 97,174 1,410 1.5 .04 -0.7Baltimore . . . . 82,913 1,120 1.4 .04 -0.8
Total . . . . 646,161 15,254 2.4 .02 NA
Table 4.18. Estimated Error Rates by ProcessingOffice for Long Forms
Processingoffice
Numberof ques-
tionnairesverified
Numberof ques-
tionnairesin error
Esti-mated
error rate(percent)
Standarderror
(percent)
Standard-ized error
rate
Albany. . . . . . . 27,723 1,499 5.4 .14 + 1.7Jacksonville . . 54,190 2,217 4.1 .09 + 0.7Austin . . . . . . . 27,535 815 3.0 .10 -0.0Kansas City . . 42,921 1,194 2.8 .08 -0.2Jeffersonville . 22,345 583 2.6 .11 -0.3Baltimore . . . . 35,208 485 1.4 .06 -1.1San Diego . . . 27,977 375 1.3 .07 -1.1
Total . . . . 237,899 7,168 3.0 .04 NA
Table 4.19. Distribution of Short Form Error Types byProcessing Office
Processingoffice
Error type
M X XP A G Total
Kansas City . . 106 435 22 826 21 1,410Baltimore . . . . 48 284 6 489 293 1,120Jacksonville . . 259 2,037 29 2,419 778 5,522San Diego . . . 60 297 3 431 293 1,084Jeffersonville . 55 290 5 483 184 1,017Austin . . . . . . . 115 676 10 720 364 1,885Albany. . . . . . . 228 787 29 1,182 989 3,216
Total . . . . 871 4,806 104 6,550 2,922 15,254
51EFFECTIVENESS OF QUALITY ASSURANCE
JOBNAME: No Job Name PAGE: 18 SESS: 289 OUTPUT: Thu Sep 16 14:02:31 1993 / pssw01/ disk2/ 90dec/ cphe/ 2/ chapter4
displayed. The results of a chi-square test indicate thaterrors are independent of the processing offices. At thenational level, Item A error frequency is significantly greaterthan any other error type at the .10 level.
Table 4.20 provides data on the distribution of errortypes, for long forms among the processing offices. Theresults of a chi-square test indicate that errors are inde-pendent of the processing offices. Pairwise t-tests at the.10 level indicate a significant difference between Item Aerrors and all other error types at the national level.
Table 4.21 shows the overall (short and long form)distribution of errors by error type. Overall, Item A errorsmade up 42.8 percent of all errors which is significantlydifferent from all other error types at the .10 level.
Figures 4.11 and 4.12 represent learning curves for theweighted estimated error rates by production for theaverage clerk for both short and long forms, respectively.A combined learning curve (combining both short and longforms) is not included, since it is similar to the short formlearning curve in figure 4.11. The reason for the similarity isthat Repair clerks worked primarily on short forms andhence, the short form results dominate the long formresults.
For figures 4.11 and 4.12, the quality assurance sam-ples for both short and long forms were weighted torepresent the entire Repair population. The points on thex-axes represent the weighted number of questionnaires inthe Repair population.
Both figures illustrate a cumulative and an intervallearning curve. The cumulative curves represent the ongo-ing average estimated error rates of all clerks after acertain number of questionnaires were reached. For exam-ple, the average short form clerk had an estimated 3.1
percent error rate after his/ her first 260,000 question-naires. Thus, the point ‘‘260,000’’ represents a cumulativetotal of all clerks from 0 to 260,000 questionnaires. Thisdefinition includes all clerks in that range. Therefore, if aparticular clerk worked on only one questionnaire, he/ sheis represented in this cumulative learning curve. Theinterval curves represent the average estimated error ratesbetween two consecutive points on the x-axis. For exam-ple, the point ‘‘260,000’’ on the x-axis of the short forminterval curve represents the average clerk’s estimatederror rate after completing at least 227,500 questionnairesbut less than 260,000 questionnaires. Moreover, the aver-age short form clerk had an estimated error rate of 1.4percent between 227,500 and 260,000 questionnaires.
The rise in the short form interval learning curve at292,500 questionnaires is an anomaly and cannot beexplained. The increase after 390,000 questionnaires ismainly because points ‘‘390000’’ and ‘‘650000’’ representonly 1.3 percent of the short-form questionnaires. Approx-imately 98.7 percent of the Repair workload had beenprocessed before point ‘‘390000.’’ Moreover, only 26clerks ‘‘repaired’’ more than 390,000 questionnaires andonly 2 clerks ‘‘repaired’’ more than 650,000. Thus, theestimated error rates have a relatively large variance asthe number of clerks decrease. The cumulative curveshows a steady downward trend, indicating quality improve-ment in the clerks’ work.
The long form interval learning curve in figure 4.12follows an overall downward trend throughout the opera-tion. The ascents from 10,650-14,200 and 17,750-21,300probably reflect the fact that Repair clerks were constantlybeing moved to other operations to assist with backlogs.Observation reports indicate that all processing offices atone time or another had to move Repair clerks to otheroperations. The ascents from 28,400-31,950 and 35,550-56,800 represent only 1.4 and 1.8 percent of the long formworkload. Thus, these estimated error rates are somewhatunreliable. The long form cumulative curve shows anoverall downward trend from the start to the end ofproduction. This steady decline in long form productionestimated error rate shows that there was continual qualityimprovement in the clerks’ work throughout the operation.
It is estimated that, without quality assurance, theestimated error rates for short and long forms would havebeen about 3.3 and 3.6 percent, respectively. The weightedoperational short form estimated error rate was 2.4 per-cent; therefore, out of the 12,923,240 short form question-naires in the Repair population, approximately 120,147more short form questionnaires (0.9 percent) were ‘‘repaired’’correctly due to the quality assurance plan. The weightedoperational long form estimated error rate was 3.0 percent;therefore, out of the 2,378,990 long form questionnaires inthe Repair population, approximately 13,734 more longform questionnaires (0.6 percent) were ‘‘repaired’’ cor-rectly because of the quality assurance plan.
Conclusions—The quality assurance plan fulfilled its pur-pose. The learning curves show that learning took place.
Table 4.20. Distribution of Long Form Error Types byProcessing Office
Processingoffice
Error type
M X XP A G Total
Kansas City . . 136 414 30 573 41 1,194Baltimore . . . . 117 159 6 202 1 485Jacksonville . . 496 888 7 820 6 2,217San Diego . . . 39 137 0 198 1 375Jeffersonville . 83 235 2 261 2 583Austin . . . . . . . 175 342 4 291 3 815Albany. . . . . . . 284 493 19 694 9 1,499
Total . . . . 1,330 2,668 68 3,039 63 7,168
Table 4.21. Proportion of Repair Errors by Error Type
Error type Frequency Percent of total
A . . . . . . . . . . . . . . . . . . . 9589 42.8X . . . . . . . . . . . . . . . . . . . 7475 33.3G. . . . . . . . . . . . . . . . . . . 2985 13.3M. . . . . . . . . . . . . . . . . . . 2201 9.8XP. . . . . . . . . . . . . . . . . . 172 0.8
Total . . . . . . . . . . . . 22422 100.0
52 EFFECTIVENESS OF QUALITY ASSURANCE
JOBNAME: No Job Name PAGE: 19 SESS: 280 OUTPUT: Thu Sep 16 14:02:31 1993 / pssw01/ disk2/ 90dec/ cphe/ 2/ chapter4
53EFFECTIVENESS OF QUALITY ASSURANCE

JOBNAME: No Job Name PAGE: 20 SESS: 291 OUTPUT: Thu Sep 16 14:02:31 1993 / pssw01/ disk2/ 90dec/ cphe/ 2/ chapter4
Estimated error rates for clerks decreased steadily overtime. This implies that feedback on types of errors wasgiven to clerks on a timely basis and resulted in improvedquality. Supervisors were able to identify areas of difficultyfor clerks.
The quality of the overall operation was good in that theoverall estimated error rates on a questionnaire basis forshort- and-long form questionnaires (2.4 percent with astandard error of 0.02 and 3.0 percent with a standarderror of 0.04, respectively) were relatively low.
Overall, Item A errors made up 42.8 percent of all errors(short and long forms). An Item A error indicates that ItemA in the FOR CENSUS USE area and the number of datadefined persons on the questionnaire differ. Observationsand trip reports indicated that a significant number of type2/ 3 district office questionnaires with Item A errors werebeing sent to expert review. This type of error originated inthe district offices and most were sent to expert review atthe processing offices. This suggests that some question-naires were edited incorrectly in the Clerical Edit operationat the district offices.
The following recommendations are made based on theresults of the Repair operation.
• A better system for handling an operation’s backlogsneeds to be devised. It is recommended that the causesof the backlogs be reviewed to determine what contin-gency planning might have alleviated the quality impli-cation found in the evaluation of this operation.
• Standardized test decks should be created for qualifica-tion. The late switch to ‘‘live’’ work units for qualificationcaused confusion at all of the processing offices andmay have caused backlogs in getting clerks qualified. Iftest decks had been used, clerks would have beenuniformly qualified at the start, there would have been noinitial backlog of work to be verified,and a wider range oferror flags could have been checked.
• Simplify or automate the quality assurance recordkeep-ing. Automating the quality assurance forms would allowa more accurate and timely database system from whichfeedback could be given. If simplified, train clerks thor-oughly in filling out the quality assurance forms at thestart of the operation. Also, the supervisors shouldinspect the quality assurance forms at the beginning ofthe operation to ensure the verifiers are completing theforms properly. This will help ensure that quality assur-ance records are filled out completely and accurately. Inturn, this will aid the supervisors in seeing what types ofdifficulties each Repair clerk is experiencing.
References—
[1] Gupta, Shanti S., ‘‘Percentage Points and Modes ofOrder Statistics from the Normal Distribution,’’ AnnualMathematical Statistician, Volume 32. pp. 888-893. 1961.
[2] Boniface, Christopher J., 1990 Preliminary Researchand Evaluation Memorandum No. 160, ‘‘1990 DecennialCensus:QualityAssuranceResultsoftheEditReview—QuesionnaireRepair Operation.’’ U.S. Department of Commerce, Bureauof the Census. July 1992.
CODING
Industry and Occupation
Introduction and Background—Keyed write-in responsesto the industry and occupation items from long-form ques-tionnaires (see items 28 and 29 in form D-2 in appendix B),Military Census Reports, and Shipboard Census Reportswere assigned standard codes using a combination ofautomated and clerical coding methods. Automated cod-ing was done at headquarters. Clerical coding was done atthe Kansas City Processing Office.
Coding of industry and occupation responses was firstattempted by the automated coder. If the automated coderassigned codes to both the industry and the occupationitem, the case was complete and left the processing flow.Cases not completed by the automated coder passed tothe clerical portion of the operation.
Clerical coding operated on two levels—residual andreferral coding. Cases first passed to residual coding,where coders used the 1990 Alphabetical Index of Indus-tries and Occupations (Index), and Employer Name Listsas references for assigning codes. If residual coders wereunsuccessful in coding an item (industry or occupation),the case was sent to referral coding, where referral codersassigned the final code using additional reference materi-als.
Three-way independent verification was used to monitorthe quality of both computer and clerical coding. Samplesof cases were selected from: cases completely coded bythe computer (computer sample), cases passed to residualcoding (residual sample), and cases passed to referralcoding (referral sample). Each sampled case was repli-cated, resulting in three ‘‘copies,’’ or quality assurancecases. These three copies were distributed among workunits assigned to different coders. After the work unitscontaining corresponding quality assurance cases werecompleted, the copies were matched and compared. Threesituations were possible for the three clerically assignedcodes:
1. Three-way agreement—all codes the same.
2. Three-way difference—all codes different.
3. Minority/ majority situation—two codes the same,one different.
A computer coded item was considered ‘‘in error’’ if theclerically assigned majority code was not a referral andwas different from the computer assigned code. A cleri-cally coded item (residual or referral) was considered in
54 EFFECTIVENESS OF QUALITY ASSURANCE

JOBNAME: No Job Name PAGE: 21 SESS: 291 OUTPUT: Thu Sep 16 14:02:31 1993 / pssw01/ disk2/ 90dec/ cphe/ 2/ chapter4
error if it was the minority code where a clear majorityexisted. For tracking ‘‘error’’ rates, assignment of a referralcode by a residual coder was considered a coding action.
Using these definitions of ‘‘error,’’ error rates (or ‘‘minor-ity rates’’ when referring strictly to clerical coding) weretracked for each coder and coding unit. For each type ofitem (industry and occupation) the computer also trackedproduction, referral, and three-way difference rates. Thesestatistics were reported for individual coders and codingunits so that supervisors could identify problems as theyoccurred and give constructive feedback to coders in theirunit.
Clerical coders were formally trained in 2 week ses-sions. The first week focused on coding industry responses.The industry training module ended with a series of threequalification tests. After coding the industry responses ona practice test deck, each coder coded three additionaltest decks. A test deck consisted of a set of industry andoccupation responses similar to what a coder would encoun-ter in production. Those who scored 70 percent correct (orbetter) on any of the three tests passed and went on toreceive occupation training. Those who scored less than70 percent on all three test decks were released.
Occupation training was similar to industry training—aweek of classroom work followed by a series of tests.Coders completed a practice test deck, then proceeded tocode the occupation responses of the three test decksused for the industry tests. Coders had to achieve a scoreof 70 percent or better on at least one of the test decks toqualify for production coding.
Methodology—Error rate was defined as the number ofcoding ‘‘errors’’ divided by the number of coding actions.Using definitions given previously, the error rate for aclerical coder is the relative number of minority codesassigned by that coder, and is usually called the minorityrate. When discussing clerical coding, the terms error rateand minority rate are interchangeable. The term minorityrate will generally be used when discussing clerical coding,and the term error rate will be used when referring toautomated coding or a mixture of automated and clericalcoding.
Test decks were primarily a teaching tool. Coding thetest decks enhanced the training by giving ‘‘hands on’’experience. A second purpose was to weed out personsthat did not meet a minimum quality standard.
Two questions are of interest with regard to the testdeck scores: 1) Did scores increase from test to test; thatis, did learning occur during testing? and 2) Are test deckscores correlated with coder performance (error rates)?
If trainees learned from their errors, then the expectedvalue of each successive test score should be higher thanthe previous one, assuming the test decks are of equaldifficulty. To determine whether this was the case, arepeated measures analysis of variance was performed,treating the training sessions as blocks and the test deck
scores as repeated measurements of an attribute (knowl-edge) on the same subject (the trainee). This type ofanalysis attempts to take into account the correlationbetween measurements taken on the same subject.
The analysis of variance tables for the effects of interest(the ‘‘within subject effect’’—learning) were generatedusing the SAS procedure General Linear Models (PROCGLM). To fit a repeated measures model, PROC GLM usesonly complete observations; that is, cases with nonmissingvalues for all three industry/ occupation test deck scores(1,072 observations for the industry analysis, and 1,012observations for the occupation analysis).
Limitations—A minority code is not necessarily incorrect.Cases came up in which supervisors judged the minoritycode to be correct. Since we are really interested in theprobability that an item is miscoded rather than in theminority (the majority of I&O cases were coded by onecoder only), using these definitions to gauge the level oferror adds bias which is impossible to quantify withoutfurther study.
The minority/ error rate is a better estimate of the trueerror rate when there is a unique ‘‘true’’ code for eachwrite-in. Unfortunately it is possible for all three codes in athree-way difference to be ‘‘true.’’ Further, while the minor-ity rate for an individual coder lies in the interval [0,1,] theoverall error rate based on these definitions is at mostone-third, since two other coders must agree against theminority coder for an error to occur.
Some of the statistics presented in this report are basedon a sample of cases. While the sample selection proce-dure was actually systematic random sampling, it is assumedfor variance estimation purposes that simple random sam-pling was used. The quality assurance items were post-stratified into those coded by the computer, those codedby a residual coder (not a referral code), and those codedby a referral coder.
Estimated error rates from the 1980 census were com-puted based on a different verification method. The major-ity code from post production three-way independentcoding was compared to the actual production code.Because of the differences in the estimators used, com-parison of the values and their standard errors alone is notenough to make a meaningful inference.
The test decks consist of different responses, thuscertain test decks may be more (less) difficult than others.Because of this fact, it is impossible to determine whetherdifferences in successive test scores are due to learning orto the differences in the test decks.
To answer the question ‘‘Are test deck scores corre-lated with coder performance?’’, the estimated correlationcoefficient between a coder’s average industry/ occupationscore and the corresponding (industry/ occupation) aver-age minority rate was examined. Since coders did notbegin production coding unless their maximum score was70 percent or better on both the industry and the occupa-tion tests, we are limited to the ‘‘high’’ end of this relation-ship. It is conceivable that coders who did not pass the
55EFFECTIVENESS OF QUALITY ASSURANCE

JOBNAME: No Job Name PAGE: 22 SESS: 291 OUTPUT: Thu Sep 16 14:02:31 1993 / pssw01/ disk2/ 90dec/ cphe/ 2/ chapter4
qualification tests would have performed equally well hadthey been allowed to continue. However, since nearly allthe trainees passed, this may be a moot point.
Results—
Training/ Test Deck Scores—On average, industry testdeck scores increased weakly—about 2 percentage pointsfrom the first to the second test and the second to the thirdtest, for an average net gain of about 4.1 percentagepoints (standard error 0.41 percent).
Occupation test deck scores behaved quite differently,falling 2.5 percentage points on average from the first tothe second test, and increasing 0.65 percentage points onaverage from the second to the third test, for an averagenet decrease of 1.72 percentage points (standard error0.28 percent). This probably is due to differences in thetest decks.
Ninety-nine percent of the trainees obtained a qualifyingscore of 70 percent correct (or better) on at least one ofthe three industry tests. Of those trainees that continuedoccupation training, less than 0.5 percent failed to qualifyas production coders. It was more likely for a trainee to quitthan to fail.
Significant correlations exist between a coder’s averageindustry score, average occupation score, industry errorrate, and occupation error rate (see table 4.22). Coderswith higher test scores generally had lower error rates.Coders with higher/ lower average industry test scorestended to have higher/ lower average occupation testscores.
The F-statistic for the between subject effect (session)is significantly greater than its expected value (p< .01).This suggests that the mean scores for first, second, andthird tests differ from training session to training session.
This is true for both industry and occupation scores. Ifthe attributes of coders in each training session weresimilar, we might suspect there were differences in theeffectiveness of the training—‘‘good’’ sessions and ‘‘bad’’sessions. There is no apparent trend in the sessionaverages over time.
The effect of primary interest is the within subject(time/ test) effect. If learning occurred, we would expectthe means of successive test scores to be significantlygreater. In both analysis of variance tables, the adjustedF-statistics for these effects are significant. This suggeststhat the mean scores of the first, second, and third testsdiffer from each other (regardless of training session).
Examination of adjacent pair contrasts (test2-test1,test3-test2) indicate that these differences are also signif-icantly different from zero, but not in the way we wouldexpect. Table 4.23 shows the average differences, alongwith their standard error.
The p-values for the off diagonal sample coefficientsunder the null hypothesis (ρ= 0) are all < 0.0001.
Analysis of Error Rates—To estimate the quality of coding,each case (an industry item and an occupation item) in the
quality assurance sample is coded independently by threedifferent coders. The outcome of these three independentcodings is used to determine whether a code is ‘‘correct’’or ‘‘incorrect.’’
According to rules defined earlier, an item in the residualsample is ‘‘in error’’ if it is the minority code. The other twocodes in a minority/ majority situation are said to be‘‘correct.’’ For the computer, the error rate is the number oftimes the clerical majority code was not a referral and didnot match the computer assigned code divided by thenumber of items coded by the computer.
During production, a referral code was considered anassigned code for quality assurance purposes. Thus, areferral code which was the minority code was considered‘‘in error.’’ This rule is useful in detecting the situationwhere coders defer cases to the referral lists rather thanrisk being ‘‘wrong.’’ The minority rates reported on allManagement Information System reports were calculatedusing this convention. Note: Unless otherwise stated, allerror/ minority rates discussed in this report are calculatedby considering a referral code as an assigned code.
A significant portion of the minority codes (23.0 percentof industry and 17.4 percent of occupation) were referralcodes. Also, 18.8 percent of the industry minority codesand 11.8 percent of occupation minority codes weremeaningful codes that were in the minority because theother two independent coders referred the item.
Whatever the decision about how referral codes affectthe error definition, the error definition can be used tocompute the probability that a particular item (industry oroccupation) was coded/ acted upon correctly. This proba-bility, the ‘‘success rate’’ is one minus the error rate.Success rates are estimated for each code source intable 4.24. Success rates for items coded by the computerare based on computer coded items from all three samples(computer, residual, and referral).
Perhaps a better indicator of the quality of coding is thenon-referral three-way agreement rate. In some sense,
Table 4.22. Estimated Correlation Coefficients (ρ)Between Characteristics
Characteristic Industryerror rate
Occupa-tion error
rate
Averageindustry
score
Averageoccupa-
tion score
Industry error rate . . . . . . . 1.0 0.32 -0.29 -0.34Occupation error rate . . . . 0.32 1.0 -0.36 -0.44Average industry score. . . -0.29 -0.36 1.0 0.63Average occupation
score . . . . . . . . . . . . . . . . . -0.34 -0.44 0.63 1.0
Table 4.23. Average of Test(j)-Test(i), i< j
Difference IndustryStandard
errorOccupa-
tionStandard
error
Test 2—Test 1 . . . . 2.3 0.34 -2.5 0.26Test 3—Test 2 . . . . 1.8 0.35 0.65 0.23Test 3—Test 1 . . . . 4.1 0.41 -1.72 0.28
56 EFFECTIVENESS OF QUALITY ASSURANCE

JOBNAME: No Job Name PAGE: 23 SESS: 292 OUTPUT: Thu Sep 16 14:02:31 1993 / pssw01/ disk2/ 90dec/ cphe/ 2/ chapter4
there is more confidence in the final code when all threecoders agree. Table 4.25 shows the non-referral three-wayagreement rates for each coding source.
Ideally, we would like to increase the number of three-way agreements, and decrease the number of three-waydifferences. This might be achieved by studying the three-way differences and refining the coding procedures forthose types of responses.
Day Shift vs. Night Shift—Most of the clerical coding wasdone by residual coders. Residual coding was done on twoshifts—day and night. Table 4.26 compares various qualitymeasures for the two shifts. Estimated standard errors aregiven in parenthesis for estimates based on a sample. Theproduction rate, expressed in items coded per hour, is notbroken down by industry and occupation, since coderscoded both response types simultaneously. Except for theproduction rate, the estimates in table 4.26 (including theirstandard errors) are expressed as percentages.
The night shift had a higher production rate than the dayshift. According to observation reports filed by DecennialStatistical Studies Division staff who visited during theoperation, the night shift management vigorously stressedthe importance of production and promoted competitionbetween the coding units. The night shift units createdcharts describing the relative standing of each coder andcoding unit in terms of production rates. This may havecontributed to the night shift’s higher productivity.
Learning Curves—The Computer Assisted Clerical CodingSystem tracked industry and occupation item minorityrates, referral rates, three-way difference rates, and pro-duction rates. This section discusses how these qualitymeasures changed as coders gained on-the-job experi-ence.
Minority rates measure the level of agreement/ consistencybetween coders. Figure 4.13 shows the average industryand occupation minority rates as a function of codingexperience measured in weeks. The minority rate foroccupation was consistently higher than that for industryitems.
Figures 4.14 and 4.15 compare these averages by shift.Both industry and occupation minority rates remainedstable over the course of the operation. No significantdifference is apparent between day and night shifts.
Figure 4.16 shows the average production rate as afunction of coding experience. As expected, productionrates increased steadily as a coder gained experience—rapidlyat first, then more slowly. With minority rates holdingsteady during the same period, coders learned to codefaster with the same level of quality.
Table 4.24. Estimated Accuracy of Coding
Cases coded by. . .
Industry Occupation
Per-cent
codedP(cor-
rect)
Stan-darderror
Per-cent
codedP(cor-
rect)
Stan-darderror
Automated coder . . 57.8 0.90 0.0005 36.8 0.87 0.0008Residual coding . . . 36.0 0.87 0.0006 56.8 0.86 0.0005Referral coding . . . 6.2 0.86 0.001 6.4 0.87 0.001Overall . . . . . . . . . . . 100.0 0.89 0.0004 100.0 0.87 0.0004
Table 4.25. Non-Referral Three-Way AgreementRates
Code source Industry Occupation
Computer coded items . . . . . . 75.5 67.2Residual coded items . . . . . . . 48.2 45.7Referral coded items . . . . . . . 46.7 46.4
Table 4.26. Residual Coding—Day Shift Versus NightShift1
[I= Industry, O= Occupation]
Residual coding Day Night Overall
Production rate(items/ hour) . . . . . 76.30 89.06 82.81
Minority rate(standard error)(percent) . . . . . . . . 12.79 (0.09) I 12.70 (0.07) I 12.74 (0.06) I
13.48 (0.07) O 13.62 (0.06) O 13.56 (0.05) OReferral rate(percent) . . . . . . . . 13.29 I 12.85 I 13.05 I
9.22 O 9.26 O 9.24 OThree-way differ-
ence rate(standard error)(percent) . . . . . . . . 9.37 (0.07) I 9.45 (0.07) I 9.41 (0.05) I
11.21 (0.07) O 11.34 (0.06) O 11.28 (0.04) O
1Figures computed from Computer Assisted Clerical Coding Systemdata.
57EFFECTIVENESS OF QUALITY ASSURANCE

JOBNAME: No Job Name PAGE: 24 SESS: 280 OUTPUT: Thu Sep 16 14:02:31 1993 / pssw01/ disk2/ 90dec/ cphe/ 2/ chapter4
Figure 4.17 compares the production rates of the dayand night shift. The graph shows that the night shiftconsistently outproduced the day shift.
The referral rate is the proportion of items which wereassigned to referral coding. These items were consideredby the residual coders to be too difficult to code using onlythe Index and Employer Name Lists. Because the Com-puter Assisted Clerical Coding System counts a referralcode as a valid code to calculate a coder’s production rate,there is perhaps some incentive for coders to refer a caserather than spend more time searching for a meaningfulcode.
Figure 4.18 shows the referral rate for industry andoccupation items as a function of coder experience. Sur-prisingly, the referral rate for industry items was higherthan that for occupation items. A slight upward trend isapparent among the occupation referral rate in figure 4.18,while the mean industry referral rate remained stable. Thisis seen more clearly in figures 4.19 and 4.20 whichcompare these two types of referral rates by shift. Therewas no practical difference in referral rates between shifts.
Except for an initial surge in the production rate and aslow increase in the referral rate on occupation items, theamount of time a coder had been coding seemed to havevery little effect on any of the quality measures understudy. Type of response (industry versus occupation) andshift had much greater effects.
From the outset, industry items were expected to beeasier to code. Ironically, industry items had a higherreferral rate, which implies that residual coders were moreconfident about coding occupation items than industryitems. A possible explanation is that the computer codedthe ‘‘easy’’ industry items, leaving the more difficult casesto the residual coders. Minority rates and three-way differ-ence rates were lower on industry items. This means therewas generally more agreement on industry codes thanoccupation codes; that is, when coders were able to assigna code, then the case was straightforward.
The night shift had a notably higher production rate thanthe day shift. With respect to all other quality measures, thetwo shifts performed similarly. Both shifts thus coded itemswith the same consistency, but the night shift did so faster.The night shift management stressed production, and triedto promote a competitive environment. Perhaps this con-tributed to the differences in production rates.
Comparison With 1980 Census—The 1990 I&O codingprocess was largely automated, while its 1980 predeces-sor was not at all automated. The automated coder codedabout 47 percent of all items. This reduced the workloadgoing into clerical coding. The Computer Assisted ClericalCoding System, with its on line references and automaticdata collection features, made the coding process lesscumbersome and easier to monitor than the paper drivenprocess used in 1980. Table 4.27 compares the 1980 and1990 Industry and Occupation coding operations on a fewkey points.
58 EFFECTIVENESS OF QUALITY ASSURANCE
JOBNAME: No Job Name PAGE: 25 SESS: 280 OUTPUT: Thu Sep 16 14:02:31 1993 / pssw01/ disk2/ 90dec/ cphe/ 2/ chapter4
59EFFECTIVENESS OF QUALITY ASSURANCE

JOBNAME: No Job Name PAGE: 26 SESS: 293 OUTPUT: Thu Sep 16 14:02:31 1993 / pssw01/ disk2/ 90dec/ cphe/ 2/ chapter4
The estimated error rates reported in this table for the1990 operation were computed without including indeter-minate cases caused by referrals. This adjustment isthought to make 1980 and 1990 error rates more compa-rable; however, error rates for 1980 and 1990 were com-puted by different methods, and should not be comparedbased on standard error alone.
Conclusions—In terms of processing time and conve-nience, the Industry and Occupation coding operation wasmuch better in 1990 than in 1980. The operation owes agreat deal to the success of the automated coder and theComputer Assisted Clerical Coding System. The auto-mated coder greatly reduced the workload of clerical
coders. The Computer Assisted Clerical Coding Systemmade clerical coding more convenient and easier to mon-itor than the paper driven process used in 1980. Automaticmonitoring and report generation enabled managers todetect and correct problems as they occurred.
Codes were assigned more consistently in 1990 than in1980. Codes assigned by the computer are inherentlymore consistent since the coding algorithm will alwayscode a particular set of strings in the same way. Theestimated error rates, though based on different verifica-tion systems, indicate greater consistency of coding in1990. This is primarily due to the high productivity of theautomated coder.
Because any learning effect displayed in the test deckscores was confounded by possible differences in thedifficulty of the test decks, it cannot be determined whetheror not the differences in the three test scores are due tolearning. It is likely that the differences in scores are due todifferences in the test decks.
In addition to differences from test to test, there weredifferences in scores from session to session. While somesessions were better than others, there is no apparentpattern; that is, sessions getting progressively better orworse.
The testing functioned mainly as a teaching tool, not asa weeding out process. About 1 percent of the trainees didnot pass the industry coding phase of training. Of traineeswho passed the industry tests and took at least oneoccupation test, less than one-half of 1 percent failed.Trainees were more likely to quit than to fail. Traineesdecided for themselves whether they wanted to quit ratherthan being dismissed on the basis of test scores.
In future operations of this type, it might prove useful tomonitor the feedback that is given in terms of frequency,timeliness, and content. Also of interest would be howoften a particular type of statistic (a unit minority rate, anindividual referral rate, etc.) leads to the detection of aproblem. With such data it would be easier to determinehow well the monitoring/ feedback approach works, and todetermine which reports/ statistics were most useful indetecting problems.
Advances in computing may lead to better automatedcoding algorithms. It is much easier to control the quality ofan automated process than to control a clerical operationinvolving hundreds of individuals. Likewise, improved tech-nology will hopefully increase the speed and efficiency ofclerical coding systems like the Computer Assisted ClericalCoding System.
References—
[1] Mersch, Michael L., 1980 Preliminary Evaluation ResultsMemorandum No. 68, ‘‘Results of Processing Center Cod-ing Performance Evaluation.’’ U.S. Department of Com-merce, Bureau of the Census. January 1984.
Table 4.27. Comparison With 1980 Census
Method ofcoding
1980 1990
ClericalAutomated and
clerical
Estimated errorrate . . . . . . . . . . . . 13.0 ± 0.5 Industry 9.0 ± 0.06 Industry
18.0 ± 0.6 Occupation 11.0 ± 0.05 OccupationOperation time . . . . 13 months 7 monthsNumber of itemsprocessed . . . . . . . 43.2 million 44.3 million
Number of pro-cessing sites. . . . . 3 1
Number of coders(at peak produc-tion) . . . . . . . . . . . . 1200 600+
60 EFFECTIVENESS OF QUALITY ASSURANCE

JOBNAME: No Job Name PAGE: 27 SESS: 294 OUTPUT: Thu Sep 16 14:02:31 1993 / pssw01/ disk2/ 90dec/ cphe/ 2/ chapter4
[2] Brzezinski, Edward, 1990 Preliminary Research andEvaluation Memorandum No. 137, ‘‘Evaluation of theAccuracy of the Three-Way Independent Verification Qual-ity Assurance Plan for Stateside Industry and OccupationCoding.’’ U.S. Department of Commerce, Bureau of theCensus. March 1992.
[3] Russell, Chad E., 1990 Preliminary Research andEvaluation Memorandum No. 222, ‘‘1990 Industry andOccupation Coding: An Analysis of Training Test DeckScores.’’ U.S. Department of Commerce, Bureau of theCensus. April 1993.
[4] Russell, Chad E., 1990 Preliminary Research andEvaluation Memorandum No. 201R, ‘‘Quality AssuranceResults for the 1990 Stateside Industry and OccupationCoding Operation.’’ U.S. Department of Commerce, Bureauof the Census. February 1993.
General and 100-Percent Race Coding
Introduction and Background—The General and 100-Percent Race Coding operation assigned numeric codesto write-in entries keyed from 1990 decennial censuslong-form questionnaires. The operation can be thought ofas five suboperations each coding the responses from theancestry, race, language, Spanish/ Hispanic origin, andrelationship items (see items 13, 4, 15a, 7, and 2, respec-tively in form D-2 in appendix B). The 100-Percent RaceCoding operation assigned numeric codes to race write-insresponses keyed from short-form questionnaires (see item4 in form D-1 in appendix B). The same coding schemewas used for both the 100-Percent and Sample RaceCoding operations.
Write-in responses from the short- and long-form ques-tionnaires were keyed into computer files. The responsesto General Coding and 100-Percent Race items wereextracted from these files, to form a set of ancestryresponses, a set of relationship responses, a set ofSpanish/ Hispanic origin responses, a set of languageresponses, and two sets of race responses (one for theAsian Pacific Islander responses and one for AmericanIndian responses). The sets of responses were sortedalphabetically and ‘‘collapsed,’’ resulting in a record foreach unique write-in with a counter indicating how manytimes that unique write-in occurred.
The following example uses the Ancestry item to illus-trate the General Coding process. The procedure wasbasically the same for other types of write-ins (includingHundred Percent Race coding items), except that a differ-ent set of numeric codes was used. Ancestry codes weresix-digit codes, and all other types (race, language, etc.)were three-digit codes. For example, the ancestry code009032 might mean ‘‘Flemish German,’’ and the race code920 might mean ‘‘American Indian.’’
Item 13 of the 1990 decennial census questionnaire(long form) asks: ‘‘What is . . .’s [person one’s] ancestry orethnic origin? Ancestry means ethnic origin or descent,’’roots‘‘ or heritage.’’ The response to this question waswritten in by the respondent in the box provided. This
response and the responses to the same question askedabout each person in the household comprise the universeof ancestry write-ins coded in the Ancestry Coding opera-tion.
Each unique write-in was compared to coded write-ins inthe corresponding master file. The master files werecreated using write-ins from the 1980 census, 1986 TestCensus, and 1988 Dress Rehearsal. When a write-inmatched (character by character) an entry in the masterfile, the number of responses ‘‘contained’’ in that case wasadded to the counter for that entry. These countersaccumulated the number of times a particular write-in wasencountered in the census.
Unique write-ins which did not match an entry in themaster file were added, and had to be coded manually.Coding was done by subject matter experts in the Popula-tion Division at headquarters. The process was semiauto-mated: portions of the master file would be displayed onthe coder’s computer screen. Cases with a blank in thecode field would be filled in by the coder. A verifier alsocould change codes assigned by others that they thoughtwere inappropriate. Future occurrences of added write-inswould be automatically ‘‘coded’’ by the computer.
Methodology—A sample of each coder’s work was selectedfor dependent verification. If the verifier disagreed with thecode assigned, a ‘‘difference’’ was said to occur. Differ-ences were of three types:
1. Nonsubjective—indicating a violation of coding proce-dures.
2. Subjective—indicating a difference of opinion amongexperts (but no direct violation of procedures).
3. Procedural change—indicating a difference resultingfrom a change in a coding convention occurring aftercoding but before verification.
The difference rate measures the level of ‘‘disagree-ment’’ among the coders that the code assigned was themost appropriate code for that response.
Dependent verification of a coder’s work was used tomonitor the coding process. All of the first 1,000 codesassigned by a coder were verified by another coder,usually the coding supervisor. After the first 1,000 codes, a5-percent sample was verified. In addition, cases codedwith 300 or more responses at the time of coding wereverified.
Differences were classified into three categories: non-subjective, subjective, and procedural change type differ-ences. A nonsubjective difference occurred when theverifier considered the code to be inconsistent with thecoding procedures. The verifier wrote ‘‘NS’’ next to suchcases, and wrote in the correct code. For example, codingthe race response ‘‘Black’’ as ‘‘White,’’ or coding theancestry response ‘‘Puerto Rican’’ as ‘‘Spanish’’ would beagainst coding procedures and would be considered non-subjective differences by the verifier.
61EFFECTIVENESS OF QUALITY ASSURANCE

JOBNAME: No Job Name PAGE: 28 SESS: 294 OUTPUT: Thu Sep 16 14:02:31 1993 / pssw01/ disk2/ 90dec/ cphe/ 2/ chapter4
If the assigned code did not directly contradict thecoding procedures, but the verifier thought that anothercode might be more appropriate, the verifier assigned asubjective difference to the code. For instance, the codermight code the write-in ‘‘Sanish’’ as ‘‘Spanish,’’ while theverifier might have coded it as ‘‘Danish.’’ As anotherexample, does the string ‘‘Indian’’ indicate an AmericanIndian, a South American Indian, or a person from India?Such differences were marked with an ‘‘S’’ on the qualityassurance listing along with the code the verifier wouldhave assigned.
When a coding procedure was changed it took time forthe information to circulate among all coders and evenmore time to revise the written coding procedures. It waspossible that a procedure could change before a coder’swork was reviewed. Certain codes might then seem totallyinappropriate upon review when scrutinized in the light ofthe new procedures. To avoid this, the category of proce-dural change differences was developed. As an example,the character string ‘‘Irish Scotch’’ had been interpreted asreferring to two ethnic groups from Ireland and Scotland. Aprocedural change revised this convention, as it was likelythat this write-in referred to the Scotch Irish, a distinctethnic group. During verification, writeins coded accordingto the former ‘‘Irish Scotch’’ convention were marked witha ‘‘PC’’ to indicate that the new procedures no longersanctioned such a code, which was the norm when thewrite-in was coded.
Limitations—A difference is not the same as an error.While a nonsubjective difference is likely to indicate that anerror has been made (either by the coder or the verifier), asubjective difference reflects only that the verifier wouldhave assigned a different code, not that the code assignedis inappropriate. Consider the write-in ‘‘Sanish.’’ ‘‘Sanish’’could be coded ‘‘Spanish,’’ ‘‘Danish,’’ or ‘‘Uncodable’’without violating coding procedures according to the cod-er’s judgement. While difference rates are a measure ofcoding quality, they are merely correlated with error rates.
The estimated difference rates for the 1990 operations(overall, nonsubjective, subjective, and procedural changetype) are estimated using the Horvitz-Thompson estimator.To simplify the calculation of the standard errors of theseestimates, it is assumed that the quality assurance casesare selected independently. This is not the case, sincesystematic sampling was used.
Different verifiers are more/ less likely to call a code asubjective difference. Consider the case of ‘‘Sanish.’’Some verifiers would understand assigning a code of‘‘Spanish’’ and not take issue with such an assignment.Others may wish to stress the importance of the possibilitythat the answer is ‘‘Danish.’’ The likelihood that a verifierassigns a difference is subject to a verifier effect. Unlessotherwise noted, all difference rates reported in this reportinclude all three types of differences.
Difference rates (called ‘‘outgoing error rates’’) from the1980 Independent Coder Evaluation are presented forcomparison. These measures, also of coder ‘‘disagree-ment’’ were obtained differently and are likely to havedifferent statistical properties. Neither the 1980 outgoingerror rates or the 1990 difference rates are measures ofoutgoing data quality. The 1980 figures are on an individualwrite-in basis, while each coding action in 1990 had thepotential to affect many responses. The difference ratesshould be viewed as comparing the level of disagreement(not of error) per coding action (not per write-in).
Results—
Comparison With 1980 General Coding—The 1990 Gen-eral and 100-Percent Race Coding operations were extremelysuccessful. All of the race write-ins (both short and longform) were coded, marking the first time that write-inresponses were coded on both long- and short-formquestionnaires.
The 1990 General Coding operation was completed inless time by fewer coders than the 1980 General Codingoperation. This is attributed to the use of automation (theautomated coder, unduplicating the responses, and thecomputer assisted coding system). Also, fewer question-naire items were coded in the 1990 General Codingoperation than in the 1980 operation.
Outgoing data were more consistent due to the designof the 1990 operation. In 1980, individual responses werecoded, allowing for two occurrences of an identical write-into be coded differently. In 1990, codes were assigned toeach unique response. Every occurrence of a particularwrite-in was guaranteed to have the same code, whetherthat code was right or wrong.
Results of quality assurance verification are given intable 4.28, along with other operational statistics.
Table 4.28. Summary of Coding Results
Coding operationNumber ofresponses
codedNumber of
codersMonths tocomplete
Codesadded to
master file
Differencerate (stan-dard error)
Nonsubjec-tive differ-
ences1Subjective
differences1
Proceduralchange
differences1
Ancestry . . . . . . . . . . . . . . . . . . . . . . . . . . . . 35,248,408 16 6 921,251 1.47 (0.17) 38 42 20Language . . . . . . . . . . . . . . . . . . . . . . . . . . . 4,080,609 4 6 56,863 1.90 (0.26) 22 61 17Relationship . . . . . . . . . . . . . . . . . . . . . . . . . 505,797 1 6 10,115 0.74 (0.35) 70 30 0Hundred percent race (short form) . . . . . 9,882,310 6 4.5 236,216 3.95 (0.17) 35 52 13Race (long form) . . . . . . . . . . . . . . . . . . . . . 2,204,746 2 2 19,451 3.6 (0.58) 15 84 1Spanish/ Hispanic origin. . . . . . . . . . . . . . . 805,943 2 5 26,539 1.16 (0.57) 0 100 0
1Expressed as a percentage of the total number of differences.
62 EFFECTIVENESS OF QUALITY ASSURANCE

JOBNAME: No Job Name PAGE: 29 SESS: 294 OUTPUT: Thu Sep 16 14:02:31 1993 / pssw01/ disk2/ 90dec/ cphe/ 2/ chapter4
In general, the estimated difference rates are the sameor lower for the same items coded in 1990, except for therace item. This is probably attributed to the large number ofresponses collected (race write-ins were 100-percentcoded). Hundred-percent coding, coupled with migrationover the last decade, resulted in a much more diversepopulation of race write-ins than in 1980. As new write-inswere encountered, including many Canadian and SouthAmerican Indian tribes, race code categories becamemore numerous and coding became more complex andopen to dissent between coder and verifier.
Conclusions—The 1990 General Coding operation dem-onstrated that with the help of new technologies (theautomated coder, and Computer Assisted Coding sys-tems) it is possible to code write-ins more efficiently thanby purely clerical methods. Difference rates were generallylower than 1980 error rates on items common to both. Forthe first time, a write-in item was coded from all (short andlong form) census questionnaires. That this and the otherGeneral Coding items could be coded so quickly by such asmall group of coders is a remarkable achievement.
According to the quality assurance plan, cases withmore than 300 responses were to be verified with cer-tainty. Because the write-ins entered the system in four‘‘waves,’’ the final number of times a write-in occurred wasnot known until after all the responses had been received.This should be considered when designing quality assur-ance systems for similar operations in the future.
The computer assisted coding system did not validate acoder’s initials when the coder entered the system. As aresult, a few coders worked under two different sets ofinitials. Since the computer sampled quality assurancecases at a rate which depended upon how many cases acoder (referenced by a particular sequence of initials) hadcoded, 100-percent verification was sometimes done aftera coder had completed their first 1,000 codes. The lack ofidentification validation did not cause serious operationalproblems. It did cause some difficulty interpreting thequality assurance reports. Had detailed statistics beengenerated by the management information system at thecoder level the consequences could have been moreserious. It is recommended that computer based systemsvalidate the identity of a user, especially if it affects the waythe system operates.
Reference—
[1] Russell, Chad E., 1990 Preliminary Research andEvaluation Memorandum No. 175, ‘‘Quality AssuranceResults for the 1990 General Coding and Hundred PercentRace Coding Operation.’’ U.S. Department of Commerce,Bureau of the Census. August 1992.
Place-of-Birth, Migration, and Place-of-Work
Introduction and Background—The purpose of the Place-of-Birth, Migration, and Place-of-Work coding operationwas to assign numeric codes to keyed write-in responses
to the Place-of-Birth, citizenship, migration, Place-of-Work,and employer questions on long-form 1990 DecennialCensus questionnaires. The Place-of-Birth/ Migration/ Place-of-Work coding operation was broken up into its constitu-ent parts: Place-of-Birth, Migration, Place-of-Work/ Place,and Place-of-Work/ Block coding. Each of these distinctoperations consisted of two parts: machine coding andclerical coding. The latter was performed by clerks usingthe computer assisted clerical coding system.
Identical write-in responses to Place-of-Birth, Migration,and Place-of-Work/ Place questions were grouped intoclusters. The computer attempted to match the write-inresponses to reference files and then assign a code withan associated level of accuracy. Computer codes assignedwith high level of accuracy are referred to as machinecoded. The Place-of-Work/ Block responses were not clus-tered until after machine coding. Clusters, or individualPlace-of-Work/ Block responses, coded with a low accu-racy level (and those which the computer could not code)were sent to the clerical coding unit.
Clerical coding was performed by the Data PreparationDivision in Jeffersonville, Indiana, and the Field Division inCharlotte, North Carolina. Clerical coding operated on twolevels, production and referral coding. Production codersattempted to code all clusters they were assigned. Clus-ters that the production coders were not able to code werereferred to the referral unit. Referral coders receivedadditional training and reference materials not available tothe production coders. Referral coders did not have theoption of referring clusters to a higher authority. Bothproduction and referral coding were semiautomated usingthe automated coding system.
Methodology—The quality assurance plan for the Place-of-Work/ Place-of-Birth/ Migration coding involved three aspects:training/ qualification, verification, and quality circle meet-ings. Coders were trained and tested before beginning tocode. During production, each coder was monitored. Thedata collected from the quality assurance monitoring werefurnished to supervisors to help them make decisions andprovide useful feedback to coders. By holding quality circlemeetings, coders were given the opportunity to give theirinput on how to improve the coding operation.
Coder Training—Classroom training sessions were givento all Place-of-Birth, Migration, Place-of-Work/ Place, andPlace-of-Work/ Block coders. A separate training packagewas used for each type of coding. Following each type oftraining, coders were assigned up to three test decks todetermine whether they were qualified to begin.
The first or practice test deck was scored but did notcount for or against the coders. Following the practice testdeck, up to two additional test decks were assigned. Tobegin production, a coder had to code at least one testdeck with an acceptable level of quality. A coder failed aqualification test deck if the number of errors exceeded theallowable errors for the type of coding.
63EFFECTIVENESS OF QUALITY ASSURANCE

JOBNAME: No Job Name PAGE: 30 SESS: 295 OUTPUT: Thu Sep 16 14:02:31 1993 / pssw01/ disk2/ 90dec/ cphe/ 2/ chapter4
Supervisors discussed errors with the coders beforethey began the next test deck. Coders who failed both testdecks were retrained and given one more chance toqualify.
Verification Scheme—A three-way independent codingverification scheme was employed for the Place-of-Birth/ Migration/ Place-of-Work coding operation. A sampleof clerical and machine coded clusters was replicatedtwice, resulting in three ‘‘copies’’ of the clustered response.The three identical clusters were assigned to three differ-ent coders for coding. The sampling rates for each type ofcoding were: computer: Place-of-Work, 1.0 percent; Migra-tion, 0.3 percent; Place-of-Work/ Place, 4.0 percent; andPlace-of-Work/ Block, 1.0 percent; and clerical: Place-of-Birth, 5.0 percent; Migration, 5.0 percent; Place-of-Work/ Place,5.0 percent; and Place-of-Work/ Block, 5.0 percent.
A work unit was designed to take about 2 hours to code.The work unit sizes of the Place-of-Birth, Migration, Place-of-Work/ Place, and Place-of-Work/ Block operations were200, 75, 100, and 50 clusters, respectively.
The machine assigned code was always used as theproduction code for machine coded clusters. For clericalquality assurance clusters, the majority code, as deter-mined by the three independent coders, was used as theproduction code. For three-way differences, the code fromthe lowest numbered work unit was used as the productioncode.
If two out of three coders agreed on the same code andthe third coder disagreed, the dissenting code was theminority code and the dissenting coder was charged withan error. This error counted toward increasing the coder’serror rate. If the minority code was a referral, the coder wascharged with an error. The referral rate was not based onthe quality assurance sample.
Quality Circles—The quality circles gave coders the oppor-tunity to suggest ways to improve the operation and theirjobs. Some of the comments and suggestions resulted inchanges to the procedures, training, or other parts of theoperation.
Recordkeeping—All quality assurance data were collectedand maintained by the Geography Division on the VAXcluster of minicomputers. Reports were generated daily,showing the production codes and clerically assignedcodes for all quality assurance cases where a coderassigned a minority code to a cluster.
Weekly reports were generated for the supervisors.These were produced for supervisors to monitor theprogress of the coders and provide constructive feedback.
Limitations—
Reviewing Place-of-Work/ Place Minority Reports—The Place-of-Work-Block coding system was set up by coding areaswhich made it difficult to review the minority reports. A
coding area had to remain open in order to review theminority reports for that coding area. This interfered withthe process, since the system would only allow one opencoding area per unit at any given time.
Qualification Test Decks—Several errors were found in thecomputer-based instruction version of the test decks. Theerrors were due to changes in the software and referencefiles. As a result, the scoring of the test decks was notcompletely accurate. Unfortunately, it was not possible tochange the computer-based instruction during qualifica-tion.
Error Definition—A minority code is not necessarily anincorrect code. Minority codes usually indicated when acoder was in error; however, several minority codes werefound to be correct upon review. Minority rates are stronglycorrelated with, but should not be mistaken for, a coder’strue error rate.
Computer Response Time—Variations in the responsetime of the computer system, related to the number ofcoders using the system simultaneously, caused the pro-duction rates of the coders to fluctuate unpredictably.Production standards were abolished early because of thisvariability.
Results—
Place-of-Birth—The overall estimated error, referral, andthree-way difference rates for the Place-of-Birth Computer-Assisted Clerical Coding operation were 4.1, 7.7, and 0.8percent, respectively. The standard error of the estimatederror rate was 0.8 percent. The overall production rate forPlace-of-Birth coding was 53.3 clusters coded per hour.
During the first 2 weeks of production, the averagePlace-of-Birth coder had an estimated error rate of 4.6percent. The final estimated error rate for the operationwas 4.1 percent, a relative decrease of 10.6 percent overthe course of the operation. This is attributed to learningresulting from supervisor feedback.
The average size of Place-of-Birth clusters input tomachine coding was 45.5 responses per cluster. Theaverage size of Place-of-Birth clusters sent to clericalcoding was 2.2 responses per cluster. This indicates thatmost of the large clusters were machine codable.
The average error rate on Place-of-Birth qualificationtest decks was 3.9 percent. The percentage of Place-of-Birth qualification scores exceeding the error tolerance(failing) was 6.5 percent.
The error rates for Place-of-Birth production coderswere found to be dependent on first qualification test deckerror rates. That is, high/ low first qualification test deckerror rates were associated with high/ low production esti-mated error rates. However, no significant correlation wasdetected between the final (last) test deck score and errorrates during production.
64 EFFECTIVENESS OF QUALITY ASSURANCE

JOBNAME: No Job Name PAGE: 1 SESS: 291 OUTPUT: Fri Sep 24 08:26:41 1993 / pssw01/ disk2/ 90dec/ cphe/ 2/ chapter4a
Migration—The overall estimated error, referral, and three-way difference rates for the Migration Computer AssistedClerical Coding operation were 7.3, 19.9, and 1.7 percent,respectively. The standard error of the estimated error ratewas 0.8 percent. The overall production rate for Migrationcoding was 56.7 clusters coded per hour.
During the first 2 weeks of production, the averageMigration coder had an estimated error rate of 7.7 percent.The final estimated error rate for the operation was 7.3percent, a relative decrease of 5.7 percent over the courseof the operation.
The average size of Migration clusters input to machinecoding was 4.1 responses per cluster. The average size ofMigration clusters sent to clerical coding was 1.3 responsesper cluster.
The average error rate on Migration qualification testdecks was 9.1 percent. The percentage of Migrationqualification test deck scores exceeding the error toler-ance (failing) was 30.3 percent.
The data suggest that the final qualification test deckerror rates were correlated with production error rates.However, no significant correlation was shown betweenproduction error rates and first test deck error rates.
Place-of-Work/ Place—The overall estimated error, refer-ral, and three-way difference rates for the Place-of-Work/Place Computer Assisted Clerical Coding operation were3.0, 13.5, and 0.5 percent, respectively. The standard errorof the estimated error rate was 0.05 percent. The overallproduction rate for Place-of-Work/ Place coding was 89.0clusters coded per hour.
During the first 2 weeks of production, the averagePlace-of-Work/ Place coder had an estimated error rate of3.3 percent. The final estimated error rate for the operationwas 3.0 percent, a relative decrease of 10.3 percent overthe course of the operation.
The average size of Place-of-Work/ Place clusters inputto machine coding was 3.1 responses per cluster. Theaverage size of Place-of-Work/ Place clusters sent toclerical coding was 1.1 responses per cluster.
The average error rates on Place-of-Work/ Place quali-fication test decks completed in the Jeffersonville andCharlotte Processing Offices were 6.2 and 15.6 percent,respectively. The error rate in Charlotte was significantlyhigher than the error rate in Jeffersonville. The percent-ages of Place-of-Work/ Place qualification scores abovetolerance (failing) in Jeffersonville and Charlotte were 5.8and 43.0 percent, respectively.
Place-of-Work/ Block—The overall estimated error, refer-ral, and three-way difference rates for the Place-of-Work/ BlockComputer-Assisted Clerical Coding operation were 8.8,57.0, and 2.5 percent, respectively. The standard error ofthe estimated error rate was 0.03 percent. The overallproduction rate for Place-of-Work/ Block coding was 46.7clusters coded per hour.
During the first 2 weeks of production, the averagePlace-of-Work/ Block coder had an error rate of 10.7percent. The final estimated error rate for the operationwas 8.8 percent, a relative decrease of 17.9 percent overthe course of the operation.
The average size of Place-of-Work/ Block clusters sentto clerical coding was one response per cluster.
The average error rates for Place-of-Work/ Block quali-fication test decks completed in Jeffersonville and Char-lotte were 12.6 and 21.2 percent, respectively. The errorrate in Charlotte was significantly higher than the error ratein Jeffersonville. The percentages of Place-of-Work/ Blockqualification scores above tolerance in Jeffersonville andCharlotte were 17.8 and 46.3 percent, respectively.
The error rates for the Place-of-Work/ Block Codingoperation in Jeffersonville and Charlotte were found to bedependent on first qualification test deck error rates. Thatis, high/ low first qualification test error rates led to high/ lowproduction estimated error rates. In contrast, the produc-tion estimated error rates for Place-of-Work/ Block in Jef-fersonville were shown to be dependent on final qualifica-tion test deck error rates.
Quality Circles—Minutes were collected from 19 qualitycircle meetings—14 held in Jeffersonville and 5 in Char-lotte. These meetings resulted in 501 comments andsuggestions—332 in Jeffersonville and 169 in Charlotte.Table 4.29 shows the types of comments brought upduring the quality circle meetings held in Jeffersonville andCharlotte.
The majority of the procedural comments from Jeffer-sonville were questions on how to code particular responses.Most of these questions should have been answered bythe supervisor.
Workloads—Table 4.30 illustrates the total workloads assignedto the automated coder, the number of machine-codedclusters, clerical clusters, the quality assurance samplesize, and the total automated coding system workload foreach type of coding. Note that the quality assurancesample is the additional workload that was added to theautomated coding system.
Table 4.29. Distribution of Comments From QualityCircle Meetings
Type of comment
Jeffersonville Charlotte
Numberof com-
mentsPercentof total
Numberof com-
mentsPercentof total
Training. . . . . . . . . . . . . . . . . . . . 47 14.2 44 26.0Procedures/ coding charts. . . . 190 57.2 34 20.1Software/ computer referencefiles . . . . . . . . . . . . . . . . . . . . . . 62 18.7 16 9.5
Quality assurance . . . . . . . . . . . 13 3.9 12 7.1On site/ work site . . . . . . . . . . . 2 0.6 43 25.4General/ other . . . . . . . . . . . . . . 18 5.4 20 11.8
Total . . . . . . . . . . . . . . . . . . 332 100.0 169 100.0
65EFFECTIVENESS OF QUALITY ASSURANCE

JOBNAME: No Job Name PAGE: 2 SESS: 293 OUTPUT: Fri Sep 24 08:26:41 1993 / pssw01/ disk2/ 90dec/ cphe/ 2/ chapter4a
Coding Rates—Table 4.31 shows the overall estimatederror, production, referral, and three-way difference ratesfor each coding operation coding.
Learning Curve Analysis—Learning curves were constructedto examine the improvement in error rates as a function ofcoding experience. The measure of experience in this caseis time in production. It was important that a coder’s firstweek of production be compared to the performance ofother coders during their first week of production, regard-less of when they started coding.
A quadratic model (figure 4.21) for Place-of-Birth learn-ing appears to fit the estimated error rate data (R-square= .665vs. .372). However, the fit is still poor.
Figure 4.22 illustrates the Migration learning curve.Although the operation lasted 22 weeks, the longest acoder performed MIG production coding was 14 weeks.Most Migration production coders eventually were sent toPlace-of-Work Place or Place-of-Work/ Block productioncoding.
Figure 4.23 illustrates the 5-week Place-of-Work/ Placeestimated error rate curve in Jeffersonville.
Figure 4.24 shows the production learning curve for thePlace-of-Work/ Place operation in Jeffersonville.There appearsto be no notable change in the Place-of-Work/ Place
production rate. This is probably due to the relatively shortproduction time. The longest that a coder performedPlace-of-Work/ Place production coding was 5 weeks.
Figure 4.25 illustrates the Jeffersonville, Indiana Place-of-Work-Block estimated error rate learning curve. Althoughthe operation lasted 17 weeks, the longest that a coderperformed Place-of-Work/ Block production coding was 16weeks.
Figure 4.26 shows the Charlotte, North Carolina Place-of-Work/ Block estimated error rate learning curve. Therewas a 2-month gap in production coding, only the first 12weeks were be used to estimate the learning curve. Thecoders were not thoroughly retrained before they beganthe last 2 weeks of production coding.
Figure 4.27 indicates the production rates increasedsignificantly during the coders’ eighth week of production.The system operated faster when there were fewer coderscoding. The higher production rates observed were causedby having few coders (six) on the system during that week.In fact, the last 5 weeks represent production rates basedon less than 7 coders in a given week.
Figure 4.28 illustrates the Migration production learningcurve from December 3, 1990, through May 5, 1991. Fewerthan 7 coders were involved in production coding duringthe final 5 weeks.
Figure 4.29 illustrates the production learning curve forPlace-of-Work/ Block coding in Jeffersonville. The slightupward trend in the graph is most likely explained byimproved machine capacity due to fewer coders using thesystem.
Table 4.30. 1990 Decennial Census Workloads
Item POB MIG POW-PL POW-BL
Total responses . . 37,650,494 15,281,848 5,652,626 NATotal clusters
(assigned to auto-mated coder) . . . . . . . 827,931 3,727,299 1,807,178 10,664,381
Machine clusters(clusters coded bythe automatedcoder) . . . . . . . . . . . . . 465,036 3,137,986 1,635,873 4,970,245
Clerical clusters (clus-ters NOT coded bythe automatedcoder) . . . . . . . . . . . . . 362,895 589,313 171,305 5,694,136
Quality assurancesample . . . . . . . . . . . . 40,416 71,029 117,896 850,980Machine QA clus-
ters . . . . . . . . . . . . . 1,370 4,039 33,576 28,855Clerical QA clus-
ters . . . . . . . . . . . . . 39,046 66,990 84,308 NATotal clusters
assigned to C-ACC. . 403,311 660,342 289,201 NA
Where: POB—Place-of-Birth, MIG—Migration, POW-PL—Place-of-Work/ Place, POW-BL—Place-of-Work/ Block
Table 4.31. 1990 Decennial Census Coding Rates
POB MIG POW-PL POW-BL
Total workload. . . . . . . . . . . . . . 403,311 660,342 289,201 5,694,136Quality assurance sample. . . . 58,569 100,485 126,462 850,980Estimated error rate . . . . . . . . . 4.1 7.3 3.0 8.8Production rate . . . . . . . . . . . . . 53.3 56.7 89.0 46.7Referral rate. . . . . . . . . . . . . . . . 7.7 19.9 13.5 57.0Three-way difference rate . . . . 0.8 1.7 0.5 2.5
66 EFFECTIVENESS OF QUALITY ASSURANCE

JOBNAME: No Job Name PAGE: 3 SESS: 293 OUTPUT: Fri Sep 24 08:26:41 1993 / pssw01/ disk2/ 90dec/ cphe/ 2/ chapter4a
67EFFECTIVENESS OF QUALITY ASSURANCE
JOBNAME: No Job Name PAGE: 4 SESS: 293 OUTPUT: Fri Sep 24 08:26:41 1993 / pssw01/ disk2/ 90dec/ cphe/ 2/ chapter4a
68 EFFECTIVENESS OF QUALITY ASSURANCE

JOBNAME: No Job Name PAGE: 5 SESS: 293 OUTPUT: Fri Sep 24 08:26:41 1993 / pssw01/ disk2/ 90dec/ cphe/ 2/ chapter4a
Figure 4.30 illustrates the Charlotte Place-of-Work/ Blockproduction learning curve for Charlotte. The upward trendis probably due to fewer coders using the system towardthe end of the operation. During the eleventh week, only 24Place-of-Work/ Block coders, probably the best coders,performed production coding.
Conclusions —The quality assurance plan was developedto ensure that the computer assisted clerical coding sys-tem for the 1990 decennial census operated under aprocess control system. The quality assurance systemimproved the quality of the computer assisted clericalcoding system production coding over the course of theoperation. The quality assurance reports provided dailyand weekly information concerning the coders perfor-mances to the supervisors for feedback. The supervisorsfelt that the reports were useful in detecting coders thatwere having difficulties understanding or following theprocedures, with the notable exception of the WeeklyOutlier Reports. These would have been more useful hadthey covered a time period longer than a week. As theywere, they simply burdened supervisors. The quality circleprogram collected several recommendations which resultedin revisions to the procedures and improvements to theoverall computer assisted clerical coding system. Therewas no convincing evidence of correlation between testdeck scores and production error rates for all of theoperations. Ideally, test deck error rates should be corre-lated positively (and strongly) with later production errorrates. If they are not, then the test decks cannot serve their
purpose, which is to predict whether the coders willperform adequately during production. If the test deckapproach is to be used in the future, the test decksthemselves should be tested carefully for their predictiveability early in the census cycle.
The Daily Supervisory Dependent Review of CodersReport showed only the final codes, not the matchedreference file records. To verify that minority coders werein fact incorrect, the supervisors were required to translatethese codes into names using a hard copy equivalency list.This made it very time consuming to review the reports anddifficult to provide timely feedback to coders based onthese reports. Modifying the Geography Division softwareto allow supervisors the capability to display the recordthat the coder matched in the reference file, rather thanthe numeric code, would make the supervisory reviewmuch easier. The Weekly Coder Outlier Report was gen-erated too frequently to be effective. A report containingthe last 4 weeks of outliers, by coder within coding unit,might be more useful while easing the paper burden onsupervisors.
An on site quality circle coordinator and the coordina-tors from headquarters should be identified while theproject is still in the testing and design phase. The sitecoordinator should be a permanent census employeephysically located at the coding site and assigned toheadquarters. This would bring the coordinator into theproject prior to starting production, and allow the coordi-nator time to become familiar with all aspects of theproject.
The computer sampling programs should be tested priorto production and preferably during the dress rehearsal offuture censuses to ensure their accuracy.
‘‘Large’’ clusters that are not exact (machine) matchesshould be included with certainty in the quality assurancesample. The remainder of the clerical and computer qualityassurance clusters should be selected randomly from theremaining clusters.
The average quality assurance sample size for Migra-tion and Place-of-Work/ Block work units was small, 11and 7 clusters, respectively. Although the percent ofquality assurance clusters within a work unit should not bechanged, it is recommended that a coder complete asufficient number of work units, that is accumulate acertain number of quality assurance cases, such as threeconsecutive Migration work units or four consecutive Place-of-Work/ Block work units, before their error rate is esti-mated and compared to the rectification level.
Reference—
[1] Falk, Eric T. and Russell, Chad E., 1990 PreliminaryResearch and Evaluation Memorandum No. 145, ‘‘1990Place-of-Birth, Migration, and Place-of-Work Computer-Assisted Clerical Coding Quality Assurance Results.’’ U.S.Department of Commerce, Bureau of the Census. May1992.
69EFFECTIVENESS OF QUALITY ASSURANCE

JOBNAME: No Job Name PAGE: 6 SESS: 293 OUTPUT: Fri Sep 24 08:26:41 1993 / pssw01/ disk2/ 90dec/ cphe/ 2/ chapter4a
DATA KEYING
Race Write-In
Introduction and Background—The census question-naires requested information on race for all persons.Respondents had the option of selecting one of thespecific categories listed on the questionnaire or enteringa write-in answer to identify an American Indian tribe or anOther Asian/ Pacific Islander race not listed. Write-in responseswere accepted for both the race question (item 4 on thecensus questionnaire) and the Hispanic origin question(item 7); however, only the race question was keyed duringthe Race Write-In Keying operation. Keyed race responseswere assigned numeric codes for inclusion in the 100-percent edited detail file.
The Race Write-In Keying operation was implementedby Decennial Management Division (formerly DecennialOperations Division) and was performed at each of theseven processing offices. The operation lasted from May16, 1990, through December 31, 1990. During this periodof time, approximately 15,245,991 race write-in entrieswere keyed from 5,404,102 short-form questionnaires onmicrofilm using the Microfilm Access Device machines. Atotal of 111,307 camera units (batches made up of ques-tionnaires) were processed. Long forms and other censusquestionnaires were processed in other operations.
The Decennial Statistical Studies Division designed thequality assurance plan to be implemented during the RaceWrite-In Keying operation. The plan was designed todetect and correct keying errors, to monitor the keying, andto provide feedback to the keyers, to prevent further errors.
The collected quality assurance data were analyzed,and the results were documented (see [1]). The primaryobjectives of the data analysis were to determine thequality of keying of race write-in entries, to identify andexamine variables that may affect keying, and to evaluatethe effectiveness of the quality assurance plan.
The Decennial Statistical Studies Division also designedan independent study of the 1990 race write-in keyingquality assurance plan. The study compared a keyedsample of race write-in entries to the corresponding finalcensus file of race write-in responses.
The results were analyzed and documented (see [2]).The objectives of the independent study were to estimatethe quality of the final keyed file of race write-in responses,to obtain insight into the types and reasons for the errors,and to assess the impact of critical errors on the usage ofthe race write-in data.
Methodology—
Quality Assurance Plan—The race write-in keying qualityassurance plan involved a two-stage quasi-independentsample verification, first on the batch level, then on thewithin-batch or questionnaire level.
1. Batch level—The first 30 batches for each keyer wereverified. If a keyer’s sample field error rate for these 30batches did not exceed 2.5 percent, then a 20 percentsample of batches was selected for verification there-after. If a keyer’s sample field error rate for the mostrecent 5-day period exceeded 2.5 percent at any time,then all batches completed by that keyer were verifieduntil the field error rate for a 5-day period was lessthan 2.5 percent.
2. Questionnaire level—The questionnaire sampling ratewithin each batch was determined by the number ofquestionnaires with race write-in entries. If the numberof questionnaires with race entries was less than orequal to 40, all keyed questionnaires were verified. Ifthe number was greater than 400, 10 percent of thekeyed questionnaires were verified. Otherwise, 40keyed questionnaires were verified.
Each field on a sampled questionnaire was keyed byanother keyer (verifier) and was compared to the corre-sponding keyer entry using a soft verification algorithmcalled soundx that only detected and identified significantdifferences (spacing differences, for example, were allowed).An error was charged to the keyer if the differencebetween the keyer and verifier versions exceeded thetolerance of the algorithm.
If the keyed batch failed the tolerance check, a listingwas generated for all differences between the keyer andverifier field entries. If the keyer was responsible for one ormore errors, he/ she repaired the entire batch.
During this process, summary data were collected andmaintained in a datafile. The file contained information onthe batch, volume, sample size, type of error, time, andquality decisions. After the operation was completed,specific data were extracted and analyzed to meet thequality assurance plan objectives.
Independent Study—A sample of 1,101 batches (approxi-mately 1 percent) was selected for the independent study,406 of which were included in the census quality assur-ance operation.
For each batch in the evaluation sample, every racewrite-in field with a response was keyed by two persons,one of whom was termed the production keyer and theother the verifier for description purposes. Two files ofkeyed entries were created for each batch, a productionkeyer file and a verifier file. These two files were merged tocreate an evaluation file, and if the production keyer’s andverifier’s entries differed, then the verifier version wasincluded on the evaluation file. A difference listing wasproduced by batch, listing the production keyer and verifierversions of fields which were keyed differently. This listingand the corresponding source documentation were reviewedby a third person who determined which of the two keyedversions was correct. If the verifier version was determined
70 EFFECTIVENESS OF QUALITY ASSURANCE

JOBNAME: No Job Name PAGE: 7 SESS: 294 OUTPUT: Fri Sep 24 08:26:41 1993 / pssw01/ disk2/ 90dec/ cphe/ 2/ chapter4a
to be incorrect, then that entry in the evaluation file wascorrected. For the purpose of this study, it was assumedthat the keyed race write-in responses on this file accu-rately represent the data on the questionnaires.
After the independent study evaluation file was created,all race write-in entries on the file were compared to thecorresponding entries keyed during the census operation,using the soundx algorithm. The differences detected bythe algorithm were analyzed for their significance, origina-tion, cause, and type.
Limitations—The following limitations should be consid-ered when reviewing the results.
Quality Assurance Plan—
1. The estimates in this report not only depend on theamount of sampling error but also on the efficiency ofthe verifiers and accuracy of the procedures. Theindependent study shows evidence that estimatesfrom quality assurance data are understated.
2. Many of the errors detected may not have beenattributable to a keyer, but may have occurred due toa respondent entry that was illegible or interpreteddifferently by the keyer and verifier. This type of‘‘respondent error’’ cannot be measured.
Independent Study—
1. A field keying error was critical if it was determined thatthe race was coded incorrectly. Therefore, the codethat would be assigned to an entry had to be deter-mined in order to classify an error as critical, and thisdetermination of code assignment was made by theanalyst for this evaluation. The analyst is not a raceexpert and since the assignment of codes was some-times subjective, there may be instances where thecorrect or most appropriate code assignment was notdetermined.
Different race codes were sometimes combined forcensus tabulations. Therefore, it is possible that acritical error may have affected tabulations at one levelof aggregation without affecting those at another levelof aggregation.
2. It became evident during the analysis for this evalua-tion that there were cases of race write-in responseswhich were not covered in the keying procedures ortraining, and the treatment of these cases dependedon the judgement of the keyer or unit supervisor.Therefore, it was possible that a census keyer mayhave treated a response differently from the way anevaluation keyer treated it, yet did not make a proce-dural error. For this evaluation, such cases, termedrespondent errors, were distinguished from caseswhich were obvious nonsubjective, procedural mis-takes, termed keyer errors. For some of the error ratesdiscussed in this independent study, both types ofcases were included in the calculations.
3. Causes of error were determined by comparing thekeyed entries to the source documentation; that is, themicrofilm of questionnaires. In some cases categoriz-ing the errors into causes depended on the judgement,or educated guess, of the analyst.
4. All verified batches could have failed verification oneor more times, but they must have passed eventually.Therefore, there could have been multiple versions ofkeyed responses for the batches, including one ver-sion that passed and other versions which failedverification. For the purpose of this evaluation, onlyone version could be compared to the final evaluationfile, and only the version which passed verification wasavailable for comparison. Therefore the error rateestimates underestimate the actual error rates for theproduction keyers and these rates should not be usedin a comparison with results from the quality assur-ance operation.
Results—
Quality Assurance Plan— It was estimated that the keyerscommitted keystroke mistakes (or omissions) in 0.51 per-cent of the fields keyed with a standard error of 0.01percent. This error rate represents initial production key-ing. Some of these errors were corrected during laterstages of the operation.
Table 4.32 shows the field error rates for race write-inkeying at the national and processing office levels.
There were two boxes within the race question on thecensus questionnaire for which write-in responses wereaccepted. One box was to identify a specific AmericanIndian tribe; the other box was to identify a specific OtherAsian/ Pacific Islander race not already listed. Based onthe quality assurance sample, 25 percent of race write-inentries were in the American Indian category and 75percent were in the ‘‘Other’’ category. Kansas City was theonly processing office that keyed a majority of entries inthe American Indian category. Table 4.33 shows the fielderror rates for each category at the national and process-ing office levels.
The Race Write-In Keying operation lasted approxi-mately 34 weeks. During this period, the start dates variedbetween individual keyers as well as the number of batches
Table 4.32. Field Error Rate
Processing office
Race write-in entries keyed in error
PercentStandard error
(percent)
National . . . . . . . . . . . . . . . . .51 .01Kansas City. . . . . . . . . . . . . .33 .06Baltimore. . . . . . . . . . . . . . . .61 .03Jacksonville . . . . . . . . . . . . .42 .03San Diego . . . . . . . . . . . . . . .45 .02Jeffersonville . . . . . . . . . . . .69 .05Austin. . . . . . . . . . . . . . . . . . .59 .04Albany . . . . . . . . . . . . . . . . . .54 .04
71EFFECTIVENESS OF QUALITY ASSURANCE

JOBNAME: No Job Name PAGE: 8 SESS: 294 OUTPUT: Fri Sep 24 08:26:41 1993 / pssw01/ disk2/ 90dec/ cphe/ 2/ chapter4a
each one keyed. Analysis of the keyers’ performancerevealed a trend of declining field error rate over time asshown in figure 4.31.
This decline in error rate represents a ‘‘learning curve,’’which can be attributed to feedback and experience. Eachinterval on the horizontal axis represents 5 keying days;that is, ‘‘1’’ represents days 1 to 5. The field error rate foreach keyer, on the average, decreased from 2.15 percentfor the first batch keyed to 0.33 percent for the last batchkeyed.
There appears to be some relationship between pro-duction rate and quality as shown in figure 4.32. Asproduction rate increased, the field error rate decreased
(quality increased). Each interval on the horizonal axisrepresents an increment of 0.1 keystrokes/ second; that is,‘‘0’’ represents 0-0.1 keystrokes/ second. The latter por-tion of the graph is skewed due to a small number ofbatches keyed at relatively fast rates.
The national average batch size was 38 questionnairesand 91 race write-in entries. This varied from the smallestaverage of 20 questionnaires and 44 entries at Jefferson-ville to the largest average of 76 questionnaires and 196entries at San Diego.
Approximately 71 percent of the batches containedfewer than 40 questionnaires. There is no apparent linearrelationship between quality and batch size.
A batch was to fail the quality assurance tolerancecheck when its sample field error rate exceeded 2.5percent. Typically, errors were clustered within rejectedbatches, as was the case during race write-in keying. Theaverage field error rate of rejected batches was 5.21percent while that of accepted batches was 0.25 percent.
Rejected batches were repaired by the original keyerand all errors were to be corrected. These batches werethen to be reverified. Of the repaired and reverified batches,almost 8 percent still had a large number of errors remain-ing and needed to be repaired for a second time.
Repaired batches were not necessarily reverified asspecified, but were resampled for verification at a rate ofapproximately 52 percent. Because not all rejected andrepaired batches were reverified, an estimate of at least 79batches were forwarded to the final race data file withsignificant amounts of error that should have been detectedand corrected during the quality assurance process.
Table 4.33. Field Error Rate by Type of Race Write-InEntry
Processing office
Type of race write-in entry
American Indian Asian/ Pacific Islander
Error(percent)
Standarderror
(percent)Error
(percent)
Standarderror
(percent)
National . . . . . . . . . . . . . .52 .02 .51 .01Kansas City. . . . . . . . . . .44 .08 .31 .06Baltimore. . . . . . . . . . . . .55 .05 .62 .03Jacksonville . . . . . . . . . .48 .07 .42 .03San Diego . . . . . . . . . . . .45 .03 .45 .02Jeffersonville . . . . . . . . .68 .08 .68 .04Austin. . . . . . . . . . . . . . . .62 .06 .58 .03Albany . . . . . . . . . . . . . . .50 .05 .55 .05
72 EFFECTIVENESS OF QUALITY ASSURANCE

JOBNAME: No Job Name PAGE: 9 SESS: 294 OUTPUT: Fri Sep 24 08:26:41 1993 / pssw01/ disk2/ 90dec/ cphe/ 2/ chapter4a
The race write-in keying quality assurance process wasdesigned to detect and correct all erroneous or omittedrace write-in entries within all verified questionnaires. Dueto cost, workload, and time constraints, only 34 percent ofthe camera units (batches) and 16 percent of the ques-tionnaires with race write-in entries were verified during thequality assurance process. Camera units and question-naires that were not verified went directly to the final racedatafile with undetected errors. Therefore, an estimated0.42 percent of the race write-in entries in the final racedatafile still remained in error.
Independent Study—The percentage of critical errors con-tained in the census race data after completion of thekeying operation was an estimated 0.54 percent. Theestimated critical error rate for the American Indian fieldwas 0.66 percent, and the estimated critical error rate forthe Other Asian/ Pacific Islander field was 0.49 percent. Anerror was critical if it was determined that the race wascoded incorrectly. These estimates are not comparable tothe census quality assurance error estimates because thecensus operation did not distinguish between critical andnon-critical errors. Tables 4.34 and 4.35 show the criticalerror rates at the national and regional levels.
It became evident during the analysis for this evaluationthat there were cases of race write-in responses whichwere not covered in the keying procedures or training, andthe treatment of these cases depended on the judgementof the keyer or unit supervisor. For this evaluation, suchcases, termed respondent errors, were distinguished fromcases which were obvious nonsubjective, procedural mis-takes, termed keyer errors. Keyer errors accounted for 38
percent of all critical errors in the keyed race data; theremaining 62 percent were respondent errors.
The percentage of critical keyer errors contained in thecensus race data after completion of the keying operationwas an estimated 0.19 percent. The estimated criticalkeyer error rates for the American Indian field and theOther Asian/ Pacific Islander field are 0.19 percent.
The percentage of critical respondent errors containedin the census race data after completion of the keyingoperation was an estimated 0.32 percent. The estimatedcritical respondent error rate for the American Indian fieldwas 0.43 percent which was significantly different fromthat of the Other Asian/ Pacific Islander field, 0.28 percent.
There were three primary causes for keyer errors:keying from the wrong column or field, correcting ormodifying the respondent entry, and other keystroke orprocedural mistakes. Of all critical keyer errors, these threecauses accounted for 66 percent, 19 percent, and 15percent, respectively.
The causes of respondent errors usually related to howthe write-in response appeared on the questionnaire/microfilm. Listed are five situations that caused keyersdifficulty and their respective contribution to the respon-dent error total:
• Subjective (8.4 percent)—the response was very difficultto read.
• Erased (26.7 percent)—the response appeared to havebeen erased but was still legible.
• Outside box (9.9 percent)—a portion of the responsewas written outside the write-in box.
• Crossed out (32.8 percent)—the response appeared tohave been crossed out but was still legible.
• None/ na/ same (8.4 percent)—the response was anuncodable entry such as ‘‘none,’’ ‘‘N/ A,’’ or ‘‘same.’’
• Other (13.7 percent).
Each of these conditions may have caused a keyer tokey data incorrectly, especially if no procedure or instruc-tion for the situation was given.
A comparison was made between the keyer error ratesderived from the census quality assurance operation andthe evaluation study. This comparison was limited tobatches that passed verification. The results indicated thatthe census keyer field error rate for these batches was0.51 percent based on the quality assurance data and 1.14percent based on the evaluation.
The difference between the two estimates can bepartially explained by how the keyers handled responsesthat were difficult to interpret. The completed FormsD-2114, Race Keying Verification Record, were used byverifiers to help understand how the production keyershandled these responses. Therefore, for many of theresponses which required some keyer judgement, theverifier knew exactly what was keyed by the productionkeyer and may have keyed the same entry. On the other
Table 4.34. Critical Field Error Rate
Region
Race write-in entries with critical errors
PercentStandard error
(percent)
National . . . . . . . . . . . . . . . . .54 .03Northeast . . . . . . . . . . . . . . .56 .07Midwest . . . . . . . . . . . . . . . . .62 .07South Atlantic. . . . . . . . . . . .63 .07South Central . . . . . . . . . . . .47 .06West. . . . . . . . . . . . . . . . . . . .51 .05
Table 4.35. Critical Field Error Rate by Type of RaceWrite-In Entry
Region
Type of race write-in entry
American Indian Asian/ Pacific Islander
Error(percent)
Standarderror
(percent)Error
(percent)
Standarderror
(percent)
National . . . . . . . . . . . . . .66 .04 .49 .03Northeast . . . . . . . . . . . 1.06 .14 .45 .06Midwest . . . . . . . . . . . . . .67 .11 .59 .07South Atlantic. . . . . . . . .70 .08 .60 .08South Central . . . . . . . . .58 .07 .40 .06West. . . . . . . . . . . . . . . . .55 .06 .49 .05
73EFFECTIVENESS OF QUALITY ASSURANCE

JOBNAME: No Job Name PAGE: 10 SESS: 294 OUTPUT: Fri Sep 24 08:26:41 1993 / pssw01/ disk2/ 90dec/ cphe/ 2/ chapter4a
hand, an evaluation keyer, working independently fromcensus production, may have keyed the response differ-ently. This could explain some of the difference betweenthe quality assurance estimate and the independent studyestimate of production keyer error.
Conclusions—
Quality Assurance Plan—It was estimated that 0.51 per-cent of the race write-in entries were keyed in error. Thisfield error rate estimate represented all errors detected bythe soundx algorithm, regardless of the origin or reason ofthe mistake.
The quality assurance plan specified that all rejectedand repaired batches were to be reverified to detect anyremaining errors. However, these batches were resampledfor reverification at a rate of 52 percent and approximately79 batches went to the final race datafile with significantamounts of error. In order to ensure maximum efficiency,each specific requirement of the quality assurance planmust be implemented.
The sample error tolerance level of 2.5 percent wasused for all verified batches regardless of the number ofquestionnaires. As in the Race Write-In Keying operation,when the sampling scheme varies, dependent upon thebatch size, the tolerance should vary similarly. This ensuresaccuracy in identifying poorly keyed batches.
Independent Study—The overall quality of the 100-PercentRace Write-In Keying operation was very good. Based onthis evaluation, approximately 0.54 percent of the racewrite-in fields keyed contained a critical error; that is, thefield containing a keying error was coded incorrectly.
Approximately 62 percent of the critical errors on thefinal census race file are respondent errors. Procedures forfuture keying operations should explicitly address thesesituations so that the keying of these cases will mostaccurately reflect the intentions of the respondent andminimize the amount of keyer judgement involved.
The verification for the quality assurance of the censuskeying did not detect a significant number of existingproduction keyer errors. Based on results from the censusoperation, the overall estimated field error rate of thecensus production keyers, for batches that passed verifi-cation, was 0.51 percent. Based on the final evaluation file,the census production keyers had an overall field error rateof 1.14 percent among sample batches.
Some of this difference can be explained by respondenterrors. Two keyers from the same unit may have treated aresponse similarly, but the keyed entry still remained inerror. The use of Form D-2114 probably contributed to thediscrepancy by biasing the verifier’s interpretation of aquestionable response. It is likely that the majority ofentries listed on the form were respondent errors.
Approximately 44 percent of production keyer errors,identified by the evaluation, were keyer errors. It is difficultto explain why these errors were not detected by censusverifiers more successfully.
It should be pointed out that the keying operation andthe independent evaluation keying were conducted withindifferent production environments. The census keying wasperformed under tougher time constraints and the qualityof the verification may have suffered somewhat as a result.
Nevertheless, it is imperative that research is conductedto understand the variables which contribute to this prob-lem.
References—
[1] Roberts, Michele A., 1990 Preliminary Research andEvaluation Memorandum No. 241, ‘‘1990 Decennial Census—100-Percent Race Write-In Keying Quality Assuance Eval-uation.’’ U.S. Department of Commerce, Bureau of theCensus. July 1993.
[2] Wurdeman, Kent, 1990 Preliminary Research andEvaluation Memorandum No. 205, ‘‘Independent Study ofthe Quality of the 100-Percent Race Write-In Keying.’’ U.S.Department of Commerce, Bureau of the Census. Novem-ber 1992.
Long Form
Introduction and Background—During the 1990 census,a sample of 1 in 6 housing units was selected to receivelong-form questionnaires. These questionnaires requiredmuch more detailed respondent information than the short-form questionnaires, and many of the data collected werewrite-in entries. All responses were keyed and coded tomaximize consistency.
The Decennial Statistical Studies Division designed thequality assurance plan to be implemented during the Long-Form Keying operation. The plan was designed to detectand correct keying errors, to monitor the keying, and toprovide feedback to the keyers to prevent further errors.
At the time of this publication, the quality assurancedata still are being analyzed. The primary objectives of thedata analysis are to determine the quality of keying of long-form questionnaires, to identify and examine variables thatmay affect keying, and to evaluate the effectiveness of thequality assurance plan.
Methodology—For batches with 30 or more long-formquestionnaires, a systematic sample of 1 in 15 long forms(6.67 percent) was selected for verification. For batcheswith fewer than 30 long forms, a random sample of 2 wasselected.
Each field on a sample questionnaire was keyed byanother keyer (verifier) and was matched to the corre-sponding keyer entry. One error was charged to the keyerfor each verified field keyed in error, omitted, or in aduplicated record. A numeric field was in error if the keyerinformation did not exactly match the verifier information,or if the field was keyed by the verifier but omitted by the
74 EFFECTIVENESS OF QUALITY ASSURANCE
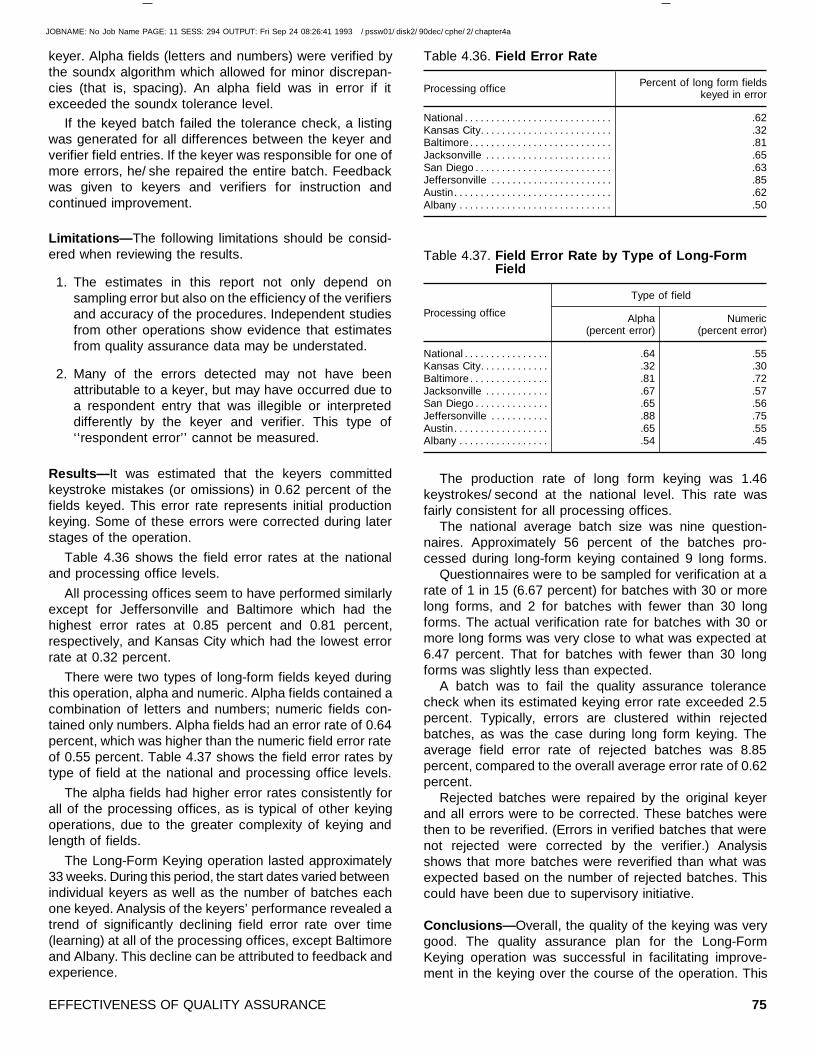
JOBNAME: No Job Name PAGE: 11 SESS: 294 OUTPUT: Fri Sep 24 08:26:41 1993 / pssw01/ disk2/ 90dec/ cphe/ 2/ chapter4a
keyer. Alpha fields (letters and numbers) were verified bythe soundx algorithm which allowed for minor discrepan-cies (that is, spacing). An alpha field was in error if itexceeded the soundx tolerance level.
If the keyed batch failed the tolerance check, a listingwas generated for all differences between the keyer andverifier field entries. If the keyer was responsible for one ofmore errors, he/ she repaired the entire batch. Feedbackwas given to keyers and verifiers for instruction andcontinued improvement.
Limitations—The following limitations should be consid-ered when reviewing the results.
1. The estimates in this report not only depend onsampling error but also on the efficiency of the verifiersand accuracy of the procedures. Independent studiesfrom other operations show evidence that estimatesfrom quality assurance data may be understated.
2. Many of the errors detected may not have beenattributable to a keyer, but may have occurred due toa respondent entry that was illegible or interpreteddifferently by the keyer and verifier. This type of‘‘respondent error’’ cannot be measured.
Results—It was estimated that the keyers committedkeystroke mistakes (or omissions) in 0.62 percent of thefields keyed. This error rate represents initial productionkeying. Some of these errors were corrected during laterstages of the operation.
Table 4.36 shows the field error rates at the nationaland processing office levels.
All processing offices seem to have performed similarlyexcept for Jeffersonville and Baltimore which had thehighest error rates at 0.85 percent and 0.81 percent,respectively, and Kansas City which had the lowest errorrate at 0.32 percent.
There were two types of long-form fields keyed duringthis operation, alpha and numeric. Alpha fields contained acombination of letters and numbers; numeric fields con-tained only numbers. Alpha fields had an error rate of 0.64percent, which was higher than the numeric field error rateof 0.55 percent. Table 4.37 shows the field error rates bytype of field at the national and processing office levels.
The alpha fields had higher error rates consistently forall of the processing offices, as is typical of other keyingoperations, due to the greater complexity of keying andlength of fields.
The Long-Form Keying operation lasted approximately33 weeks. During this period, the start dates varied betweenindividual keyers as well as the number of batches eachone keyed. Analysis of the keyers’ performance revealed atrend of significantly declining field error rate over time(learning) at all of the processing offices, except Baltimoreand Albany. This decline can be attributed to feedback andexperience.
The production rate of long form keying was 1.46keystrokes/ second at the national level. This rate wasfairly consistent for all processing offices.
The national average batch size was nine question-naires. Approximately 56 percent of the batches pro-cessed during long-form keying contained 9 long forms.
Questionnaires were to be sampled for verification at arate of 1 in 15 (6.67 percent) for batches with 30 or morelong forms, and 2 for batches with fewer than 30 longforms. The actual verification rate for batches with 30 ormore long forms was very close to what was expected at6.47 percent. That for batches with fewer than 30 longforms was slightly less than expected.
A batch was to fail the quality assurance tolerancecheck when its estimated keying error rate exceeded 2.5percent. Typically, errors are clustered within rejectedbatches, as was the case during long form keying. Theaverage field error rate of rejected batches was 8.85percent, compared to the overall average error rate of 0.62percent.
Rejected batches were repaired by the original keyerand all errors were to be corrected. These batches werethen to be reverified. (Errors in verified batches that werenot rejected were corrected by the verifier.) Analysisshows that more batches were reverified than what wasexpected based on the number of rejected batches. Thiscould have been due to supervisory initiative.
Conclusions—Overall, the quality of the keying was verygood. The quality assurance plan for the Long-FormKeying operation was successful in facilitating improve-ment in the keying over the course of the operation. This
Table 4.36. Field Error Rate
Processing office Percent of long form fieldskeyed in error
National . . . . . . . . . . . . . . . . . . . . . . . . . . . . .62Kansas City. . . . . . . . . . . . . . . . . . . . . . . . . .32Baltimore. . . . . . . . . . . . . . . . . . . . . . . . . . . .81Jacksonville . . . . . . . . . . . . . . . . . . . . . . . . .65San Diego . . . . . . . . . . . . . . . . . . . . . . . . . . .63Jeffersonville . . . . . . . . . . . . . . . . . . . . . . . .85Austin. . . . . . . . . . . . . . . . . . . . . . . . . . . . . . .62Albany . . . . . . . . . . . . . . . . . . . . . . . . . . . . . .50
Table 4.37. Field Error Rate by Type of Long-FormField
Processing office
Type of field
Alpha(percent error)
Numeric(percent error)
National . . . . . . . . . . . . . . . . .64 .55Kansas City. . . . . . . . . . . . . .32 .30Baltimore. . . . . . . . . . . . . . . .81 .72Jacksonville . . . . . . . . . . . . .67 .57San Diego . . . . . . . . . . . . . . .65 .56Jeffersonville . . . . . . . . . . . .88 .75Austin. . . . . . . . . . . . . . . . . . .65 .55Albany . . . . . . . . . . . . . . . . . .54 .45
75EFFECTIVENESS OF QUALITY ASSURANCE

JOBNAME: No Job Name PAGE: 12 SESS: 294 OUTPUT: Fri Sep 24 08:26:41 1993 / pssw01/ disk2/ 90dec/ cphe/ 2/ chapter4a
was accomplished by identifying sources of error andproviding prompt feedback to keyers, concentrating onthose whose errors occurred with unacceptable frequency.
It was estimated that 0.62 percent of the long-formfields were originally keyed in error. This field error rateestimate represented all errors detected by ‘‘exact match’’verification for numeric fields and by the soundx algorithmfor alpha fields, regardless of the origin or reason of themistake.
The sample error tolerance level of 2.5 percent wasused for all verified batches regardless of the number ofquestionnaires. As in the Long-Form Keying operation,when the sampling scheme varies, dependent upon thebatch size, the tolerance should vary similarly. This ensuresaccuracy in identifying poorly keyed batches.
1988 Prelist
Introduction and Background—During the 1988 Prelistoperation, addresses were obtained by census enumera-tors in prelist areas (suburban areas, small cities, towns,and some rural areas), areas for which census addresslisting capability is limited. The 1988 Prelist Keying opera-tion was implemented by Decennial Management Division(formerly Decennial Operations Division) in the BaltimoreProcessing Office and the Kansas City Processing Office.The keyed prelist addresses were used to update themaster census address file for the purposes of deliveringcensus questionnaires and conducting subsequent follow-upoperations.
The Decennial Statistical Studies Division designed thequality assurance plan to be implemented during the 1988Prelist Keying operation. The plan was designed to detectand correct keying errors, to monitor the keying, andprovide feedback to the keyers to prevent further errors.
The collected quality assurance data were analyzed,and the results were documented (see [1]). The primaryobjectives of the data analysis were to determine thequality of keying of prelist addresses, to identify andexamine variables that may affect keying, and to evaluatethe effectiveness of the quality assurance plan.
The Decennial Statistical Studies Division also designedan independent study of the 1988 prelist keying qualityassurance plan. The study, implemented by Data Prepara-tion Division, compared a sample of prelist address regis-ters to the corresponding final keyed census prelist addressfile.
The results were analyzed and documented (see [2]).The objectives of the independent study were to estimatethe quality of the final keyed file of prelist addresses, toobtain insight into the types and reasons for the errors, andto assess the impact of critical errors on the usage of theprelist data.
Methodology—
Quality Assurance Plan—A 10-percent systematic samplewas selected for verification from each keyed address
register containing at least 100 addresses. For registerswith fewer than 100 addresses, all (100 percent) wereverified.
The verifier keyed all numeric fields (block number, mapspot number, house number, unit designation, ZIP Code)plus the street name field in the appropriate addresses. Anexact match was required. If the verifier’s entry differedfrom the keyer’s entry, the terminal beeped and the verifierrechecked his/ her own entry with the address register.The verifier visually compared (scanned) each remainingalpha field (letters and numbers) in the address (occupantname, road name, location description, remarks) to thekeyer’s entry. Minor discrepancies (that is, spacing) werepermitted in these alpha fields.
If the keyed address register failed the tolerance check,a listing was generated for all differences between keyerand verifier field entries. If the keyer was responsible forone or more errors, he/ she repaired the entire register.
During this process, summary data were collected andmaintained in a datafile. The file contained information onthe batch, volume, sample size, type of error, time, andquality decisions. After the operation was completed,specific data were extracted and analyzed to meet thequality assurance plan objectives.
Independent Study—A sample of 129 address registers,with an average of 435 addresses each, was selected toensure 90 percent reliability that the field error rate esti-mates, at the processing office level, were within 20percent of the true field error rates. The sample wasstratified based on the estimated field error rate for eachaddress register, calculated from the datafile createdduring the 1988 prelist keying quality assurance operation.
After the sample address registers were selected, alladdresses within each sample address register were com-pared to the corresponding keyed information at the fieldlevel. (A listing of the keyed file was output for thispurpose.) An exact match was required for each field.
Field tallies and differences were recorded on the FieldTally Form and Field Difference Form, respectively. Theseforms were sent to census headquarters, where summarydata were keyed into a datafile. This file was used tocalculate the independent study results.
Limitations—The 1988 prelist keying evaluation [1] wasbased on data collected during the quality assuranceprocess. The data primarily provided quality information onthe keyers’ performance and results of the plan implemen-tation. The independent study assessed the quality of theprelist data file after keying. Therefore, it was difficult tomake a comparison between the results from the twoevaluations.
Results—
Quality Assurance Plan—The 1988 prelist quality assur-ance plan estimated that 0.48 percent of the fields werekeyed in error. This represented a 52 percent improvement
76 EFFECTIVENESS OF QUALITY ASSURANCE

JOBNAME: No Job Name PAGE: 13 SESS: 294 OUTPUT: Fri Sep 24 08:26:41 1993 / pssw01/ disk2/ 90dec/ cphe/ 2/ chapter4a
over the 1988 Dress Rehearsal field error rate of 1.0percent. Table 4.38 shows the field error rate and standarderrors at the national and processing office levels.
The field error rate decreased significantly throughoutthe operation. The overall field error rate dropped from0.95 percent in the first weeks of keying to 0.44 percent bythe end of the operation. Regression analysis shows thatthe field error rate dropped more sharply at Kansas City.The field error rate decreased 0.0019 percent for every 5working days at Kansas City, compared to 0.0015 percentat Baltimore.
The field error rates for accepted and rejected addressregisters were 0.46 and 9.17 percent, respectively.
The street name field had the greatest percentage oferror at 1.49 percent.
There was an inverse relationship between productionrate (keystrokes/ hour) and field error rate; that is, thefaster keyers had lower error rates. Regression analysisshows a decrease of 0.0059 in field error rate for every1,000 increase in keystrokes/ hour.
The national field error rate for scan-verified fields was0.38 percent, and 0.49 percent for key-verified fields.However, scan-verified fields accounted for only 9.2 per-cent of verified fields, and they had little impact on theoverall field error rate.
Independent Study—The independent study estimatedthat a total of 1.53 percent of the fields on the 1988 prelistaddress file were in error due to differences between theaddress registers and keyed information. Table 4.39 showsthe field error rate and standard errors at the national andprocessing office levels.
These error rates represent differences between theoriginal address registers and the keyed prelist addressfile, regardless of the magnitude or impact of the errors. Itis difficult to compare these error rates to those of the1988 prelist keying quality assurance evaluation or otherkeying operations because of the different definitions forerror.
It is estimated that 0.35 percent of the fields on theprelist file contained a ‘‘critical error.’’ In this evaluation, anerror was determined to be critical if the keying differenceswere significant enough to misrepresent the original fieldinformation. This type of error could potentially affect thedeliverability of the census questionnaire to the address orcause difficulty in locating the address during subsequentfollow-up activities. This definition of critical error is uniqueto this operation based on the use of the keyed informa-tion. Critical errors could also potentially impact futureaddress list development operations, such as the AdvancePost Office Check and Casing.
Although this definition for critical error and the defini-tion for field error from the quality assurance evaluation arenot exactly the same, they are similar and somewhatcomparable. The field error rate for data from the qualityassurance evaluation was 0.48 percent. Based on theslight variation in error definition and the different stages ofthe keying process during which the two sets of data werecollected, a critical error rate of 0.35 percent is about whatwas expected for this evaluation. Table 4.40 shows thecritical error rates at the national and processing officelevels.
It is estimated that the fields containing critical errorsaffected 1.30 percent of the addresses on the prelist file.This indicates that approximately 362,647 addresses inprelist areas could have had difficulty in receiving censusmail if these errors were not corrected during subsequentaddress list development operations. The house numberand unit designation fields contained critical error rates of0.57 percent and 2.28 percent, respectively, and accountedfor 241,232 (67 percent) of the affected addresses.
Another impact of critical errors on the prelist file is thatthey could hinder the Census Bureau’s ability to locaterural type addresses during follow-up activities. Of the4,547,041 (16.3 percent) rural addresses in prelist areas, itis estimated that 3.19 percent of the addresses containcritical errors in the fields necessary to properly locate thehousing unit. The location description field contained acritical error rate of 1.07 percent and accounted for 34percent of the rural addresses affected.
The independent study also identified field keying ‘‘errors’’(differences) that actually improved the quality of theprelist file. This situation relates to the general keyingpolicy of ‘‘KEY WHAT YOU SEE.’’ In some instances thekeyers inserted data into a blank in the address register infields such as block number, ZIP Code, street name, etc.,
Table 4.38. Quality Assurance Plan Field Error Rate
Processing office Error rate(percent)
Standarderror
(percent)
National. . . . . . . . . . . . . . . . . . . . . . . . . . . . . . . .48 .14Baltimore . . . . . . . . . . . . . . . . . . . . . . . . . . . . . .62 .17Kansas City . . . . . . . . . . . . . . . . . . . . . . . . . . . .31 .22
Table 4.39. Independent Study Field Error Rate
Processing office Error rate(percent)
Standarderror
(percent)
National. . . . . . . . . . . . . . . . . . . . . . . . . . . . . . . 1.53 .02Baltimore . . . . . . . . . . . . . . . . . . . . . . . . . . . . . 2.09 .05Kansas City . . . . . . . . . . . . . . . . . . . . . . . . . . . 1.22 .03
Table 4.40. Critical Field Error Rate
Processing office Error rate(percent)
Standarderror
(percent)
National. . . . . . . . . . . . . . . . . . . . . . . . . . . . . . . .35 .01Baltimore . . . . . . . . . . . . . . . . . . . . . . . . . . . . . .41 .02Kansas City . . . . . . . . . . . . . . . . . . . . . . . . . . . .32 .01
77EFFECTIVENESS OF QUALITY ASSURANCE

JOBNAME: No Job Name PAGE: 14 SESS: 294 OUTPUT: Fri Sep 24 08:26:41 1993 / pssw01/ disk2/ 90dec/ cphe/ 2/ chapter4a
based on surrounding data. Even though the inserted datawas obviously correct it was still an error (not criticalbecause it did not negatively impact the file) because itviolated procedures.
When examining the keying errors or fields that werekeyed differently from the prelist address registers, manyof these differences were found to be minor; that is,spacing and single keystroke errors. It is estimated that78.4 percent of these errors were not critical and would notimpact the use of the final file.
Conclusions—
Quality Assurance Plan—The quality assurance plan forthe 1988 Prelist Keying operation was successful in improv-ing the keying over the course of the operation. This wasaccomplished by identifying sources of keying errors andproviding prompt feedback to keyers, concentrating onkeyers whose errors occurred with unacceptable frequency.
There was also a marked decrease in field error ratesfrom the 1988 Dress Rehearsal prelist keying. A new,automated keying system was largely responsible for theimprovement. The quality assurance plan was also modi-fied to take advantage of the more advanced system.
Although field error rates were used as accept/ rejectcriteria for this operation, record error rate may be a morepractical determinant of keying quality, as records primarilyrepresent addresses, and most address fields are criticalto deliverability. Errors in one or more important fieldscould adversely affect deliverability.
Due to the high field error rate tolerance limits, very fewwork units required repair. However, the few rejected workunits had field and record error rates well above therespective tolerance limit. This is an indication that thequality assurance plan detected keyed address registerscontaining gross amounts of field or record errors. How-ever, the primary goal of the quality assurance plan was toobtain data to provide feedback to the keyers.
Independent Study— The quality of the keying of 1988prelist addresses appears to be high with an error rate of1.53 percent. However, this 1.53 percent represents allfields that were keyed differently than the original prelistaddress registers, regardless of the magnitude or impact ofthe errors. This error rate cannot be compared to theoriginal 1988 prelist keying quality assurance evaluation orother keying operations because of the different definitionsfor error.
In the independent study, critical errors were defined asthose keying differences that were significant enough tomisrepresent the original field information. This type oferror could potentially impact the use of the final prelistaddress file for delivering census questionnaires or locat-ing addresses for follow-up. Critical errors could alsopotentially affect the quality of future address list develop-ment operations.
It is estimated that 0.35 percent of the fields on the 1988prelist address file contained critical errors. This is a moreaccurate representation of the quality of the final prelistaddress file than the 1.53 percent error rate mentionedabove, because of the error definition.
This evaluation shows that the majority of keying differ-ences occurred in alpha fields. These fields are larger(longer) and more complex than numeric fields and havemore opportunities for error. Most of the keying differencesin alpha fields were not critical. In fact, only 8.6 percent ofthese differences were serious enough to potentially impactthe final prelist address file.
Soundx is an automated method of verifying alphafields, which allows for minor spelling, spacing, and key-strokes errors. Soundx has been successfully implementedin keying operations subsequent to 1988 prelist keying.(See other reports under Data Keying.)
ZIP Code was one of the most important fields thatrequired keying. The prelist keyers recognized this andsometimes interpreted the information in the addressregisters (that is, several addresses in an apartment com-plex or a row of housing units on the same street) to fill inmissing ZIP Codes while keying, if the correct ZIP Codewas obvious. This would have been considered an error inthe original quality assurance evaluation because thekeyed information did not match the address register.However, if the interpreted ZIP Code was correct, it mayhave improved an otherwise unusable address. In a con-trolled environment, with specific guidelines and record-keeping, keyer interpretation may improve the final datafile, particularly in situations where prior clerical editingwould be costly and unnecessary.
The current evaluation method in keying operations is tocharge the keyer with an error for every difference betweenthe original written document and the keyed file. However,these differences cannot always be attributed to keyererror. For example, the keyer may be required to interpretunclear handwriting which may be interpreted differently bythe verifier. Also, there are many reasons for keyingdifferences such as interpretation, omission, duplication,keystrokes error, spacing, etc.
Many keying differences were noncritical in nature.Since the keyer is instructed to key as accurately aspossible, any deviation from the original document is anerror attributable to keyer performance. These errors shouldbe used to provide feedback to the keyer to improve thequality of the work. However, only critical errors, which bydefinition could impact the final file, should be rectified.Noncritical errors which would not affect the file do nothave to be rectified, as this would be time-consumingwithout significantly improving the final file.
References—
[1] Boodman, Alan, 1990 Preliminary Research and Eval-uation Memorandum No. 29, ‘‘1988 Prelist Keying QualityAssurance Evaluation.’’ U.S. Department of Commerce,Bureau of the Census. September 1990.
78 EFFECTIVENESS OF QUALITY ASSURANCE
JOBNAME: No Job Name PAGE: 15 SESS: 294 OUTPUT: Fri Sep 24 08:26:41 1993 / pssw01/ disk2/ 90dec/ cphe/ 2/ chapter4a
[2] Roberts, Michele, 1990 Preliminary Research andEvaluation Memorandum No. 220, ‘‘1988 Prelist KeyingIndependent Study Quality Assurance Evaluation.’’ U.S.Department of Commerce, Bureau of the Census. March1993.
Precanvass
Introduction and Background—The Precanvass opera-tion was performed in urban and major suburban areas toverify the accuracy and completeness of the address list,obtained from commercial sources, after it had beenupdated through a post office check. Census enumeratorscompared addresses in specific geographic areas to thosein their precanvass address registers, adding missingaddresses, making corrections, and deleting duplicate,nonexistent and commercial addresses. At the end of thefield operation, these updates were keyed at the Baltimore,Jacksonville, Kansas City, and San Diego ProcessingOffices.
The Decennial Statistical Studies Division designed thequality assurance plan to be implemented during thePrecanvass Keying operation. The plan was designed todetect and correct keying errors, to monitor the keying, andto provide feedback to the keyers to prevent further errors.
The collected quality assurance data were analyzed,and the results were documented (see [2]). The primaryobjectives of the data analysis were to determine thequality of keying of precanvass addresses, to identify andexamine variables that may affect keying, and to evaluatethe effectiveness of the quality assurance plan.
The Decennial Statistical Studies Division also designedan independent study of the precanvass keying qualityassurance plan. The study, implemented by Data Prepara-tion Division, compared a sample of precanvass addressregisters to the corresponding final keyed census precan-vass address file.
At the time of this publication, the independent studydata still are being analyzed. The objectives of the analysisare to estimate the quality of the final keyed file ofprecanvass addresses, to obtain insight into the types andreasons for the errors, and to assess the impact of criticalerrors on the usage of the precanvass data.
Methodology—
Quality Assurance Plan—During the Precanvass KeyingQuality Assurance operation, every keyed address registerwas verified. Within each address register, a randomsample of 20 addresses from each action code wasselected for verification. Each address contained an actioncode to indicate its status (that is, add, delete, correction,etc.). If the register contained fewer than 20 addresseswith a particular action code, all addresses with that codewere verified.
Each field within a sample address was quasi-independentlykeyed by another keyer (verifier) and was matched to thecorresponding keyer entry. If a difference existed betweenthe two entries, the terminal ‘‘beeped’’ to allow the verifierto re-check his/ her entry.
If the keyed batch failed the tolerance check, a listingwas generated for all differences between the keyer andverifier field entries. If the keyer was responsible for one ormore errors, he/ she repaired the entire batch.
During this process summary data were collected andmaintained in a datafile. The file contained information onthe batch, volume, sample size, type of error, time, andquality decisions. After the operation was complete, spe-cific data were extracted for analysis to meet the qualityassurance plan objectives.
Independent Study—A random sample of 524 addressregisters (approximately 1 percent) was selected for theindependent study.
For each address register in the evaluation sample,every address line was keyed by two persons, one ofwhom was termed the production keyer and the other theverifier for description purposes. Two files of keyed addresseswere created, a production keyer file and a verifier file.These two files were merged to create an evaluation file,and if the production keyer’s and the verifier’s entriesdiffered, then the verifier version was included on theevaluation file. A difference listing was produced by regis-ter, listing the production keyer and verifier versions offields which were keyed differently. This listing and thecorresponding source documentation were reviewed by athird person who determined which of the two keyedversions was correct. If the verifier version was determinedto be incorrect, then that entry in the evaluation file wascorrected.
For the purpose of this study, it was assumed that thekeyed data on the evaluation file accurately represent thedata on the address registers. Conclusions and statementsabout the quality of the data produced in the censusPrecanvass Keying operation and of the operation itselfwere made using the evaluation file as the basis forcomparison.
Limitations—The following limitations should be consid-ered when reviewing the results.
Quality Assurance Plan—The quality assurance verifica-tion was not designed to distinguish critical errors (thosekeying errors that may affect deliverability) from non-critical errors. Therefore, both are included in the calcula-tions of error rate estimates.
Since the number of fields keyed by action code was notavailable, all field error rates were based on an estimate ofthe total number of fields keyed for the ‘‘add’’ and ‘‘cor-rection’’ action codes. This estimate was derived from thenumber of records keyed for each action code.
Independent Study—For precanvass keying, a field keyingerror was determined to be critical if it was significantenough to potentially affect the deliverability of a censusquestionnaire to the address. The determination of whetheror not a keying error was critical was made by the analystfor this evaluation. This determination was somewhatsubjective.
79EFFECTIVENESS OF QUALITY ASSURANCE

JOBNAME: No Job Name PAGE: 16 SESS: 295 OUTPUT: Fri Sep 24 08:26:41 1993 / pssw01/ disk2/ 90dec/ cphe/ 2/ chapter4a
Part of the results involves a discussion of the causes oferror. Causes were determined by comparing the keyedentries to the source documentation; that is, the addressregisters. In some cases, categorizing the errors intocauses depended on the judgement, or educated guess, ofthe analyst performing this evaluation.
Results—
Quality Assurance Plan—The overall pre-verification fielderror rate was 0.17 percent. The overall post-verificationfield error rate was 0.08 percent. The pre-verification fielderror rate is an estimate of the quality of keyed data priorto verification, and the post-verification field error rate is anestimate of the quality of keyed data after corrections weremade from verification and repair. Both of these figures aresubstantially below the field error tolerance level of 1.0percent. For this operation, a work unit consisted of oneaddress register.
One goal of the quality assurance plan for this operationwas to minimize differential undercoverage and rejectunacceptable work; that is, registers with a high rate offield errors. Table 4.41 presents data on the field errorrates by site for both accepted and rejected work units.The number of errors in failed work units can be consid-ered to be the number of errors ‘‘removed’’ from thesystem by the tolerance check. Of the 55,124 work unitsinitially keyed, 1,544 (2.8 percent) failed the verification byhaving a field error rates greater than the field errortolerance level of 1.0 percent. These work units werereviewed by the original keyer on a 100-percent basis(repaired) and were then reverified. The pre-verificationfield error rates in passed and failed work units were 0.08percent and 2.44 percent, respectively.
The fields with the highest error rates were the fieldsthat were keyed the fewest times, rural route/ post officebox (3.35 percent), and unit description (1.72 percent).These fields accounted for 2.05 percent of all fieldsverified, but represented 11.28 percent of all keying errors,and may have had high error rates due to their relativeinfrequency. Since so few records (fewer than one in 20)
contained these fields, keyers would not have expected tokey them most of the time, increasing the likelihood ofomission errors.
Street name and house number were the fields mostoften miskeyed. These two fields accounted for 25.5percent of all fields keyed, and represented 48.6 percent ofall keying errors. They are among the most critical fieldssince they directly affect the deliverability of the address.
The most common field, action code, appeared on allnonblank address listing lines, and, in the case of recordswith action code D (delete) or X (no change), it was theonly field keyed/ verified. As a result, action code repre-sented nearly 42 percent of all verified fields, and had anerror rate of only .03 percent, thus accounting for the lowoverall field error rates associated with the PrecanvassKeying operation.
It was determined in the planning stage that, for cover-age purposes, it was important to ensure the accuracy ofthe action codes. A miskeyed action code could cause anaddress to be marked as receiving a delete action, or couldkeep necessary corrections from being made. The overallunweighted field error rate excluding action code is .52percent.
There was a distinct learning curve for the first month ofthe operation. The second month of Precanvass Keyingcoincided with the start of another keying operation, and tomeet production goals, several of the better keyers weremoved to the other operation. This caused the field errorrates in precanvass keying to increase. It has also beenexperienced that error rates tend to rise slightly towardsthe end of a keying operation.
Even with the error rate fluctuations in the secondmonth of keying, three of the four processing offices hadan overall downward trend in field error rate. The exceptionwas Kansas City, which actually displayed slightly lowerfield error rates during the first month of keying. ManyKansas City keyers had previous keying experience. There-fore, they required a smaller period of adjustment to a newsystem, and were more likely to have low field error ratesat the beginning of an operation. Low error rates at thestart of a process lessen the chance of observing signifi-cant improvement as the operation continues.
Independent Study—
1. Adds—Addresses, which were missing from the addressregisters, were added on pages reserved just for adds,and all of the fields on each line were keyed. Eachaddress line contained fields for geocode informationand address information. This study focused on fieldsrelating to address information necessary for mailing,i.e. house number, street name, ZIP Code, unit desig-nation, and rural route/ post office box number.
A keying error was determined to be critical if it (thedifference between the census version and the evalu-ation version) was significant enough to potentiallyaffect the deliverability of a census questionnaire tothe address.
Table 4.41. Field Error Rates by Site and Pass/ FailDecision
Item
Processing office
Balti-more
Jack-sonville
KansasCity
SanDiego
Field error rate (percent)Pre-verification. . . . . . . . . . . . .21 .24 .11 .17
In passed work units . . . . .09 .10 .05 .10In failed work units . . . . . . 2.34 2.78 2.53 2.18
Post-verification. . . . . . . . . . . .09 .09 .05 .10
Percentage of field errorsIn passed work units . . . . 42.57 38.38 48.33 57.71In failed work units . . . . . . 57.43 61.62 51.67 42.29
Work unit failure rate(percent) . . . . . . . . . . . . . . . . . . 3.84 4.01 1.76 2.37
80 EFFECTIVENESS OF QUALITY ASSURANCE
JOBNAME: No Job Name PAGE: 17 SESS: 295 OUTPUT: Fri Sep 24 08:26:41 1993 / pssw01/ disk2/ 90dec/ cphe/ 2/ chapter4a
Figure 4.33 shows the percentage of critical errorsin the final precanvass file by field type for add cases.The overall estimated field error rate is 0.48 percent.The rural route/ post office box field has the highestfield error rate, but this field occurred infrequently inprecanvass areas and the errors were clustered in afew areas resulting in a high standard error.
Figure 4.34 shows the distribution of errors by typefor the mailing address fields. About 9 percent of thecritical errors were subjective. An error was catego-rized as subjective when information on the addressregister was difficult to read and the interpretation
differed between the census keyer and the evaluationkeyer. Subjective errors usually occurred in the housenumber and unit designation fields.
About 24 percent of the errors were caused by adifference in procedural interpretation. A difference inprocedural interpretation arose when the informationon an address line was in some form which theprocedures did not explicitly address, requiring somejudgement for resolution, and the census keyer andthe evaluation keyer handled the situation differently.Almost 90 percent of critical errors in the ZIP Codefield were categorized as differences in proceduralinterpretation because the field was left blank in theaddress register and the census keyer (or evaluationkeyer) keyed a ZIP Code based on information fromother address lines while the evaluation keyer (orcensus keyer) keyed the field as a blank. About 65percent of the street name errors were differences inprocedural interpretation. Many of these occurred becauseblank fields were handled differently as with the ZIPCode field, and because information other than streetname, such as unit designation or Post Office box waspresent in the street name field and the keyers han-dled the situation differently. The keying proceduresdid not adequately address these types of situations.About 29 percent of the critical errors were a result ofthe census keyer entering information from the wrongfield on the page, usually from an adjacent line orcolumn.
2. Corrections—During the Precanvass operation, enu-merators could make corrections to addresses. Any ofthe mailing address fields could be corrected exceptfor the house number. If a correction was made, onlythe particular field corrected was keyed.
The critical error rate for correction cases, for themailing address fields, was 0.79 percent. Most of thecorrections were made to the unit designation.
Figure 4.35 shows the distribution of critical errorsfor corrections to the mailing address fields. About 43percent of the errors were due to subjective differ-ences caused by corrections which were difficult todecipher. About 21 percent were due to keying anentry from the wrong field. Often the unit designationfield and unit description field were mixed up. Ninepercent were keystroke substitution errors, and about23 percent of the errors were a result of a correctionnot being keyed.
3. Evaluation of the Quality Assurance Plan—A compar-ison was made between the census keyer field errorrates derived from the quality assurance operation andthe independent study evaluation. This comparisonwas limited to work units that passed verification.
Based on the quality assurance operation, the nationalestimated field error rate for add cases was 0.11percent with a standard error of 0.02 percent; that is,the keyer and verifier entries differed for approximately
81EFFECTIVENESS OF QUALITY ASSURANCE

JOBNAME: No Job Name PAGE: 18 SESS: 295 OUTPUT: Fri Sep 24 08:26:41 1993 / pssw01/ disk2/ 90dec/ cphe/ 2/ chapter4a
0.11 percent of the fields verified. Based on theevaluation file, the national estimated field error ratewas 0.69 percent with a standard error of 0.07 percent.
Based on the quality assurance operation, the nationalestimated field error rate for correction cases was 0.17percent with a standard error of 0.05 percent. Basedon the evaluation file, the national estimated field errorrate was 1.11 percent with a standard error of 0.27percent.
The difference between the quality assurance andindependent evaluation error rate estimates is due insome part to a failure of the quality assurance opera-tion to detect errors. This failure is attributable tocensus verifier errors, since the detection of keyererror depends on the verifiers’ ability to correctlyinterpret and key address register entries. The result isunderestimated field error rates.
Procedural interpretation may also have affectederror rate estimation. A difference in procedural inter-pretation arose when the information on an addressline was in some form which the procedures did notexplicitly address, requiring some judgement for reso-lution. Therefore, it is quite possible that a censusproduction keyer and verifier working under the sameconditions would treat such a case similarly, but thatan evaluation keyer, having received separate trainingand supervision, would treat the response differently.This caused about 24 percent of the errors in addcases.
Subjectivity also caused some discrepancies betweenthe error rates. An error was categorized as subjectivewhen information on the address register was difficultto read and the interpretation differed between thecensus keyer and the evaluation keyer. It is likely thatthe census keyer and verifier treated many of these
cases similarly because of the quality assurance veri-fication system. For any field, if the verifier’s entry didnot match the production keyer’s entry, the terminal‘‘beeped’’ and required the verifier to press the resetkey to continue verification. In this manner, the verifierwas alerted to a disagreement and he/ she could thenre-check the source documents to ensure accuracy.
Conclusions—
Quality Assurance Plan— Overall, the quality of the keyingwas very good. The quality assurance plan for the Precan-vass Keying operation was successful in facilitating improve-ment in the keying over the course of the operation. Thiswas accomplished by identifying sources of keyer errorsand providing prompt feedback to keyers, concentratingon keyers whose errors occurred with unacceptable fre-quency.
Due to the high field error rate tolerance limits, very fewwork units required repair. As a result, the post-verificationerror rate is not appreciably lower than the pre-verificationerror rate. However, the few rejected work units had fielderror rates well above the respective tolerance limit. This isan indication that the quality assurance plan was effectivein identifying and removing work units containing a grossamount of field errors. Even though the main purpose ofthe quality assurance plan was not to do inspection andrepair, extremely poor quality work was virtually eliminated.
Independent Study— The overall quality of the PrecanvassKeying operation was very good. Based on the evaluation,approximately 0.48 percent of the keyed mailing addressfields in add cases contained a critical error, and approxi-mately 0.79 percent of the mailing address fields in cor-rection cases contained a critical error; that is, the differ-ence between the census version and the evaluationversion was significant enough to potentially affect thedeliverability of a census questionnaire to the address.
A large proportion of the critical errors on the finalprecanvass file, particularly errors in the street name andZIP Code fields, were due to differences in proceduralinterpretation which occurred when the information enteredby an enumerator was in some form which the proceduresdid not explicitly address, requiring some keyer judgementfor resolution. Procedures for future keying operationsshould explicitly address these situations so that thekeying of these cases will most accurately reflect theintentions of the enumerator and minimize the amount ofkeyer judgement involved.
The verification for the quality assurance operation ofthe census precanvass keying was not very successful indetecting production keyer errors. Some of this can beexplained by entries which required some subjective inter-pretation, which two keyers from the same unit may treatsimilarly, but much of the discrepancy is difficult to explain.
It should be pointed out that the keying operation andthe independent evaluation keying were conducted withindifferent production environments. The census keying was
82 EFFECTIVENESS OF QUALITY ASSURANCE

JOBNAME: No Job Name PAGE: 19 SESS: 295 OUTPUT: Fri Sep 24 08:26:41 1993 / pssw01/ disk2/ 90dec/ cphe/ 2/ chapter4a
performed under tighter time constraints and the quality ofthe verification may have suffered somewhat as a result.Nevertheless, there is certainly much room for improve-ment in the verification for keying operations.
Although it is difficult to precisely measure the impact ofcritical errors, after examining the final census status forthe census version and evaluation version of cases with acritical error, it appears likely that the critical errors didplace additional burden on coverage operations that fol-lowed Precanvass, and that some relatively small numberof housing units were not captured in the census as aresult of keying error.
References—
[1] Boodman, Alan, STSD Decennial Census Memoran-dum Series # GG-14, ‘‘Precanvass Keying Quality Assur-ance Specifications.’’ U.S. Department of Commerce, Bureauof the Census. June 1989.
[2] Wurdeman, Kent, 1990 Preliminary Research andEvaluation Memorandum No. 206, ‘‘Independent Study ofthe Quality of the 100-Percent Race Write-In Keying.’’ U.S.Department of Commerce, Bureau of the Census. Decem-ber 1992.
[3] Scott, Jimmie B., STSD 1990 Decennial Census Mem-orandum Series # K-18, ‘‘Processing Specifications for theIndependent Study of the Quality of 1990 PrecanvassKeying.’’ U.S. Department of Commerce, Bureau of theCensus. May 1991.
[4] Scott, Jimmie B., STSD 1990 REX Memorandum Series# NN-1, ‘‘1990 Evaluation Overview Independent Study ofthe Quality of Precanvass Keying.’’ U.S. Department ofCommerce, Bureau of the Census. May 1991.
[5] Bennetti, Jeanne, 1990 Decennial Census DPLD Infor-mation Memorandum # 111, ‘‘1990 Precanvass Require-ments Overview.’’ U.S. Department of Commerce, Bureauof the Census. May 1988.
Collection Control File
Introduction and Background—During the 1990 census,several field operations were implemented at the 449district offices across the country. Enumerators at eachdistrict office checked work out and in daily. This work flowwas recorded on forms specific to each of 16 enumeratorfield operations. Data from these forms were keyed into aCollection Control File.
The Decennial Statistical Studies Division designed thequality assurance plan to be implemented during theCollection Control File Keying operation. The plan wasdesigned to detect and correct keying errors, to monitorthe keying, and to provide feedback to the keyers toprevent further errors. The Collection Control File Keyingoperation was the first census for which keying was
performed at the district office level; therefore, it was thedivision’s first attempt at implementing a quality assuranceplan for such a decentralized process.
At the time of this publication, the quality assurancedata still are being analyzed. The primary objectives of thedata analysis are to determine the quality of keying of thecollection control file, to identify and examine variablesthat may affect keying, and to evaluate the effectiveness ofthe quality assurance plan.
Methodology—Of the 449 district offices, the DecennialStatistical Studies Division selected a sample of 39 fromwhich to receive and analyze data collected during thequality assurance process. Seven of the 16 operationskeyed into the collection control file were selected forverification:
• Field followup checkin
• Group quarters checkin
• List/ enumerate checkin
• List/ enumerate corrections
• List/ enumerate merge
• Non-response followup checkin
• Structuring assignment
All forms for these seven keying operations were 100-percent verified. Each field on these forms was quasi-independently keyed by another keyer (verifier) and matchedto the corresponding keyer entry. (Quasi-independent ver-ification occurs when the verifier has some knowledge ofwhether or not his/ her field entry matched the keyer’sentry.) One error was charged to the keyer for each verifiedfield keyed in error, omitted, or in a duplicated record.Verifiers corrected all detected errors. Daily error summaryreports flagged keyers performing above the error toler-ance to signify that feedback, retraining, or reassignmentmay be necessary.
Limitations—The estimates in this report not only dependon sampling error but also on the efficiency of the verifiersand accuracy of the procedures. Independent studies forother data keying operations show evidence that esti-mates from quality assurance data may be understated.
Results—A total of 53,865 batches were keyed andverified at the 39 district offices. The record error rate forthese batches was 1.29 percent, and the field error ratewas 0.73 percent with a standard error of 0.12 percent.This sample field error rate was very close to the field errorrate of 0.69 percent for all 449 district offices throughSeptember 13, 1990.
The keyer production rate was 0.94 keystrokes/ second,and varied considerably between the seven operations.
Of the 53,865 batches, 62.1 percent were keyed for the
83EFFECTIVENESS OF QUALITY ASSURANCE

JOBNAME: No Job Name PAGE: 20 SESS: 295 OUTPUT: Fri Sep 24 08:26:41 1993 / pssw01/ disk2/ 90dec/ cphe/ 2/ chapter4a
Non-response Followup Check-In operation while only0.21 percent were keyed for list/ enumerate corrections.
The number of different forms keyed within each batchvaried from two forms for group quarters check-in andstructuring assignment to five forms for field followup. Thefield error rates varied somewhat by form type withinkeying operation. Form type 1, the batch header record,had the highest field error rate at 2.81 percent.
There was no significant decrease of field error rates(‘‘learning’’) or increase of production rates throughout the25 weeks. However, while each of the seven keyingoperations were in effect throughout the 25 week period,the bulk of keying for each operation took place during afairly short period of time. Since the keyers had to switchfrequently among the many different form types, it wasunlikely that their production rates and error rates on anygiven form would improve significantly over the course ofthe operation.
Approximately 65.0 percent of the batches keyed had afield error rate of 0.24 percent or below.
A total of 996 keyers participated in at least one of thekeying operations at some time during the operation. The
number of keyers per district office varied from a low of 10to a high of 48 with an average of 25.5 keyers.
Of the 996 keyers, 16.7 percent had a field error rate thatdid not exceed 0.24 percent, while 6.1 percent had a fielderror rate that exceeded 3.0 percent. Also, 21.0 percent ofthe keyers keyed fewer than 10 batches, while 15.8percent keyed 100 or more batches.
Conclusions—The field error rate for the Collection Con-trol File Keying operation was 0.73 percent. This was thefirst census for which keying was performed at the districtoffice level, and the Decennial Statistical Studies Division’sfirst attempt at implementing a quality assurance plan forsuch a decentralized process. Therefore, it is worthy tonote that the field error rates for this operation werecomparable to those of a centralized process. The keyerswere responsible for keying many different form types andhad to switch frequently from one to another. Also, the bulkof keying was performed during a relatively short period oftime. For these reasons, there was no sign that ‘‘learning’’(a decrease of field error rate) occurred during theoperation.
84 EFFECTIVENESS OF QUALITY ASSURANCE
JOBNAME: No Job Name PAGE: 1 SESS: 41 OUTPUT: Thu Sep 16 14:03:14 1993 / pssw01/ disk2/ 90dec/ cphe/ 2/ chapter5
CHAPTER 5.Other Operations
To conduct and support the conduct of a decennialcensus, there were several miscellaneous activities forwhich quality assurance programs were designed andimplemented. One such operation was the Search/ Matchoperation. This operation supported all postcensus cover-age improvement activities by checking if potential addedpersons were already counted in the census.
A support activity was developed to assist the imple-mentation of the quality assurance program. The QualityAssurance Technician Program was developed to assist inmonitoring the implementation across the many decentral-ized locations. Monitoring was required in up to 25 ques-tionnaire printing locations, the 13 regional census cen-ters, and the 7 processing offices.
This chapter covers the Search/ Match Quality Assur-ance Program and the three Quality Assurance TechnicianPrograms.
SEARCH/ MATCH
Introduction and Background—The Search/ Match Cov-erage Improvement operation was conducted to helpensure that all persons were enumerated at their usualresidence. Search/ Match was designed to improve bothwithin household and whole household coverage. Theobjective of the quality assurance Search/ Match operationwas to improve the accuracy of the census counts byimplementing specialized procedures to ensure the enu-meration of individuals and households who otherwisemight have been enumerated incorrectly or omitted fromcensus counts. Clerks in the processing offices performedthe actual Search/ Match operation to compare personslisted on search forms to those listed on filmed question-naires. Those persons listed on search forms but not onfilmed questionnaires were transcribed to continuationquestionnaires. The Search/ Match operation was in progressfor approximately 32 weeks (June through December1990) in all processing offices.
A quality assurance plan was implemented for theSearch/ Match operation to determine and correct anysource(s) of errors and to obtain estimates of the quality ofthe search/ match process. The Search/ Match operationquality assurance plan was divided into six phases: 1)computer geocoding, 2) clerical geocoding, 3) browsingthe address control file to determine if the basic streetaddress existed on the address control file, 4) checking thesearch forms for which the basic street address was notfound on the address control file, 5) checking the addresscontrol file for the camera unit and frame number anddetermining if the correct number of search cases had
been printed on the Form D2107, Microfilm Access DevicePrint Request Form, and 6) determining if persons hadbeen properly transcribed from search forms to censusquestionnaires.
Search forms were sorted by two criteria: 1) form type(Individual Census Reports, Military Census Reports,Parolee/ Probationer Information Records, Shipboard Cen-sus Reports, Were You Counted forms, and census ques-tionnaires identified as Whole Household Usual HomeElsewhere), and 2) whether or not the forms were in theprocessing office area. Forms identified as being in theprocessing office area were sorted according to whether ornot they were geocoded. Search forms not geocoded weresorted by whether or not they had a searchable address.For more detailed description on the quality assurancespecifications for the Search/ Match operation, see [1].
Methodology—The quality assurance plan used a sampledependent verification scheme. Each phase of the qualityassurance plan had its own sample of forms to be verifiedwithin each batch. The computer geocoding and addresscontrol file phases used a 5-percent verification sample,the clerical geocoding, basic street address not found onthe address control file, and matching/ transcription used a10-percent sample, and the camera unit/ frame numberlook-up phase selected one search form per batch. A1-in-10 sample of all quality assurance Forms D-2112,Search/ Match Batch Control Record , received from theprocessing offices was selected for analysis. (See form inappendix B.) There were 175 records out of 10,641records deleted from the analysis because of unreconcil-able inconsistencies in the data.
Computer Geocoding—Ungeocoded search forms deter-mined to be within the processing office boundary weregrouped into batches of 50 by form type. If an ungeocodedsearch form address was searchable, it was computer orclerically geocoded. The computer geocoded forms wereverified by matching the geocode for that address to theaddress control file browse program.
Clerical Geocoding—Search forms not computer geo-coded were clerically geocoded using maps, block headerrecords, and other reference materials. Fifty forms werebatched together by form type and verified by matching thegeocode for that address to the reference materials.
Address Control File Browse—Once a search form wasgeocoded, clerks browsed the address control file todetermine if the basic street address existed on theaddress control file. If the search address was not found,
85EFFECTIVENESS OF QUALITY ASSURANCE

JOBNAME: No Job Name PAGE: 2 SESS: 43 OUTPUT: Thu Sep 16 14:03:14 1993 / pssw01/ disk2/ 90dec/ cphe/ 2/ chapter5
the processing offices sent a deliverability check card tothe appropriate post office. A batch of 50 geocoding formswere verified by checking whether or not the basic streetaddress existed on the address control file.
Basic Street Address Not Found on Address ControlFile—A deliverability check card was sent to the UnitedStates Postal Service including the search address forsearch forms which the basic street address was not foundon the address control file. The United States PostalService determined whether the search address is correct,incorrect, or deliverable. Batches of 50 geocoded formsthat did not have the basic street address found on theaddress control file were verified twice to confirm that thebasic street address was not found on the address controlfile.
Camera Unit/ Frame Number Lookup—Address identifica-tion numbers previously obtained in the address control filecheck and/ or geocode was used to look up the cameraunit and frame number. Form D-2107, Microfilm AccessDevice Print Request Form, was used to locate and print acopy of the appropriate questionnaire(s) requested. Abatch of 25 search forms were verified to ensure that thecorrect number of search cases were printed on the FormD-2107 print request form.
Matching/ Transcription—Clerks located the appropriatefilm reel(s) for the search address and matched the searchform to the corresponding filmed questionnaire(s). A batchof 50 forms were verified to ensure that persons on searchforms were either present on filmed questionnaires or hadbeen transcribed to a census questionnaire. If all namesmatched, processing on that search form stopped. If someor none of the search person names matched, the clerkstranscribed the nonmatched person(s) information to acensus questionnaire. These transcribed questionnaireswere then sent to data capture. The six phases of theoperation were merged to form four phases that will bediscussed in these results. The four phases are: 1) Geoc-oding, 2) Address control file browse, 3) Camera unit/ framenumber lookup, and 4) Matching/ transcription. See Defini-tion of Error Type Codes, below, for error types discussedin each phase of the operation.
Definition of Error Type Codes
Codes Definition
A Incorrect geocodeB Not geocoded when it should be
C Incorrect address match
D Exact address not found when matching address presentif found on the address control file
E Basic street address not found when basic streetaddress present on address control file
F Identification or population count incorrectly transcribed
G Correct address match but camera unit/ frame numberincorrectly selected
H Persons incorrectly transcribed
I Persons not transcribed when they should have been
Limitations—The reliability of the analysis and conclu-sions for the quality assurance plan depends on thefollowing:
• Accuracy of the clerical recording of quality assurancedata.
• Accuracy of keying the quality assurance data into thedatabase file.
• Proper implementation of the procedures.
• Missing data caused by illegible and/ or incompletedentries on quality assurance recordkeeping forms.
• No data were received from the Kansas City ProcessingOffice. Hence, no results for the Kansas City ProcessingOffice are presented.
• The number of items verified for one or more phaseswere sometimes less than the number of items in erroracross error types for that phase. Because of theseinconsistencies, 175 records out of 10,641 were deletedfrom the file. The data were not reweighted to compen-sate for the deletions.
• Standard errors were calculated assuming simple ran-dom sampling.
Results—
Operational Results—During the implementation of thequality assurance operation, observers from Headquartersvisiting the processing offices discovered that procedureswere not being followed correctly. For example, oversam-pling existed; the random number tables used to determinethe sample were sometimes used improperly or not at all;timely feedback which is essential to improving quality wasnot given; verifiers were not rotated; and inconsistencieswere detected in the recorded data.
Batch Origin—
Erroneous Data—The Forms D-2112 were not alwayscompleted correctly and/ or entirely. Batches were assignedincorrect error type codes. Batch origin ‘‘G’’; that is,‘‘already geocoded in the district offices,’’ forms wereinadvertently given error type codes which should only beassigned to forms that needed to be geocoded. Batchorigin ‘‘G’’ forms were supposed to go directly to theaddress control file browse phase of the operation.
After analyzing the data, it was discovered that theclerks/ verifiers recorded batch origin ‘‘G’’ errors undererror types A (incorrectly geocoded) and error type B (notgeocoded when it should have been) by mistake. Therewere 337 (16.9 percent) type A errors and 271 (11.2percent) type B errors for batches that entered the pro-cessing offices as already geocoded in the district officesbut were sent to geocoding.
86 EFFECTIVENESS OF QUALITY ASSURANCE

JOBNAME: No Job Name PAGE: 3 SESS: 43 OUTPUT: Thu Sep 16 14:03:14 1993 / pssw01/ disk2/ 90dec/ cphe/ 2/ chapter5
Batch Origin Categories—Table 5.1 shows four batchorigin categories and they are: 1) geocoded in districtoffice, 2) not geocoded, 3) split for clerical geocoding, and4) United States Postal Service check. A ‘‘missing dataitems’’ column was added to this table to reveal thevolume of missing data items in the batch origin catego-ries. There was a large volume of missing data due toillegible and/ or incomplete entries on the quality assur-ance recordkeeping forms. The estimated rate of missingdata was 43.8 percent from all four phases discussed inthis report.
Table 5.1 reveals the ‘‘not geocoded’’ category had themost batches. The Jacksonville Processing Office had themajority of the batches in all categories. The San DiegoProcessing Office had the most batches with missing dataand the Albany Processing Office had the least amount.The Baltimore Processing Office had the least amount ofbatches in categories ‘‘geocoded in district office,’’ ‘‘notgeocoded,’’ and ‘‘United States Postal Service check.’’The San Diego Processing Office had the least amount forthe category ‘‘split for clerical geocoding.’’
Geocoding—There were 38,424 geocoding items verified.The overall estimated error rates for ‘‘incorrect geocode’’(A) was 2.62 percent (standard error was 0.08 percent)and for ‘‘not geocoding when it should have been’’ (B) was3.71 percent (standard error was 0.10 percent).
Table 5.2 shows the Albany Processing Office had thelargest percentage of type A sample errors (9.63 percent)for geocoding done incorrectly, and type B sample errors(9.10 percent) for geocoding not being done when it shouldhave been. There was a statistical difference found withboth types A and B errors in the Albany Processing Officewhen compared to the other processing offices at the .10level of significance. Although the Jacksonville ProcessingOffice reported the smallest sample percentage of errorsfor both type A and B errors with 1.38 and 1.46 percent,respectively, there was no significant difference whencompared to the other processing offices. Jacksonvillealso had the largest number of items to be verified(13,809). This could be attributed to the fact that the
Jacksonville Processing Office oversampled during theoperation, reportedly because their clerks’ error rates weretoo high.
Address Control File Browse—There were 28,650 addresscontrol file browse check items verified. The overall esti-mated error rates for ‘‘incorrect address match’’ was 0.62percent (standard error was 0.05 percent), for ‘‘exactaddress not found when matching address present isfound on the address control file’’ was 1.58 percent(standard error was 0.07 percent), and for basic streetaddress not found when found present on the ‘‘addresscontrol file’’ was 1.04 percent (standard error was 0.06percent).
Table 5.3 shows the Jacksonville Processing Office hadthe largest number of items verified (12,057). Oversam-pling may have been a contributing factor. The Jackson-ville Processing Office had the smallest percentage ofsample errors for types D (0.74 percent) and E (0.27percent). However, there was not a statistically significantdifference when comparing these error rates to the otherprocessing office’s error rates. The Jeffersonville Process-ing Office had the highest percentage of type C errors(1.52 percent) for ‘‘incorrect address match.’’ This wasstatistically significant when compared to the other pro-cessing offices at the .10 level of significance. The Albany
Table 5.1. Number of Batches That Were Geocodedin District Office; Not Geocoded; Split forClerical Geocoding; United States PostalService Check; and Missing Data Items
Processingoffice
Geo-coded in
districtoffice
Not geo-coded
Split forclerical
geo-coding
UnitedStatesPostal
Servicecheck
Missingdata
items
Baltimore . . . . 16 283 43 0 288Jacksonville . . 627 1,902 261 97 167San Diego . . . 288 1,538 38 18 1,226Jeffersonville . 323 777 153 1 451Austin . . . . . . . 271 552 99 14 163Albany. . . . . . . 163 331 77 3 281
Total . . . . 1,688 5,383 671 133 2,576
Table 5.2. Number of Items Verified, EstimatedSample Error Rates and Standard Errorsby Processing Office
Processingoffice Number
of itemsverified
Percentof
verified Type AStandard
error
Percentof errortype B
Standarderror
Baltimore . . . . 4,644 1.44 .18 2.58 .16Jacksonville . . 13,809 1.38 .10 1.46 .05San Diego . . . 9,468 2.97 .17 5.98 .14Jeffersonville . 3,975 1.81 .21 3.25 .09Austin . . . . . . . 2,947 1.76 .24 2.85 .08Albany. . . . . . . 3,581 9.63 .49 9.10 .46
Total . . . . 38,424 2.62 .08 3.71 .10
Table 5.3. Number of Items Verified, EstimatedSample Error Rates for Error Type, andStandard Errors by Processing Office
Processingoffice Number
itemsverified
Per-cent
oferror
type C
Stan-darderror
Per-cent
oferror
type D
Stan-darderror
Per-cent
oferror
type E
Stan-darderror
Baltimore . . . 3,227 0.31 .10 2.17 .26 0.81 .16Jacksonville . 12,057 0.55 .07 0.74 .08 0.27 .05San Diego . . 4,704 0.30 .08 2.17 .21 1.02 .15Jefferson-ville . . . . . . . 4,146 1.52 .19 1.37 .18 0.75 .13
Austin . . . . . . 2,876 0.56 .14 0.80 .17 0.52 .13Albany. . . . . . 1,640 0.61 .19 6.89 .63 8.90 .70
Total . . . 28,650 0.62 .05 1.58 .07 1.04 .06
87EFFECTIVENESS OF QUALITY ASSURANCE

JOBNAME: No Job Name PAGE: 4 SESS: 41 OUTPUT: Thu Sep 16 14:03:14 1993 / pssw01/ disk2/ 90dec/ cphe/ 2/ chapter5
Processing Office had the highest percentage of type Dsample errors (6.89 percent) for ‘‘exact address not foundwhen matching address present on address control filebrowse’’ and the highest percent of type E sample errors(8.90 percent) for ‘‘basic street address was not foundwhen basic street address was present on address controlfile.’’ There was a statistical difference for both type D andE errors when comparing the Albany Processing Office toother processing offices at the .10 level of significance.
Camera Unit/ Frame Number Lookup—As shown in table5.4, there were 31,590 camera unit/ frame number lookupitems verified. The overall estimated error rate for ‘‘identi-fication or population count incorrectly transcribed’’ was0.48 percent (standard error was 0.04 percent) and for‘‘correct address match but camera unit/ frame numberincorrectly selected’’ it was 1.05 percent (standard errorwas 0.06 percent).
There were no statistically significant differences amongthe six processing offices at the .10 level of significance foreither type F or G sample errors. The San Diego Process-ing Office had the largest number of items verified (11,415),and the highest percentage of type G sample errors (1.85percent) for correct address match but camera unit/ framenumber incorrectly selected. The Baltimore ProcessingOffice had the smallest percentage of type G sampleerrors (0.16 percent). The Jacksonville Processing Officehad the highest percentage of type F sample errors (0.81percent) for identification or population count incorrectlytranscribed while the Albany Processing Office had thesmallest percentage (0 percent). Albany did not report anytype F errors in the sampled data analyzed.
Matching/ Transcription—The number of type H errorsrepresent the number of persons incorrectly transcribedfrom a search/ match form to a Census questionnaire. Theestimated number of type H errors in the Search/ Matchoperation was 45,800. This number is an estimate of thepossible erroneous enumerations that the Search/ Matchoperation contributed to the census count from transcrip-tion errors. At the 90-percent confidence level, it is esti-mated that between 42,602 and 48,740 people werepossibly erroneously enumerated by the census due to thefailure of the Search/ Match operation to recognize thatthey should not have been added.
The type I errors represent the number of persons nottranscribed to census questionnaires when they shouldhave been. The estimated number of type I errors in theSearch/ Match operation was 30,500. This number is anestimate of the possible missed persons that the Search/ Matchoperation contributed inadvertently to leaving out of thecensus count. At the 90-percent confidence level, it isestimated that between 27,939 and 32,956 people werepossibly missed by the census due to the failure of theSearch/ Match operation to add them.
As shown in table 5.5, there were 42,288 matching/ trans-cription items verified. The overall estimated error rates for‘‘persons incorrectly transcribed’’ was 0.95 percent (stan-dard error was 0.04 percent) and for ’’persons not tran-scribed when they should have been‘‘ was 0.63 percent(standard error was 0.04 percent).
The Jacksonville Processing Office had the largestnumber of items verified (13,852), and the highest percent-age of sample errors for error types H and I with 1.19 and0.92 percent, respectively. The Baltimore Processing Officehad the smallest percentage of type H and I sample errorswith 0.67 and 0.19 percent, respectively. However, none ofthese differences were statistically significant.
Conclusions —The processing offices did not implementthe quality assurance plan as specified. Procedures werenot always followed as planned causing the followingproblems to occur: 1) oversampling, 2) random numbertables not being used or used incorrectly, 3) no timelyfeedback, 4) no rotation of verifiers, and 5) quality assur-ance recordkeeping forms were not completed correctlyand/ or entirely. These problems caused some processingoffices to have: 1) more forms in sample than requestedand more than the other processing offices, 2) the wrongform selected in sample, 3) clerks being unaware of theirperformance, 4) all clerks not having the opportunity toqualify as verifiers, and 5) incorrect and missing data.
A probable reason for the above problems is that in thebeginning of the operation, the processing offices wereoverloaded with search/ match forms. The Census Bureauhad not anticipated the large volume of search/ match, sothe processing offices were not prepared staff-wise tohandle the large workloads. The new hires were not beingtrained properly and had to learn the procedures as they
Table 5.4. Number of Items Verified, the EstimatedSample Error Rates, and the StandardErrors by Processing Office
Processingoffice
Numberitems
verified
Percentof errortype F
Standarderror
Percentof errortype G
Standarderror
Baltimore . . . . 7,548 0.05 .03 0.16 .05Jacksonville . . 8,652 0.81 .10 0.81 .10San Diego . . . 11,415 0.60 .07 1.85 .13Jeffersonville . 1,436 0.21 .12 1.32 .30Austin . . . . . . . 1,171 0.68 .24 1.37 .34Albany. . . . . . . 1,368 0 0 0.22 .13
Total . . . . 31,590 0.48 .04 1.05 .06
Table 5.5. Number of Items Verified, the EstimatedSample Error Rates and the StandardErrors by Processing Office
Processingoffice
Numberitems
verified
Percentof errortype H
Standarderror
Percentof error
type IStandard
error
Baltimore . . . . 5,710 0.67 .11 0.19 .06Jacksonville . . 13,852 1.19 .09 0.92 .08San Diego . . . 9,766 0.72 .09 0.60 .08Jeffersonville . 8,287 1.00 .11 0.58 .08Austin . . . . . . . 7,484 1.03 .12 0.48 .08Albany. . . . . . . 3,189 0.78 .16 0.75 .15
Total . . . . 42,288 1.08 .04 0.72 .04
88 EFFECTIVENESS OF QUALITY ASSURANCE

JOBNAME: No Job Name PAGE: 5 SESS: 45 OUTPUT: Thu Sep 16 14:03:14 1993 / pssw01/ disk2/ 90dec/ cphe/ 2/ chapter5
were implementing the process. As the operation contin-ued and the newly hired staff became more familiar withthe operation, the workloads became less cumbersome.
The volume of missing data was so great for thisoperation; for example, 35,540 missing error type entriesout of 81,204 entries in sample, that it caused manylimitations on how the data collected could be analyzed.The accuracy of the analysis depended on the availabledata.
The purpose of the quality assurance plan was todetermine and correct the source(s) of errors and to obtainestimates of the quality of the various search/ matchprocesses in the processing offices. This purpose wasachieved in that the quality assurance plan helped identifythe sources of errors within each phase of the operation bysorting forms into batches according to form type andforwarding the forms to the appropriate phase of theoperation for verification purposes. After verification, cor-rections were made and any errors detected were notedon the quality assurance forms where further analysis wasperformed to determine the estimates of the quality ofeach phase of the operation. Because the quality assur-ance Search/ Match operation was implemented for thefirst time during the 1990 decennial census, there are noavailable data from the 1980 decennial census with whichto compare the 1990 figures.
The implementation of the quality assurance plan wasnot as good as expected. This was because of the largevolume of missing data, the inconsistencies in the record-ing of data, and the incorrect entries assigned under thebatch origin ‘‘G’’ code; that is, ‘‘form already geocoded inthe district offices.’’ The quality assurance plan did nothave as much impact as anticipated because the process-ing offices failed to fully follow procedures. This causedinconsistencies in the way the processing offices imple-mented the operation. However, it should be noted thatthis was a complex plan which may have been difficult toimplement.
When comparing processing offices for the Search/ Matchoperation, at the .10 percent significance level, there wasa statistical difference among the six processing offices forerror types A, B, C, D, and E, and there was no significantdifference among the six processing offices for error typesF, G, H, and I.
Even though the quality assurance Search/ Match oper-ation had inconsistencies in the data, missing data, andincompletely followed procedures, the quality assuranceplan was a vital tool for improving the quality of theoperation and increasing productivity.
For future similar operations, the following are recom-mended:
• Provide training in the processing offices that allows allunits involved in the Search/ Match operation to under-stand the flow of the process and the purpose of eachphase. Include all shifts; that is, day and night shifts, inthe training.
• Incorporate into the training session(s) more illustrationsof how to complete the quality assurance recordkeepingform. Stress the importance of this form being com-pleted correctly, legibly, and completely. This will reducethe amount of missing data, and illegible and incorrectentries on the quality assurance forms.
• Stress the importance of timely feedback (positive andnegative) to ensure that all employees are implementingthe procedures consistently, and to identify employeeswho may need further training.
• Procedures should be understandable and easy to fol-low, after which the procedures should be followed aswritten unless otherwise instructed from headquarters toalter them. This will eliminate problems encounteredduring the implementation of the process.
• Assuming that more than one type of search/ matchform will be investigated for future quality assurancesearch/ match processes, a revision to the quality assur-ance search/ match recordkeeping form needs to beimplemented to capture form types for all search/ matchforms being inspected. This will allow for further analysisby search/ match form type.
• Have contingency plans in place should workload exceedestimate.
• Include operation as test objective during 2000 censusplanning.
References—
[1] Williams, Eric, STSD 1990 Decennial Census Memo-randum Series # B-56, Revision # 2, ‘‘Quality AssuranceSpecifications for the Search/ Match Operation-Revision.’’U.S. Department of Commerce, Bureau of the Census.June 1990.
[2] Steele, LaTanya F., DSSD 1990 Decennial CensusMemorandum Series # T-29, ‘‘Summary of Quality Assur-ance Results for the Search/ Match Operation for the 1990Decennial Census.’’ U.S. Department of Commerce, Bureauof the Census. September 1993.
QUALITY ASSURANCE TECHNICIAN PROGRAM
Regional Census Centers
Introduction and Background—During the data collec-tion phase of the census, 449 district field offices wereestablished to implement a variety of census collectionactivities in the field. Each district office reported to one of13 regional census centers. The regional census centersprovided general administrative and technical support aswell as monitored the general progress and proper imple-mentation of the programs in their specific region.
To help meet the quality assurance objective for the1990 census, the Regional Census Centers Quality Assur-ance Technician Program was developed and implementedin the field. From approximately February 1 to August 31,
89EFFECTIVENESS OF QUALITY ASSURANCE

JOBNAME: No Job Name PAGE: 6 SESS: 46 OUTPUT: Thu Sep 16 14:03:14 1993 / pssw01/ disk2/ 90dec/ cphe/ 2/ chapter5
1990, one person in each of the 13 regional censuscenters monitored quality assurance requirements. Sevenfield operations were monitored, in the areas of fieldenumeration, office processing, and falsification detection.The field enumeration operations monitored were List/Enumerate (both advance listing and listing phases), Update/Leave, and Urban Update/ Leave. (See glossary for defini-tions.)
The office processing operations monitored were Cler-ical Edit and Collection Control File Keying. The falsifica-tion detection operations monitored were List/ EnumerateReinterview and Nonresponse Followup Reinterview.
The objectives of the Regional Census Centers QualityAssurance Technician program was to promote manage-ment awareness of the purpose and importance of thevarious quality programs and to monitor the adherence tothe quality assurance procedures. This section will provideinformation on the design and performance of the RegionalCensus Centers Quality Assurance Technician Program aswell recommend changes to improve the program infurther censuses.
Methodology—To meet the first objective, the RegionalCensus Centers Quality Assurance Technician was toparticipate in management meetings at the regional cen-sus centers level and act as a consultant to managementfor matters related to quality assurance. The technicianassisted in explaining the importance, philosophy, pur-pose, and results of the quality assurance program. Also,this person was expected to be the primary contact forregional census centers and district offices managementfor explanations concerning the rationale for specific qual-ity assurance procedures.
To meet the second objective, three distinct methodol-ogies were developed for use by the technician in moni-toring compliance to the quality assurance requirementsby the district office: administrative analysis, independentinvestigation, and personal observation.
The administrative analysis technique’s basic approachwas to review reports from the management informationsystem and quality assurance summary reports suppliedby the district offices. For each quality assurance require-ment, a specific statistic (such as production rate, errorrate, staffing estimate, average expenditure level, etc.) wasreviewed. The statistics were chosen based on severalfactors, including availability of data at the district officetotal summary level, correlation between the managementinformation system data and the level of performance ofthe quality assurance requirement, and computationalefficiency. For each statistic, a numerical computationprocedure was devised to measure the level of adherenceto the quality assurance requirement for the district officeas a whole. Guidelines were provided, based upon numerictolerances, to determine if regional and district officemanagement staffs were to be notified of the apparentinconsistencies.
The independent investigations allowed the techniciansthe freedom to initiate their own analyses, using whatever
data was available, to confirm suspicions concerning poten-tial quality assurance problems, to answer questions posedby management, or to check operations of interest.
The personal observation technique was useful in pro-viding the technician with information and insights into theconduct of operations and quality assurance procedures.However, the physical distance between district officesand the number of operations minimized the effectivenessof this technique. (See [1] for additional information.)
Limitations—The reliability of many estimates dependedon the quality of the data entered on the monitoring forms.
Results—The data obtained by the weekly administrativeanalysis suggested that 12 of 13 regions performed somelevel of monitoring. Within the 12, only about 30 percent ofeach requirement was monitored as expected.
The Urban Update/ Leave operation experienced thehighest overall monitoring coverage rate, 63.12 percent,for the four regional census centers performing this oper-ation. This high coverage rate may be due to the shortduration of the operation and to fewer quality assurancerequirements, thus requiring less time for monitoring anddocumentation.
No other field operation experienced an overall cover-age rate of administrative analysis in excess of 50 percent.The List/ Enumerate operation experienced the lowestcoverage rate over all applicable regional census centers,22.07 percent. Two possible explanations exist for this lowcoverage rate: first, there is no record the quality assur-ance requirements were monitored in 3 of the 10 regionsperforming the List/ Enumerate operation; second, the latestart of List/ Enumerate and the longer than expectedduration of the operation due to bad weather in someregions may have contributed to truncation of the qualityassurance monitoring.
The Collection Control File Keying operation experi-enced the second lowest overall coverage rate of theseven operations, at 22.58 percent. The major factor in thelow Collection Control File Keying coverage rate was thatthe records show only five of the thirteen regions per-formed any administrative analysis. This may have beendue to a lack of forwarding of automated quality assuranceresults data from the district offices to the regional censuscenters. During planning, a major concern was how wellthe technicians would implement the analysis procedures.The data from reviewing the quality assurance monitoringrecords suggest that the technicians had varying levels ofdifficulties. The analysis procedure error rate range from20 to 38 percent for each quality assurance requirementmonitored.
There were several barriers the technicians found whentrying to implement the administrative analysis procedures.For several field operations, including Clerical Edit andCollection Control File Keying, the management informa-tion system data for the training requirement were notavailable. The management information system presenteddata for training and production combined for each of
90 EFFECTIVENESS OF QUALITY ASSURANCE

JOBNAME: No Job Name PAGE: 7 SESS: 46 OUTPUT: Thu Sep 16 14:03:14 1993 / pssw01/ disk2/ 90dec/ cphe/ 2/ chapter5
these operations. Another barrier was that quality assur-ance data, produced by the district offices and required forseveral administrative analysis procedures, were not for-warded to the technicians consistently by all district offices.Other quality assurance data, especially data necessaryfor the computation of lag times for the reinterview oper-ations, were not computed correctly by some districtoffices, and were omitted altogether by other districtoffices.
The technicians discovered numerous instances in whichproduction data were entered into the management infor-mation system using incorrect operation codes. Thus, thedata were accumulated and attributed to the wrong oper-ations, making administrative analysis difficult. Almost unan-imously, the technicians encountered management infor-mation system data that were behind actual productionlevels in the district offices, as confirmed by them fromindependent data sources. Budgeted cost data for List/Enumerate training included production incentive bonusesfor enumerators who remained on the job throughout theduration of the List/ Enumerate operation. However, thesebonuses were not paid nor their actual costs entered intothe management information system until the List/ Enumerateoperation was completed; and then these actual costswere attributed to production, rather than to training.
The data suggest that the technician program waseffective in detecting district offices having difficultiesusing the quality assurance procedures despite the prob-lems discussed above. (See [2] through [11] for additionalinformation.)
Conclusions —The Regional Census Centers QualityAssurance Technician Program accomplished all three of itobjectives in general. The implementation of the qualityassurance program within the district offices was moni-tored, problems were identified, and referred to regionalcensus center and district office management for resolu-tion.
Through the validation and referral process for potentialproblems, the technicians assisted the field offices in thecorrect preparation, interpretation, and use of quality assur-ance and management information system data. In addi-tion, technician program provided headquarters with dataon the level of implementation of quality assurance require-ments for field operations while those operations wereactive, a timeliness never before attained.
The quality assurance monitoring workload required afull-time position in each regional census center. However,due to budget constraints, most regions allocated a part-time person to this position. To increase the effectivenessof this program for future censuses, it is recommended thateach regional census center staffs one full-time equivalentperson in this position.
Communication between the technicians and qualityassurance analysts at headquarters was hampered by thelack of direct communication links. All communication
between them was channeled through an intermediarygroup, reducing the timeliness and effectiveness of com-munication. Increased use of voice and electronic mail,database sharing, and hard copy media would increase theeffectiveness, efficiency, timeliness, and responsivenessof monitoring.
During the course of quality assurance monitoring, thetechnicians discovered several anomalies with the man-agement information system. Several recommendationswere made.
• Expanding the operational category codes on the data-base would allow for full separation of training, produc-tion, and quality assurance data for all field operations.
• Enhance training for users of the management informa-tion system data and include more persons into thetraining. This will help field personnel, data entry clerks,supervisors, and data users to understand the structureof the category code system, which might reduce mis-classification errors.
• Investigate the causes of delays in the incorporation ofdata into the database, in order to improve the timeli-ness of the system.
The regional census center technicians experiencedsome difficulties in implementing the analysis procedures.It is recommended that the persons selected to fill thepositions be identified earlier in the census cycle and berequired to have statistical training. This will provide theneeded level of technical expertise to the position, and willallow for enhanced training.
Include practice exercises using the administrative anal-ysis procedures with live or simulated management infor-mation system data in the training. Administrative analysisprocedures would be enhanced by the inclusion of exam-ples reinforcing the specific decision criteria, and by reword-ing the procedure text to eliminate any confusion that mayhave contributed to procedural misinterpretation. This willresult in an enhanced set of tools for the technicians to usein their monitoring of quality assurance compliance.
The administrative analysis techniques used in the 1990census by the technicians were time consuming, prone toerror, and cumbersome because of the reliance on hardcopy documentation. It is recommended that the entiremonitoring process be automated as much as possible.Most of the input data for monitoring was provided by themanagement information system. Automating the compi-lation of data for each district office within a regionalcensus center and automating the computation of analysisdecisions could be possible. This should result in a moreeffective and efficient monitoring process. It would providemore time for the technicians to perform special investiga-tions of quality assurance data and for consultation withregional and district office management on quality assur-ance matters.
91EFFECTIVENESS OF QUALITY ASSURANCE
JOBNAME: No Job Name PAGE: 8 SESS: 49 OUTPUT: Thu Sep 16 14:03:14 1993 / pssw01/ disk2/ 90dec/ cphe/ 2/ chapter5
References—
Regional Census Centers Quality Assurance TechnicianProcedure Manual—
[1] Peregoy, Robert A., STSD 1990 Decennial CensusMemorandum Series # II-3, ‘‘The RCC QA Tech Proce-dure Manual.’’ U.S. Department of Commerce, Bureau ofthe Census. April 1990.
[2] Easton, Cindy and Hay, Carolyn, 1990 DecennialCensus Informational Memorandum # 104, ‘‘Clerical EditOperation.’’ U.S. Department of Commerce, Bureau of theCensus. February 1989.
[3] Huggins, James, 1990 Decennial Census InformationMemorandum No. 106, ‘‘1990 Collection Control File Key-ing Operation.’’ U.S. Department of Commerce, Bureau ofthe Census. March 1989.
[4] Huggins, James, 1990 Decennial Census InformationMemorandum No. 105, addendum 1, ‘‘List/ EnumerateReinterview Operation.’’ U.S. Department of Commerce,Bureau of the Census. April 1989.
[5] Huggins, James, STSD 1990 Decennial Census Mem-orandum No. 105, addendum 1, ‘‘The Nonresponse Fol-lowup Reinterview Operation.’’ U.S. Department of Com-merce, Bureau of the Census. May 1989.
[6] Aponte, Maribel, STSD 1990 Decennial Census Mem-orandum Series # GG-14, ‘‘The List/ Enumerate Opera-tion.’’ U.S. Department of Commerce, Bureau of the Cen-sus. November 1988
[7] Aponte, Maribel, STSD 1990 Decennial Census Mem-orandum Series # GG-2, ‘‘The Update/ Leave Operation.’’U.S. Department of Commerce, Bureau of the Census.August 1988
[8] Aponte, Maribel, STSD 1990 Decennial Census Mem-orandum Series # GG-8, ‘‘The Urban Update/ Leave Oper-ation.’’ U.S. Department of Commerce, Bureau of theCensus. October 1988
[9] Kurdeman, Kent, STSD 1990 Decennial Census Mem-orandum Series # GG-18, ‘‘The Clerical Edit Operation.’’U.S. Department of Commerce, Bureau of the Census.November 1988.
[10] Merritt, Kenneth, STSD 1990 Decennial Census Mem-orandum Series # GG-18, ‘‘The Collection Control FileKeying Operation.’’ U.S. Department of Commerce, Bureauof the Census. October 1988.
[11] Williams, Dennis, STSD 1990 Decennial Census Mem-orandum Series # GG-3, revision 1, ‘‘The List/ EnumerateReinterview Operation.’’ U.S. Department of Commerce,Bureau of the Census. July 1989.
Processing Offices
Introduction and Background—During the data process-ing phase of the census, seven processing offices wereestablished to implement a variety of activities to preparecensus data for computer processing and tabulation. Pro-cessing offices were located in Albany, New York; KansasCity, Missouri; Jeffersonville, Indiana; Austin, Texas; Jack-sonville, Florida; Baltimore, Maryland; and San Diego,California. Each office, for the most part, performed similaractivities. The type of operations performed were checkingin census questionnaires; filling in control information oncensus questionnaires needed for microfilming; actualmicrofilming and data keying of questionnaires; editing andconducting telephone tasks to assist respondent and tofollow-up on missing census data on questionnaires. Inaddition, other administrative and work flow operationswere implemented to support the main operations.
For most of these operations, there was a formal qualityassurance plan to help measure the quality performance ofthe operation as well as provide information on the typeand source of errors to improve performance.
To help meet the quality assurance objective, theProcessing Office Quality Assurance Technician Programwas developed and implemented in the processing offices.From approximately April 1990 to February 1991, oneperson monitored quality assurance requirements in eachprocessing office except for Jacksonville, Florida, whereno full-time technician was assigned. There, quality assur-ance analysts from headquarters performed the qualityassurance technician’s functions on a rotating basis.
The objectives of the Processing Offices Quality Assur-ance Technician Program were to promote managementawareness of the purpose and importance of the variousquality assurance programs and to monitor the adherenceto the quality assurance procedures.
Methodology—To meet the first objective, the ProcessingOffice Quality Assurance Technician was to participate inmanagement meetings at the processing office and act asa consultant to management for matters related to qualityassurance. The technician assisted in explaining the impor-tance, philosophy, purpose, and any results of the qualityassurance program. Also, this person was expected to bethe primary contact for the processing office managementfor explanations concerning the rationale for specific qual-ity assurance procedures.
To meet the second objective, three methodologieswere developed for use by the technician in monitoringcompliance to the quality assurance requirements in theprocessing office: administrative analysis, independentinvestigation, and personal observation.
The administrative analysis technique’s basic approachwas the review of management status and progress reportsand quality assurance summary reports to identify potentialoperational difficulties.
The independent investigations allowed the techniciansthe freedom to initiate their own analyses, using whatever
92 EFFECTIVENESS OF QUALITY ASSURANCE

JOBNAME: No Job Name PAGE: 9 SESS: 49 OUTPUT: Thu Sep 16 14:03:14 1993 / pssw01/ disk2/ 90dec/ cphe/ 2/ chapter5
data was available, to confirm suspicions concerning poten-tial quality assurance problems, to answer questions posedby management, or to check operations of interest.
The personal observation technique was useful in pro-viding the technician with information and insights into theconduct of operations and quality assurance procedures.The quality assurance technician was expected to observeeach processing unit frequently, especially during trainingand start-up of an operation.
Limitation—Most of the information in this report is basedon oral as well as documented reports from the qualityassurance technicians. However, many observations wereconfirmed from the problem referrals generated by theprocessing office management.
Results—From the quality assurance technicians’ prospec-tive, the Processing Office Quality Assurance Program wassuccessful in monitoring the operations’ compliance ofquality assurance requirements. Factors that contributedto this perception were the close relationship that devel-oped between the quality assurance technician and Qual-ity Assurance Section Chief in the processing offices; thequality assurance technicians’ unrestricted freedom andaccess to operations and information in the processingoffice; the support and understanding of upper manage-ment of the quality assurance technicians’ responsibilities;and the simple presence and independence of the qualityassurance technician at the processing office was a con-stant reminder that the quality assurance plans wereimportant and an integral part of data processing. Eachquality assurance technician encountered different experi-ences during their assignment and below are some high-lights of their observations related to the operations’performance and the quality assurance programs.
1. The automated record keeping system, designed toprovide and summarize quality and production data onthe various quality assurance operations, was a valu-able tool. It helped supervisors identify problems andimprove performance, despite the initial operational andsoftware problems.
2. Rotation of personnel between verification and pro-duction was a quality requirement intended to break-down barriers within the operational unit and to elimi-nate backlog. However, the implementation was notfully explained until late into the process. Some oper-ations rotated by row or by day of the week. Therotation concept was not supported for some opera-tions.
3. There was initial confusion on whether the qualityassurance technicians were to be involved in thekeying operations. All keying operations were beingmonitored from headquarters. However, Jeffersonvillekeying quality was significantly lower than for the otherprocessing offices. The quality assurance technician
was asked by the processing office manager to lookinto the reasons for the high batch failure rates for oneof the keying operations. The quality assurance tech-nician concluded the factors that contributed were:
• For rejected work units, only errors identified in thesample were repaired and there was no reveiw ofthe entire batch for errors. This process was intendedto give the keyers additional information on thetype and reason for their mistakes, as well ascorrecting the batches of all errors.
• Failure of the keying management to use any of thequality control reports;
• Lack of communication between headquarters andprocessing office on the quality assurance plan forkeying.
In late August, the Quality Assurance Unit chief andthe decennial keying supervisor went to the KansasCity Processing Office to observe their keying opera-tions. They were favorably impressed. After that visitthe keying supervisor implemented the use of qualitycircles and began a new emphasis on quality as wellas production. The keying quality began to improvesteadily from that point and the relationship betweenthe quality assurance unit and keying managementstaff became more agreeable.
4. Quality Assurance technicians spent a fair amount oftime providing reasons for quality assurance and explain-ing that the documentation was not to identify blame,but an attempt to improve the overall process and thecensus as a whole.
5. Most of the operations’ quality assurance require-ments were implemented very well. However, severaloperations experienced difficulties. A couple of oper-ations had difficulty qualifying clerks due to lack ofavailability of test desks. Telephone operations hadproblems sufficiently monitoring telephone calls, partlydue to the unexpected volume of telephone calls.Another problem for some operations were due to thecomplexity of the quality assurance procedures. Therewas resistance to the use of quality circles due to lackof management being convinced of the benefits ver-sus the impact on production.
Many of the quality assurance technicians had initialconcerns about being accepted by the processing officestaff and about not having extensive processing or qualityassurance experience. The fear of being an outsider waseliminated for the most part because the processingoffice’s management treated them as part of the team. Thequality assurance technician, in exchange, kept the man-agement staff informed of problems and tried to addressall problems first at the processing office level before theywere formally documented and sent to headquarters.
93EFFECTIVENESS OF QUALITY ASSURANCE

JOBNAME: No Job Name PAGE: 10 SESS: 52 OUTPUT: Thu Sep 16 14:03:14 1993 / pssw01/ disk2/ 90dec/ cphe/ 2/ chapter5
The recruitment and training of the quality assurancetechnicians were not implemented as planned. Initially, allquality assurance technicians were to be hired from out-side the Census Bureau on a temporary appointment. Theywere to be hired to help monitor the printing of censusquestionnaires prior to being assigned to the processingoffices. Their qualifications were to include significanttraining in statistics. Both of these requirements presentedbarriers for recruitment. The results were that only sixquality assurance technicians of the seven needed wereeventually placed. Only two were hired from outside theBureau and four were reassigned from other areas of theCensus Bureau. No quality assurance technician wasassigned to the Jacksonville Processing Office. For thisoffice, headquarters’ analysts rotated to perform the qual-ity assurance technician duties.
Conclusions—In general, the Processing Office QualityAssurance Technician Program accomplished all three ofit’s objectives. The implementation of the quality assur-ance programs within the processing offices was moni-tored, problems were identified, and referred to the pro-cessing offices management for resolution.
The quality assurance technicians felt that most of thequality assurance requirements were implemented prop-erly. However, most of the quality assurance requirementsthat caused difficulties could have been minimized byclarification of procedures, enhanced training of supervi-sors on procedures and record keeping, and a consensusof agreement between processing offices and headquar-ters management on such quality concepts as rotation ofpersonnel, use of quality circles, feedback, qualification ofworkers, and administrative action.
The quality assurance technicians felt that the auto-mated record keeping system was a valuable tool formonitoring the operation and helped the supervisors toprovide feedback. Efforts should continue to expand andrefine both the software and analysis techniques to assistin isolating potential processing problems.
There were difficulties in filling the quality assurancetechnician position with qualified people on a temporarybasis. Administrative ways should be developed to attractthe necessary applicants if technicians are used in thefuture. It is imperative that such analysts are hired early toassist in the planning process to enable them to be trainedthoroughly prior to being assigned to the processingoffices.
References—
[1] Boniface, Christopher J., Preliminary Research andEvaluation Memorandum No. 107, ‘‘1990 Decennial Cen-sus: Quality Assurance Results of the Edit Review—Questionnaire Markup Operation.’’ U.S. Department ofCommerce, Bureau of the Census. December 1991.
[2] Steele, LaTanya F., Preliminary Research and Evalua-tion Memorandum No. 117, ‘‘Summary of Quality Assur-ance Results for the Telephone Followup Operaton Con-ducted Out of the Processing Offices.’’ U.S. Department ofCommerce, Bureau of the Census. January 1992.
[3] Steele, LaTanya F., Preliminary Research and Evalua-tion Memorandum No. 172, ‘‘Summary of Quality Assur-ance Results for the Procedural Change ImplementationProcess for the 1990 Decennial Census. ’’ U.S. Depart-ment of Commerce, Bureau of the Census. August 1992.
[4] Boniface, Christopher J. and Gbur Philip M., PreliminaryResearch and Evaluation Memorandum No. 189 ‘‘TheAutomated Recordkeeping System—An Evaluation.’’ U.S.Department of Commerce, Bureau of the Census. October1992.
[5] Perkins, R. Colby, Preliminary Research and EvaluationMemorandum No. 131, ‘‘1990 Decennial Census:QualityAssurance Results of the FACT90 Data Preparation Oper-ation.’’ U.S. Department of Commerce, Bureau of theCensus. January 1992.
[6] Steele, LaTanya F., Preliminary Research and Evalua-tion Memorandum No. 190, ‘‘Summary of Quality Assur-ance Results for the Microfilm Duplication Processing forthe 1990 Decennial Census.’’ U.S. Department of Com-merce, Bureau of the Census. October 1992.
[7] Corteville, Jeffrey S., STSD 1990 Decennial CensusMemorandum Series 190, ‘‘Quality Assurance Evaluationof the 1990 Post Enumeration Survey Interviewing Opera-tions.’’ U.S. Department of Commerce, Bureau of theCensus. October 1992.
[8] Boniface, Christopher J., Preliminary Research andEvaluation Memorandum No. 197, ‘‘Quality AssuranceResults for the Edit Review Questionnaire Split Operaton.’’U.S. Department of Commerce, Bureau of the Census.November 1992.
[9] Steele, LaTanya F., STSD 1990 Decennial CensusMemorandum Series 210, ‘‘Summary of Quality AssuranceResults for the Microfilm Library and Microfilm Box CheckProcess for the 1990 Decennial Census. ’’ U.S. Depart-ment of Commerce, Bureau of the Census. December1992.
[10] Steele, LaTanya F., STSD 1990 Decennial CensusMemorandum Series 217, ‘‘Summary of Results on Imple-mentation of Quality Circles for the Place-of-Birth/ Migration/Place-of-Work and Industry and Occupation Coding Oper-ations for the 1990 Decennial Census.’’ U.S. Departmentof Commerce, Bureau of the Census. March 1993.
Printing
Introduction and Background—For the 1990 decennialcensus, approximately 107 million enumerator-administered
94 EFFECTIVENESS OF QUALITY ASSURANCE

JOBNAME: No Job Name PAGE: 11 SESS: 52 OUTPUT: Thu Sep 16 14:03:14 1993 / pssw01/ disk2/ 90dec/ cphe/ 2/ chapter5
questionnaires and 112 million questionnaire mailing pack-ages (along with approximately 90 million casing cards)1
were produced at about 20 contractor sites. The contractsfor the production of the questionnaires and mailing pack-ages contained strict/ concise printing requirements thatnecessitated the use of equipment such as measuringmicroscopes, densitometers, rub-testers, and similar equip-ment to measure compliance with the contracts. Thequality assurance technician program was developed tohandle the arduous task of monitoring the contractors’adherence to the quality assurance requirements as spec-ified in the government contracts. The program consistedof quality assurance technicians (hereafter referred to astechnicians) who were trained in the classroom at CensusBureau headquarters and the Government Printing Officeand on-the-job by experienced Census Bureau headquar-ters staff.
The technicians were to perform the following tasks: 1)verify the selection and inspection of the quality assurancesamples, 2) detect and observe the corrective action takenon defective material, 3) ensure recordkeeping of thequality assurance data, and 4) investigate problems andreport observations conflicting with the quality assurancerequirements. The technicians monitored the contractors’adherence to the quality assurance requirements in con-junction with staff from the Government Printing Office andCensus Bureau headquarters. The technicians performedthese tasks by on-site monitoring of the production of thequestionnaire packages.
Methodology—On-site monitoring began in April 1989and ended in March 1990. There were 2 months in thistime period where there was no production of question-naires. The technicians were trained to perform the mon-itoring tasks in the classroom by the Government PrintingOffice and Census Bureau headquarters staff and on-the-job by experienced Census Bureau headquarters staff. Theclassroom training consisted of an overview of the proce-dures for monitoring the production of the questionnairepackages, technical training on how to calibrate andoperate the equipment used to inspect the questionnairepackages, and the protocol for reporting inconsistenciesand problems. The on-the-job training involved accompa-niment and guidance from Census Bureau staff on how thetechnicians were to verify that the: 1) quality assurancesamples were selected at the specified intervals andcorrectly identified, 2) specified visual and mechanicalmeasurements were done, 3) expanded searches, clean-outs, adjustments, and reinspections were correctly per-formed when defects were detected, and 4) quality assur-ance recordkeeping forms were correctly completed andentered into the automated data collection software pro-vided by the Census Bureau. The technicians also wererequired to investigate, report, and obtain resolutions for
problems that occurred, and complete and mail qualityassurance recordkeeping forms designed to report theobservations of and measurements taken by the techni-cians to Census Bureau headquarters staff. (See forms inappendix B.)
Limitations—The reliability of the evaluation of the qualityassurance technician program was affected by and depen-dent upon the following:
1. The late hiring of long-term technicians.
2. The potentially varying levels or degrees of classroomtraining the technicians received.
3. The accuracy of data relating to the length of time thetechnicians were working on printing related activitiesand the accuracy of quality assurance records on thenumber and length of trips each technician took.
4. The calibration and accuracy of the equipment used toinspect the questionnaire packages.
5. The accuracy of the quality assurance recordkeepingforms completed by the technicians.
Results—
Qualifications—The quality assurance technician programwas not implemented prior to the pre-production of theenumerator-administered questionnaires and questionnairemailing packages because no technicians had been hired.Initially, the technicians were intended to be hired from‘‘outside’’ the Census Bureau. However, the qualificationswere unrealistic relative to the type of people wanted forthe job and the time frame the Census Bureau had to hirethem. Thus, no one was hired. For this reason, four staffmembers from four of the Census Bureau processingoffices were detailed to headquarters to serve as short-term technicians. Eventually, the qualifications were mod-ified. After approximately 60 days, hiring of long-termtechnicians began. By the time all prior-to-productionquestionnaire packages (packages created by the contrac-tor to demonstrate it’s ability to produce the questionnairepackages per Census Bureau specifications) were pro-duced, all but one long-term technician had been hired.
The quality assurance technician program consisted ofa total of nine technicians. Of the nine, four were short-term and five were long-term. One of the five long-termtechnicians left the program before it was completed.
Training—The technicians were not all trained at the sametime because they were hired over a period of 6 months.Two of the technicians received classroom training atCensus Bureau headquarters, eight received classroomtraining from the Government Printing Office, and allreceived on-the-job training from experienced CensusBureau headquarters staff. The classroom training at Cen-sus Bureau headquarters lasted about 2 1/ 2 days andconsisted of an overview and discussion of the procedures
1Address cards for every address in the mailout/ mailback areas thatthe United States Postal Service reviewed for accuracy and complete-ness.
95EFFECTIVENESS OF QUALITY ASSURANCE

JOBNAME: No Job Name PAGE: 12 SESS: 52 OUTPUT: Thu Sep 16 14:03:14 1993 / pssw01/ disk2/ 90dec/ cphe/ 2/ chapter5
for monitoring the production of the questionnaire pack-ages. The topics included such things as how the ques-tionnaires are printed, what the quality assurance require-ments are, and the role and responsibility of the technicians.The classroom training at the Government Printing Officewas technical, lasted approximately 1 week, and coveredthe calibration and operation of the equipment (measuringmicroscopes, densitometers, rub-testers, etc.) used toinspect the questionnaire packages. The on-the-job train-ing, lasting about 2 days for each technician, involved theaccompaniment and guidance from an experienced print-ing Census Bureau headquarters staff person on imple-menting what was taught in the classroom training ses-sions. This occurred at the contractor sites.
The classroom training for most of the long-term tech-nicians was more comprehensive than the classroomtraining received by the short-term technicians. The long-term technicians experienced more hands-on training andmore clarification of what was expected of them. Thedifference in training for the short-term and long-termtechnicians may have been the result of time constraintsand the fact that this was a first attempt at this type oftraining. Regardless, all three types of training were deemednecessary and very valuable.
Monitoring—The technicians monitored production of thequestionnaire packages at approximately 20 contractorsites over a period of 9 months of actual production. Thefirst 2 months were monitored by the short-term techni-cians and the remaining 7 months were monitored by thelong-term technicians. Experienced staff from the Govern-ment Printing Office and Census Bureau headquartersmonitored the sites throughout production, especially betweenthe time short-term technicians left and the long-termtechnicians arrived and were trained. Monitoring by thetechnicians, the Government Printing Office, and CensusBureau headquarters staff was done concurrently through-out the 9 months of production.
There was 100 percent coverage for the contractorsites where prior-to-production questionnaire packageswere produced. For the actual production of the question-naire packages, about half of the contractor sites weremonitored at least 50 percent of production time, and fourwere monitored 100 percent of production time. Themaximum number of sites operating during the same weekwas 14. The sites monitored most were sites whereseveral problems were detected or expected, and siteswhere critical production phases such as imaging, insert-ing, packaging, and shipping occurred. The least moni-tored sites were sites where the envelopes were produced.
The technicians monitored a contractor site for approx-imately a week at a time. Most of the time the technicianswent from one contractor site to another before comingback to Census Bureau headquarters to ‘‘check in.’’ Themonitoring varied by shifts and hours. Monitoring the 20contractor sites throughout the entire production of thequestionnaire packages, to the extent it was accom-plished, would have been virtually impossible without the
technicians. There were too many sites for the Govern-ment Printing Office and Census Bureau headquartersstaff to effectively monitor. There was some attempt madeto rotate the technicians across sites.
While at the contractor sites, the technicians used thegovernment contracts, quality assurance specifications,measuring devices, quality assurance samples and qualityassurance recordkeeping forms completed by the contrac-tors to ensure the contractors adhered to the qualityassurance requirements. The technicians performed inde-pendent inspections of the printed materials and re-measuredattributes that the contractors inspected. The readings ofthe technicians and contractors did not have to exactlymatch, but they had to be within a specified tolerance. Allmeasurements, observations, and discrepancies were doc-umented on quality assurance recordkeeping forms andinvestigated. The technicians completed their quality assur-ance recordkeeping forms and mailed them to CensusBureau headquarters each day. The technicians were tocomplete quality assurance recordkeeping forms for eachshift observed. Most of the time, the technicians com-pleted at least two quality assurance recordkeeping formseach day (one for each shift observed). Occasionally, noquality assurance recordkeeping forms would be com-pleted for a given day. In addition to completing the qualityassurance recordkeeping forms, the technicians calledCensus Bureau headquarters to keep headquarters abreastof what was happening at the contractor sites.
Throughout the entire quality assurance technician pro-gram, approximately 4.0 percent of the recordkeepingforms completed by the technicians contained re-measuredattributes that were out of tolerance. The discrepanciesconsisted of out-of-tolerance image sizes, poor type qual-ity, out-of-tolerance glue on the envelopes, out-of-tolerancetrimming, missing staples, out-of-register ink, improperlystitched questionnaires, incorrectly measured question-naire binding, and packages containing improper contents.No discrepancies were detected for the imaging of thequestionnaires. Most of the discrepancies were detectedfor the construction of the envelopes (approximately 9.4percent), the least monitored operation.
In addition to the discrepancies noted above, the fol-lowing observations were reported: 1) the contractorsincorrectly completed the quality assurance forms, 2) thequality assurance samples were incorrectly identified, 3)the quality assurance data were not entered promptly intothe computer, and 4) the spoiled materials were incorrectlyshredded. These observations were reported for almost allstages of production of the questionnaire packages at onepoint or another, but not all the time.
The technicians also monitored the end of the produc-tion of the casing cards. They were not required tocomplete quality assurance recordkeeping forms, but wererequired to call Census Bureau headquarters daily toreport the status of the production of the casing cards.Since the technicians did not monitor this operation for anysignificant length of time, no inference can be made on theimpact of the technicians’ presence.
96 EFFECTIVENESS OF QUALITY ASSURANCE

JOBNAME: No Job Name PAGE: 13 SESS: 53 OUTPUT: Thu Sep 16 14:03:14 1993 / pssw01/ disk2/ 90dec/ cphe/ 2/ chapter5
Conclusions—The quality assurance technician programwas very useful for monitoring the production of thequestionnaire packages for the 1990 decennial census.The presence of the technicians at the contractor sites hada positive impact on the quality of the materials produced.This was evidenced by the small number of discrepanciesbetween the measurements of the contractors and tech-nicians. Generally, the discrepancies led to immediateinvestigation and inspection of possibly defective materi-als.
Although the classroom training for all the technicianswas not consistent, it was comprehensive. It also allowedthe technicians to ask not only Census Bureau headquar-ters staff questions, but staff from the Government PrintingOffice as well. During on-the-job training, each technicianwas observed by experienced Census Bureau headquar-ters staff and their ability to serve as a technician wasverified.
As a result of the evaluation of the quality assurancetechnician program, the following are recommended:
1. The quality assurance technician program should beused for the 2000 Census. However, the programshould be implemented prior to the pre-production ofthe questionnaire packages. This would eliminate theneed to hire short-term technicians until long-termtechnicians could be hired.
2. Since the basic qualifications to serve as a technicianrequired the ability to master the materials needed tomonitor the production of the questionnaire packagesand function independently, an attempt should be
made to obtain personnel from current Census Bureaustaff to perform as technicians for as long as needed.The staff would be familiar with Census Bureau pro-cedures, a hiring process would not be needed, andthe staff would already be on board. After their func-tion as technicians ends, they could go back to theiroriginal offices. This would help to ensure that alltechnicians would be hired before the pre-productionof the questionnaire packages and allow for consistentand concurrent training of the technicians.
3. There should be regularly scheduled quality circle-typemeetings with the technicians and Census Bureauheadquarters staff. This would provide the opportunityfor the technicians to interact and share informationwith each other as well as with headquarters staff. Thetechnicians also would be able to ask questions andexpress any concerns they may have.
4. The technicians should be rotated between differentcontractor sites. This would allow them to gain expe-rience in monitoring a variety of production processesand interacting with more than one contractor.
Reference—
[1] Green, Somonica L., DSSD 1990 Decennial CensusMemorandum Series # M-56, ‘‘Evaluation of the QualityAssurance Technician Program for the Production of the1990 Decennial Census Questionnaire Packages.’’ U.S.Department of Commerce, Bureau of the Census. August1993.
97EFFECTIVENESS OF QUALITY ASSURANCE
JOBNAME: No Job Name PAGE: 1 SESS: 21 OUTPUT: Thu Sep 16 13:38:49 1993 / pssw01/ disk2/ 90dec/ cphe/ 2/ appa
APPENDIX A.Glossary
Address Control File (ACF)—The Census Bureau’s res-idential address file used to generate the addresses for themailout and enumerator delivery of the questionnairesbefore Census Day. During the questionnaire processingoperation, the ACF is used in identifying nonresponseproblems.
Address Control File Browse—The software system forlocating missing questionnaire identification numbers byaccessing the ACF with address information on the form.
Address Register—A book used by enumerators in acensus that contains the street address and related infor-mation for every housing unit and special place listedand/ or enumerated during the census.
Address Register Area (ARA)—A geographic area estab-lished for data collection purposes, usually consisting ofseveral neighboring blocks.
Automated Recordkeeping System (ARS)—The systemused to record quality assurance information from clericalcensus operations. This system produced quality reportswhich summarize quality assurance data and are used toadvise unit supervisory clerks of quality problems in theirunit.
Batch—Another term for a work unit of questionnaires. Insome operations, a batch consists of a box of approxi-mately 450 short forms or 100 long forms. Boxes ofquestionnaires to repair or markup can also be referred toas batches. (See Work Unit.)
Call Monitoring—The practice of the supervisors and leadclerks in the Telephone Unit of listening to some of thecalls between the telephone clerks and the respondents toensure that the clerks are handling the calls in an effectiveand proper manner.
Camera Unit—The name given to the consolidation offour boxes of questionnaires (also referred to as a CU),grouped to facilitate filming of the questionnaires.
Camera Unit Identification Number (CUID)—A numberassigned to each camera unit for the purpose of controllingthe movement of questionnaire data through FACT 90processing and edit followup.
Casing Cards—Address cards for every address in themailout/ mailback areas that the United States PostalService reviewed for accuracy and completeness.
Census—A complete count of each of the componentparts of a given population (or universe) such as people,housing units, farms, businesses, governments, etc. In amore general sense, a census can be a combination ofcomplete count and sample data as is the case with the1990 Decennial Census of Population and Housing.
Census Data—Data aggregated from the individual cen-sus questionnaires and published in a format (printedreports, computer tapes, CD-ROMS, and microfiche) whichcan be used in a program decision-making process, plan-ning as well as for academic, genealogical, and privateresearch.
Check-In—The logging in of questionnaires into the com-puter to indicate they are part of the processing flow. Thecheck-in results are used to inform the Census Bureauwhich respondents are accounted for and which addressesrequire nonresponse followup.
Check-Out—The logging out of the questionnaires in theprocessing offices which need to be returned to the districtoffices for enumerator followup.
Collection Control File (CCF)—An automated systemused in a field data collection office for management andcontrol of field operations. Part of the Collection ControlSystem for the 1990 decennial census.
Collection Control System (CCS)—The complete set ofautomated programs used to meet collection, administra-tive, personnel, and management control requirements ina field data collection office for the 1990 decennial census.
Control and Tracking System (CATS)—Computer soft-ware used to control and track the movement of cameraunits (or batches) through the data capture processingflow.
Data Capture—The conversion of data from a writtendocument into a computer readable format. In the case ofthe 1990 Decennial Census, the questionnaire data arefirst converted to microfilmed data before being convertedto computer readable data by FOSDIC.
Data Entry Clerk—A clerk specially skilled in using acomputer terminal to transfer written information fromcensus documents to a computer file. Also referred to as akeyer.
Decennial Census—A census that is taken every 10years.
99EFFECTIVENESS OF QUALITY ASSURANCE

JOBNAME: No Job Name PAGE: 2 SESS: 21 OUTPUT: Thu Sep 16 13:38:49 1993 / pssw01/ disk2/ 90dec/ cphe/ 2/ appa
Decennial Operations Division (DOD)—The Headquarter-based, Census Bureau division responsible for overseeingProcessing Offices and operations for the 1990 DecennialCensus. (Later known as Decennial Management Divi-sion.)
Decennial Statistical Studies Division (DSSD)—Theheadquarters-based Census Bureau division responsiblefor overseeing and establishing guidelines for the QualityAssurance units in the processing offices. (Formerly knownas Statistical Support Division (STSD).)
Deliverability Check Card—Was completed for searchaddresses where the basis street addresses was not foundon the address control file. These cards were sent to theappropriate United States Postal Service (USPS) stationfor their assistance in determining whether the searchaddresses were: 1) deliverable as addressed, 2) deliver-able with corrections, or 3) undeliverable.
District Office (DO)—Approximately 450 temporary officesestablished throughout the United States to coordinateenumerator canvassing activities for the 1990 DecennialCensus operations.
Enumerator—A temporary census worker responsible forcollecting information by canvassing an assigned area.
Fail—(See Failed Tolerance.)
Failed Tolerance—A negative result that is an unaccept-able variation from the standard of weight count, filmdensity, keying accuracy, batch size, etc.
Followup—The means used to obtain complete and accu-rate questionnaire data after previous attempts were unsuc-cessful. (See Telephone Followup and Non-response Fol-lowup)
FOSDIC—An acronym which stands for Film Optical Sens-ing Device for Input to Computers.
Geocode—A code which identifies the location of a livingquarters and includes the district office code, the ARAnumber, the block number and in some cases the mapspot number.
Group Quarters—A residential structure providing hous-ing for nine or more unrelated persons using commondining facilities.
Headquarters (HQ)—The Census Bureau, located in Suit-land, Maryland in the Washington, DC area.
Housing Questions—Those questions preceded by an‘‘H’’ which pertain to the housing unit occupied by therespondent and other household members. (See Popula-tion Questions.)
Housing Unit—A house, structure, living quarters, etc.occupied by a single household or if vacant intended foroccupancy as separate living quarters.
Hundred-Percent Questionnaire—Another name for theshort form questionnaire since all of the questions are alsoasked on the long form questionnaire and are thereforeasked of 100 percent of the population. (See short form.)
Imaging—Mailing package production process in whichinformation such as variable respondent addresses, aninterleaved 2 of 5 bar code, a census identification number,a binary coded decimal code, variable return addresseswith corresponding postnet bar codes, and synchroniza-tion control numbers are encoded on each questionnaire.
Industry and Occupation (I&O)—The industry and occu-pation reported for the current or most recent job activity inresponse to questions on the 1990 Decennial Census longform questionnaire items 28 and 29.
Interview—The conversation conducted by a telephoneclerk or enumerator with a respondent from whom censusinformation is sought.
Jeffersonville, IN Office—One of the seven ProcessingOffices for the 1990 Decennial Census. In addition, apermanent Census Bureau office, called the Data Prepa-ration Division (DPD), which handles most of the testcensus processing and current survey requirements betweenthe decennial censuses. Also, for the current censusoperations, will be responsible for duplicating the microfilmproduced by all the processing offices.
Keyer—(See Data Entry Clerk)
List/ Enumerate (L/ E)—Enumerators canvassed a geo-graphic area, listed each residential address, annotatedmaps, and collected a questionnaire from or enumeratedthe household for housing units in more sparsely popu-lated areas.
Long Form—A more detailed questionnaire which is dis-tributed to about one out of every six households. Inaddition to the standard short form questions, the longform contains 26 more population questions per personand 19 more housing questions. A sample of the popula-tion is used to lighten the reporting burden of censusrespondents and to enable the Census Bureau to publishmore detailed data than would be possible from the shortform.
Long Form Keying—The operation which is responsiblefor entering all write-in entries on the long form. Alsoreferred to as write-in keying.
Machine Error—A mechanical problem with the question-naire such as mutilation, tears, food spills, damaged indexmarks, etc., which results in FOSDIC being unable to readdata from that questionnaire. An ‘‘M’’ flag is printed on theRepair Diary to indicate a machine failure.
100 EFFECTIVENESS OF QUALITY ASSURANCE
JOBNAME: No Job Name PAGE: 3 SESS: 21 OUTPUT: Thu Sep 16 13:38:49 1993 / pssw01/ disk2/ 90dec/ cphe/ 2/ appa
Mailout/ Mailback—The method for the data collectionwhere questionnaires are mailed out to the respondents,and respondents mail their completed forms back to theaddress on the return envelop (either the local districtoffice or a processing office).
Map Spot—The indication of a living quarters on a censusmap.
Map Spot Number—A unique 4-digit number for eachmap spot. This number is the last four digits in thegeocoded section of the questionnaires.
Markup Unit—The unit responsible for correcting contentor coverage errors noted by the computer edit and identi-fying those forms which require telephone followup or apersonal visit to accurately complete the questionnaire.
Microfilm Access Device (MAD)—A machine used in theSearch/ Match operations to review questionnaire imageson microfilm and to print copies.
NonResponse Followup—The practice of sending anenumerator to collect the data from a household that hasfailed to complete its questionnaire within a certain time.
Original Keyer—A term used in data entry operations todistinguish the keyer, whose work has been verified, fromthe verifying clerk and other clerks in the unit.
Pass—1) The positive result in checking, verifying orediting a work unit to see if it is within tolerance. 2) In theSplit Unit, the activity of wanding or keying identificationnumbers of questionnaire in a box or sorted pile to identifythe result of the computer edit for each questionnaire.
Place-of-Work (POW)—The address location of the plant,office, store, or other establishment where the respondentworked the previous week.
Population Questions—Items on the questionnaire thatask for information about a member of the household. (SeeHousing Questions.)
Precanvass—An update of the tape address register(TAR) addresses done by census enumerators who com-pared physical locations of housing units with what theyfound in the address listings and made the necessarychanges.
Prelist (1988)—One of two early precensus operations(see TAR) undertaken for the initial creation of addressfiles for later incorporation into the address control file(ACF). The 1988 Prelist was conducted in suburban areas,small cities, towns, and some rural areas.
Procedure—The document containing a set of guidelinesdescribing in detail how the various aspects of the pro-cessing operations are to be conducted in the various unitsin the processing offices.
Processing Office (PO)—There were seven offices estab-lished to handle the processing workload for the 1990Decennial Census. The processing offices are:
Albany, NYAustin, TXBaltimore, MDJacksonville, FLJeffersonville, INKansas City, MOSan Diego, CA
Quality Assurance (QA)—Quality assurance consists ofmonitoring, evaluating, verifying, and reporting on the workperformed within the production units. The purpose ofquality assurance is to identify performance problems andtheir causes, to propose solutions to these problems, andto communicate this information to the supervisors whowill decide what corrective action needs to be taken.
Quality Control (QC)—Is the regulatory process throughwhich we measure actual quality performance, compare itwith standards, and act on the difference.
Quality Control Clerk—(See Verification Clerk.)
Question—An item on a questionnaire designed to elicitinformation from a respondent abut his/ her household andhousing unit.
Questionnaire—For the 1990 Decennial Census, the formcontaining questions designed to collect population andhousing data from the American public.
Questionnaire Data—The information about the house-hold and housing unit recorded on the questionnaire.
Regional Census Center—A temporary office establishedduring the census to manage and support the districtoffices activities.
Regional Office—A permanent office used to manageand support the collection of data for ongoing programs.
Register—Address register.
Reinterview—A quality control procedure to verify thatenumerators collected accurate information.
Rekey—To reenter all data from a work unit because itfailed tolerance. (See Repair definition 3.)
101EFFECTIVENESS OF QUALITY ASSURANCE

JOBNAME: No Job Name PAGE: 4 SESS: 21 OUTPUT: Thu Sep 16 13:38:49 1993 / pssw01/ disk2/ 90dec/ cphe/ 2/ appa
Repair—1) In edit review, one of four categories that,along with markup, indicate questionnaires that have beenrejected by the computer edit. 2) To insert or correct datafrom a work unit because it failed tolerance. (See Rekey.)
Repair Unit—The unit responsible for fixing question-naires that have been rejected by the computer editbecause of machine errors, identification errors, and cov-erage inconsistencies.
Report—1) A document providing production or qualitystatistics. 2) A problem referral. 3) The title and classifica-tion of four types of census forms (Advance CensusReport, Individual Census Report, Military Census Report,and Shipboard Census Report).
Respondent—The person who provides the question-naire data by filling out the form or by answering questionsfrom an enumerator or telephone clerk.
REX—Research, Evaluation, and Experimental Program.
Sample Questionnaire—(See Long Form.)
SAS—A software package used for Statistical Analysisdeveloped by the SAS Institute Inc., Cary, North Carolina.
Search/ Match—The Search/ Match Coverage Improve-ment operation was conducted to help ensure that allpersonswereenumeratedat theirusual residence.Search/ Matchwas designed to improve both within household and wholehousehold coverage.
Short Form—One of two types of questionnaires used tocollect data for the 1990 Decennial Census. The shortforms contain seven population and seven housing ques-tions and are distributed to approximately five out of everysix households. (See Long Form.)
Split—The separation of questionnaires after the com-puter edit into those that passed and those that failed theedit. Those that passed are the accepts and the PostEnumeration Survey accepts. Those that failed are therepairs and the markups.
Split Unit—The unit which separates questionnaires intofour categories (accept, post enumeration survey accept,repair, or markup) by wanding or keying the questionnaireidentification number.
Soundx Algorithm—An automated method of qualityassurance verification for alpha/ numeric fields in whichtwo versions of the same field entry are compared todetermine whether or not the two entries refer to the sameinformation despite minor differences (spelling, spacing,
etc.). The number of character (keystroke) differencesallowed depends on the length of the field. The soundxmethod of verification was developed by the DecennialManagement Division.
Tape Address Register (TAR)—Computer tapes contain-ing geocoded addresses for the address register areaswithin the most populated urban areas of the UnitedStates.
Tape Address Register area—An area where the initialaddress list is a purchased vendor file.
Telephone Assistance—A public service provided by theprocessing offices to aid respondents who require assis-tance in completing their questionnaires. This type ofassistance is also provided by the district offices.
Telephone Followup—The processing office operation inwhich clerks conduct followup enumeration by telephonefor the Type 1, mail return questionnaires that could not befixed in the Markup Unit.
Tolerance—Leeway for variation from a standard which isset to determine whether a batch must be rekeyed or fixedbecause it had more errors than the tolerance allowed.
Type 1 District Office (DO)—There were 103 Type 1District Offices that covered central city areas in the largercities. Each Type 1 DO covered around 175,000 housingunits.
Type 2 District Office (DO)—There were 197 Type 2District Offices that covered cities and suburban areas.Each Type 2 DO covered around 260,000 housing units.
Type 2A District Office (DO)—There were 79 Type 2ADistrict Offices that covered cities, suburban, rural, andseasonal areas in the south and midwest. Each Type 2ADO covered around 270,000 housing units.
Type 3 District Office (DO)—There were 70 Type 3District Offices that covered the more rural areas of thewest and far north. Each Type 3 DO covered around215,000 housing units.
Update/ Leave (UL)—Enumerators delivered decennialcensus forms for return by mail and at the same timeupdated the census mailing list in selected rural areas.
Urban Update/ Leave (UU/ L)—Enumerators delivered decen-nial census forms for return by mail and at the same timeupdated census mail list in preidentified census blocksconsisting entirely of public housing developments.
Verification—The process of checking a clerk’s work todetermine whether the work is of acceptable quality to goon to the next stage of processing.
102 EFFECTIVENESS OF QUALITY ASSURANCE

JOBNAME: No Job Name PAGE: 5 SESS: 21 OUTPUT: Thu Sep 16 13:38:49 1993 / pssw01/ disk2/ 90dec/ cphe/ 2/ appa
Verification Clerk—The clerk who is responsible forverification of a random selection of work. Also referred toas quality control clerk.
Work Unit—A generic term used to describe a tray, batch,box or camera unit of questionnaires, or a rolling bin ofsuch items.
Work Unit Identification—A number assigned to eachwork unit.
Write-in Entry—An entry or respondent answer handwrit-ten in the dotted-line areas of the questionnaire.
Write-in Keying—(See Long Form Keying.)
103EFFECTIVENESS OF QUALITY ASSURANCE

JOBNAME: No Job Name PAGE: 1 SESS: 8 OUTPUT: Thu Sep 16 13:38:56 1993 / pssw01/ disk2/ 90dec/ cphe/ 2/ appb
APPENDIX B.1990 Decennial Census Forms
105EFFECTIVENESS OF QUALITY ASSURANCE

JOBNAME: No Job Name PAGE: 2 SESS: 8 OUTPUT: Thu Sep 16 13:38:56 1993 / pssw01/ disk2/ 90dec/ cphe/ 2/ appb
106 EFFECTIVENESS OF QUALITY ASSURANCE

JOBNAME: No Job Name PAGE: 3 SESS: 8 OUTPUT: Thu Sep 16 13:38:56 1993 / pssw01/ disk2/ 90dec/ cphe/ 2/ appb
107EFFECTIVENESS OF QUALITY ASSURANCE

JOBNAME: No Job Name PAGE: 4 SESS: 8 OUTPUT: Thu Sep 16 13:38:56 1993 / pssw01/ disk2/ 90dec/ cphe/ 2/ appb
108 EFFECTIVENESS OF QUALITY ASSURANCE

JOBNAME: No Job Name PAGE: 5 SESS: 8 OUTPUT: Thu Sep 16 13:38:56 1993 / pssw01/ disk2/ 90dec/ cphe/ 2/ appb
109EFFECTIVENESS OF QUALITY ASSURANCE
JOBNAME: No Job Name PAGE: 6 SESS: 8 OUTPUT: Thu Sep 16 13:38:56 1993 / pssw01/ disk2/ 90dec/ cphe/ 2/ appb
110 EFFECTIVENESS OF QUALITY ASSURANCE

JOBNAME: No Job Name PAGE: 7 SESS: 8 OUTPUT: Thu Sep 16 13:38:56 1993 / pssw01/ disk2/ 90dec/ cphe/ 2/ appb
111EFFECTIVENESS OF QUALITY ASSURANCE

JOBNAME: No Job Name PAGE: 8 SESS: 8 OUTPUT: Thu Sep 16 13:38:56 1993 / pssw01/ disk2/ 90dec/ cphe/ 2/ appb
112 EFFECTIVENESS OF QUALITY ASSURANCE

JOBNAME: No Job Name PAGE: 9 SESS: 8 OUTPUT: Thu Sep 16 13:38:56 1993 / pssw01/ disk2/ 90dec/ cphe/ 2/ appb
113EFFECTIVENESS OF QUALITY ASSURANCE

JOBNAME: No Job Name PAGE: 10 SESS: 8 OUTPUT: Thu Sep 16 13:38:56 1993 / pssw01/ disk2/ 90dec/ cphe/ 2/ appb
114 EFFECTIVENESS OF QUALITY ASSURANCE

JOBNAME: No Job Name PAGE: 11 SESS: 8 OUTPUT: Thu Sep 16 13:38:56 1993 / pssw01/ disk2/ 90dec/ cphe/ 2/ appb
115EFFECTIVENESS OF QUALITY ASSURANCE

JOBNAME: No Job Name PAGE: 12 SESS: 8 OUTPUT: Thu Sep 16 13:38:56 1993 / pssw01/ disk2/ 90dec/ cphe/ 2/ appb
116 EFFECTIVENESS OF QUALITY ASSURANCE
JOBNAME: No Job Name PAGE: 13 SESS: 8 OUTPUT: Thu Sep 16 13:38:56 1993 / pssw01/ disk2/ 90dec/ cphe/ 2/ appb
117EFFECTIVENESS OF QUALITY ASSURANCE

JOB
NA
ME
: No Job N
ame P
AG
E: 14 S
ES
S: 8 O
UT
PU
T: T
hu Sep 16 13:38:56 1993 /pssw
01/disk2/90dec/cphe/2/appb
118E
FF
EC
TIV
EN
ES
SO
FQ
UA
LITY
AS
SU
RA
NC
E

JOBNAME: No Job Name PAGE: 15 SESS: 8 OUTPUT: Thu Sep 16 13:38:56 1993 / pssw01/ disk2/ 90dec/ cphe/ 2/ appb
119EFFECTIVENESS OF QUALITY ASSURANCE

JOBNAME: No Job Name PAGE: 16 SESS: 11 OUTPUT: Thu Sep 16 13:38:56 1993 / pssw01/ disk2/ 90dec/ cphe/ 2/ appb
120 EFFECTIVENESS OF QUALITY ASSURANCE
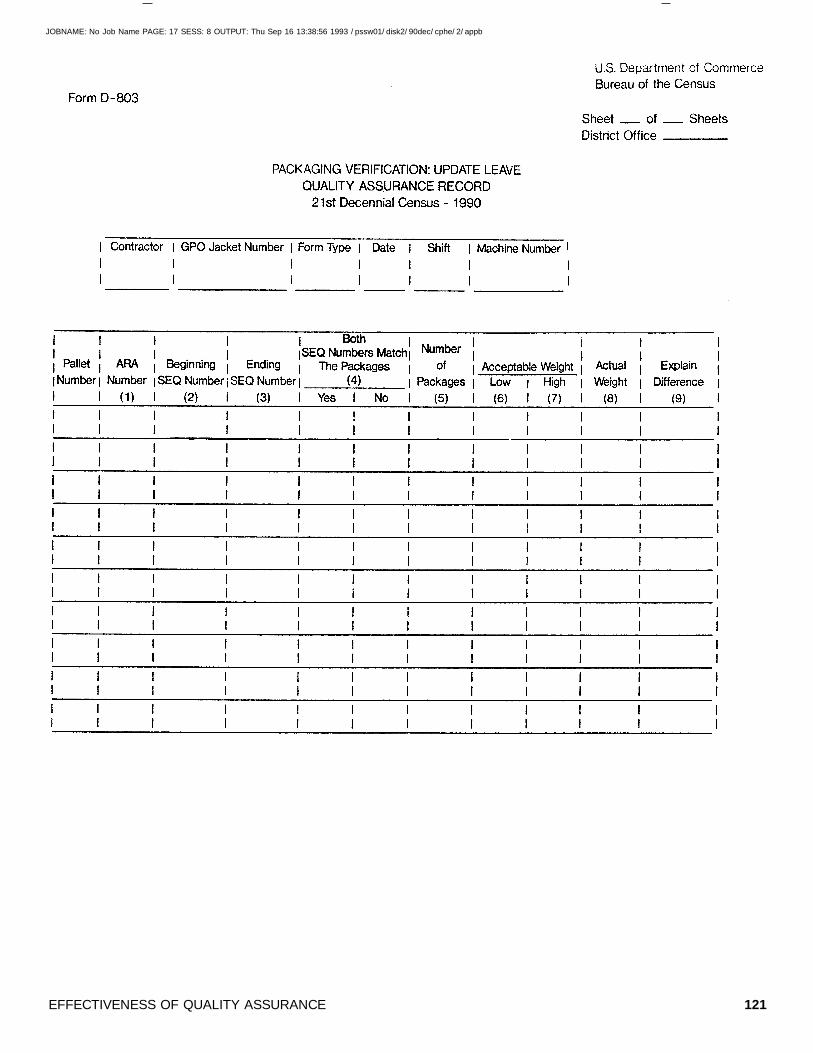
JOBNAME: No Job Name PAGE: 17 SESS: 8 OUTPUT: Thu Sep 16 13:38:56 1993 / pssw01/ disk2/ 90dec/ cphe/ 2/ appb
121EFFECTIVENESS OF QUALITY ASSURANCE

JOBNAME: No Job Name PAGE: 18 SESS: 8 OUTPUT: Thu Sep 16 13:38:56 1993 / pssw01/ disk2/ 90dec/ cphe/ 2/ appb
122 EFFECTIVENESS OF QUALITY ASSURANCE

JOBNAME: No Job Name PAGE: 19 SESS: 8 OUTPUT: Thu Sep 16 13:38:56 1993 / pssw01/ disk2/ 90dec/ cphe/ 2/ appb
123EFFECTIVENESS OF QUALITY ASSURANCE

JOBNAME: No Job Name PAGE: 20 SESS: 8 OUTPUT: Thu Sep 16 13:38:56 1993 / pssw01/ disk2/ 90dec/ cphe/ 2/ appb
124 EFFECTIVENESS OF QUALITY ASSURANCE

JOBNAME: No Job Name PAGE: 21 SESS: 8 OUTPUT: Thu Sep 16 13:38:56 1993 / pssw01/ disk2/ 90dec/ cphe/ 2/ appb
125EFFECTIVENESS OF QUALITY ASSURANCE

JOB
NA
ME
: No Job N
ame P
AG
E: 22 S
ES
S: 8 O
UT
PU
T: T
hu Sep 16 13:38:56 1993 /pssw
01/disk2/90dec/cphe/2/appb
126E
FF
EC
TIV
EN
ES
SO
FQ
UA
LITY
AS
SU
RA
NC
E

JOB
NA
ME
: No Job N
ame P
AG
E: 23 S
ES
S: 8 O
UT
PU
T: T
hu Sep 16 13:38:56 1993 /pssw
01/disk2/90dec/cphe/2/appb
127E
FF
EC
TIV
EN
ES
SO
FQ
UA
LITY
AS
SU
RA
NC
E

JOB
NA
ME
: No Job N
ame P
AG
E: 24 S
ES
S: 8 O
UT
PU
T: T
hu Sep 16 13:38:56 1993 /pssw
01/disk2/90dec/cphe/2/appb
128E
FF
EC
TIV
EN
ES
SO
FQ
UA
LITY
AS
SU
RA
NC
E

JOB
NA
ME
: No Job N
ame P
AG
E: 25 S
ES
S: 13 O
UT
PU
T: T
hu Sep 16 13:38:56 1993 /pssw
01/disk2/90dec/cphe/2/appb
129E
FF
EC
TIV
EN
ES
SO
FQ
UA
LITY
AS
SU
RA
NC
E

JOBNAME: No Job Name PAGE: 26 SESS: 8 OUTPUT: Thu Sep 16 13:38:56 1993 / pssw01/ disk2/ 90dec/ cphe/ 2/ appb
130 EFFECTIVENESS OF QUALITY ASSURANCE

JOBNAME: No Job Name PAGE: 27 SESS: 8 OUTPUT: Thu Sep 16 13:38:56 1993 / pssw01/ disk2/ 90dec/ cphe/ 2/ appb
131EFFECTIVENESS OF QUALITY ASSURANCE

JOBNAME: No Job Name PAGE: 28 SESS: 8 OUTPUT: Thu Sep 16 13:38:56 1993 / pssw01/ disk2/ 90dec/ cphe/ 2/ appb
132 EFFECTIVENESS OF QUALITY ASSURANCE

JOBNAME: No Job Name PAGE: 29 SESS: 8 OUTPUT: Thu Sep 16 13:38:56 1993 / pssw01/ disk2/ 90dec/ cphe/ 2/ appb
133EFFECTIVENESS OF QUALITY ASSURANCE

JOBNAME: No Job Name PAGE: 30 SESS: 8 OUTPUT: Thu Sep 16 13:38:56 1993 / pssw01/ disk2/ 90dec/ cphe/ 2/ appb
134 EFFECTIVENESS OF QUALITY ASSURANCE

JOBNAME: No Job Name PAGE: 31 SESS: 8 OUTPUT: Thu Sep 16 13:38:56 1993 / pssw01/ disk2/ 90dec/ cphe/ 2/ appb
135EFFECTIVENESS OF QUALITY ASSURANCE

JOBNAME: No Job Name PAGE: 32 SESS: 8 OUTPUT: Thu Sep 16 13:38:56 1993 / pssw01/ disk2/ 90dec/ cphe/ 2/ appb
136 EFFECTIVENESS OF QUALITY ASSURANCE

JOBNAME: No Job Name PAGE: 33 SESS: 8 OUTPUT: Thu Sep 16 13:38:56 1993 / pssw01/ disk2/ 90dec/ cphe/ 2/ appb
137EFFECTIVENESS OF QUALITY ASSURANCE

JOBNAME: No Job Name PAGE: 34 SESS: 8 OUTPUT: Thu Sep 16 13:38:56 1993 / pssw01/ disk2/ 90dec/ cphe/ 2/ appb
138 EFFECTIVENESS OF QUALITY ASSURANCE

JOBNAME: No Job Name PAGE: 35 SESS: 8 OUTPUT: Thu Sep 16 13:38:56 1993 / pssw01/ disk2/ 90dec/ cphe/ 2/ appb
139EFFECTIVENESS OF QUALITY ASSURANCE

JOBNAME: No Job Name PAGE: 36 SESS: 8 OUTPUT: Thu Sep 16 13:38:56 1993 / pssw01/ disk2/ 90dec/ cphe/ 2/ appb
140 EFFECTIVENESS OF QUALITY ASSURANCE

JOBNAME: No Job Name PAGE: 37 SESS: 8 OUTPUT: Thu Sep 16 13:38:56 1993 / pssw01/ disk2/ 90dec/ cphe/ 2/ appb
141EFFECTIVENESS OF QUALITY ASSURANCE

JOBNAME: No Job Name PAGE: 38 SESS: 9 OUTPUT: Thu Sep 16 13:38:56 1993 / pssw01/ disk2/ 90dec/ cphe/ 2/ appb
142 EFFECTIVENESS OF QUALITY ASSURANCE

JOBNAME: No Job Name PAGE: 39 SESS: 8 OUTPUT: Thu Sep 16 13:38:56 1993 / pssw01/ disk2/ 90dec/ cphe/ 2/ appb
143EFFECTIVENESS OF QUALITY ASSURANCE

JOBNAME: No Job Name PAGE: 40 SESS: 8 OUTPUT: Thu Sep 16 13:38:56 1993 / pssw01/ disk2/ 90dec/ cphe/ 2/ appb
144 EFFECTIVENESS OF QUALITY ASSURANCE

JOBNAME: No Job Name PAGE: 41 SESS: 8 OUTPUT: Thu Sep 16 13:38:56 1993 / pssw01/ disk2/ 90dec/ cphe/ 2/ appb
145EFFECTIVENESS OF QUALITY ASSURANCE

JOBNAME: No Job Name PAGE: 42 SESS: 8 OUTPUT: Thu Sep 16 13:38:56 1993 / pssw01/ disk2/ 90dec/ cphe/ 2/ appb
146 EFFECTIVENESS OF QUALITY ASSURANCE

JOBNAME: No Job Name PAGE: 1 SESS: 7 OUTPUT: Thu Sep 16 14:03:32 1993 / pssw01/ disk2/ 90dec/ cphe/ 2/ cover3
NOTE TO THE READER
This Census of Population and Housing Evaluation and Research Report is designed toinform the public about the quality assurance program approach and the results for the majordecennial census operations. If you would like additional information on any of the topicspresented in this publication, copies of the reference documents, or other information aboutthe quality assurance program, please write to:
Mr. John H. ThompsonChief, Decennial Statistical Studies DivisionC/ O Quality Assurance REX PublicationBureau of the CensusWashington, DC 20233
We welcome your questions and will provide any requested information, as available.