evaluating user experiences from interactive art installations
TRANSCRIPT
TDT4570 Game Technology, Specialization Project Autumn 2011
EVALUATING USER EXPERIENCES FROM INTERACTIVE ART INSTALLATIONS
Mia Aasbakken
Supervisor: Maria Letizia Jaccheri Co-supervisor: Alf Inge Wang
Department of Computer and Information Science
at the Norwegian University of Science and Technology
December 14th, 2011


i
ABSTRACT This study takes an in-depth look at how people interact with artistic software,
and how their user experiences can be assessed and evaluated. Many interactive art installations seek to convey an artistic message to the users. A wide variety of Human-Computer Interaction (HCI) methods exist to evaluate how users experience such installations and to what degree the installation achieved its goal of conveying a message to the user.
This study examines existing theory and empirical results found in the field of HCI relating to interactive art installations. New empirical data is also gathered through the analysis of an exhibition of two interactive art installations. The results of these studies are revised evaluation methods, including a new method that was discovered during the analysis of the exhibitions.
The main result of this work is a guide for both artists and software engineers for evaluating interactive art installations and how to assess the success of such installations in terms of conveying artistic messages.

ii
iii
TABLE OF CONTENTS
1 Introduction ......................................................................................................... 1
1.1 Motivation ............................................................................................................. 1 1.2 Process .................................................................................................................. 1 1.3 Objective ............................................................................................................... 4 1.4 Report Outline ...................................................................................................... 4
2 Literature Study ................................................................................................... 5
2.1 Interactive Art Installations .................................................................................. 5 2.2 Communication Through Interactive Art Installations ......................................... 6 2.3 Evaluating Interactive Art Installations ................................................................. 7 2.4 HCI Evaluation Methods ....................................................................................... 8
2.4.1 Observation.................................................................................................................. 8 2.4.2 Interviews .................................................................................................................... 9 2.4.3 Questionnaires ........................................................................................................... 10 2.4.4 Data recording ........................................................................................................... 10 2.4.5 Input Logging ............................................................................................................. 12 2.4.6 Combining methods ................................................................................................... 12
2.5 Experimental Evaluation Methods ..................................................................... 12
2.5.1 Video-cued Recall Method......................................................................................... 12 2.5.2 Experience workshop ................................................................................................. 13
2.6 Discussion of Methods ........................................................................................ 13
3 Empirical Study .................................................................................................. 16
3.1 Introduction ........................................................................................................ 16 3.2 Research Context ................................................................................................ 16
3.2.1 Button based installation ........................................................................................... 16 3.2.2 Touch screen installation ........................................................................................... 17 3.2.3 The big picture ........................................................................................................... 17 3.2.4 Software Application ................................................................................................. 18 3.2.5 Setup .......................................................................................................................... 19
3.3 Research Questions ............................................................................................ 19 3.4 Analysis ............................................................................................................... 20
3.4.1 Data collection methods ............................................................................................ 20 3.4.2 Observations .............................................................................................................. 20 3.4.3 Questionnaires ........................................................................................................... 25

iv
3.4.4 Interview .................................................................................................................... 26 3.4.5 Input logs ................................................................................................................... 27
4 Results ............................................................................................................... 29
4.1 Results from the Empirical Study ........................................................................ 29 4.2 A New Method .................................................................................................... 29
5 Conclusion ......................................................................................................... 32
5.1 Future Work ........................................................................................................ 32
References ................................................................................................................ 33 Appendix 1 – Poster for the Exhibition ...................................................................... 35 Appendix 2 – Questionnaire used in Empirical Study ................................................. 37
1
1 INTRODUCTION 1.1 MOTIVATION
I have always had a big interest in both computers and art my whole life. When I started at NTNU I was introduced to a subculture known as the demoscene1, where people (known as demosceners) use their computer to make art. Demosceners regularly meet at so-called demoparties to discuss, enjoy and compete with these pieces of computer art, as well as learning new technologies and techniques from each other. The main type of computer art that is created in the demoscene is called a demo – a non-interactive software application that runs in real-time on your computer, presenting skills in programming, art and music. I was inspired by the demoscene, and it has influenced the choices that I have had to make during my study – different courses and my specialization.
In the spring semester during my fourth year, we had a course named “Experts in Teamwork”2 where we had to choose a themed project. My choice was influenced by the demoscene and my background as a hobby artist when I picked the theme “New Media Art for Interactive Campaigns”. In this project, we developed an interactive art installation that we called “Water Me” (“Vann Meg”) together with a report3. The creation of “Water Me” really opened my eyes to interactive art installations. As I am a self proclaimed hobby artist, I thought I could relate to both the engineering part and the artist part of making an interactive art installation, and I quickly decided that I wanted to explore more of this subfield of new media art in my specialization project.
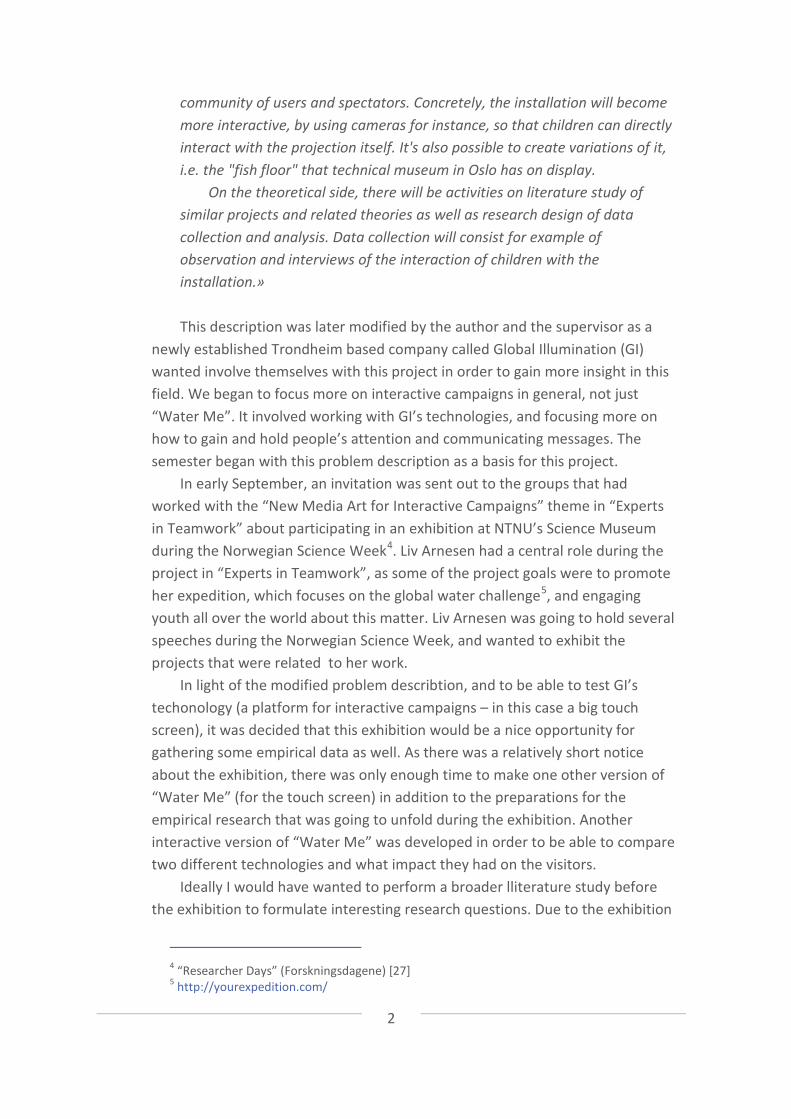
1.2 PROCESS The process of this project started with the “Water Me” project, as
mentioned in chapter 1.1, and the problem describtion was based upon “Water Me”:
«Vann Meg is an interactive installation on the theme Water Challenge,
developed by a group of Experts in Team Students for Liv Arnesen in Spring 2011. Folkebibliotek in Trondheim has a wish to display this piece in late autumn.
This project will have both practical, empirical, and theoretical focus. On the practical side, there will be need for improving, updating, building of
1 A computer art subculture: http://en.wikipedia.org/wiki/Demoscene 2 Experts in Teamwork: http://www.ntnu.edu/eit 3 The report [25] for “Water Me” is online at http://www.idi.ntnu.no/~letizia/eit2011-LAF/TDT4852ProjectG3.pdf, but is only available in Norwegian.
2
community of users and spectators. Concretely, the installation will become more interactive, by using cameras for instance, so that children can directly interact with the projection itself. It's also possible to create variations of it, i.e. the "fish floor" that technical museum in Oslo has on display.
On the theoretical side, there will be activities on literature study of similar projects and related theories as well as research design of data collection and analysis. Data collection will consist for example of observation and interviews of the interaction of children with the installation.» This description was later modified by the author and the supervisor as a
newly established Trondheim based company called Global Illumination (GI) wanted involve themselves with this project in order to gain more insight in this field. We began to focus more on interactive campaigns in general, not just “Water Me”. It involved working with GI’s technologies, and focusing more on how to gain and hold people’s attention and communicating messages. The semester began with this problem description as a basis for this project.
In early September, an invitation was sent out to the groups that had worked with the “New Media Art for Interactive Campaigns” theme in “Experts in Teamwork” about participating in an exhibition at NTNU’s Science Museum during the Norwegian Science Week4. Liv Arnesen had a central role during the project in “Experts in Teamwork”, as some of the project goals were to promote her expedition, which focuses on the global water challenge5, and engaging youth all over the world about this matter. Liv Arnesen was going to hold several speeches during the Norwegian Science Week, and wanted to exhibit the projects that were related to her work.
In light of the modified problem describtion, and to be able to test GI’s techonology (a platform for interactive campaigns – in this case a big touch screen), it was decided that this exhibition would be a nice opportunity for gathering some empirical data as well. As there was a relatively short notice about the exhibition, there was only enough time to make one other version of “Water Me” (for the touch screen) in addition to the preparations for the empirical research that was going to unfold during the exhibition. Another interactive version of “Water Me” was developed in order to be able to compare two different technologies and what impact they had on the visitors.
Ideally I would have wanted to perform a broader lliterature study before the exhibition to formulate interesting research questions. Due to the exhibition
4 “Researcher Days” (Forskningsdagene) [27] 5 http://yourexpedition.com/
3
being scheduled in early in the semester, and modifications needed to be done to the installation, the research questions were mostly extracted from the syllabus suggested by the supervisor in connection with her course “TDT69 Artistic Software: Products and Processes”. Some research questions were also propsed by GI. None the less, the exhibition was a valuable opportunity to get familiar on how to conduct empirical research, as this is a very common way to collect data, and will most likely be used in the master thesis project next semester.
The exhibition was held on the 24th to 25th of September and data was collected in the form of questionnaires, an interview, observation, input logs, pictures, movies and notes. After the exhibition was over and data had been collected, an analysis phase followed. In retrospect of the empirical research, some of the objectives for the project evolved, which can be seen in chaper 1.3.
With the objectives at hand, a literature study was conducted to gain insight on previous used methods on evaluating and communicating messages through interactive art installations. This literature study was then used as a reference point for a comparison the findings made during the exhibition. Then everything was tied together when writing this report.
A summary of the process follows.
• First problem description introduced by supervisor Letizia Jaccheri • Global Illumination introduces a new perspective on the problem
description, with focus on their technology. • Invitation to an exhibition at NTNU’s Science Museum recieved • Modification of “Water Me” and turning it into another interactive art
installation by using GI’s platform. • Exhibition was held on the 24th to 25th of September, and start of
empirical research, as data was collected. • Empirical research continues with analysis of the data collected from
the exhibition, and chapter 3 is written. • Project objectives identified. • Literature study. • Connecting theory from literature and results from the empirical
research. • Writing of report.

4
1.3 OBJECTIVE The aim of this project is to answer the following questions:
• How can you use an interactive art installation as a medium of communication?
• Which methods can be used to evaluate the communicated message and how this message is percieved by the audience?
Answers to these questions will be given through a literature study and through an empirical study of two interactive art installations.
1.4 REPORT OUTLINE Chapter 2 will introduce the reader to relevant theory related to interactive
art installations and methods that can be used to evaluate them. In chapter 3 an empirical study of an exhibition of two interactive art installations is presented and analysed. Chapter 4 summarizes the results from the empirical study and a new method is proposed. Chapter 5 concludes this report.
5
2 LITERATURE STUDY With the rapid development of computers through the last 50 years, there has
been an interesting boom in computer art following this development. It can be said that we live in a “digital age” now, with easy access to computers and the internet all around us. This makes computers a natural platform for creating and distributing art to a modern audience.
Together with the increasing computing power of modern computers, the development of great software and tools makes it more accessible for people to create computer art [1]. Artwork created using the new technologies introduced by the digital age is often referred to as new media art [2]. New media art is a genre that encompasses a huge variety of artworks, where electronic games probably are one of the most recognized forms. Another smaller subset of new media art is interactive art installations.
2.1 INTERACTIVE ART INSTALLATIONS Interactive art installations have more resemblance to traditional art pieces
than for example traditional computer games, as they often include a physical construction. Another resemblance is that they are usually placed in a public space where spectators can enjoy them. A major difference from traditional art pieces is that elements in the installation have the ability to change, usually triggered by interaction from it’s spectators or other environmental factors. Interactivity is usually the key for the artwork to fully communicate its artistic message, and it often involves the spectators themselves to become a part of the installation by interacting with it.
Traditional art pieces are usually forbidden to touch, as the artwork could be ruined if every visitor tinker or smear filthy fingers all over the piece. Some artworks are even behind glass6 to protect them from the environmental factors that may destroy them. For interactive art installations, it is a whole different story. As Erkki Huhtamo nicely puts into words in his article [3]:
«Of course, the reception of art itself can always be claimed to be “active”. However, interactive art added to the mental activity a haptic dimension: the visitor was not only allowed, but required to touch the work.»
A. Trifonova et al. [2] discuss various types of interactions that can be found in interactive art installations, varying from static and dynamic to evolutionary. They
6 The portrait of “Mona Lisa” (by Leonardo da Vinci) is displayed in a climate-controlled cage
made of bullet proof glass.
6
collect and group the forms of interaction and how they influence the installation into three perspectives:
• Interaction rules
Rules that control interaction with the installation. They can be everything from static to dynamic, meaning that the degree of interaction can vary from simple start/stop actions to direclty influencing the artwork by bodily gestures.
• Trigging parameters
Factors that trigger the interaction rules. The factors may be a large variety of sensors that gather input from the environment, intentional interaction from the spectators or simply the presence of the spectators, leading to unintentional interaction.
• Content origin
How the installation presents it’s content to the spectators. May be generated, pre-defined by the artist or edited by the spectators.
Interaction with an interactive art installation can therefore vary from almost “traditional” installations, that resembles static artworks found in museums where the spectator merely can start and stop what is going on, to very dynamical installations where the user almost becomes a part of the installation. How interactive an installation is depends greatly on what effect the artist want to achieve with the installation and what message she wants to send to the audience.
2.2 COMMUNICATION THROUGH INTERACTIVE ART INSTALLATIONS Artists usually want to deliver a message through their artwork, provoking
thoughts and reflections, maybe even engaging the audience emotionally. Artists that embrace technology and software are no different from traditional artists, and it is not bold to suggest that they get better opportunities to express their poetic message through their new media artwork.
In 1964, Marshall McLuhan wrote some legendary words in the first chapter of his book:
«In a culture like ours … it is sometimes a bit of a shock to be reminded that, in operational and practical fact, the medium is the message. » [4]
In interactive art installations, the physical part of the installation can be considered as a part of the artwork. By breaking the “no touch” policy that has been followed by museums and galleries for centuries, there is already some

7
communication going on to the audience. The exhibited installation invites the user to interact with it, shattering the cultural barrier that has been “set in stone” for a long time. But in order to get the user to interact with the installation, the physical appereance needs to both engage and envoke the user’s curiosity and attention. This becomes even more appereant when the installation is not situated in a traditional museum setting.
Empirical data suggest that physical appereance have large impact whether people are noticing an installation and triggering their curiosity [5]. The installation “At Hand” [5] was located in a public space, and was situated between advertising screens. Most passers-by did not notice it, but as soon as people starting to use it, more people were attracted to it.
“In this sense, one could say that a temporary crowd of people in a public
place may awaken curiosity and attraction in other people” [5].
Evaluating interactive art is thus not just about studying interaction between humans and computers, but also between humans.
2.3 EVALUATING INTERACTIVE ART INSTALLATIONS How you should evaluate software applications have been a common issue
in software engineering for a long time, and there have been developed a wide variety of methods to address the issue.
In the article “Software engineering issues in interactive installation art” [2] A. Trifonova et al. tries to map the traditional software engineering methods to interactive art installations, while having B. Oates’ suggestion that “computer art might be seen as a kind of information system” [6] in mind. They did a larger study on practical problems, technical solutions and software engineering issues in interactive art installations, and also addressed the issue of evaluation in this study. But can software engineering methods apply to artworks?
The field of Human-Computer Interaction (HCI) has several strategies for evaluating a digital system. But these strategies don’t always map well to interactive art installations, as it is not neccessarily easy to combine HCI and art. The HCI methods may not measure aspects in interactive art that is of huge importance for the artist [7], for instance emotions and experiences.
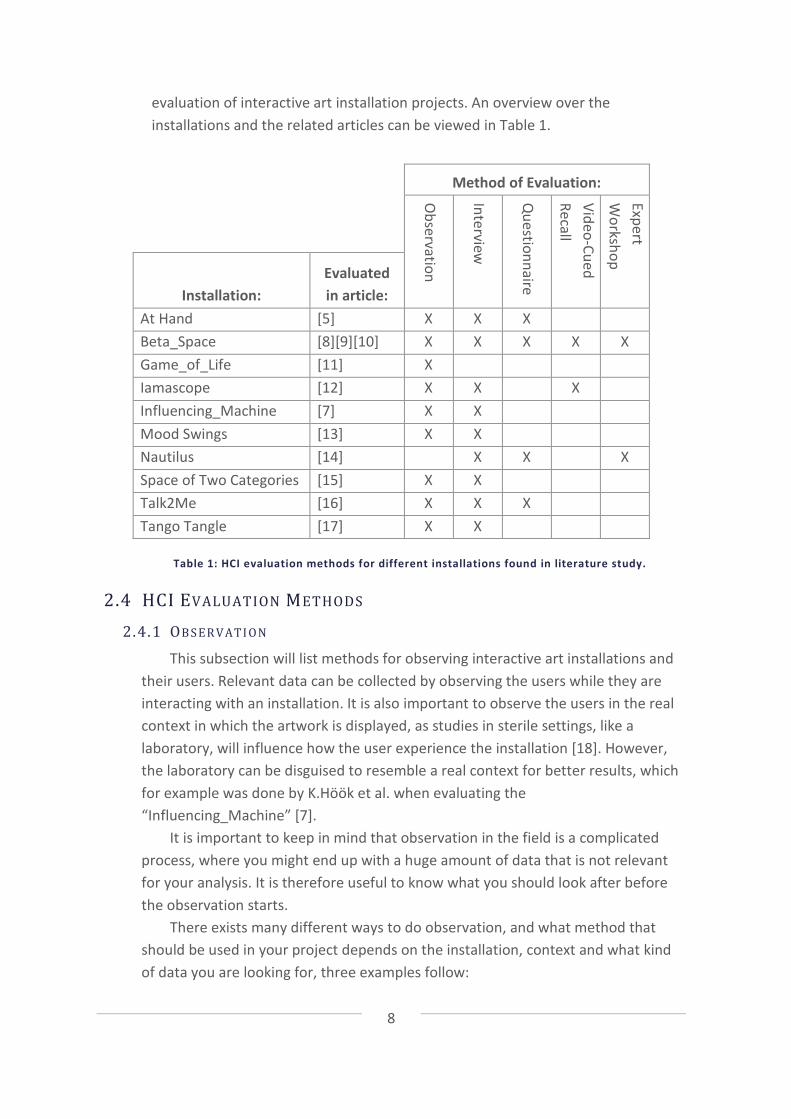
Chapter 2.4 will list and explain some traditional HCI methods that have been used when evaluating interactive art installations by using information gathered from articles on ten different interactive art installations. Chapter 2.5 will focus on new kinds of evaluation methods that may be more appropiate for interactive art installations. The total list of methods can serve as a guide for
8
evaluation of interactive art installation projects. An overview over the installations and the related articles can be viewed in Table 1.
Method of Evaluation:
Observation
Interview
Questionnaire
Video-Cued Recall
Expert W
orkshop
Installation: Evaluated in article:
At Hand [5] X X X Beta_Space [8][9][10] X X X X X Game_of_Life [11] X Iamascope [12] X X X Influencing_Machine [7] X X Mood Swings [13] X X Nautilus [14] X X X Space of Two Categories [15] X X Talk2Me [16] X X X Tango Tangle [17] X X
Table 1: HCI evaluation methods for different installations found in literature study.
2.4 HCI EVALUATION METHODS 2.4.1 OBS ER VATI ON
This subsection will list methods for observing interactive art installations and their users. Relevant data can be collected by observing the users while they are interacting with an installation. It is also important to observe the users in the real context in which the artwork is displayed, as studies in sterile settings, like a laboratory, will influence how the user experience the installation [18]. However, the laboratory can be disguised to resemble a real context for better results, which for example was done by K.Höök et al. when evaluating the “Influencing_Machine” [7].
It is important to keep in mind that observation in the field is a complicated process, where you might end up with a huge amount of data that is not relevant for your analysis. It is therefore useful to know what you should look after before the observation starts.
There exists many different ways to do observation, and what method that should be used in your project depends on the installation, context and what kind of data you are looking for, three examples follow:
9
Shadowing (also known as direct observation) is a method where you directly observe the user, and the user is aware of being observed. This method makes it easier for you to follow the user in her actions, but the awereness of you watching her can influence her behaviour and therefore lead to different data [16] (known as the Hawthorne effect).
The “Fly-on-the-Wall” method hides your presence to a greater extent than shadowing. You “hide” in the context, pretending to read a book or having a conversation with somebody, partially watching the user, thus making the observation become more subtle [16].
The Think-aloud technique addresses the fact that the observer does not know what the user is thinking while interacting with your installation, but can only make guesses based on what is seen. By asking the user to inform you what she is thinking while interacting with the installation, you may gain valuable insight in how she is experiencing it. This technique is a useful way to understand what is going on in the head of the user [18].
2.4.2 INT ERVI EW S
Interviews can range from an oral version of a questionnaire to a informal conversation with the user. Interviews can give you a chance to get a deeper understanding about the user’s experiences after interacting with an installation. Which kind of interview you should conduct depends on what information you want to collect.
Unstructured interviews have many open ended questions and the interviews often end up more as a conversation around a particular topic, as the interviewee is encouraged to speak freely [19]. These interviews can generate rich data in form of a deep and complex understanding of what the interviewee experienced, but the data are also hard to analyze afterwards. There is also a chance that the interviewer gets lost in the conversation and forgets about topics. It is therefore important to have an agenda on what topics that should be covered when conducting a unstructered interview [18].
Structured interviews are similar to a questionnaire where all the questions are predetermined and the same for each user that is interviewed. Short questions with a known range of answers are common in structured interviews and works well when you are after specific data [18].
Semi-structured interviews are a combination of unstructured and structured interviews. There is usually a predetermined set of questions and the interviewer is free to ask follow-up questions for further probing [18].
Focus groups have a discussion among a group of people, typically led by a facilitator. The groups usually consists of a representative sample of users, which can be different age groups, for example. Focus groups often leads to the
10
discovery of issues that otherwise might have been missed. They also encourage people to discuss their personal opinions [18].
2.4.3 QU ESTION NAI R ES
Questionnaires are similar to structured interviews, but can also have open-ended questions. It is a widely used technique for collecting data, but the design and clear language of a questionnaire is crucial in order to avoid misunderstandings, as questionnaires are usually filled out without the opportunity for a researcher to aid the respondent. It is therefore important that the questions in the questionnaire are specific and easy to both relate to and understand. Several HCI questionnaires already exist that are “ready to use”, and provides good methods for analysis. For example the Questionnaire for User Interaction Satisfaction (QUIS) [20], the System Usability Scale (SUS) [21] and the EGameFlow Questionnaire [22] to mention some.
QUIS was originally developed for evaluating user satisfaction, but is often applied to other aspects of interaction design [18] . The questionnaire consists of 12 parts that can be used in total or individually: system experience, past experience, overall user reactions, screen design, terminology and system information, learning, system capabilities, technical manuals and online help, online tutorials, multimedia, teleconferencing and software installation. The third part “overall user reactions” is often used by evaluators, because it is short, so people are likely to respond [18].
SUS was made to evaluate systems in industrial contexts, but are also widely used to test any kind of system that has interacting users. The SUS has also been used to test usability in games, in e.g. [23].
EGameFlow is a scale to measure the enjoyment in educational games. It measures enjoyment by asking questions in eight areas: concentration, goal clarity, feedback, challenge, autonomy, immersion, social interaction and knowledge improvement.
The QUIS, SUS and EGameFlow are Likert scales where the respondent needs to plot his/her agreement on a statement on a point scale that range from 1 to 5 for the SUS, 1 to 7 for the EGameFlow and 1 to 9 for the QUIS.
2.4.4 DAT A R ECO RDI NG
Recording of data are often used together with interviews and observation to help the researcher when doing the analysis afterwards [18]. The most common forms are notes, audio recording, taking photographs and video recording, and they are often combined.
In [18], J. Preece et al. provide a useful table that summarizes and compare the three approaches mentioned above. The table is shown in its entirety in Table 2.

11
Criterion Notes + Camera Audio + Camera Video Equipment Paper, pencil and
camera are easily available
Inexpensive hand-held recorder with a good microphone. Headset useful for easy transcription.
More expensive. Editing, mixing and analysis requirement needed.
Flexibility of use
Very flexible. Unobtrusive.
Flexible. Relatively unobtrusive.
Needs positioning and focusing camera lens. Obtrusive.
Completeness of data
Only get what note taker thinks is important and can record in the time available. Problem with inexperienced evaluators.
Can obtain complete audio recording but visual data is missing. Notes, photographs and sketches can augment recording, but need coordinating with the recording.
Most complete method of data collecting, especially if more than one camera used, but coordination of video material is needed.
Disturbance to users
Very low. Low, but microphone needs to be positioned.
Medium. Camera needs to be positioned on tripod. Care needed to avoid Hawthorne effect.
Reliability of data
May be low. Relies on humans making a good record and knowing what to record.
High, but external noise, e.g. fans in computers, can muffle what is said.
Can be high, but depends on what camera is focused on.
Analysis Relatively easy to transcribe. Rich descriptions can be produced. Transcribing data can be onerous or a useful first step in data analysis.
Critical discussions can be identified. Transcription needed for detailed analysis. Permanent original record that can be revisited.
Critical incidents can be identified and tagged. Software tools are available for detailed analysis. Permanent original record that can be revisited
Table 2: Comparison of the three main approaches to data recording, adapted from J.
Preece et al. [18]
12
2.4.5 INP UT LO GGI NG
Logging input to the system can give you valuable insight in how the installation has been used both in terms of time and how they interacted with it, for instance. There is usually a need for special tools to be able to make sense out of all the data and to be able to do an analysis. The advantage of automatically logging input is that the user is unaware of being recorded, and it does not influence their experience. There is however ethical issues related to the fact that the user is being watched without knowing it [18].
2.4.6 CO MBI NING MET HO DS
It is common to combine multiple of the methods mentioned above to be able to do a good evaluation and triangulate findings [18]. What methods to combine largely depends on what you are going to evaluate the focus of the study, participants, context and available resources. In the reviewed articles, the most common combination includes observation, interviews and video/audio recordings.
2.5 EXPERIMENTAL EVALUATION METHODS The methods described in this chapter have been explored by others when
evaluating interactive art installations, and are documented in various articles.
2.5.1 VIDEO-CU ED RECALL MET HOD
Also known as retrospective reporting and was used when evaluating several installations found in Beta_Space [12][8][9][10]. For example the installation “Iamascope” [12]. The method might resemble the video data recording method mentioned in chapter 2.4.4, but it includes usage of the video camera in a more innovative manner.
Video-cued recall is about recording video of the user interacting with an installation and showing this video to the user afterwards, encouraging the user to directly reflect upon her actions. A common way of capturing the user’s actions is to mount a camera on their body to be able to observe them in a first-person perspective. It is wise to modify how you capture the user’s experience based on what kind of installation you are evaluating.
When this method was used with “Iamascope”, the evaluators chose to record in a third person perspective, as this installation required a full-body movement as input [12]. The user of “Iamascope” were captured on video as she used the installation, and were brought into a private room afterwards for a retrospective report. The user was shown the video and were asked to try to spontaniously recall what she were thinking at the time. An interviewer will only ask her questions regarding what she is seeing if she falls silent. This process was also recorded on video by recording both the screen that the user was looking at
13
and their comments to accurately match the two. After the retrospective report in the evaluation of “Iamascope”, a brief semi-structured interview was conducted to gain insight in personal profile details and to give the opportunity to express opinions about the exhibition.
2.5.2 EXP ERI EN CE WO RKS HO P
The experience workshop [24] is an evaluation method where experts (or professionals) are invited to experience and discuss the interactive system [10]. In [9] E. Edmonds et al. brought in experts from the fields of art, curating, human movement, science and interaction design.
The workshop starts with “setting the scene” by explaining the research project and introducing the experts to each other. In addition to the experts, there should also be one moderator that can fascilitate and lead the workshop.
The first phase of the workshop is to create a “language bridge” by asking the experts to describe how they experienced their interaction with the installation. The other experts listen to each others descriptions and note down the experiences that concurred or contradicted with their own experience. They were free to mark them with “positive” or “negative”.
In the second phase, the artist presents eight experiential goals to the experts. The experts are then asked to assign the notes that they created in the first phase to the experiental goals. The goal for this phase is to find out if the expert’s own experiences coincides with the experiental goals, and if they do, what language was used and if it was marked with “positive” or “negative”.
The focus of the next phase is to discuss the findings in phase two. The facilitator, the artist and the experts should all join in for this discussion to reflect on their experiences, but also focus on gaps and coincidences. The goal of this phase is to look at and compare the artist’s goals for an “ideal” experience with the experts’ (audience) “real” experiences [24].
2.6 DISCUSSION OF METHODS How the artist’s message is received by a user is highly subjective, as well as
how the user experiences the installation. Zafer Bilda states in [17]:
«Level of engagement with an interactive artwork depends on various factors such as aesthetic satisfaction, and how the audience constructs meaning, pleasure and enjoyment. Evaluating such experiences remains an open research problem.»
An HCI perspective on user interaction is often by measuring usability of a system and whether the average user easily can understand and use it effeciently. From an artist’s point of view, applying raw HCI methods to evaluate an artwork would not make much sense. An interactive installation artist is interested in the
14
individual experiences and perceptions that the users get when interacting with her artwork.
The field of HCI has its origin from science and engineering - where being objective is strived for. Interpretation of art, on the other hand, has always been highly subjective. But even if it’s not in the nature of the artist to systematically evaluate her artwork, as it is done with information systems and traditional user interfaces, it can be very useful to gain insight in how users react to her artwork and how they are using it when interactivity is involved.
When evaluating an interactive art installation by collecting data from users through for example observation, interviews and questionnaires, there is always the risk that the users can not recall exactly what they did or what they felt at the time:
«“What users say isn’t always what they do. When asked a question, people sometimes give the answers that they think show them in the best light, or they may just forget what happened or how long they spent on a particluar activity.» [18].
The users of an interactive art installation usually express emotions unconsciously, and unconscious reactions to the installation are hard to capture later on in interviews or questionnaires.
It is important to consider this when evaluating an interactive art installation, as the user is usually interacting with an unusual interface, and the artist has a message that she wishes to communicate.
Chapter 2.4.6 introduced the concept of combining different HCI methods. Together with the literature review, it’s easy to observe that using a “multi-method strategy” is the way to go when evaluating interactive art installations in order to cover multiple aspects of the installation, like experience, understanding, emotions, immersion and so on.
But the methods introduced in chapter 2.5 takes them to a new level. The video-cued recall method innovatively use cameras, video and interviews to effeciently evaluate the installations. The results from “Iamascope” [12] tells us that this method is useful for understanding the situated experience of interactive art, and that it definitively helps the users remember why they acted the way they did when using the installation.
A concern with the use of the video-cued call method is that imposing a camera on the user will affect their behaviour, making them aware of being observed and that they act accordingly. The B.Costello et al. found this concern to be true, but some users indicated that they became so immersed that they forgot about the camera [12].
15
In [2] A. Trifonova et al. recommend that an iterative approach to evaluating an interactive art installation to achieve the artist’s desired effect. To ensure the quality of experience, test audiences are also suggested. These audiences should be as close to the potentional final user group as possible. But in order to get constructive criticism, an experience workshop is a good way to go.
The “Experience Workshop” introduced in chapter 2.5.2 gives the opportunity to get a deep understanding on how “experts” experience the installation. The group can uncover unforeseen effects with the installation, that may not have been discovered by other means. The experience workshop is a powerful tool in the means that the artist recieves valuable feedback on her experiential goals, their operation within the installation and their usefulness.

16
3 EMPIRICAL STUDY 3.1 INTRODUCTION
This is an analysis of an exhibition that were held on the 24th and 25th of September 2011 during the Norwegian Science Week (Forskningsdagene) at NTNU’s Science museum. The installations that were exhibited were based on the installation “Water Me” (“Vann Meg”), which is a result of a project carried out in the course “Experts in Teamwork” at NTNU during spring 2011 [25].
In this project we made an interactive art installation which goal was to make children aware of the balance of water in nature. This goal was a direct result of Liv Arnesen’s visions about the global water challenge and engaging youth around the world about this matter. Our target group was children, and the decorations and graphics were both directed against children in an attempt to appeal to them.
A software application was developed for this project, and it was modified for this exhibition to create an abstraction over user input, allowing it to function with different input devices. This ended up in two interactive art installations that were driven by the same software application.
3.2 RESEARCH CONTEXT 3.2.1 BUT TON BA S ED IN ST A LLA TION
The button based installation consists of a wooden box that houses a projector, a laptop with the running application, a power supply and three buttons. The three buttons control the flow of water where the upper button increases the amount of water, the bottom one decreases the amount of water and the middle one restores the amount of water to a predefined “balance”. The buttons can be seen in Figure 1, and were made by connecting three arcade buttons to a microcontroller with a built-in USB module that was connected to the laptop [25].
Figure 1: Buttons on the button based installation
17
3.2.2 TOU CH S CREEN I NST A LLA TION
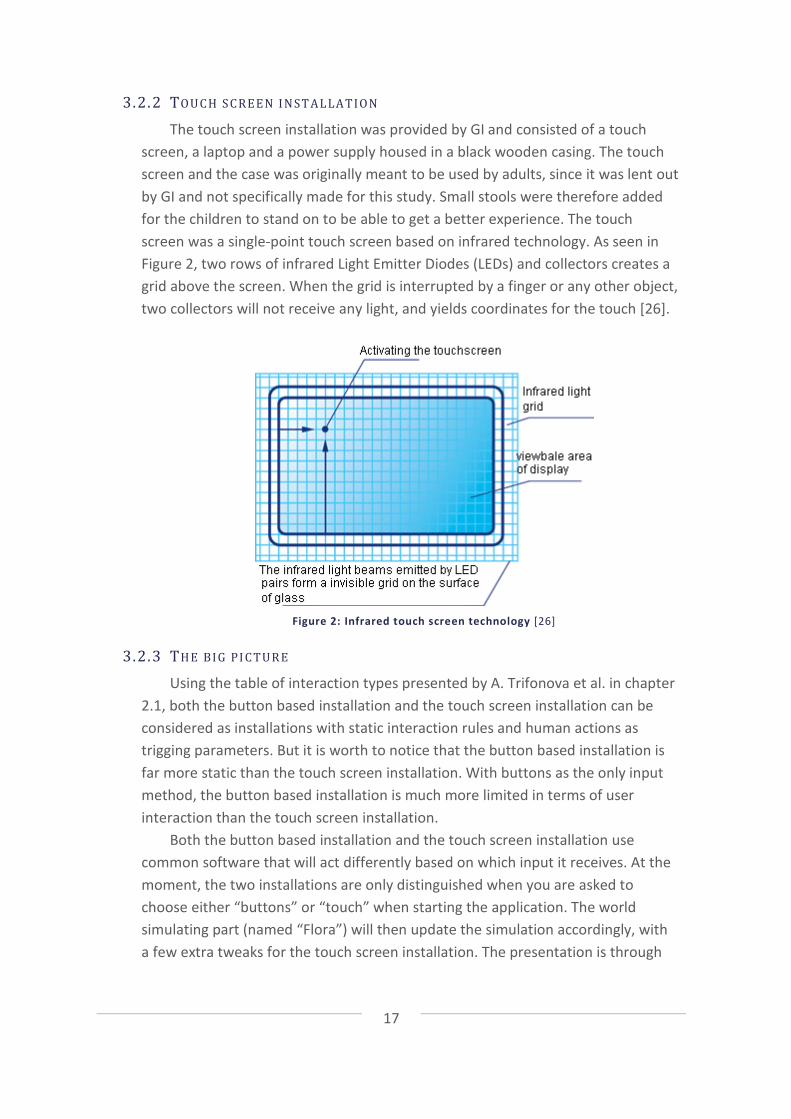
The touch screen installation was provided by GI and consisted of a touch screen, a laptop and a power supply housed in a black wooden casing. The touch screen and the case was originally meant to be used by adults, since it was lent out by GI and not specifically made for this study. Small stools were therefore added for the children to stand on to be able to get a better experience. The touch screen was a single-point touch screen based on infrared technology. As seen in Figure 2, two rows of infrared Light Emitter Diodes (LEDs) and collectors creates a grid above the screen. When the grid is interrupted by a finger or any other object, two collectors will not receive any light, and yields coordinates for the touch [26].
Figure 2: Infrared touch screen technology [26]
3.2.3 THE BIG PI CTU R E
Using the table of interaction types presented by A. Trifonova et al. in chapter 2.1, both the button based installation and the touch screen installation can be considered as installations with static interaction rules and human actions as trigging parameters. But it is worth to notice that the button based installation is far more static than the touch screen installation. With buttons as the only input method, the button based installation is much more limited in terms of user interaction than the touch screen installation.
Both the button based installation and the touch screen installation use common software that will act differently based on which input it receives. At the moment, the two installations are only distinguished when you are asked to choose either “buttons” or “touch” when starting the application. The world simulating part (named “Flora”) will then update the simulation accordingly, with a few extra tweaks for the touch screen installation. The presentation is through
18
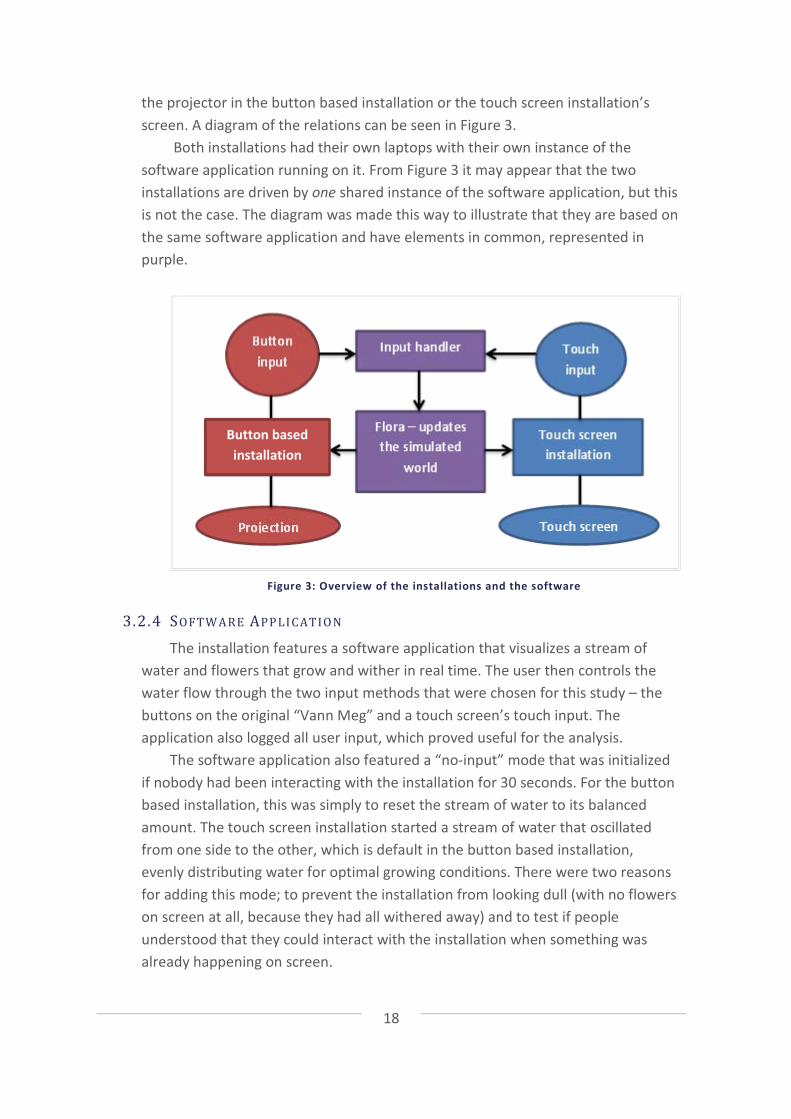
the projector in the button based installation or the touch screen installation’s screen. A diagram of the relations can be seen in Figure 3.
Both installations had their own laptops with their own instance of the software application running on it. From Figure 3 it may appear that the two installations are driven by one shared instance of the software application, but this is not the case. The diagram was made this way to illustrate that they are based on the same software application and have elements in common, represented in purple.
Figure 3: Overview of the installations and the software
3.2.4 SOFTW A RE APP LI CATIO N
The installation features a software application that visualizes a stream of water and flowers that grow and wither in real time. The user then controls the water flow through the two input methods that were chosen for this study – the buttons on the original “Vann Meg” and a touch screen’s touch input. The application also logged all user input, which proved useful for the analysis.
The software application also featured a “no-input” mode that was initialized if nobody had been interacting with the installation for 30 seconds. For the button based installation, this was simply to reset the stream of water to its balanced amount. The touch screen installation started a stream of water that oscillated from one side to the other, which is default in the button based installation, evenly distributing water for optimal growing conditions. There were two reasons for adding this mode; to prevent the installation from looking dull (with no flowers on screen at all, because they had all withered away) and to test if people understood that they could interact with the installation when something was already happening on screen.
Button based installation
19
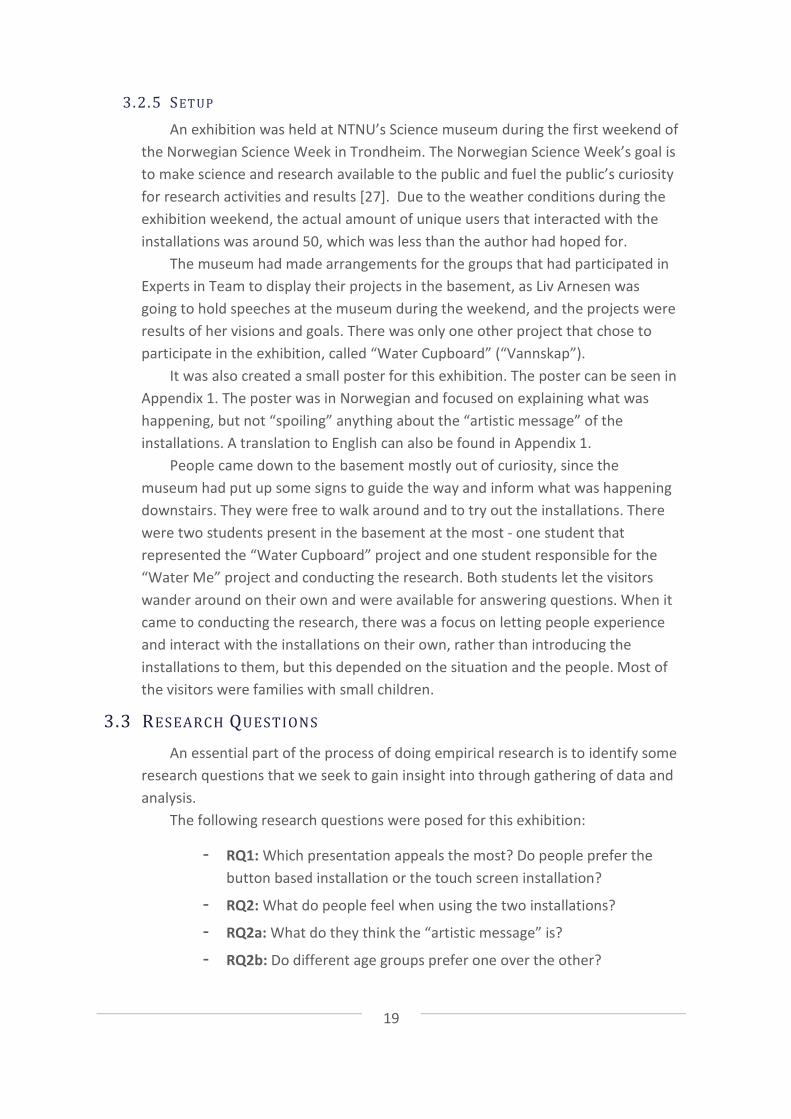
3.2.5 SET UP
An exhibition was held at NTNU’s Science museum during the first weekend of the Norwegian Science Week in Trondheim. The Norwegian Science Week’s goal is to make science and research available to the public and fuel the public’s curiosity for research activities and results [27]. Due to the weather conditions during the exhibition weekend, the actual amount of unique users that interacted with the installations was around 50, which was less than the author had hoped for.
The museum had made arrangements for the groups that had participated in Experts in Team to display their projects in the basement, as Liv Arnesen was going to hold speeches at the museum during the weekend, and the projects were results of her visions and goals. There was only one other project that chose to participate in the exhibition, called “Water Cupboard” (“Vannskap”).
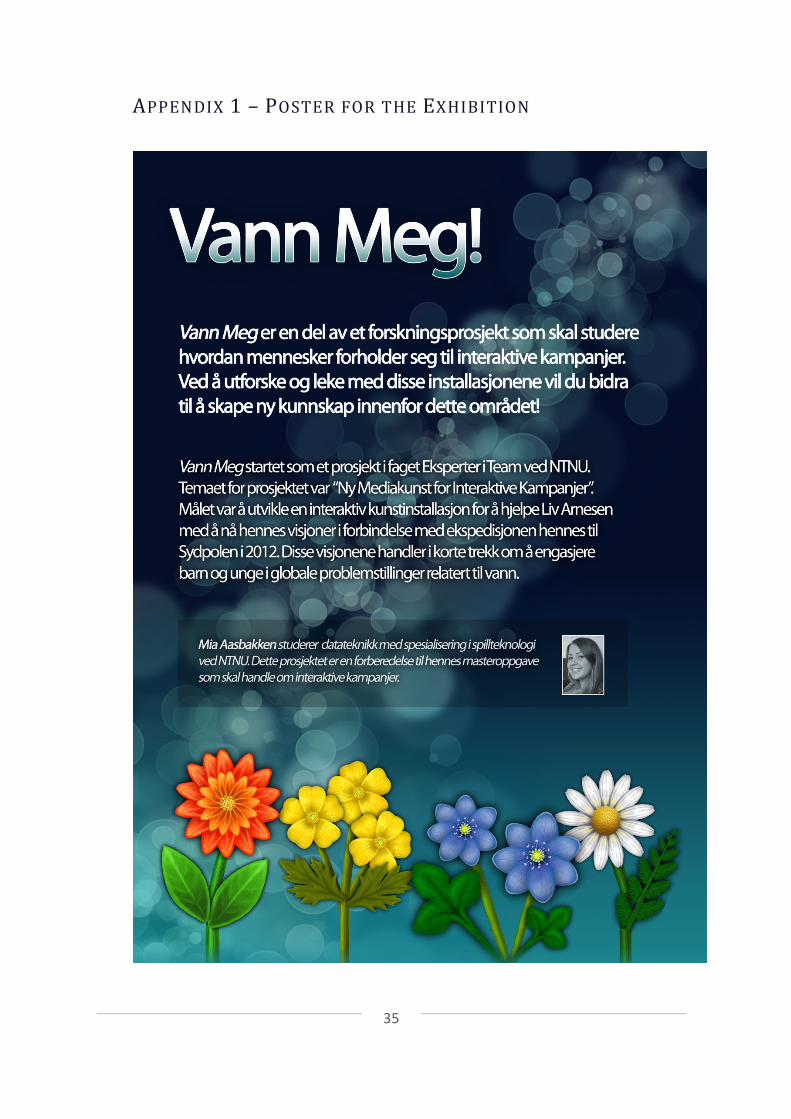
It was also created a small poster for this exhibition. The poster can be seen in Appendix 1. The poster was in Norwegian and focused on explaining what was happening, but not “spoiling” anything about the “artistic message” of the installations. A translation to English can also be found in Appendix 1.
People came down to the basement mostly out of curiosity, since the museum had put up some signs to guide the way and inform what was happening downstairs. They were free to walk around and to try out the installations. There were two students present in the basement at the most - one student that represented the “Water Cupboard” project and one student responsible for the “Water Me” project and conducting the research. Both students let the visitors wander around on their own and were available for answering questions. When it came to conducting the research, there was a focus on letting people experience and interact with the installations on their own, rather than introducing the installations to them, but this depended on the situation and the people. Most of the visitors were families with small children.
3.3 RESEARCH QUESTIONS An essential part of the process of doing empirical research is to identify some
research questions that we seek to gain insight into through gathering of data and analysis.
The following research questions were posed for this exhibition:
- RQ1: Which presentation appeals the most? Do people prefer the button based installation or the touch screen installation?
- RQ2: What do people feel when using the two installations?
- RQ2a: What do they think the “artistic message” is?
- RQ2b: Do different age groups prefer one over the other?
20
- RQ2c: Do children prefer the button based installation (unusual box with simple buttons)?
3.4 ANALYSIS 3.4.1 DAT A CO LLECTIO N MET HOD S
Data was collected through four methods from the field of HCI: observation, interview, questionnaires and input logging. Since there was only one student available to collect these data in this study, namely the author, the collected amount of data was a bit limited. 18 questionnaires were answered, one interview was recorded through audio and nine notes were taken during the weekend. There was also recorded four videos and taken 17 pictures (where 8 was decided to be usable) from the exhibition.
When dealing with user studies and especially when recording data from the users, privacy issues emerge. The standard way of dealing with such issues is to get the users to sign a consent form or even publically announce that a data collection is going to happen. In this research, the collected data did not involve any sensitive information. The questionnaires were all anonymous, and you could not trace the answers back to a specific person. As for the photographs, permission was given to take and use the photos/videos for this report. In addition to this, the people in the chosen photographs are not easily recognized.
The style of observation usually ended up in shadowing (methods described in chapter 2.4.1), even though the “fly-on-the-wall” approach was strived for. The context did not allow the “fly-on-the-wall” approach to be used that much, because there were usually few people in the room, and “pretending” to do something else while the visitors tried the installation felt a bit off. A discrete version of shadowing was used, by keeping distance to the users, but still observing them directly.
3.4.2 OBS ER VATI ONS
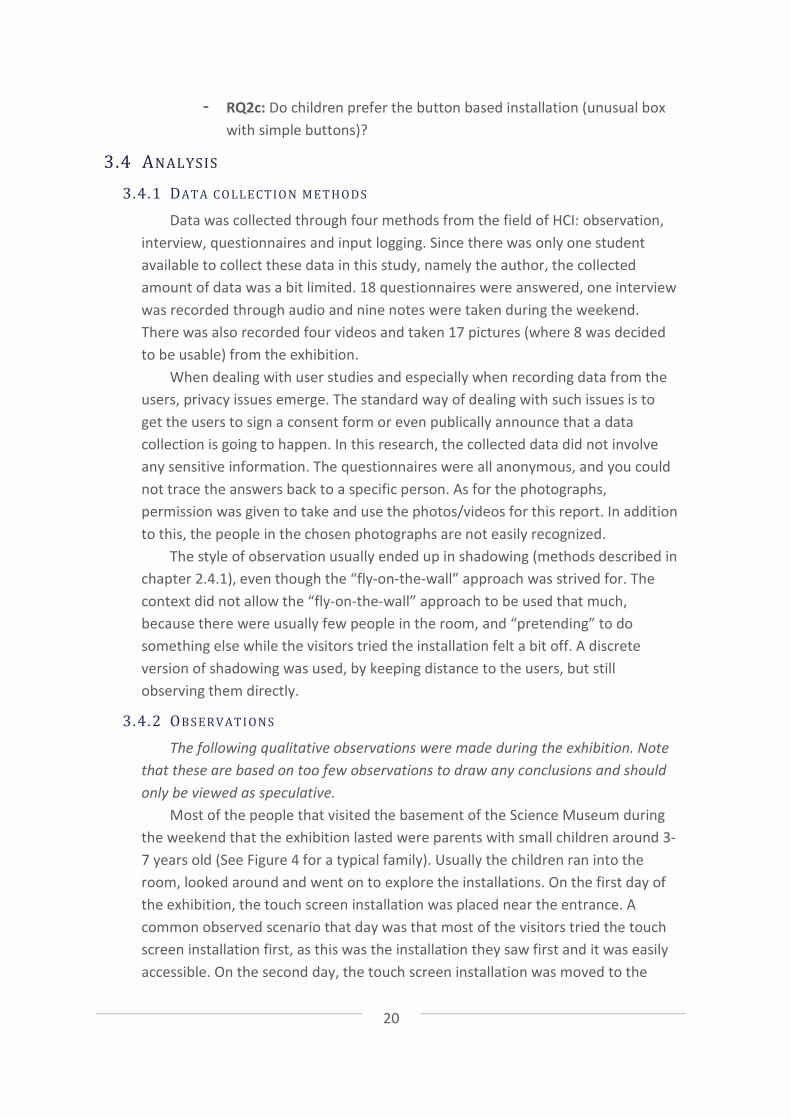
The following qualitative observations were made during the exhibition. Note that these are based on too few observations to draw any conclusions and should only be viewed as speculative.
Most of the people that visited the basement of the Science Museum during the weekend that the exhibition lasted were parents with small children around 3-7 years old (See Figure 4 for a typical family). Usually the children ran into the room, looked around and went on to explore the installations. On the first day of the exhibition, the touch screen installation was placed near the entrance. A common observed scenario that day was that most of the visitors tried the touch screen installation first, as this was the installation they saw first and it was easily accessible. On the second day, the touch screen installation was moved to the
21
other side of the room to see if the location had any impact on which installation they tried first. It was observed that people wandered more around in the room on the second day, and that many chose to stand and simply watch the projection from the button based installation on the wall - without trying to interact with any of the installations. But on the first day, most of the visitors tried the touch screen installation, and wondered if they could affect the projection from the button based installation by playing on the touch screen.
The reason for this behavior may be because of the “no input” mode that the application went into when it had not been used for a while. From the observations made, it looked like people saw the installations as very non-interactive when they were in “no-input” mode. Most of the people stood and watched the installations as they would watch an art piece at a museum, reacting with surprise when being told that they could interact with it.
The children were by far the most engaged users of the installations. The parents showed a bit of interest at first, often followed by showing their children how they could interact with the installation, and then most of them enjoyed playing with it together. Some parents sat down to relax a bit while their children played, and some mothers commented on how they liked the pleasant graphics and that it was suitable for children with its bright colors and semi realistic look.
Both young boys and girls seemed to enjoy the installations equally as much, but older boys showed signs that they thought it was too childish or too “girly”. More than one young boy set the water flow to the maximum amount, and expressed that it was cool to drown all the flowers. Older girls did not seem to mind the childishness, and were eager to try out the installations. A group of female students (around 24 years old) even organized themselves in a line to try out the two installations.
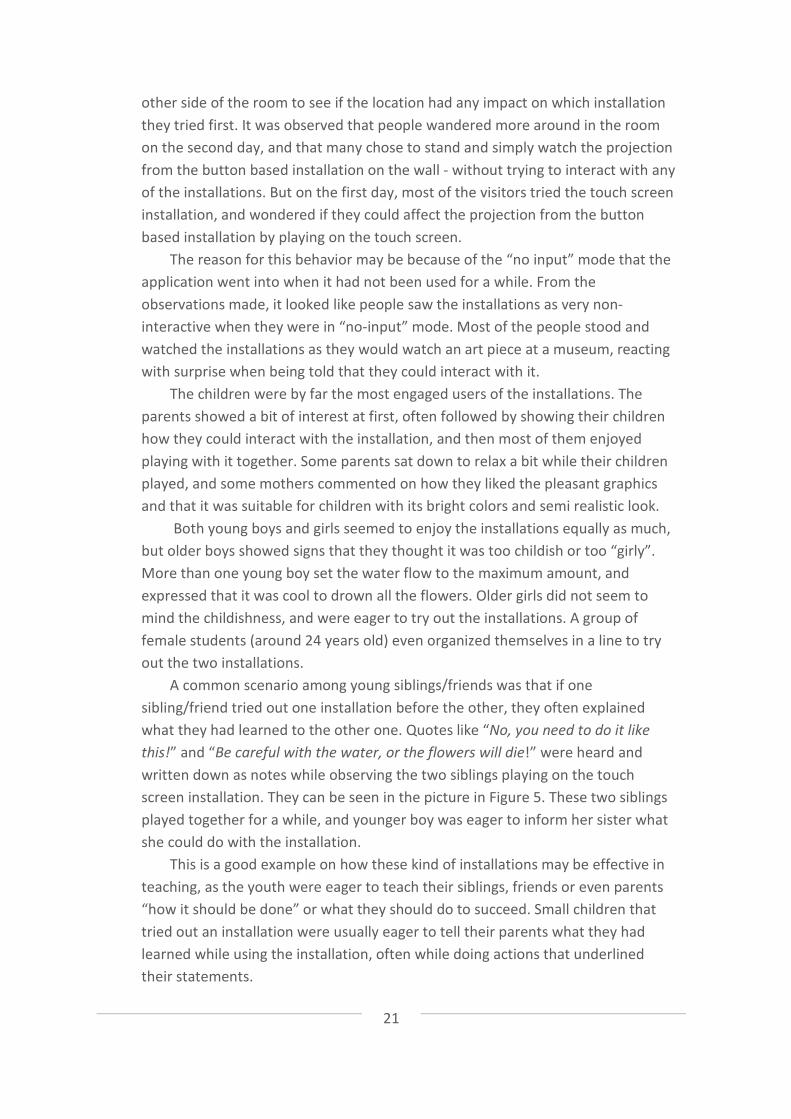
A common scenario among young siblings/friends was that if one sibling/friend tried out one installation before the other, they often explained what they had learned to the other one. Quotes like “No, you need to do it like this!” and “Be careful with the water, or the flowers will die!” were heard and written down as notes while observing the two siblings playing on the touch screen installation. They can be seen in the picture in Figure 5. These two siblings played together for a while, and younger boy was eager to inform her sister what she could do with the installation.
This is a good example on how these kind of installations may be effective in teaching, as the youth were eager to teach their siblings, friends or even parents “how it should be done” or what they should do to succeed. Small children that tried out an installation were usually eager to tell their parents what they had learned while using the installation, often while doing actions that underlined their statements.
22
Figure 4: typical visitors - a small family with children
Figure 5: Two siblings playing together, learning from each other
23
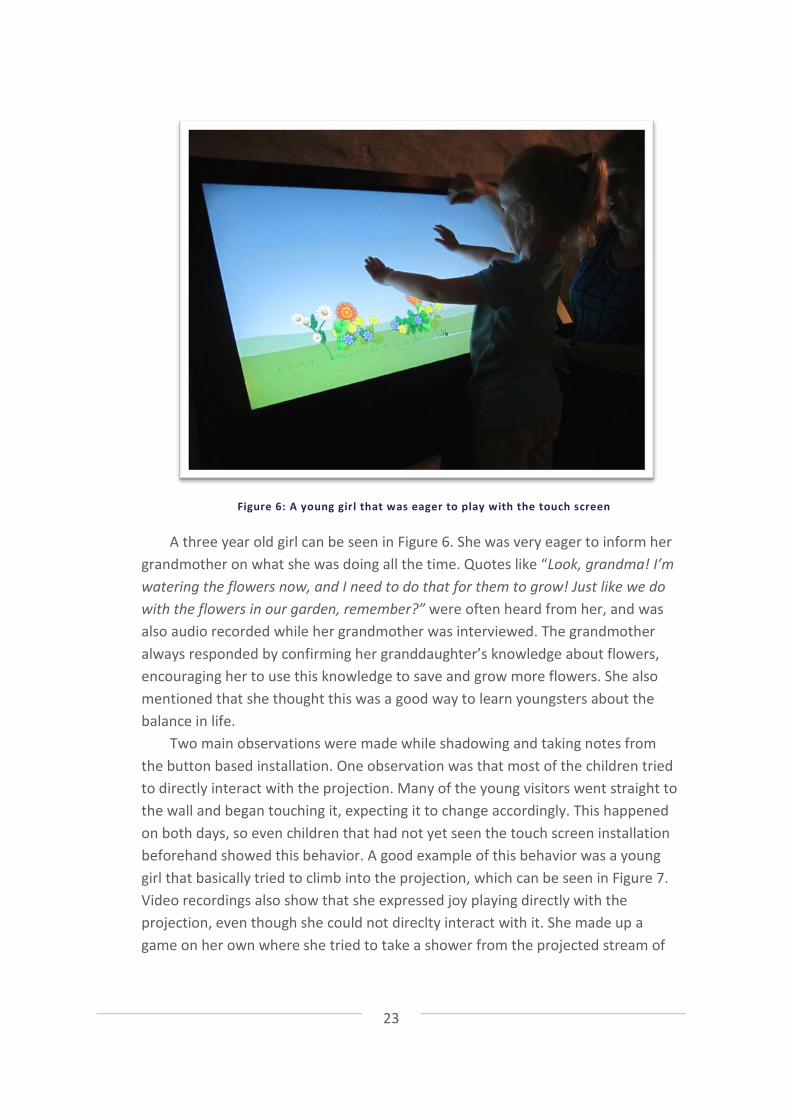
Figure 6: A young girl that was eager to play with the touch screen
A three year old girl can be seen in Figure 6. She was very eager to inform her grandmother on what she was doing all the time. Quotes like “Look, grandma! I’m watering the flowers now, and I need to do that for them to grow! Just like we do with the flowers in our garden, remember?” were often heard from her, and was also audio recorded while her grandmother was interviewed. The grandmother always responded by confirming her granddaughter’s knowledge about flowers, encouraging her to use this knowledge to save and grow more flowers. She also mentioned that she thought this was a good way to learn youngsters about the balance in life.
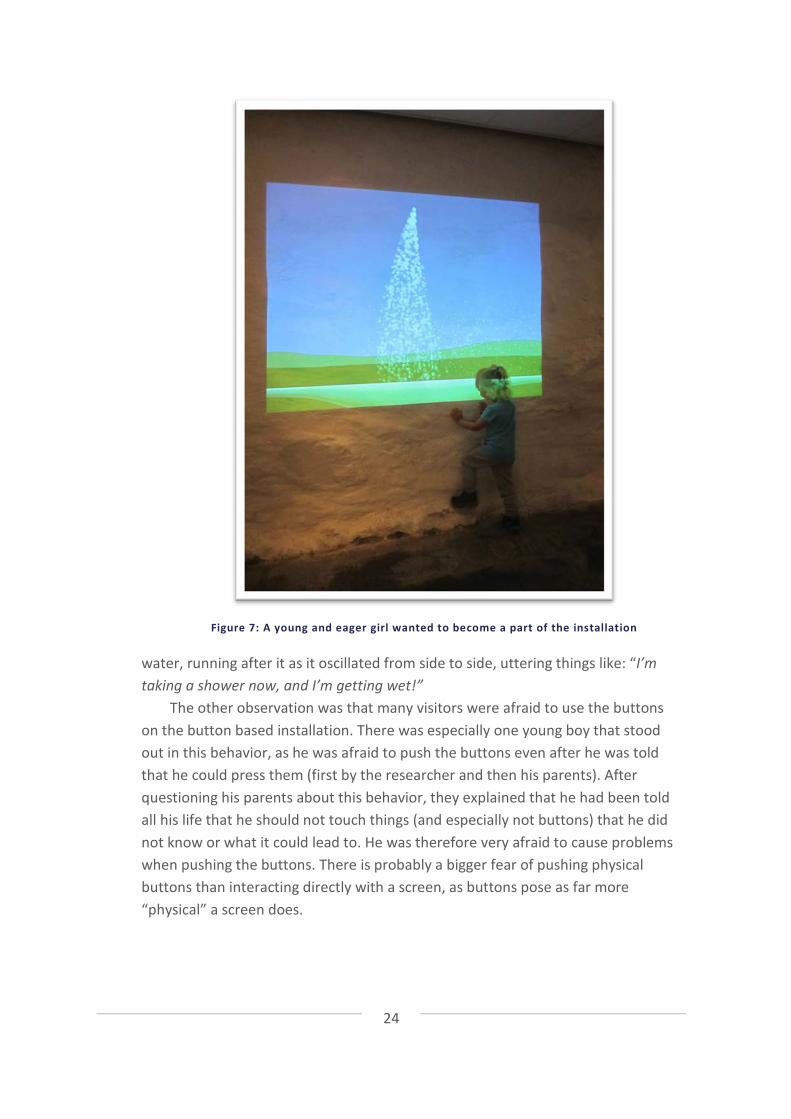
Two main observations were made while shadowing and taking notes from the button based installation. One observation was that most of the children tried to directly interact with the projection. Many of the young visitors went straight to the wall and began touching it, expecting it to change accordingly. This happened on both days, so even children that had not yet seen the touch screen installation beforehand showed this behavior. A good example of this behavior was a young girl that basically tried to climb into the projection, which can be seen in Figure 7. Video recordings also show that she expressed joy playing directly with the projection, even though she could not direclty interact with it. She made up a game on her own where she tried to take a shower from the projected stream of
24
Figure 7: A young and eager girl wanted to become a part of the installation
water, running after it as it oscillated from side to side, uttering things like: “I’m taking a shower now, and I’m getting wet!”
The other observation was that many visitors were afraid to use the buttons on the button based installation. There was especially one young boy that stood out in this behavior, as he was afraid to push the buttons even after he was told that he could press them (first by the researcher and then his parents). After questioning his parents about this behavior, they explained that he had been told all his life that he should not touch things (and especially not buttons) that he did not know or what it could lead to. He was therefore very afraid to cause problems when pushing the buttons. There is probably a bigger fear of pushing physical buttons than interacting directly with a screen, as buttons pose as far more “physical” a screen does.
25
3.4.3 QU ESTION NAI R ES
The questionnaire was made out of a combination of statements that was picked from both the System Usability Scale (SUS) [21] and EGameFlow [22] questionnaires and full text questions. Since the installations are not directly E-learning games nor a “normal” information system, but more focused on sending out a message to the user and trying to evoke emotions and thought, the questions were modified to a certain degree to better fit the projects. The statements picked from the SUS were: “I found the system unnecessarily complex” and “I would imagine that most people would learn to use this system very quickly”. They were rewritten to not focus on “system” but rather “the installation”, as this will be easier for the respondents to understand, as the installations do not look or feel as traditional systems as this test was designed for. The questions from the EGameFlow’s eight areas was primarily from the area named “Immersion”. The questions from the immersion area focuses on what degree the game leads it’s user into immersion. The statements that was picked from the EGameFlow were: “I forget about time passing while playing the game”, “I become unaware of my surroundings while playing the game” and ”I feel viscerally involved in the game”. Again, the word “game” were replaced with “installation”. The EGameFlow scale was designed to be a point scale from 1 to 7, but to avoid confusion and a messy questionnaire, the 1 to 5 scale was used.
Originally, both scales will give the tested system or game a score, but to make any sense of the score, all statements need to be present and evaluated as a whole. Because the statements were hand picked to make a small questionnaire, it will not be possible to get a SUS score or a EGameFlow score.
There were also some questions that asked for full text answers. These focused on what the respondent thought the artistic message was and which other environments that might be appropiate installations of this type. The whole survey can be found in Appendix 2. It was originally in Norwegian, but was translated into English for this report. 18 people answered the survey, but not all questions were answered by all respondents.
Before the exhibition started, the idea for the questionnaires was to let people choose one of the installations, try it out and then answer a questionnaire. By doing this, some noise about which installation that was preferred would have been eliminated, and it would be interesting to see which installation they chose.
The approach that was used was to let people try whatever they wanted to try, shadowing them and taking notes while they tried the installations. If the visitors showed signs that they had time and opportunity to fill out a questionnaire, they were asked if they wanted to participate and were handed a questionnaire if they responded positively. Not all visitors wanted this, as they were busy keeping track
26
of their children or were just briefly trying out the installations and decided to move on quickly.
The visitors that answered the questionnaire were mostly parents and students. Some parents also answered on behalf of their child. 50% of the answers were from women. Most of the visitors answered that the installations were very easy to use and that the installations was not complicated at all. When it came to the immersion scale questions from EGameFlow [2], people had some mixed answers, but most of the answers were tilted more against “strongly agree” than “strongly disagree”. The immersion statement that overall had the most agreeing answers was “I feel viscerally involved in the installation”. The average answer for this statement was 4 out of 5, where 5 was “I strongly agree”.
The most interesting result from the questionnaire was from the full text questions. One of the questions were: “What do you think is the artistic message for this installation?”. Many answers were of the kind “climate changes”, “the balance between life and death”, “water is important” or “plants need the right amount of water”. More interesting answers were of the type “empathy, learn to value life even though it’s in an electronic form” and “learning about how water affects its surroundings”. Based on the notes that were made from observing the users of the installations, many users showed feelings of empathy when watering the flowers, and tried hard to keep them alive. Many visitors also used the installations to teach their children about how important it is for flowers to have access to water.
Another full text question asked: “Can you image this installation in other settings? Where would that be?”. Most of the answers were oriented towards teaching and usage in schools. Others answered that they imagined the installations being put up in public spaces like shopping streets, airports, bus stops, waiting rooms and museums or other places were families spend their time.
3.4.4 INT ERVI EW
There was only one interview that was conducted during this study, and was with the grandmother of the young girl in Figure 6. The interview was a semi-structured interview, loosely based on the questions found in the questionnaire, and included follow-up questions as the interview went on.
The woman that was interviewed was around 60 years old and visited the museum with her granddaughter. They had been trying out the touch screen installations for about ten minutes when she was asked to do a short interview. When confronted about what she thought about the installation and its message, she replied: “I find it very educative for my granddaughter. This is exactly what we have been doing at home. We sowed seeds, watered and fertilized them, and then watched them sprout and grow”. She also added “Take care of nature” when
27
asked for the artistic message. “Since I have worked as a florist, I’ve been teaching her a lot about flowers”, she explained while reflecting upon why she liked the concept of the installation and its style.
Both grandmother and granddaughter displayed a lot of positive emotions while using the installation both during and after the interview. They smiled and enjoyed themselves, as well as laughing while playing. The granddaughter even invented her own small games by using the installation and her imagination. By concentrating a lot of water in one place, she had “created mud cakes”, as she explained to her grandmother while the interview was being recorded. The grandmother was then asked if she felt any particular emotions while using the installation: “Yes! It makes me happy! I disconnect from my problems in daily life and my head feels good”. This can be an indication that people really relax while using interactive art installations that have goals like evoke emotions in their users. Even adults can immerse themselves and disconnect from the world.
She also points out that she thinks it is a good tool for small children to learn about nature and how to take care of it. When asked about other settings this type of installation would fit into and where it could be of use, she answered how she thinks primary schools may benefit from such installations. She has noticed that more and more primary schools have issues with the children’s concentration and dyslexia, and concludes with: “It’s not a bad idea to use this when teaching. Then it’s easier for the troubled children to understand”.
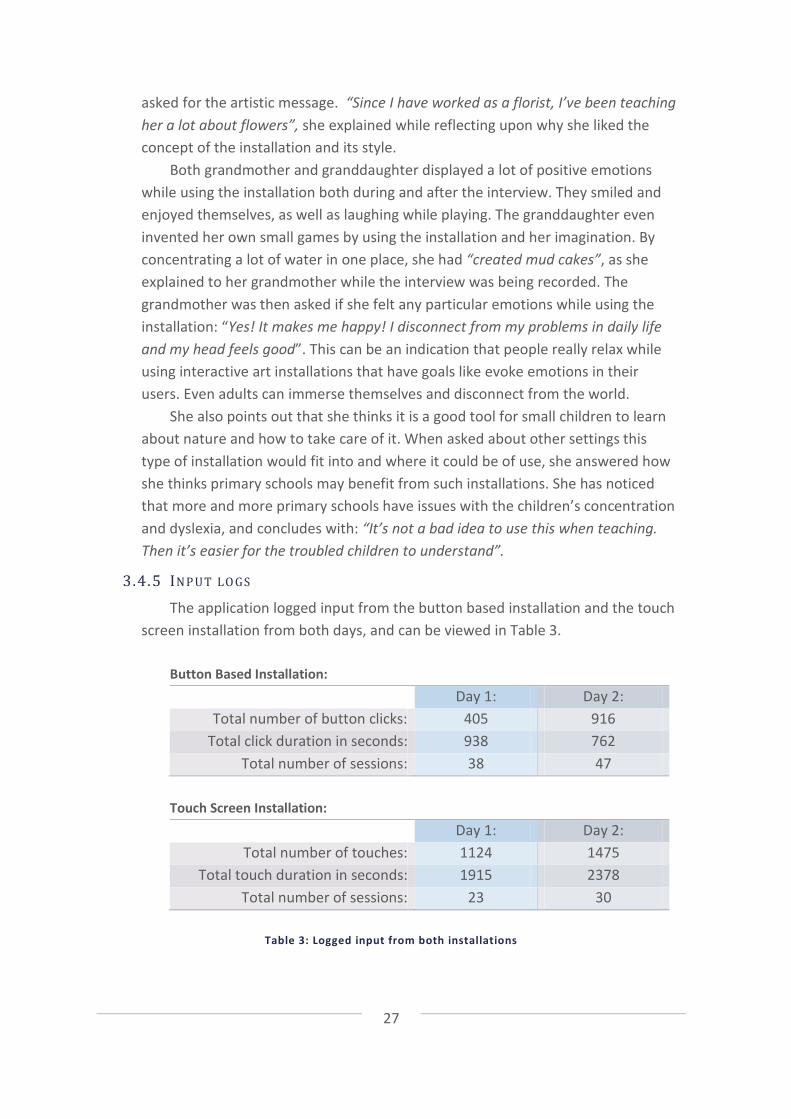
3.4.5 INP UT LO GS
The application logged input from the button based installation and the touch screen installation from both days, and can be viewed in Table 3.
Button Based Installation: Day 1: Day 2:
Total number of button clicks: 405 916 Total click duration in seconds: 938 762
Total number of sessions: 38 47 Touch Screen Installation: Day 1: Day 2:
Total number of touches: 1124 1475 Total touch duration in seconds: 1915 2378
Total number of sessions: 23 30
Table 3: Logged input from both installations
28
It is easy to see that the touch screen installation was the most used installation, both in number of touches and duration in seconds. A session was defined to start when the installation received input after 20 seconds of inactivity.
Out of the two chunks of statistics, the number of touch sessions is the most relevant one. The reason for this is that people seldom let go of their touch when interacting with the touch screen, compared to the buttons where a short click is enough. A possible reason for why the touch installation has double, almost triple, the amount of usage in seconds can be that it featured a higher level of interactivity by letting the user control the position and direction of the water stream. The button based installation was more static - since the only way you could affect the water flow was by increasing or decreasing it by pushing buttons.
It does not seem like the placement of the installations had a big role by looking at the statistics. On day one the touch screen installation was closest to the entrance, and was moved to the other side of the room on day two. The button based got a few more clicks on the second day, but overall the touch screen installation got most of the attention this day, as well as on the first day.

29
4 RESULTS 4.1 RESULTS FROM THE EMPIRICAL STUDY
Which installation that appealed the most after this weekend at the museum is not easily deduced. From the input logs presented in chapter 3.4.5, it would seem that the touch screen installation was the most popular one, both in time spent on it and the number of physical interactions. But might that be because of people’s familiarity with touch screens? When children understood that they could interact with the button based installation, they showed a lot of eagerness and joy playing with it too. Some children also tried to interact with the button based installation in other ways, and even if it didn’t affect the installation, they still enjoyed playing with it in their own way.
People showed signs of empathy and immersion when using the installations. Many wanted to keep the flowers alive, others wanted to get rid of them by pouring too much water on them. Most of the children showed joy and were eager to explain what they have found out to their parents, siblings or friends. The parents often watched their children play and/or played together with them.
The answers collected from the questionnaires showed that most of the respondents believed that the artistic message was about balance in life, the importance of water and that plants need the right amount of water to live. But some also answered on an philosophical level, like “empathy for digital life forms”.
Before this study was conducted, the author’s hypothesised that the button based installation would be more popular among small children than the touch screen installation. She thought that the unusual appereance would appeal more to them, as this is not something you encounter often in your daily life. It was observed that some children were in fact a bit “afraid” of the button based installation to begin with, and were drawn to the familiar touch screen in stead. Many assumed that the button based installation was either connected to the touch screen installation or looked at it as a traditional art piece, similar to those found in a gallery.
The children were far the most eager users of the installations, but there were also some young adults that enjoyed playing with the touch screen installation, and even organized themselves in a small queue in order to try it out, since the touch screen only supported one user at a time.
4.2 A NEW METHOD A new method for evaluating an interactive art installation and how it is
percieved by the audience is suggested in this chapter. It is a method that can help the artist find better ways of communicating her message to the audience,
30
and can also be applied to interactive campaigns in order to reach users in more effective ways.
The method was discovered when conducting the empirical research mentioned in chapter 3. The software part of the installations that were exhibited were essentially the same, but the appereance of the two installations were very different. There were differences in user behaviour when interacting with the different installations. It was not very clear during the exhibition, but got more apparent when analyzing the users’ interactions with the installations and through notes and video recordings. The author was also the artist behind the software application that was presented through these two installations, and did not anticipate this difference in behaviour. The users behaved more “formally” when they interacted with the button based installation compared to the touch screen installation. Their interpretation of the “artistic message” was also different. As the button based installation was decorated with water and “wise words” about problems related to water, it acted as a whole different medium than the touch screen installation, that has no decorations at all. When asked about their interpretation of the artistic message for the button based installation, their answers were more focused on “the balance of water” compared to the touch screen installation that had answers oriented towards the aspects of learning and “taking care of the flowers”.
A possible new method that emerged from this discovery is centered around the software application and the physical medium. By changing the installation’s appereance and input methods, but keeping the visual part provided by the software, you can get interesting results. Different presentation and input methods may communicate a message differently. To apply this method to an installation, the artist needs to consider multiple ways of presentation and possible interaction types. It is wise to do this at an early stage, as the product would be at prototype level, to minimize the amount of work. The author chose to name this method “The Multiple Form-Factor Method”.
The method needs to be combined with another evaluation method of some kind, in order to evaluate how effective each appereance is. The “Video-Cued Recall Method” introduced in chapter 2.5.1 would be a good choice, but since it is a prototype, the “Experience Workshop” introduced in chapter 2.5.2 may be a better choice.
During the literature review, a similar thought was found in the article [5] where they play with the thought of changing the physical appereance of the installation in order to attract more people and catching their attention. They did not proceed with the changes, but they would probably have altered how the passers-by experienced and percieved it.

31
Although changing the appereance and presentation of an installation can bring benefits to the communicated message and how users percieve and experience it, it can also change it to something that the artist did not intended. A concern is mentioned by H. Tikka et al. in [5]:
«Is a media art installation on a multi-touch screen meaningful only when it is interacted with? From an artist’s point of view At Hand at the CityWall is a relational artefact, which is connected to its surroundings in a number of ways. All of these connections are part of its meaning. As such At Hand also embodies the risk of being misunderstood or missed entirely. If the risk were to be removed, the meaning of the installation would change.»
And this is indeed a valid concern. The artist needs to consider which impact the changes do to the installation and if it is for the better or worse. It makes no sense to change the installation so drastically that it does not fit the artist’s experiential goals any longer.
32
5 CONCLUSION This project has reviewed literature on the evaluation of user experiences
from interactive art. There are many good methods in the field of HCI for evaluating regular software, but they sometimes fall short when it comes to evaluating art installations. New experimental methods continue to emerge, and two of these have been revised and discussed in this project.
An empirical study was conducted in order to collect empirical data about two different representations of an interactive art installation. The empirical study indicates that especially children are easily immersed in interactive art. The higher degree of interactivity in the touch screen installation engaged the users more than the less dynamic button based installation, although both form factors successfully engaged the users in their own way. This indicated that the form factor and input methods of an art installation can strongly affect how the installation is experienced and received.
A new method for evaluating interactive art installations was proposed. It was observed in the empircal study that the users responded differently to the two different presentations of “Water Me”. Presenting an art installation in different interactive form factors is a method that can be used in evaluation of installations to shed light on how the message is conveyed to the audience and how the installation is experienced.
5.1 FUTURE WORK It would definitively be interesting to compare the different evaluation
methods against each other to gather data on how well they effectively evaluate the audience’s perception and experience of an interactive art installation.
The proposed method in chapter 4.2 needs to be tried out on a real project. As the method was discovered after the exhibition was held, explisit testing of the method itself was not carried out. It would be interesting to try the new method on an interactive art installation in order to confirm if the effect that was observed during the exhibition of the two representations of “Water Me”.
33
REFERENCES
[1] E. a. Shanken, “Art in the Information Age: Technology and Conceptual Art,” Leonardo, vol. 35, no. 4, pp. 433-438, Aug. 2002.
[2] A. Trifonova, L. Jaccheri, and K. Bergaust, “Software engineering issues in interactive installation art,” Int. J. Arts and Technology, vol. 1, no. 1, pp. 43-65, 2008.
[3] E. Huhtamo, “Trouble at the Interface, or the Identity Crisis of Interactive Art,” Framework, The Finnish Art Review, pp. 1-9, 2004.
[4] M. McLuhan, Understanding Media: The Extensions of Man, 1st ed. Cambridge: MIT Press.
[5] H. Tikka, S. Viña, G. Jacucci, and T. Korpilahti, “Provoking the city — touch installations for urban space,” Digital Creativity, vol. 22, no. 3, pp. 200-214, 2011.
[6] B. J. Oates, “New frontiers for information systems research: computer art as an information system,” European Journal of Information Systems, vol. 15, no. 6, pp. 617-626, Dec. 2006.
[7] K. Höök, P. Sengers, and G. Andersson, “Sense and Sensibility : Evaluation and Interactive Art,” New Horizons, no. 5, pp. 241-248, 2003.
[8] L. Candy, S. Amitani, and Z. Bilda, “Practice-led strategies for interactive art research,” CoDesign, vol. 2, no. 4, pp. 209-223, Dec. 2006.
[9] E. Edmonds, Z. Bilda, and L. Muller, “Artist, evaluator and curator: three viewpoints on interactive art, evaluation and audience experience,” Digital Creativity, vol. 20, no. 3, pp. 141-151, Sep. 2009.
[10] Z. Bilda, E. Edmonds, and L. Candy, “Designing for creative engagement,” Design Studies, vol. 29, no. 6, pp. 525-540, Nov. 2008.
[11] M. Satomi and C. Sommerer, “‘ game _ of _ life ’: An Interactive art installation using an eye-tracking interface,” Screen, pp. 246-247, 2007.
[12] B. Costello, L. Muller, and S. Amitani, “Understanding the Experience of Interactive Art : Iamascope in Beta _ space,” Symbolic Interaction, pp. 49-56.
[13] L. Bialoskorski, J. Westerink, and E. van den Broek, “Mood Swings: design and evaluation of affective interactive art,” New Review of Hypermedia and Multimedia, vol. 15, no. 2, pp. 173-191, Aug. 2009.
[14] H. Strömberg, A. Väätänen, and V.-P. Räty, “A group game played in interactive virtual space,” Proceedings of the conference on Designing interactive systems processes, practices, methods, and techniques - DIS ’02, pp. 56-63, 2002.
[15] A. Morrison, S. Lucia, and P. O. Box, “Evoking Gesture in Interactive Art,” HCC ’08 Proceeding of the 3rd ACM international workshop on Human-centered computing, pp. 11-18, 2008.
[16] A. Morrison, P. Mitchell, and M. Brereton, “The Lens of Ludic Engagement : Evaluating Participation in Interactive Art Installations,” Practice, pp. 509-512, 2007.
[17] Z. Bilda, “Interactive Experience in Public Context: Tango Tangle,” Leonardo, vol. 40, no. 4, pp. 364–365, 2007.
34
[18] J. Preece, Y. Rogers, and H. Sharp, “Data gathering,” in Interaction Design Beyond Human-Computer Interaction, 2007, pp. 292-348.
[19] L. Cappellini, “Interactive installation art in Italy: an analytical survey,” Filosofia. Master Degree Thesis in Informatics for Humanities, Supervisors: Luciana Vassallo and Letizia Jaccheri, University of Pisa, 2009.
[20] J. P. Chin, V. A. Diehl, and K. L. Norman, “Development of an instrument measuring user satisfaction of the human-computer interface,” Proceedings of CHI’88, pp. 213-218, 1988.
[21] J. Brooke, “SUS - A quick and dirty usability scale,” in Usability Evaluation in Industry, CRC Press, 1996.
[22] F. Fu, R. Su, and S. Yu, “EGameFlow: A scale to measure learners’ enjoyment of e-learning games,” Computers & Education, vol. 52, no. 1, pp. 101-112, Jan. 2009.
[23] B. Wu and A. I. Wang, “A Pervasive Game to Know Your City Better,” in IEEE International Games Innovation Conference (IGIC 2011), 2011.
[24] L. Muller, T. Robertson, and E. Edmonds, “Experience Workshops,” Proceedings of OZCHI, pp. 2-6, 2006.
[25] M. Aasbakken, L. M. Solberg, A. Lind, E. L. Vaagland, I. K. Remmen, and V. Vik, “TDT4852 - Experts in Team: Ny mediakunst for interaktive kampanjer,” 2011.
[26] “Infrared Touchscreen.” [Online]. Available: http://www.etouchtechnologies.com/ir.html. [Accessed: 17-Nov-2011].
[27] “What is the Norwegian Science Week?” [Online]. Available: http://www.forskningsdagene.no/artikkel/vis.html?tid=30355. [Accessed: 17-Nov-2011].
35
APPENDIX 1 – POSTER FOR THE EXHIBITION

36
TR AN SLATIO N O F T H E POST ER
Water Me! Water Me is a part of a research project that studies how people relate to
interactive campaigns. By exploring and playing with these installations you will participate in creating new knowledge within this field.
Water Me started as a project in the course Experts in Teamwork at NTNU.
The project theme was “New Media Art for Interactive Campaigns”. The goal for this project was to develop an interactive installation to help Liv Arnesen reach her goals regarding her expidition to the South pole in 2012. Her vision is to engage youth in global problems related to water.
Mia Aasbakken studies computer science with a specialization in game technology at
NTNU. This project is a preperation for her master thesis that will focus on interactive campaigns.
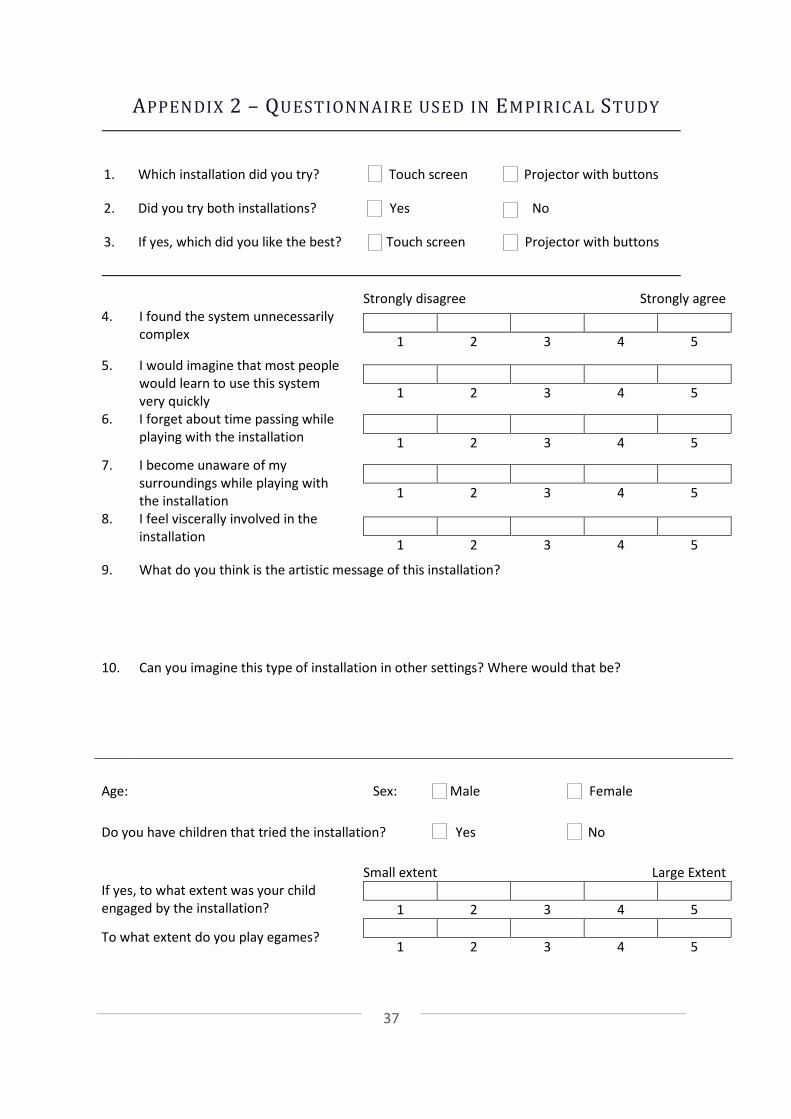
37
APPENDIX 2 – QUESTIONNAIRE USED IN EMPIRICAL STUDY
1. Which installation did you try? Touch screen Projector with buttons
2. Did you try both installations? Yes No
3. If yes, which did you like the best? Touch screen Projector with buttons
Strongly disagree Strongly agree 4. I found the system unnecessarily
complex
1 2 3 4 5
5. I would imagine that most people would learn to use this system very quickly
1 2 3 4 5
6. I forget about time passing while playing with the installation
1 2 3 4 5
7. I become unaware of my surroundings while playing with the installation
1 2 3 4 5
8. I feel viscerally involved in the installation
1 2 3 4 5
9. What do you think is the artistic message of this installation?
10. Can you imagine this type of installation in other settings? Where would that be?
Age: Sex: Male Female
Do you have children that tried the installation? Yes No
Small extent Large Extent
If yes, to what extent was your child engaged by the installation?
1 2 3 4 5
To what extent do you play egames? 1 2 3 4 5