evaluating the impact of an ambulatory computerized ... · 1/20/2009 · • utilizes a commercial...
TRANSCRIPT

Evaluating the Impact of an Ambulatory Computerized Provider Order Entry System
on Outcomes in a Community-based, Multispecialty
Health System
Beth Devine, PharmD, MBA, PhDPharmaceutical Outcomes Research & Policy Program
MEBI 590 SeminarJanuary 20, 2009

• Improve quality and safety
• Enhance the productivity of health care professionals; reduce administrative costs
• Support clinical and health services research
• Ensure patient data confidentiality at all times
•Accommodate future developments
1997 Institute of Medicine Report Electronic Health Records (EHRs)

CPOE systems*:A core component of EHRs
Basic AdvancedComputer entry of prescription information
•Drug, dosage form, route •Directions•Quantity•Patient name •Date•Prescriber’s signature•Duplicate therapy•Allergies•Drug-drug interactions•Formulary checking
Drug-disease interactionsLaboratory checkingDose calculatorsMedication selection aidsPreventive monitoring
*CPOE=Computerized provider order entry CDS = Clinical Decision Support
Kuperman. JAMIA 2007;14:29-40

2004 Congressional Mandate
Agency for Healthcare Research and Quality
Health Information Technology Grant5 UC1 HS 015319-03 (Sullivan)
Mentored Clinical Scientist Training Grant: K08 HS 014739-02A2 (Devine)
Our Partnership:


Three Aims; Three Studies (1)
• Aim (Study) #1 – Medication Error Study– Aim 1a: Evaluate the impact of the CPOE
system on medication errors, comparing pre-to post-• Aim 1a1: the distribution of errors • Aim 1a2: epidemiology of error characteristics• Aim 1a3: the distribution of error severity
– Aim 1b: Link errors to subsequent adverse drug events (ADEs)

Three Aims; Three Studies (2)• Aim (Study) #2 – Time-Motion Study
– Evaluate the impact of the CPOE system on time-intensity of prescribing, and on work tasks• Time spent handwriting versus e-
prescribing • Time spent e-prescribing using an interim
hardware configuration (phase 1) versus the final hardware configuration (phase 2)
• Time spent on work tasks• Time spent on overall activity types

Three Aims; Three Studies (3)
Aim (Study) #3 – Focus Group Study– Explore and describe end-users’ perceptions
of and experiences with the CPOE system – Map results to the information technology
adoption model

The Everett Clinic• Physician owned and managed multi-specialty integrated
health-system with a 79-year history
• 14 locations; 60 clinics – ambulatory oncology and behavioral health
• Ancillary services - laboratory, radiology
• 225 physician-owners / 1,250+ employees
• 225,000 patients; 610,000 ambulatory visits annually
• 4 on-site pharmacies; 2.7 million prescriptions annually
• Admit to single hospital in local market
• Core values
– We do what is right for each patient
– We provide an enriching and supportive workplace
– Our team focuses on value: service, quality and cost
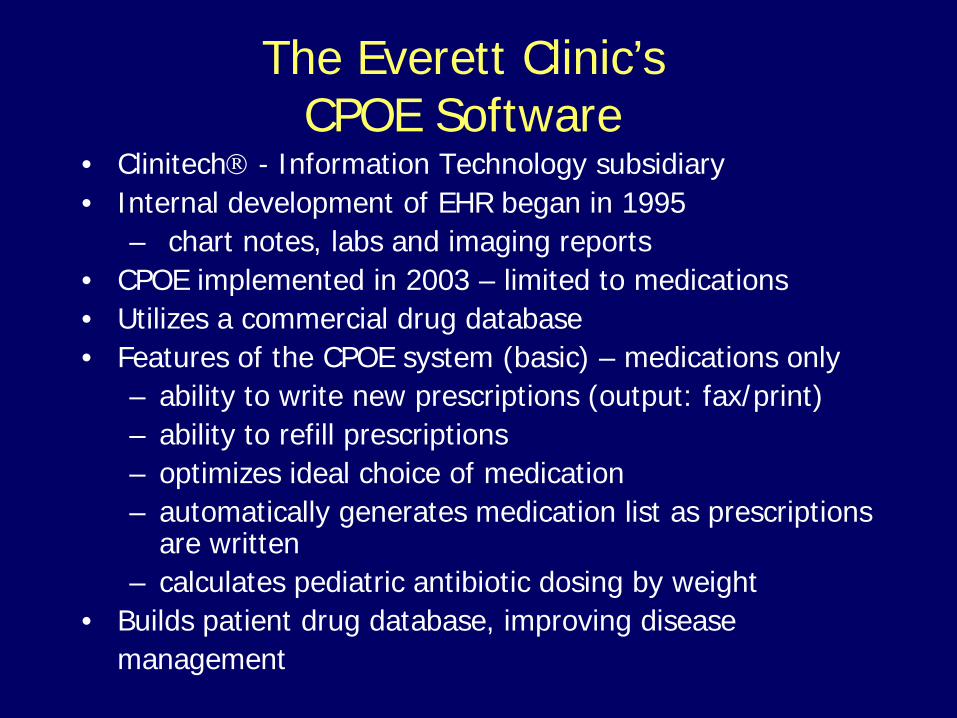
The Everett Clinic’sCPOE Software
• Clinitech® - Information Technology subsidiary• Internal development of EHR began in 1995
– chart notes, labs and imaging reports• CPOE implemented in 2003 – limited to medications • Utilizes a commercial drug database • Features of the CPOE system (basic) – medications only
– ability to write new prescriptions (output: fax/print)– ability to refill prescriptions – optimizes ideal choice of medication – automatically generates medication list as prescriptions
are written– calculates pediatric antibiotic dosing by weight
• Builds patient drug database, improving disease management

Study #1: Medication Error Study:Hypotheses
• Aim 1a: Evaluate the impact of the CPOE system on medication errors, comparing pre- to post-– 1a1: 50% reduction in the distribution
(frequency) of errors– 1a2: Types of errors will change
• Reduction in errors most logically impacted by a basic CPOE system
– 1a3: Reduction in errors of all severity levels
• Aim 1b: Link errors to ADEs– Exploratory analysis

Medication Errors
Potential ADEs
Preventable (ADEs)
Not Preventable (ADRs)
Bates, JGIM 1995;10:199-205

Background (1) - History
• Drug complications constitute 19% of total adverse events1
• Medication errors occur in 5.3% of inpatient orders; 7.5% of these can result in an adverse drug event2
• CPOE with CDS alerts resulted in a 55%3 and 81%4 reduction in medication errors
• 44,000 – 98,000 deaths per year occur as result of medical errors in hospitals5
• IOM - Preventing Medication Errors, 20061Leape, NEJM 1991;324:377-84; 2Bates, JGIM 1995;10:199-205; 3Bates, JAMA 1998;280:1311-16; 4Bates, JAMIA 1999;6:313-21; 5Institute of Medicine. 1999

Background (2) – State of the Field•Systematic reviews1-6 investigating the impact of CPOE/ CDS systems on medication safety:
•inpatient setting, academic medical centers•“homegrown” systems •Wide variety in design, quality and results•Few focus on ADEs; some focus on CDS alerts
•Great potential for errors in the ambulatory setting•One (academic, major institution, “homegrown”)7
•4 primary care practices – 2 handwritten, 2 CPOE•1,879 prescriptions•7.6% contained an error; 43% were potential ADEs; 3 errors caused ADEs•CDS could have prevented 95% of potential ADEs
1Kaushal, Arch Intern Med 2003; 2Garg JAMA 2005; 3Eslami JAMIA 2007; 4Shamnliyan HSR 2008; 5Wolfstadt JGIM 2008; 6Ammenwerth JAMIA 2008; 7Gandhi, JGIM 2005

Methods (1)• Quasi-experimental, pre,- post- design• Retrospective review of 5,000 prescriptions in each of
two time frames (2 reviewers)• Filled at one of three onsite pharmacies• Weighted sampling • Variables:
– Primary outcome: error – yes/no– Secondary outcomes: characteristics (13) and
severity (3-levels)– Primary independent variable: CPOE – yes/no– Data sources: prescriptions, EHR, laboratory values– Covariates: patient age & gender, prescriber
specialty, therapeutic drug class, season, weeks since 1st Rx written
– Interaction terms: CPOE and each covariate• Approved by the UW Human Subjects Committee

Methods (2) –Analyses•Unadjusted – two-sample test of proportion for each outcome
•Hierarchical data – prescription, prescriber, geographic site
•Distribution & characteristics – binary outcomes
•GEE with alternating logistic regression (ALR)1
•Clustered on prescriber and geographic site
•α for geographic site NS, so included as fixed effect
•First order GEE, clustering on prescriber
•Weight variable to reflect clinic prescribing patterns
•Created best fitting model, retaining variables (or groups) with p<0.05
•Error severity
•Collapsed 6-levels to 3
•Generalized linear & latent mixed effects model (GLLAMM)2
•Multinomial logit link; same covariates
1Carey. Biometrika 1993;80:517-26; 2Rabe-Hesketh & Skrondal 2008

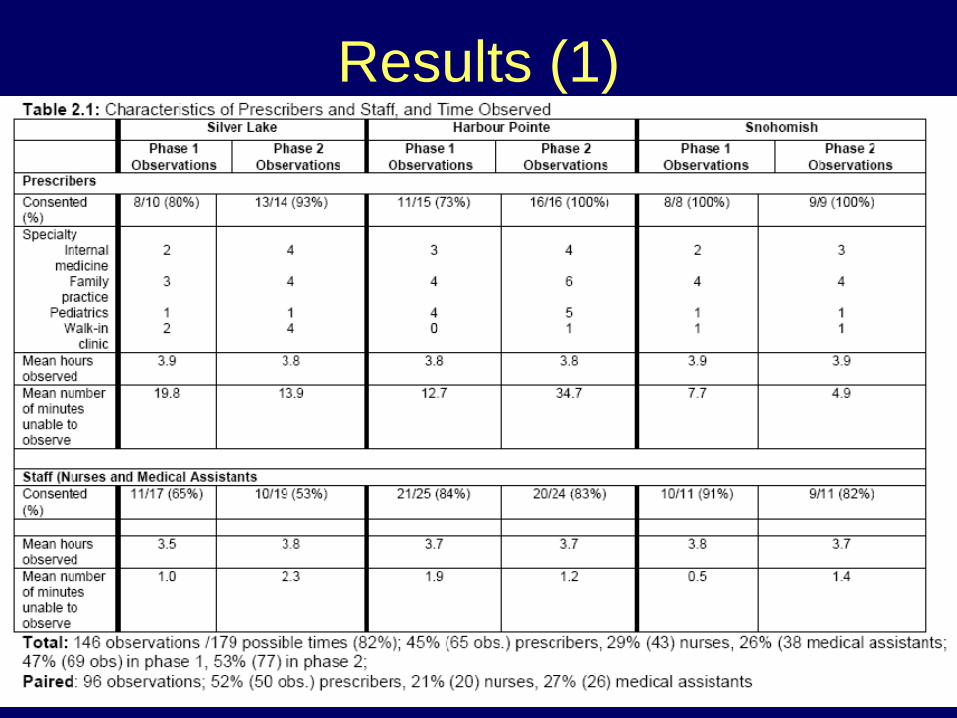
Results (1)

Results (2)

Results – Error Characteristics (3)
*p<0.005
**p<0.001
**
**
**
**
*
*

Results – Error severity (4)
•14 / 10,169 (0.1%) of prescriptions included an error that caused harm
•1 level “F” error (caused harm; required hospitalization); occurred pre-CPOE
•Lab monitoring (4), drug-disease interactions (3), wrong directions (3), wrong dose (2)
•No association found between errors and subsequent ADEs

Notable Findings
• 55% reduction in frequency of errors with CPOE system – 70% reduction in odds of an error occurring (OR: 0.3);
95% CI 0.23, 0.40)• Reductions in most types of errors
– Greatest reduction in errors impacted by a basic CPOE system
• Most errors do not cause harm (potential ADEs)– 57% reduction in odds (OR: 0.43, 95% CI; 0.38, 0.49)– 0.1% of errors caused harm (preventable ADEs)

Strengths and Limitations • Large dataset• Two independent evaluators• Rigor of analytic methods
• Retrospective methods preclude definitive evaluation of errors that cause harm
• Capture prescribing errors only • Limited generalizability
– “homegrown” system– community setting with specific prescribing patterns– three pharmacies
• weighting scheme may address this

Study #2:Time-Motion Study
•Aim 2.1: Evaluate time spent (seconds) handwriting vs. e-prescribing (prescribers)
•Hypothesis: The impact of e-prescribing will be time-neutral for prescribers
•Aim 2.2: Evaluate time spent (seconds) eprescribing, comparing phase 1 to phase 2 (prescribers)
•Aim 2.3: Evaluate time spent (min/hour) on work tasks, comparing phase 1 to phase 2 (prescribers & staff)
•Aim 2.4: Evaluate time spent (proportions) on overall activity categories, comparing phase 1 to phase 2 (prescribers & staff)

BackgroundAuthor Year Setting Methods ResultsTierney 1993 RCT of CPOE in
urban hospital (n=68 teams)
Time-motion
+ 33 min/ 10 hour shift (p<0.001); less time record-keeping
Shu 2001 Pre-, post-CPOE in inpatient setting
Work-sampling
Increase from 2.1% to 9.0%; (p<0.001); less time charting; patient care time unchanged
Overhage 2001 RCT of CPOE at 11 clinics (n=34)
Time-motion
+ 0.43 min (NS); - 3.73 min
Pizziferri 2005 Pre-, post-EHR at 5 clinics (n=20)
Time-motion
- 30 secs/ patient; patient care time unchanged
Poissant 2005 Systematic review of CPOE and EHR
Several - 28% to + 328%; 3/ 12 studies with time savings

Study Design
Phase 1 Phase 2Clinic CPOE System CPOE SystemSilver Lake Paper Exam Room
Desktop
Harbour Pointe Prescriber Office Desktop
Exam RoomDesktop
Snohomish Wireless Laptop Exam RoomDesktop
•Direct observation – One 4 hour time block per end-user•All prescribers and staff whose job involves prescriptions•With consent of prescriber and patient •Approved by UW Human Subjects Committee

Data Elements (1)1
Major Task Categories (12)
Individual Categories (106)
1)Computer New Rx; Renew Rx; Fax Rx; (Drug Ref; e-mail; Lit Search; Look Up Data)
2) Writing New Rx; Renew Rx;(Letter; Notes/Charts; Orders)
3) Phone Rx; FAX Rx; Prior Authorization(Getting Results; Paging; Personal; Scheduling test)
Other Major Task Categories4) Examine/ read 8) Phone patient
5) Examine patient 9) Procedure
6) Looking for 10) Talking
7) Other 11) Talking Patient1Overhage, JAMIA 2001;361-71 12) Walking

Data Elements (2)
Direct patient care Indirect patient care –other
Indirect patient care –write
Administrative
Indirect patient care –read
Miscellaneous
Overall Activity Types
106 Individual categories1
1Overhage, JAMIA 2001;361-71

Analyses (1)• Aim 2.1: seconds to prescribe (event)• Linear Mixed Model
Outcome variable = adjusted mean difference in the number of seconds spent pre prescription-related event
Primary independent variable = handwritten (phase 1 or 2) vs. e-prescribed (phase 2)
Fixed effect covariates = new or refilled prescription, clinic, days exposed to software / hardware
Random effect = prescriber
• Aim 2.2: Same linear mixed model Primary independent variable = e-prescribed (phase 1) vs. e-
prescribed (phase 2) • Unpaired analyses

Analyses (2)• Aim 2.3• Unit of analysis = major task category• Outcome variable
– Mean number minutes / hour on each task– Summed for each subject, by task– Weighted by total number of minutes observed– Average of all subjects, by task
• Grouping variable – phase 1 or phase 2
• Unpaired t-tests• Stratified by professional type & clinic
Aim 2.4: Overall activity types– Two sample tests of proportions, by activity
Results (1)

Results – seconds to prescribe (2)

Results-min/hr on tasks(3)NS when combined
with writingPrescribers P<0.001

Results-min/hr on tasks(4)Staff – RNs/ MAs

Results-Overall Activities (5)
*
*p<0.001
**
Overall activity Types

Notable Findings• E-prescribing took 22 secs/ prescription longer
than handwriting– 18 seconds per patient
• E-prescribing in phase 2 took 22 secs/ prescription longer than in phase 1– Computers in exam rooms – at point of care
• Prescribers spend most time talking to patient; little time prescribing
• Staff spend more time computing & talking• Time spent in direct patient care
– unchanged for prescribers– Increased for staff (corresponding decrease in
miscellaneous tasks)

Strengths and Limitations– Time-motion methods – gold standard– Includes staff– Reflects pre-, post-implementation of 3 configurations
– Hawthorne effect1
– limited to specific time periods during the day– limited to primary care clinics– limited ability to accurately capture simultaneously
occurring tasks – did not capture total amount of time worked per day;
unable to determine impact on workload1Hawthorne effect. http://www.nwlink.com/~donclark/hrd/history/hawthorne.html

Study #3:Focus Group Study
•Aim 3.1: Explore and describe end-users’ perceptions of and experiences with the CPOE system
•Hypothesis: perceptions will be generally favorable
•Aim 3.2: Map results to the information technology acceptance model (ITAM)1
1Dixon. Int J Med Inform 1999;56:117-23

Background• Many barriers to EHR adoption1-4:
– overall prescriber resistance due to perceived time-intensity and lost productivity
• EHRs can:– facilitate medication errors5
– cause alert fatigue6
– cause a revolt against implementation7
• Successful implementation8
– Leadership, motivation, attention to workflow, staged implementation, technical details, training, continuous improvement
• POET Group8 – qualitative research; inpatient focused; one HMO
1Grossman. Health Aff 2007; 2Doolan. Health Aff.2002; 3Poon. Health Aff 2004; 4Halamka. JAMIA 2006;5Koppel. JAMA 2005; 6Weingart. Arch Intern Med 2003; 7Shane. AJHP 2003; 8Ash. JAMIA 2003

Information Technology Adoption Model

Methods (1)• Study Design: Qualitative, focus groups; cross
sectional• Enrich / complement Studies #1 and #2• Sampling frame: 3 primary care clinics
– universal – voluntary
• Inclusion criteria: all end-users involved with the prescribing process – prescribers = MDs, DOs, ARNPs, PAs– staff = RNs, medical assistants
• 3-8 participants/group; 30 minutes/ group• 2 groups/clinic (prescribers & staff)
• Academic investigator to facilitate focus groups

Methods (2)
• On-site consent• Semi-structured elicitation techniques developed
from review of literature (interview guide)1
• Content recorded on laptop, capturing comments “verbatim”
3 topical areas – expectations and impact– Fears– Barriers– (individual level variables)
• Approved by the UW Human Subjects Committee1Miles & Huberman.Qual Data Analysis. Sage; 1994

Focus Group DetailsSilver Lake
(Spring 2005)Harbour Pointe(Summer 2005)
Snohomish(Summer 2006)
Participants Prescribers (7)
Staff (8)
Prescribers (6+)Staff (9)
Prescribers (3)
Staff (4)
Software/Hardware configuration
Paper;EHR-desktops
CPOE (11mos);EHR-desktops
CPOE (22 mos);EHR-laptops
2 extra focus groups: “float pool staff” and Silver Lake staff “transition timeframe” (6 mos. post-CPOE implementation)

Data Management & Analyses (1)• Unit of analysis = focus group
– site, type of health care professional, and date• 2 coders & epistemology
– 1) deductive1
• (starting with a set of analytic categories)– phenomenological approach1
• (open to new ideas, not pre-judging, just describing) – 2) grounded theory
• Analysis1-3
– hermeneutic style2 - Atlas.ti™– coding – open; microanalytic; constant comparison;
theoretical saturation; ‘check coding’ comparison – axial coding – process of relating major categories to
each other– Creation and comparison of themes across focus groups
& end-user profession1Strauss & Corbin, 1998; 2Bradley.HSR 2007;42:1758-72; 3Miles & Huberman, 1994

Data Management & Analyses (2)
• 8 focus groups; 70 participants; 24% prescribers
• 26 pages of transcripts• 142 codes; • 26 code families• Dimensionality
– Prescribers & staff– Pre- vs. Post- CPOE
Pre-CPOE Post-CPOE
SL Spring HP, Sno, Float, SL Fall (transition)
Expectations vs. Concerns/ fears
Benefits vs. Drawbacks
Improvements needed (wish list)
Promoters vs. Barriers (float pool)

Results - ThemesClinical information (CDS features)
Software & hardware configurations(reliability, security, speed)
Documentation & safety(medication safety)
Implementation, transition & improvement(transition processes)
Organizational issues(training and support)
Time(time-saving, time-neutral)
Efficiency(less paper/ fewer charts)
Overall impressions
Patients(computers at point of care coordination; satisfaction)
End-user characteristics(age, attitudes, computer experience)
Pharmacy communications (integration/ transparency)


Notable Findings• Improvements in access, accuracy, documentation,
integration, transparency• Reduction in medication errors (2ndary)• Large initial investment of time (staff)• Staff early adopters• Good training/ more training• CDS alerts (prescribers); internal communications (staff)• Workload shift to staff; but worth it• Less paperwork; fewer charts• Network challenges, pharmacy challenges• Computers at point of care (care coordination)• Remote access (care coordination)• Time neutral (prescribers)• Improved patient satisfaction• Positive attitudes (or reserved, but not negative)• Benefits realized; fears were not; favorable impressions

Strengths and Limitations• Includes staff
• Cross-sectional data• Primary care clinics• Voluntary participation
– Those with positive attitudes may have participated• Two focus groups conducted by member of
system implementation team • Written transcripts only

Contributions to the Field
• Collection of 3 studies• Results suggest a basic CPOE system can be
successfully implemented in community-based setting, not affiliated with academic medical center– improved medication safety– time neutrality– favorable impact
• Lessons learned to enable successful adoption1
1Devine AHRQ Publications 2008

Contributions to the Field• Results generalizable in many ways due to
universal issues involved in CPOE adoption1-4
– optimize background information databases– identify core functions; user-friendly screen functionality– proactive planning of revised workflow to ensure time-
efficiency and productivity– address network reliability, security, integration– organizational, cultural and environmental issues
• Limited generalizability, but important findings– homegrown system– staged implementation– iterative improvements
1Bell, Health Affairs May 25, 2004; 2Bell, JAMIA 2004; 3Poon, Health Affairs 2004;
4 Devine AHRQ Publications 2008

Collaborators•UW
•Dave Blough, PhD•Will Hollingworth, PhD•Diane Martin, PhD•Tom Payne, MD•Sean Sullivan, PhD•Peter Tarczy-Hornoch, MD•Ryan Hansen, PharmD; Tom Hazlet PharmD, DrPH, Emily Williams, MS, Bryan Comstock, MS
•The Everett Clinic•Al Fisk, MD, MMM•Nathan Lawless, ChE, RPh•Jennifer Wilson-Norton, RPh, MBA

Thank you!

Supporting Slides

Serious errors = C- I

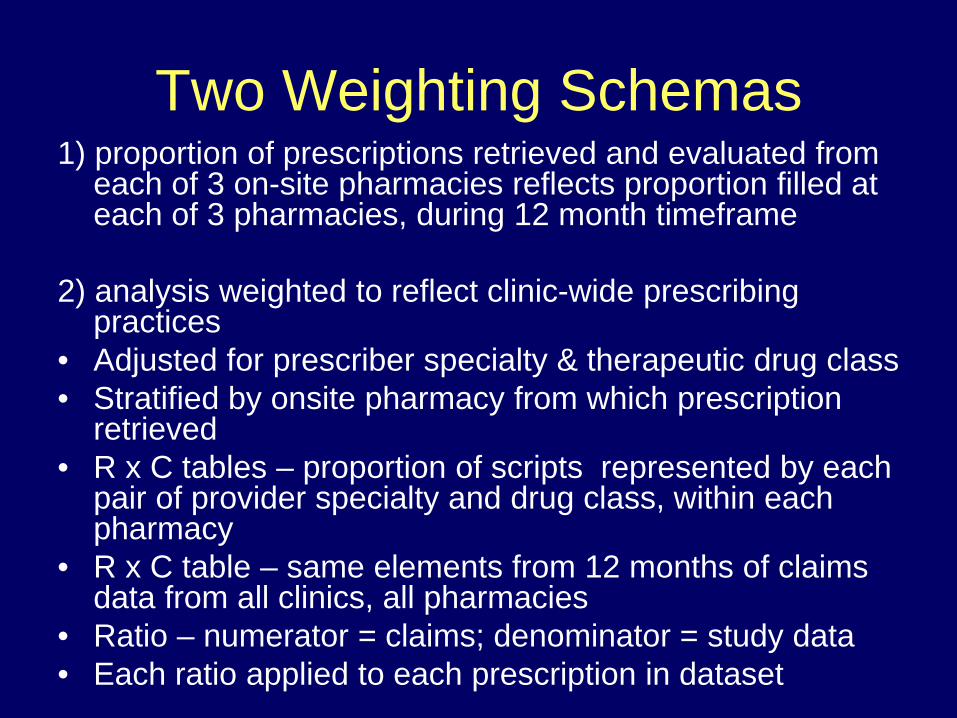
Two Weighting Schemas1) proportion of prescriptions retrieved and evaluated from
each of 3 on-site pharmacies reflects proportion filled at each of 3 pharmacies, during 12 month timeframe
2) analysis weighted to reflect clinic-wide prescribing practices
• Adjusted for prescriber specialty & therapeutic drug class• Stratified by onsite pharmacy from which prescription
retrieved• R x C tables – proportion of scripts represented by each
pair of provider specialty and drug class, within each pharmacy
• R x C table – same elements from 12 months of claims data from all clinics, all pharmacies
• Ratio – numerator = claims; denominator = study data• Each ratio applied to each prescription in dataset

Med Error Study-Analyses (1)•Aim 1: Estimate unadjusted differences in error characteristics:
(p1 - p2 ) / √ [ p0 (1 - p0 ) (1/n1 + 1/ n2 )]; where p0 = (X1 + X2) / (n1 + n2 )
•Aim 1: Estimate error distribution and severity – binary outcomes
•Hierarchical data – prescription, prescriber, provider/ clinic type, geographic site
•Generalized estimating equations (GEE) with alternating logistic regression (ALR)1
•GEE – an extension of generalized linear models: g(μij) = X’ijβ; GEE adds the covariance component; used for first order models (mean and (co)variance)
•ALR:
•Step 1: logistic regression using 1st order GEE to estimate regression coefficients (β); binomial distribution; logit link
•Step 2: logistic regression of each response on others from the same cluster, using an offset to update the odds ratio parameters; estimate pairwise odds ratios for within cluster associations (α), conditional on β
1Carey. Biometrika 1993;80:517-26

Med Error Study–Analyses (2)• Equation to estimate the dependence of the outcome on the
covariates (β’s): • Logit Pr(Yhijk=1|X hijk) = β0 + β1(e-prescribing) + β2(covhijk)
• Equation to estimate the pairwise odds ratios for the within cluster associations (α’s) while simultaneously taking into account the β’s:
• log odds ratio (Yhijk =1) = α0 + α1 Zhijki’j’k’ + α2 Zhijki’j’k’
• Pairwise odds ratios will describe the odds in favor of an error occurring for a prescription within that level, when compared to a second prescription from within that same level of association.
• The results of the algorithm should return estimates that specify the odds ratios of an error occurring, given each covariate; as well as odds ratios for within prescriber, within provider/clinic type, and within geographic site, each adjusted for the covariates.
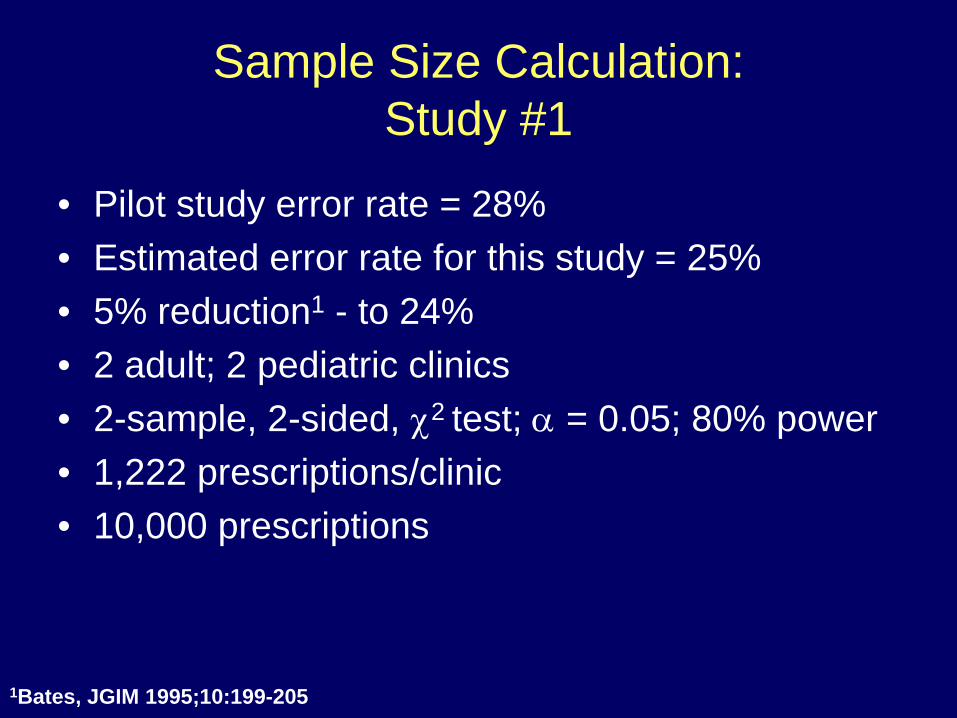
Sample Size Calculation:Study #1
• Pilot study error rate = 28%• Estimated error rate for this study = 25%• 5% reduction1 - to 24%• 2 adult; 2 pediatric clinics• 2-sample, 2-sided, χ2 test; α = 0.05; 80% power• 1,222 prescriptions/clinic• 10,000 prescriptions
1Bates, JGIM 1995;10:199-205

Power Calculation Med Errors (1):
• Average # scripts/ prescriber = 120• Use an ICC of 0.02• Variance inflation factor (VIF) =
1 + [(m -1) * ICC]• VIF = 1 + (120-1)(0.02) = 3.38 • 10,169/3.38 = 3,009 scripts• 49% pre-; 51% post =
– 1,474 pre and 1,535 post

Power Calculation Med Errors (2):• . sampsi 0.25 0.20, n1(1474) n2(1535)• Estimated power for two-sample comparison of
proportions• Test Ho: p1 = p2, where p1 is the proportion in
population 1• and p2 is the proportion in population 2• Assumptions:• alpha = 0.0500 (two-sided)• p1 = 0.2500• p2 = 0.2000• sample size n1 = 1474• n2 = 1535• n2/n1 = 1.04• Estimated power:• power = 0.9002

Data Collection Tool
All timing data collected with Timer ProTM
http://performance-measurement.com/

Time-Motion Analyses (2)
• Aim 2c: Linear Mixed Model E(Yij|Xij) = β0+ β1(stage of e-prescribing) + β2(prescriber) + β3(covariateij) + b0i + ε ij
whereY = adjusted mean difference in the number of seconds
spent pre prescription/related event, for prescribersβ1 = stage of e-prescribing β2 = prescriber (random effect)β3 = new or refilled prescription (fixed effect) b0i = random intercept between prescriberε ij = error term within clusters i=index for cluster/subject (prescriber)j=index for measurement within cluster (prescribing event)

Power Calculation-Time Motion (1)
• Aim 2c – Silver Lake site– 10 prescribers– Write 10 prescriptions / 4 hour time block
• 50 ± 5 secs to hand-write • 60 ± 5 secs to e-prescribe
– Assume• ICC = 0.01
– Variance inflation factor (VIF) = 1 + [(m -1) * ICC] – VIF = 1 + [(10-1)0.01] = 1.09– 2-sided test; α = 0.05
• 95% power to detect 20% difference in time to write a prescription

Power Calculation-Time Motion (2)Updated (1)
• Number of prescribers = 25 pairs and 15 singles • 35 prescribers
– Write 8 prescriptions / 4 hour time block• 50 ± 5 secs to hand-write • 60 ± 5 secs to e-prescribe
– Assume• ICC = 0.01
– Variance inflation factor (VIF) = 1 + [(m -1) * ICC] – VIF = 1 + [(8-1)0.01] = 1.07– 132 handwritten + 312 e-prescribed events = 444 events– 444/1.07 = 415– 125 (30%) handwritten; 290 (70%) e-prescribed

Power Calculation-Time Motion (2)Updated (2)
• . sampsi 50 60, n1(125) n2(290) sd(5)Estimated power for two-sample comparison of means• Test Ho: m1 = m2, where m1 is the mean in population 1 and m2 is
the mean in population 2• Assumptions:• alpha = 0.0500 (two-sided)• m1 = 50• m2 = 60• sd1 = 5• sd2 = 5• sample size n1 = 125• n2 = 290• n2/n1 = 2.32
• Estimated power:• power = 1.0000