doctor of philosophy in business … · thesis submitted to the padmashree dr. d. y. patil...
TRANSCRIPT
The role of Packaging in the Marketing Strategy of pharmaceutical products
Thesis Submitted to the Padmashree Dr. D. Y. Patil University, Department of Business Management
in partial fulfillment of the requirements for the award of the Degree of
DOCTOR OF PHILOSOPHY
In
BUSINESS MANAGEMENT
Submitted by
MR THOMAS MATHEW
(Enrollment No. DYP-PHD 066100021)
Research Guide
Dr. R K SRIVASTAVA
PADMASHREE DR. D.Y. PATIL UNIVERSITY,
DEPARTMENT OF BUSINESS MANAGEMENT,
Sector 4, Plot No. 10,
CBD Belapur, Navi Mumbai – 400 614
March 2012
THE ROLE OF PACKAGING IN THE MARKETING
STRATEGY OF PHARMACEUTICAL PRODUCTS

DECLARATION I hereby declare that the thesis entitled “The role of Packaging in the
Marketing Strategy of pharmaceutical products” ” submitted for the Award
of Doctor of Philosophy in Business Management at the Padmashree Dr. D.Y.
Patil University Department of Business Management is my original work and
the thesis has not formed the basis for the award of any degree, associate
ship, fellowship or any other similar titles.
Place: Navi Mumbai.
Date:
Signature of the Guide Signature of the Signature of the student Head of the dept.
CERTIFICATE This is to certify that the thesis entitled “The role of Packaging in the
Marketing Strategy of pharmaceutical products” and submitted by Mr.
Thomas Mathew is a bonafide research work for the award of the Doctor of
Philosophy in Business Management at the Padmashree Dr. D. Y. Patil
University Department of Business Management in partial fulfillment of the
requirements for the award of the Degree of Doctor of Philosophy in
Business Management and that the thesis has not formed the basis for the
award previously of any degree, diploma, associate ship, fellowship or any
other similar title of any University or Institution.
Also certified that the thesis represents an independent work on the part of
the candidate.
Place:
Date:
Signature of the Signature of the Guide Head of the dept.

ACKNOWLEDGEMENT
I am extremely grateful to my Lord Jesus Christ for showering me all the blessings
during the whole of this project.
I am greatly indebted to the Padmashree Dr. D.Y. Patil University, Department of
Business Management which has accepted me for the Doctoral Program and provided
me with an excellent opportunity to carry out the present research work. I would like
to specially thank Dr. R.Gopal for the understanding and with whose cooperation it
was possible for me to complete this research in conformance to the high standards set
by the University.
I am grateful to my guide, mentor, philosopher Dr. R.K.Srivastava for the immense
contribution in having guided me throughout the research for providing his
constructive criticism which kept me focused on my goals.
I would like to thank Mr. Mahesh Mahtolia and the team of Nexgen Market Research
Services Pvt Ltd along with Mr. S.M.Anis of Intertec Consulting for their excellent
assistance that helped me in collecting authentic data from Calcutta, Chennai and
Delhi customers.
I would like to thank Dr Manideepa Patnaik – Editor in Chief of IJBDI for guiding me
on writing my thesis. I would also sincerely thank Dr. Sachin of NITIE and Dr. Alice
of AIM for their training on using SPSS.
I am extremely grateful to the support from SFIMAR. I am also grateful to all my
relatives who constantly encouraged me through the difficult times including my
family to patiently bear with me on this project.
Place: Date: Signature of the student
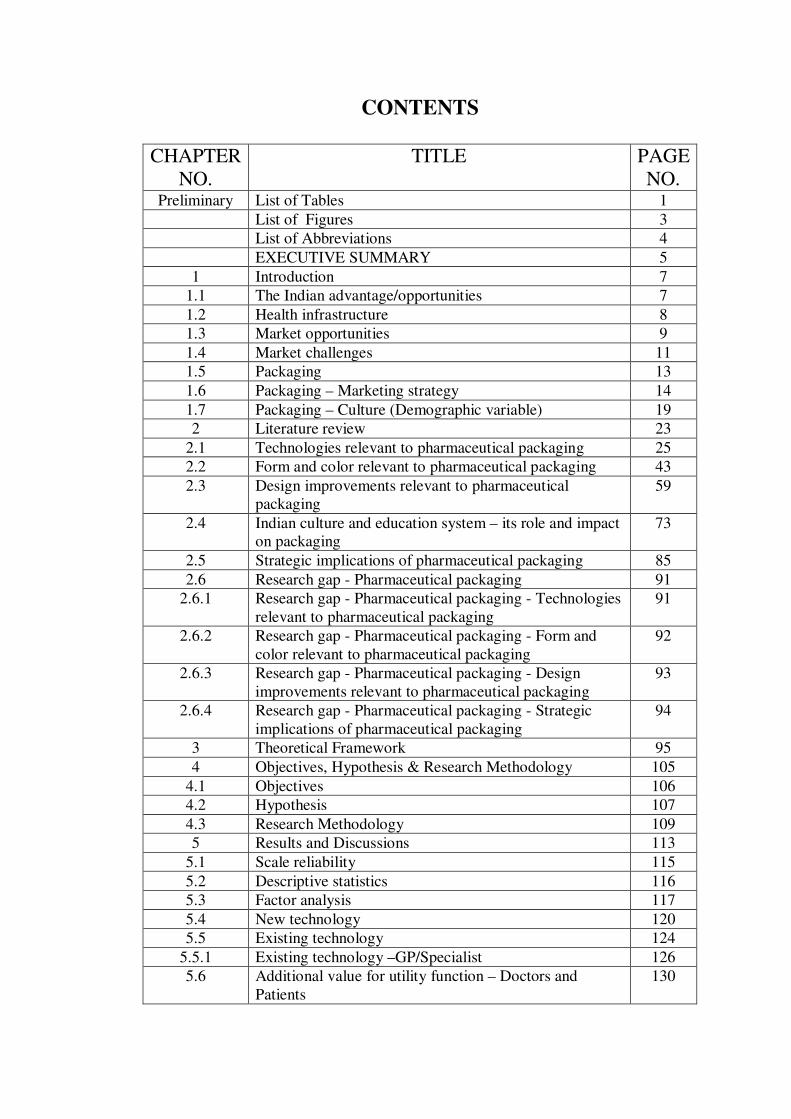
CONTENTS
CHAPTER
NO. TITLE PAGE
NO. Preliminary List of Tables 1
List of Figures 3 List of Abbreviations 4 EXECUTIVE SUMMARY 5 1 Introduction 7
1.1 The Indian advantage/opportunities 7 1.2 Health infrastructure 8 1.3 Market opportunities 9 1.4 Market challenges 11 1.5 Packaging 13 1.6 Packaging – Marketing strategy 14 1.7 Packaging – Culture (Demographic variable) 19 2 Literature review 23
2.1 Technologies relevant to pharmaceutical packaging 25 2.2 Form and color relevant to pharmaceutical packaging 43 2.3 Design improvements relevant to pharmaceutical
packaging 59
2.4 Indian culture and education system – its role and impact on packaging
73
2.5 Strategic implications of pharmaceutical packaging 85 2.6 Research gap - Pharmaceutical packaging 91
2.6.1 Research gap - Pharmaceutical packaging - Technologies relevant to pharmaceutical packaging
91
2.6.2 Research gap - Pharmaceutical packaging - Form and color relevant to pharmaceutical packaging
92
2.6.3 Research gap - Pharmaceutical packaging - Design improvements relevant to pharmaceutical packaging
93
2.6.4 Research gap - Pharmaceutical packaging - Strategic implications of pharmaceutical packaging
94
3 Theoretical Framework 95 4 Objectives, Hypothesis & Research Methodology 105
4.1 Objectives 106 4.2 Hypothesis 107 4.3 Research Methodology 109 5 Results and Discussions 113
5.1 Scale reliability 115 5.2 Descriptive statistics 116 5.3 Factor analysis 117 5.4 New technology 120 5.5 Existing technology 124
5.5.1 Existing technology –GP/Specialist 126 5.6 Additional value for utility function – Doctors and
Patients 130
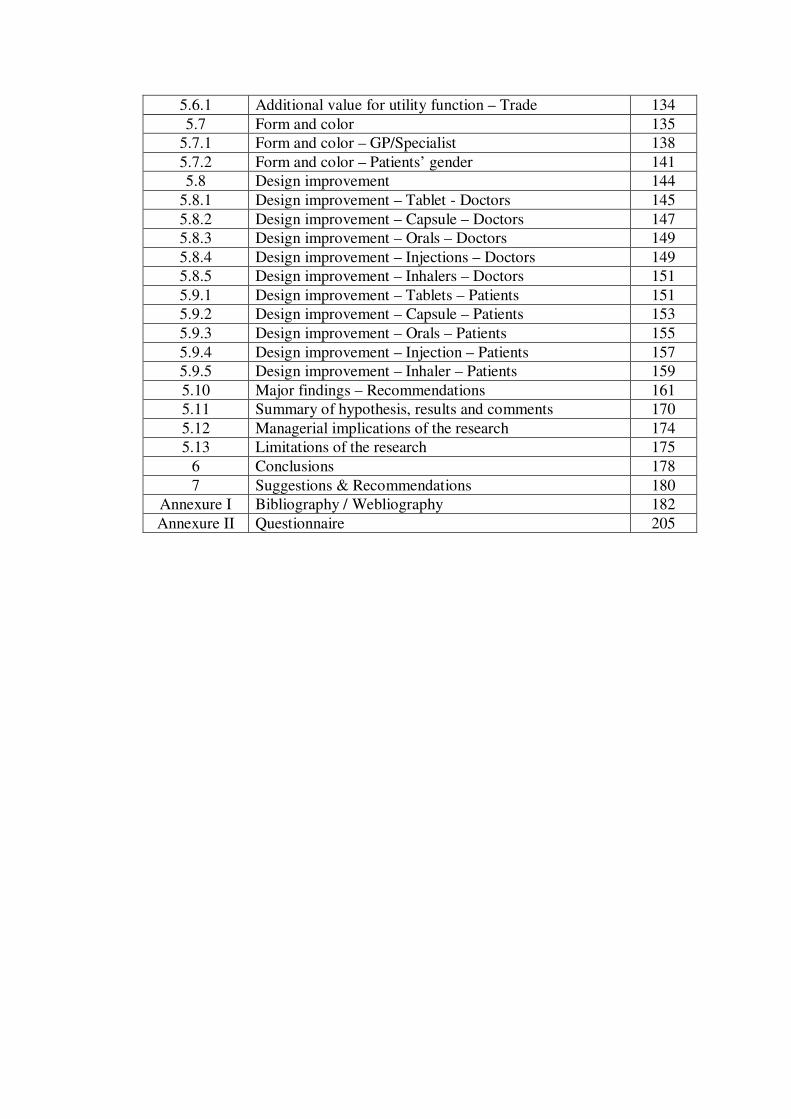
5.6.1 Additional value for utility function – Trade 134 5.7 Form and color 135
5.7.1 Form and color – GP/Specialist 138 5.7.2 Form and color – Patients’ gender 141 5.8 Design improvement 144
5.8.1 Design improvement – Tablet - Doctors 145 5.8.2 Design improvement – Capsule – Doctors 147 5.8.3 Design improvement – Orals – Doctors 149 5.8.4 Design improvement – Injections – Doctors 149 5.8.5 Design improvement – Inhalers – Doctors 151 5.9.1 Design improvement – Tablets – Patients 151 5.9.2 Design improvement – Capsule – Patients 153 5.9.3 Design improvement – Orals – Patients 155 5.9.4 Design improvement – Injection – Patients 157 5.9.5 Design improvement – Inhaler – Patients 159 5.10 Major findings – Recommendations 161 5.11 Summary of hypothesis, results and comments 170 5.12 Managerial implications of the research 174 5.13 Limitations of the research 175
6 Conclusions 178 7 Suggestions & Recommendations 180
Annexure I Bibliography / Webliography 182 Annexure II Questionnaire 205
1
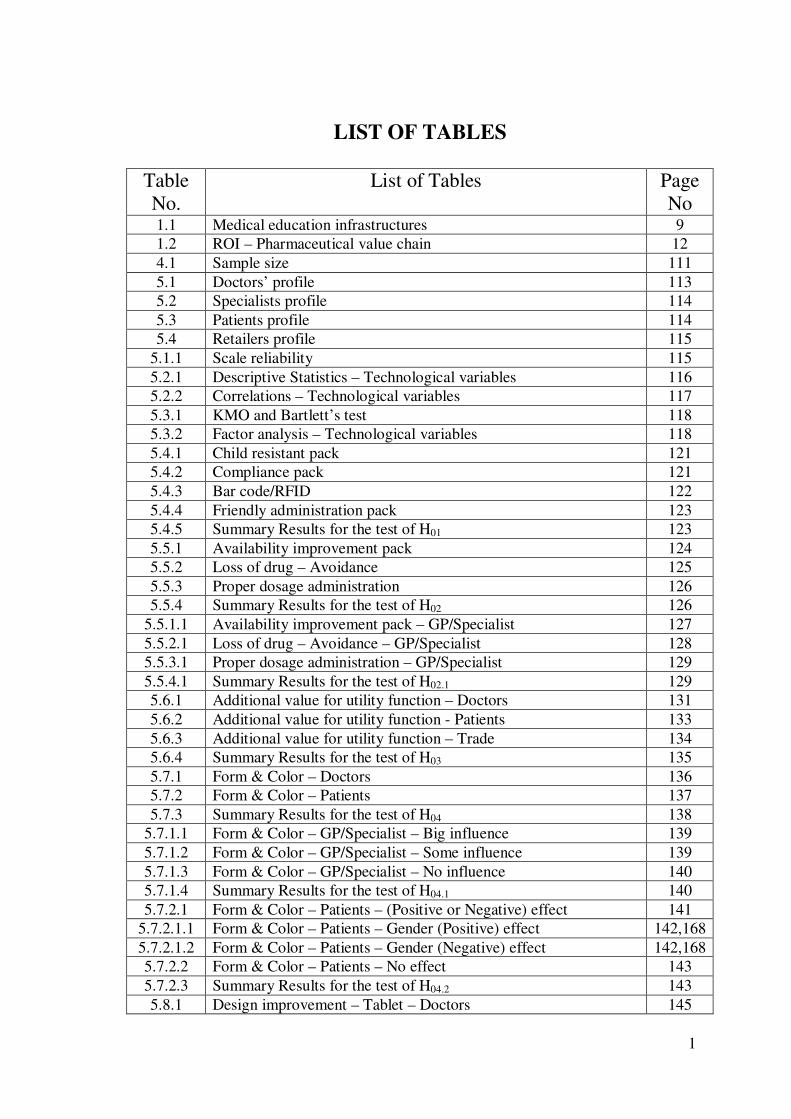
LIST OF TABLES
Table No.
List of Tables Page No
1.1 Medical education infrastructures 9 1.2 ROI – Pharmaceutical value chain 12 4.1 Sample size 111 5.1 Doctors’ profile 113 5.2 Specialists profile 114 5.3 Patients profile 114 5.4 Retailers profile 115
5.1.1 Scale reliability 115 5.2.1 Descriptive Statistics – Technological variables 116 5.2.2 Correlations – Technological variables 117 5.3.1 KMO and Bartlett’s test 118 5.3.2 Factor analysis – Technological variables 118 5.4.1 Child resistant pack 121 5.4.2 Compliance pack 121 5.4.3 Bar code/RFID 122 5.4.4 Friendly administration pack 123 5.4.5 Summary Results for the test of H01 123 5.5.1 Availability improvement pack 124 5.5.2 Loss of drug – Avoidance 125 5.5.3 Proper dosage administration 126 5.5.4 Summary Results for the test of H02 126
5.5.1.1 Availability improvement pack – GP/Specialist 127 5.5.2.1 Loss of drug – Avoidance – GP/Specialist 128 5.5.3.1 Proper dosage administration – GP/Specialist 129 5.5.4.1 Summary Results for the test of H02.1 129 5.6.1 Additional value for utility function – Doctors 131 5.6.2 Additional value for utility function - Patients 133 5.6.3 Additional value for utility function – Trade 134 5.6.4 Summary Results for the test of H03 135 5.7.1 Form & Color – Doctors 136 5.7.2 Form & Color – Patients 137 5.7.3 Summary Results for the test of H04 138
5.7.1.1 Form & Color – GP/Specialist – Big influence 139 5.7.1.2 Form & Color – GP/Specialist – Some influence 139 5.7.1.3 Form & Color – GP/Specialist – No influence 140 5.7.1.4 Summary Results for the test of H04.1 140 5.7.2.1 Form & Color – Patients – (Positive or Negative) effect 141
5.7.2.1.1 Form & Color – Patients – Gender (Positive) effect 142,168 5.7.2.1.2 Form & Color – Patients – Gender (Negative) effect 142,168 5.7.2.2 Form & Color – Patients – No effect 143 5.7.2.3 Summary Results for the test of H04.2 143 5.8.1 Design improvement – Tablet – Doctors 145
2
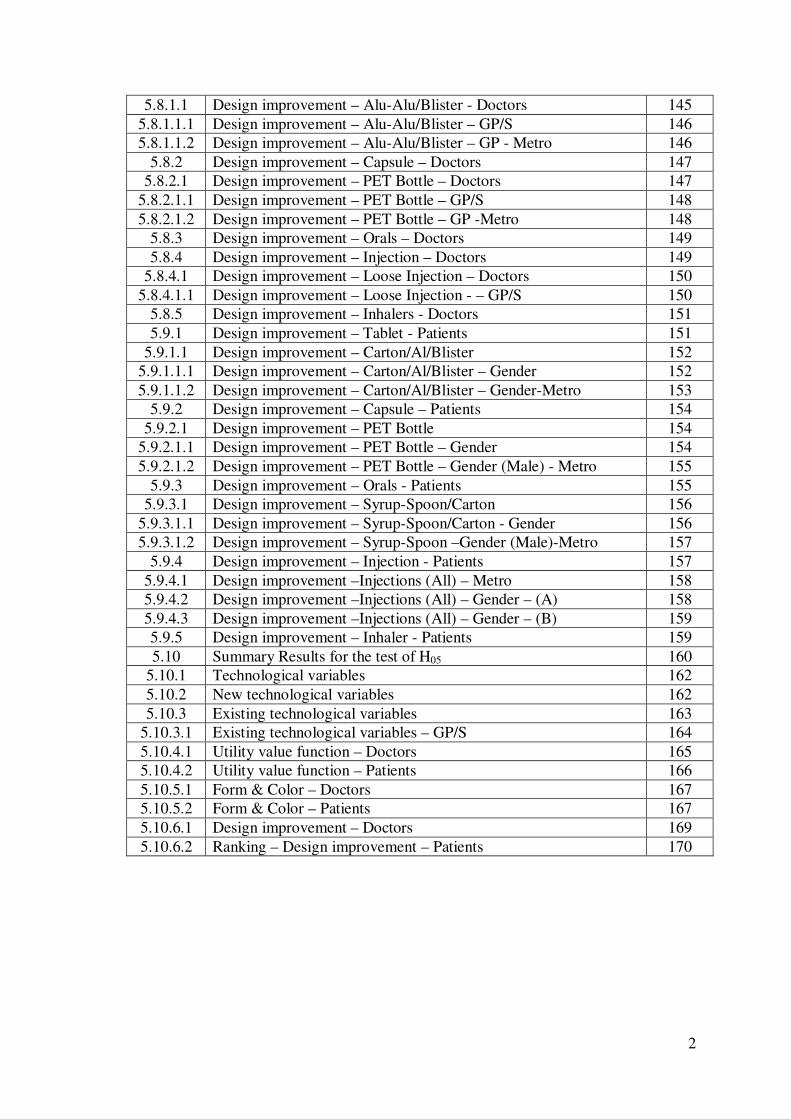
5.8.1.1 Design improvement – Alu-Alu/Blister - Doctors 145 5.8.1.1.1 Design improvement – Alu-Alu/Blister – GP/S 146 5.8.1.1.2 Design improvement – Alu-Alu/Blister – GP - Metro 146
5.8.2 Design improvement – Capsule – Doctors 147 5.8.2.1 Design improvement – PET Bottle – Doctors 147
5.8.2.1.1 Design improvement – PET Bottle – GP/S 148 5.8.2.1.2 Design improvement – PET Bottle – GP -Metro 148
5.8.3 Design improvement – Orals – Doctors 149 5.8.4 Design improvement – Injection – Doctors 149
5.8.4.1 Design improvement – Loose Injection – Doctors 150 5.8.4.1.1 Design improvement – Loose Injection - – GP/S 150
5.8.5 Design improvement – Inhalers - Doctors 151 5.9.1 Design improvement – Tablet - Patients 151
5.9.1.1 Design improvement – Carton/Al/Blister 152 5.9.1.1.1 Design improvement – Carton/Al/Blister – Gender 152 5.9.1.1.2 Design improvement – Carton/Al/Blister – Gender-Metro 153
5.9.2 Design improvement – Capsule – Patients 154 5.9.2.1 Design improvement – PET Bottle 154
5.9.2.1.1 Design improvement – PET Bottle – Gender 154 5.9.2.1.2 Design improvement – PET Bottle – Gender (Male) - Metro 155
5.9.3 Design improvement – Orals - Patients 155 5.9.3.1 Design improvement – Syrup-Spoon/Carton 156
5.9.3.1.1 Design improvement – Syrup-Spoon/Carton - Gender 156 5.9.3.1.2 Design improvement – Syrup-Spoon –Gender (Male)-Metro 157
5.9.4 Design improvement – Injection - Patients 157 5.9.4.1 Design improvement –Injections (All) – Metro 158 5.9.4.2 Design improvement –Injections (All) – Gender – (A) 158 5.9.4.3 Design improvement –Injections (All) – Gender – (B) 159 5.9.5 Design improvement – Inhaler - Patients 159 5.10 Summary Results for the test of H05 160
5.10.1 Technological variables 162 5.10.2 New technological variables 162 5.10.3 Existing technological variables 163
5.10.3.1 Existing technological variables – GP/S 164 5.10.4.1 Utility value function – Doctors 165 5.10.4.2 Utility value function – Patients 166 5.10.5.1 Form & Color – Doctors 167 5.10.5.2 Form & Color – Patients 167 5.10.6.1 Design improvement – Doctors 169 5.10.6.2 Ranking – Design improvement – Patients 170
3
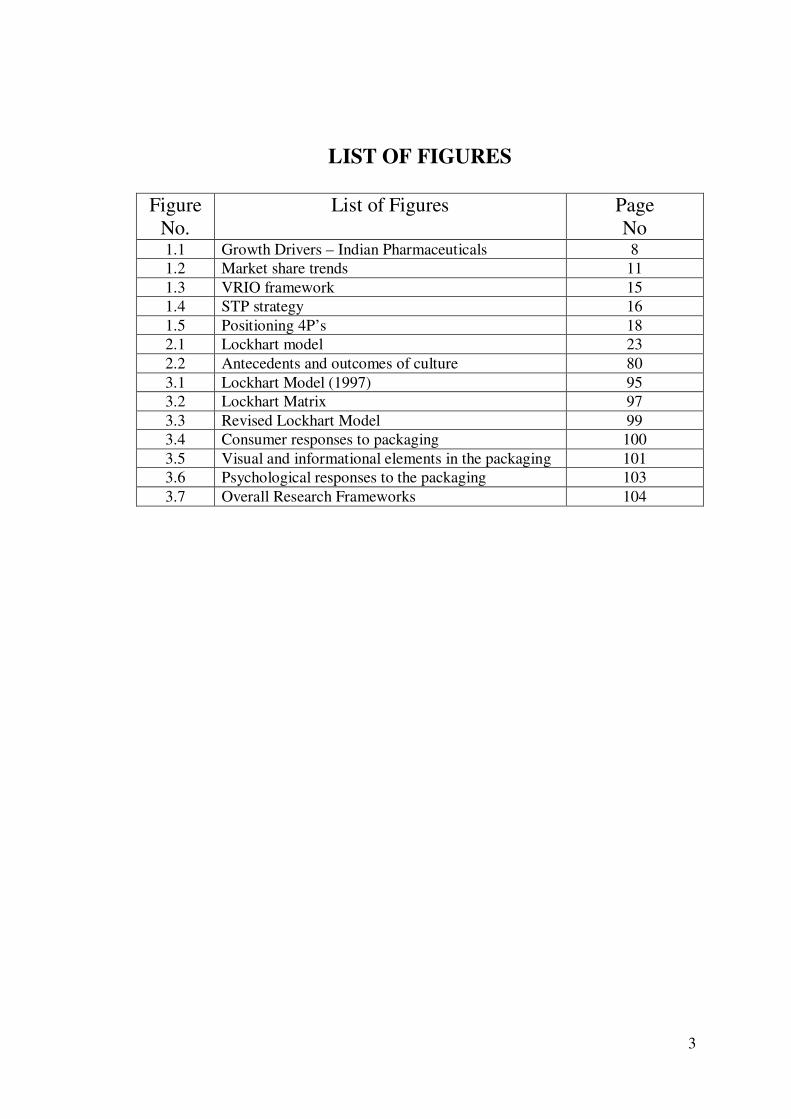
LIST OF FIGURES
Figure
No. List of Figures Page
No 1.1 Growth Drivers – Indian Pharmaceuticals 8 1.2 Market share trends 11 1.3 VRIO framework 15 1.4 STP strategy 16 1.5 Positioning 4P’s 18 2.1 Lockhart model 23 2.2 Antecedents and outcomes of culture 80 3.1 Lockhart Model (1997) 95 3.2 Lockhart Matrix 97 3.3 Revised Lockhart Model 99 3.4 Consumer responses to packaging 100 3.5 Visual and informational elements in the packaging 101 3.6 Psychological responses to the packaging 103 3.7 Overall Research Frameworks 104
4
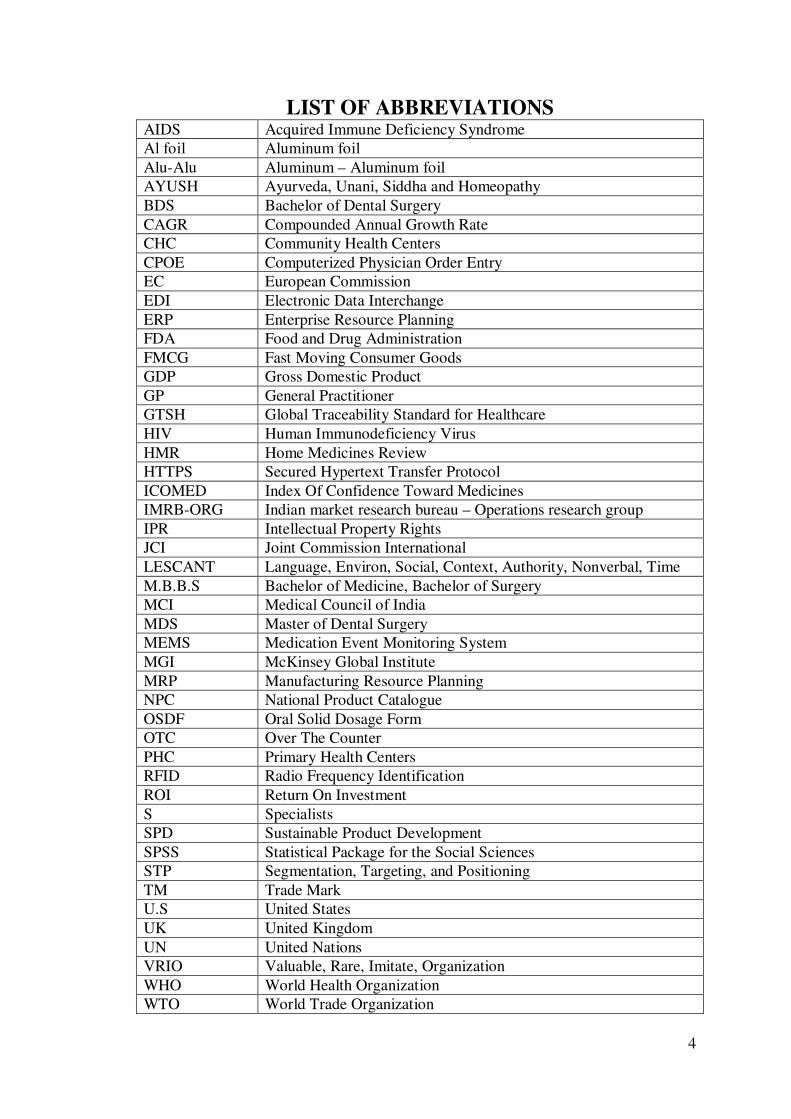
LIST OF ABBREVIATIONS AIDS Acquired Immune Deficiency Syndrome Al foil Aluminum foil Alu-Alu Aluminum – Aluminum foil AYUSH Ayurveda, Unani, Siddha and Homeopathy BDS Bachelor of Dental Surgery CAGR Compounded Annual Growth Rate CHC Community Health Centers CPOE Computerized Physician Order Entry EC European Commission EDI Electronic Data Interchange ERP Enterprise Resource Planning FDA Food and Drug Administration FMCG Fast Moving Consumer Goods GDP Gross Domestic Product GP General Practitioner GTSH Global Traceability Standard for Healthcare HIV Human Immunodeficiency Virus HMR Home Medicines Review HTTPS Secured Hypertext Transfer Protocol ICOMED Index Of Confidence Toward Medicines IMRB-ORG Indian market research bureau – Operations research group IPR Intellectual Property Rights JCI Joint Commission International LESCANT Language, Environ, Social, Context, Authority, Nonverbal, Time M.B.B.S Bachelor of Medicine, Bachelor of Surgery MCI Medical Council of India MDS Master of Dental Surgery MEMS Medication Event Monitoring System MGI McKinsey Global Institute MRP Manufacturing Resource Planning NPC National Product Catalogue OSDF Oral Solid Dosage Form OTC Over The Counter PHC Primary Health Centers RFID Radio Frequency Identification ROI Return On Investment S Specialists SPD Sustainable Product Development SPSS Statistical Package for the Social Sciences STP Segmentation, Targeting, and Positioning TM Trade Mark U.S United States UK United Kingdom UN United Nations VRIO Valuable, Rare, Imitate, Organization WHO World Health Organization WTO World Trade Organization
5
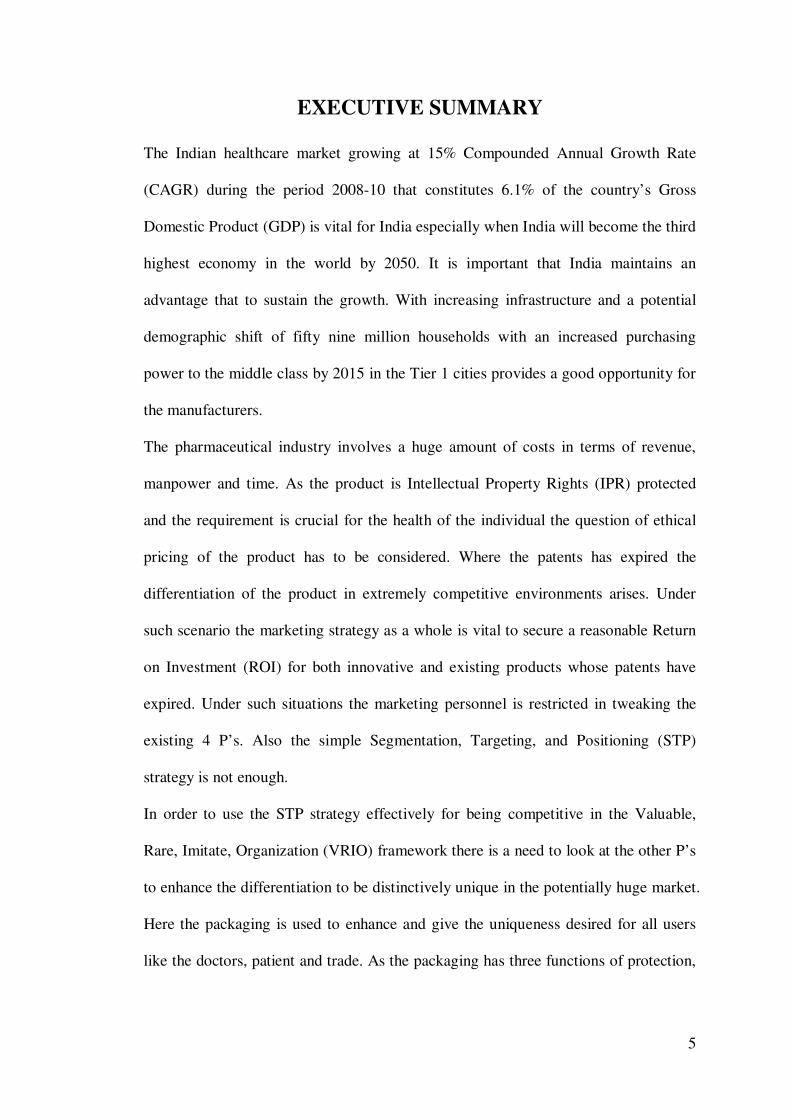
EXECUTIVE SUMMARY
The Indian healthcare market growing at 15% Compounded Annual Growth Rate
(CAGR) during the period 2008-10 that constitutes 6.1% of the country’s Gross
Domestic Product (GDP) is vital for India especially when India will become the third
highest economy in the world by 2050. It is important that India maintains an
advantage that to sustain the growth. With increasing infrastructure and a potential
demographic shift of fifty nine million households with an increased purchasing
power to the middle class by 2015 in the Tier 1 cities provides a good opportunity for
the manufacturers.
The pharmaceutical industry involves a huge amount of costs in terms of revenue,
manpower and time. As the product is Intellectual Property Rights (IPR) protected
and the requirement is crucial for the health of the individual the question of ethical
pricing of the product has to be considered. Where the patents has expired the
differentiation of the product in extremely competitive environments arises. Under
such scenario the marketing strategy as a whole is vital to secure a reasonable Return
on Investment (ROI) for both innovative and existing products whose patents have
expired. Under such situations the marketing personnel is restricted in tweaking the
existing 4 P’s. Also the simple Segmentation, Targeting, and Positioning (STP)
strategy is not enough.
In order to use the STP strategy effectively for being competitive in the Valuable,
Rare, Imitate, Organization (VRIO) framework there is a need to look at the other P’s
to enhance the differentiation to be distinctively unique in the potentially huge market.
Here the packaging is used to enhance and give the uniqueness desired for all users
like the doctors, patient and trade. As the packaging has three functions of protection,
6
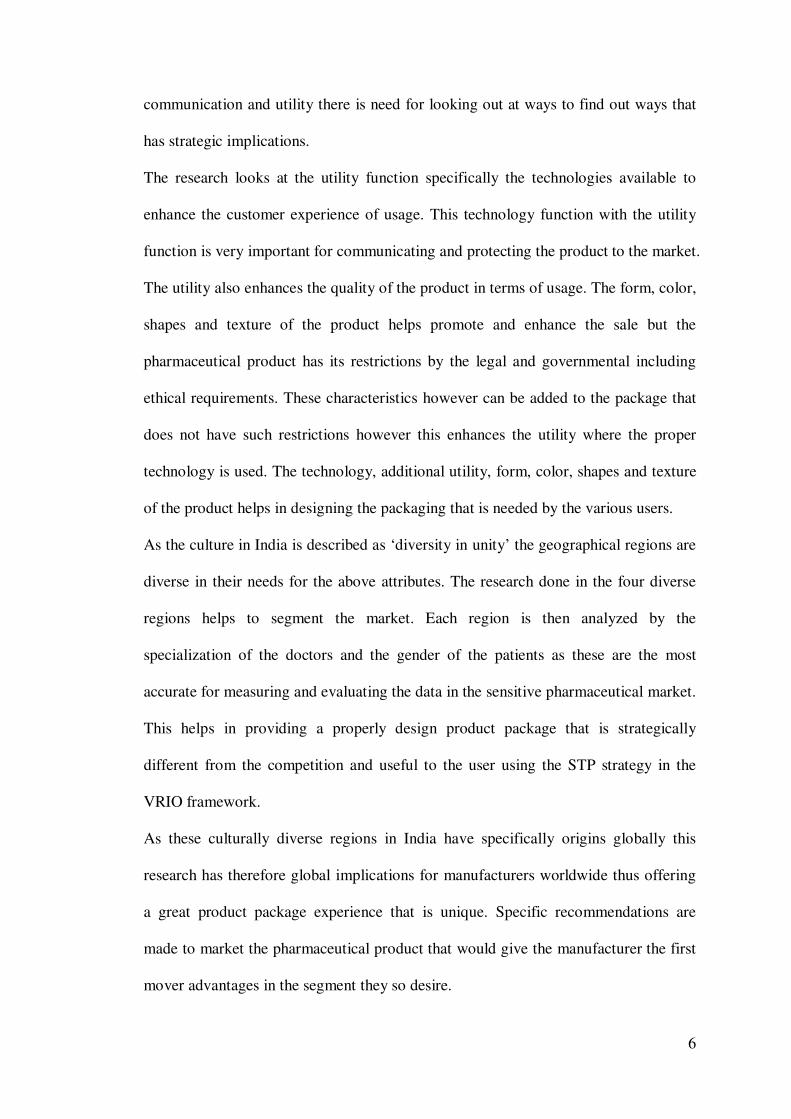
communication and utility there is need for looking out at ways to find out ways that
has strategic implications.
The research looks at the utility function specifically the technologies available to
enhance the customer experience of usage. This technology function with the utility
function is very important for communicating and protecting the product to the market.
The utility also enhances the quality of the product in terms of usage. The form, color,
shapes and texture of the product helps promote and enhance the sale but the
pharmaceutical product has its restrictions by the legal and governmental including
ethical requirements. These characteristics however can be added to the package that
does not have such restrictions however this enhances the utility where the proper
technology is used. The technology, additional utility, form, color, shapes and texture
of the product helps in designing the packaging that is needed by the various users.
As the culture in India is described as ‘diversity in unity’ the geographical regions are
diverse in their needs for the above attributes. The research done in the four diverse
regions helps to segment the market. Each region is then analyzed by the
specialization of the doctors and the gender of the patients as these are the most
accurate for measuring and evaluating the data in the sensitive pharmaceutical market.
This helps in providing a properly design product package that is strategically
different from the competition and useful to the user using the STP strategy in the
VRIO framework.
As these culturally diverse regions in India have specifically origins globally this
research has therefore global implications for manufacturers worldwide thus offering
a great product package experience that is unique. Specific recommendations are
made to market the pharmaceutical product that would give the manufacturer the first
mover advantages in the segment they so desire.
7
Chapter – 1
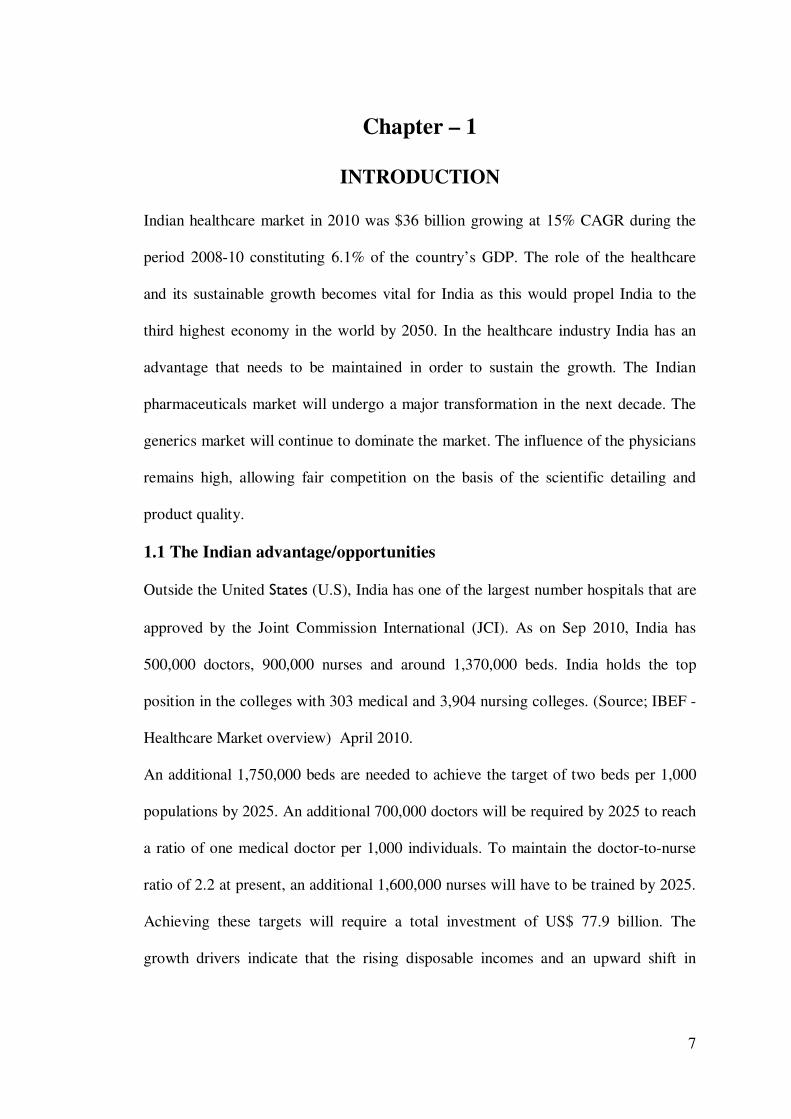
INTRODUCTION
Indian healthcare market in 2010 was $36 billion growing at 15% CAGR during the
period 2008-10 constituting 6.1% of the country’s GDP. The role of the healthcare
and its sustainable growth becomes vital for India as this would propel India to the
third highest economy in the world by 2050. In the healthcare industry India has an
advantage that needs to be maintained in order to sustain the growth. The Indian
pharmaceuticals market will undergo a major transformation in the next decade. The
generics market will continue to dominate the market. The influence of the physicians
remains high, allowing fair competition on the basis of the scientific detailing and
product quality.
1.1 The Indian advantage/opportunities
Outside the United States (U.S), India has one of the largest number hospitals that are
approved by the Joint Commission International (JCI). As on Sep 2010, India has
500,000 doctors, 900,000 nurses and around 1,370,000 beds. India holds the top
position in the colleges with 303 medical and 3,904 nursing colleges. (Source; IBEF -
Healthcare Market overview) April 2010.
An additional 1,750,000 beds are needed to achieve the target of two beds per 1,000
populations by 2025. An additional 700,000 doctors will be required by 2025 to reach
a ratio of one medical doctor per 1,000 individuals. To maintain the doctor-to-nurse
ratio of 2.2 at present, an additional 1,600,000 nurses will have to be trained by 2025.
Achieving these targets will require a total investment of US$ 77.9 billion. The
growth drivers indicate that the rising disposable incomes and an upward shift in
8
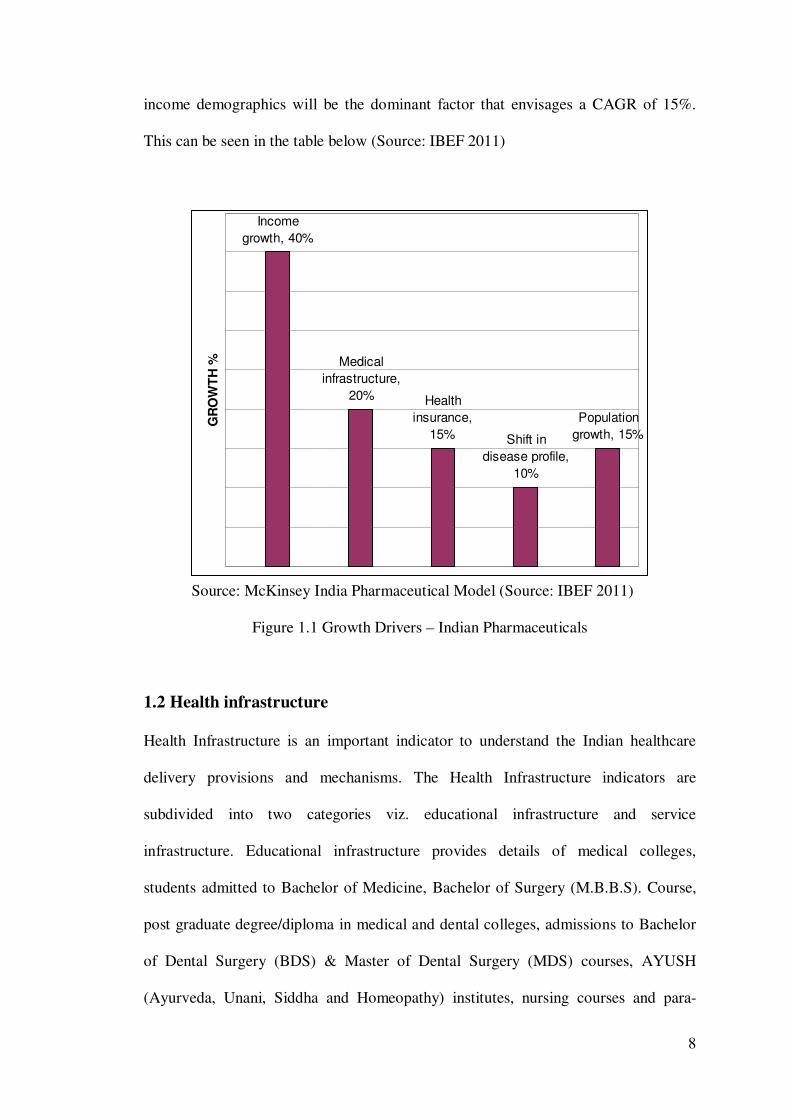
income demographics will be the dominant factor that envisages a CAGR of 15%.
This can be seen in the table below (Source: IBEF 2011)
Income
growth, 40%
Medical
infrastructure,
20% Health
insurance,
15% Shift in
disease profile,
10%
Population
growth, 15%
GR
OW
TH
%
Source: McKinsey India Pharmaceutical Model (Source: IBEF 2011)
Figure 1.1 Growth Drivers – Indian Pharmaceuticals
1.2 Health infrastructure
Health Infrastructure is an important indicator to understand the Indian healthcare
delivery provisions and mechanisms. The Health Infrastructure indicators are
subdivided into two categories viz. educational infrastructure and service
infrastructure. Educational infrastructure provides details of medical colleges,
students admitted to Bachelor of Medicine, Bachelor of Surgery (M.B.B.S). Course,
post graduate degree/diploma in medical and dental colleges, admissions to Bachelor
of Dental Surgery (BDS) & Master of Dental Surgery (MDS) courses, AYUSH
(Ayurveda, Unani, Siddha and Homeopathy) institutes, nursing courses and para-
9
medical courses. Service infrastructure in health include details of allopathic hospitals,
hospital beds, Indian System of Medicine & Homeopathy hospitals, sub centers, PHC
(Primary Health Centers), CHC (Community Health Centers), blood banks, mental
hospitals and cancer hospitals.
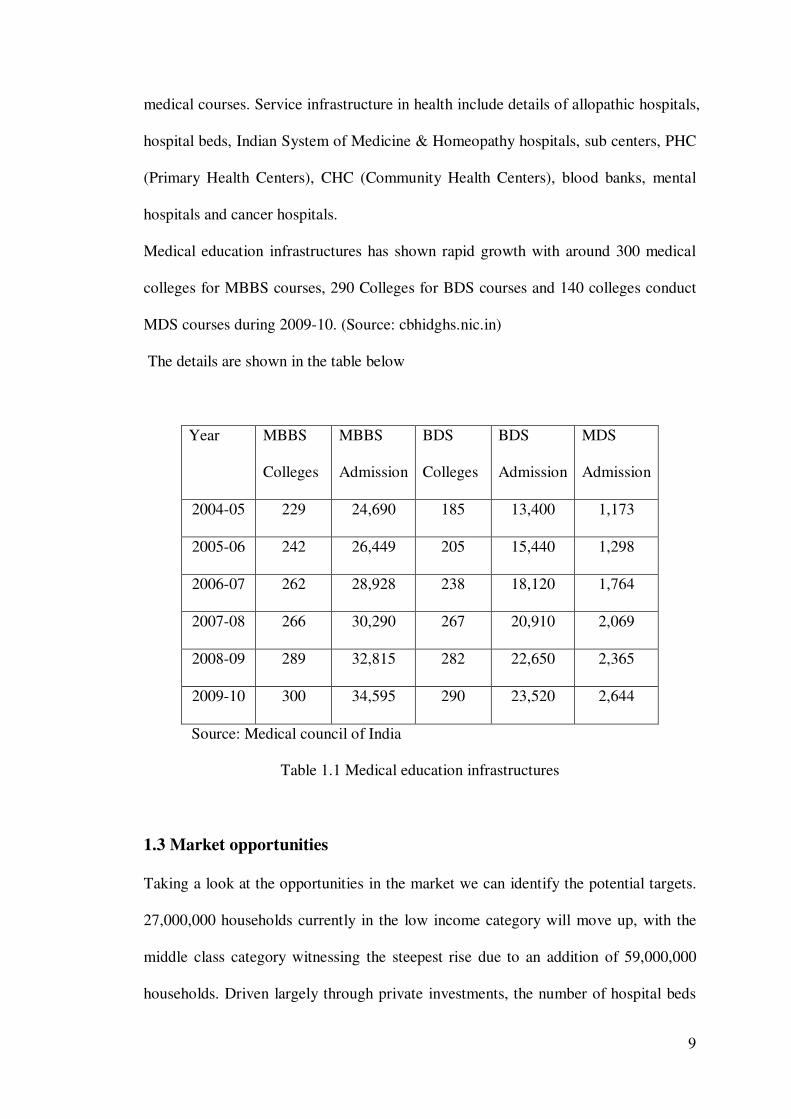
Medical education infrastructures has shown rapid growth with around 300 medical
colleges for MBBS courses, 290 Colleges for BDS courses and 140 colleges conduct
MDS courses during 2009-10. (Source: cbhidghs.nic.in)
The details are shown in the table below
Year MBBS
Colleges
MBBS
Admission
BDS
Colleges
BDS
Admission
MDS
Admission
2004-05 229 24,690 185 13,400 1,173
2005-06 242 26,449 205 15,440 1,298
2006-07 262 28,928 238 18,120 1,764
2007-08 266 30,290 267 20,910 2,069
2008-09 289 32,815 282 22,650 2,365
2009-10 300 34,595 290 23,520 2,644
Source: Medical council of India
Table 1.1 Medical education infrastructures
1.3 Market opportunities
Taking a look at the opportunities in the market we can identify the potential targets.
27,000,000 households currently in the low income category will move up, with the
middle class category witnessing the steepest rise due to an addition of 59,000,000
households. Driven largely through private investments, the number of hospital beds
10
and physicians in the country is expected to double by 2015 (i.e., additional 2,000,000
hospital beds and 400,000 physicians). India is primarily a branded generic market
where the influence of physicians remains high allowing fair competition on the basis
of product quality and scientific dealing. However the influence of individual
pharmacy distributors and retails chains are on the rise. The current market is mainly
from Tier 1 markets (8 cities with the population of over 4,000,000) which account
for nearly 60% of the market with the Tier 2 market (26 cities with the population of
over 1-4,000,000) accounting for the balance 40%. The significant share of the Tier 2
market is credited to the strong wholesale distribution system. It is expected that by
the year 2015 the Tier 2 market would grow to 44% with an addition of 46,000,000
households with high and medium levels of affordability, whereas the Tier 1 market is
expected to add another 19,000,000 with similar affordability levels the rise of Tier 2
market has important implication in the pharmaceutical companies in terms of
matching the sales force deployment (which is currently only 20~30%) with reference
to the potential. However the two largest contributors, Delhi and Mumbai will
continue to be the country’s biggest markets. Another change expected is the rising
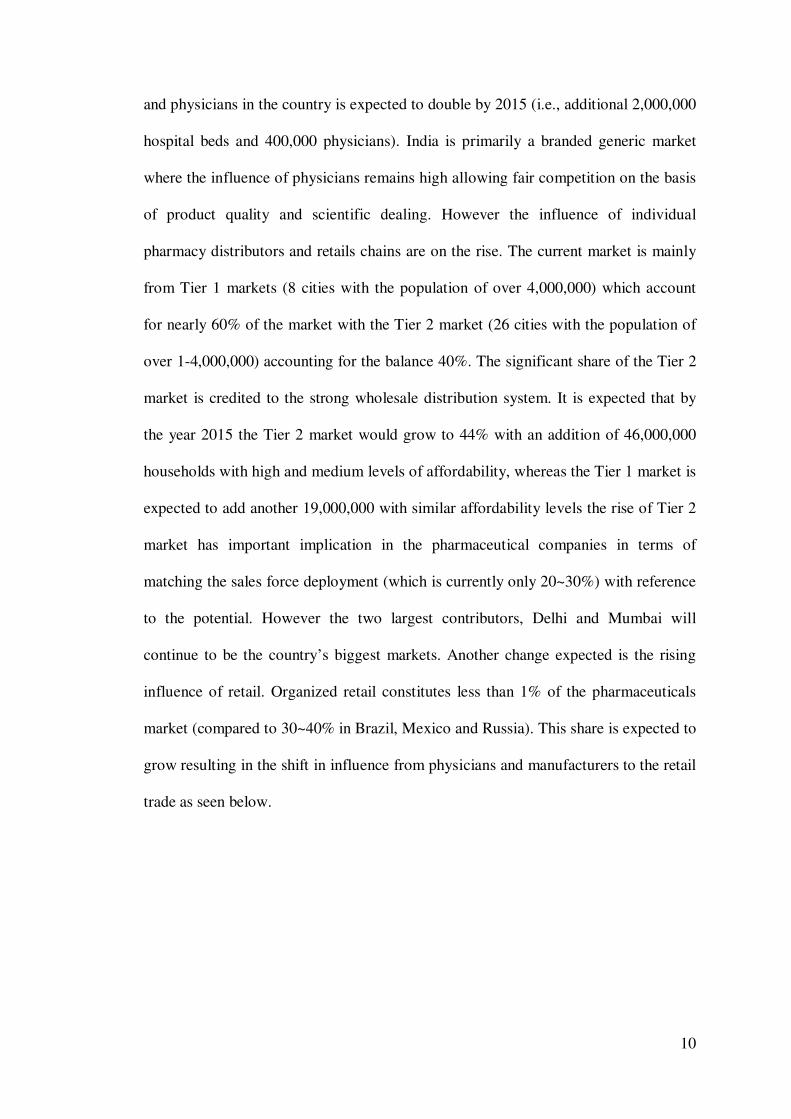
influence of retail. Organized retail constitutes less than 1% of the pharmaceuticals
market (compared to 30~40% in Brazil, Mexico and Russia). This share is expected to
grow resulting in the shift in influence from physicians and manufacturers to the retail
trade as seen below.
11
Figure 1.2 Market share trends (Source McKinsey on India: India Pharma 2015)
While it will take time to reach such levels in India, pharmaceutical companies will
do well to recognize this trend and prepare for the implications. (McKinsey on India:
India Pharma 2015)
The combination of market opportunities and the likely changes in the pharmaceutical
industry will have different implications for the pharmaceutical manufacturers. While
their strategies must take into account these implications, the policy makers need to
provide the appropriate incentives to encourage access and innovation.
1.4 Market challenges
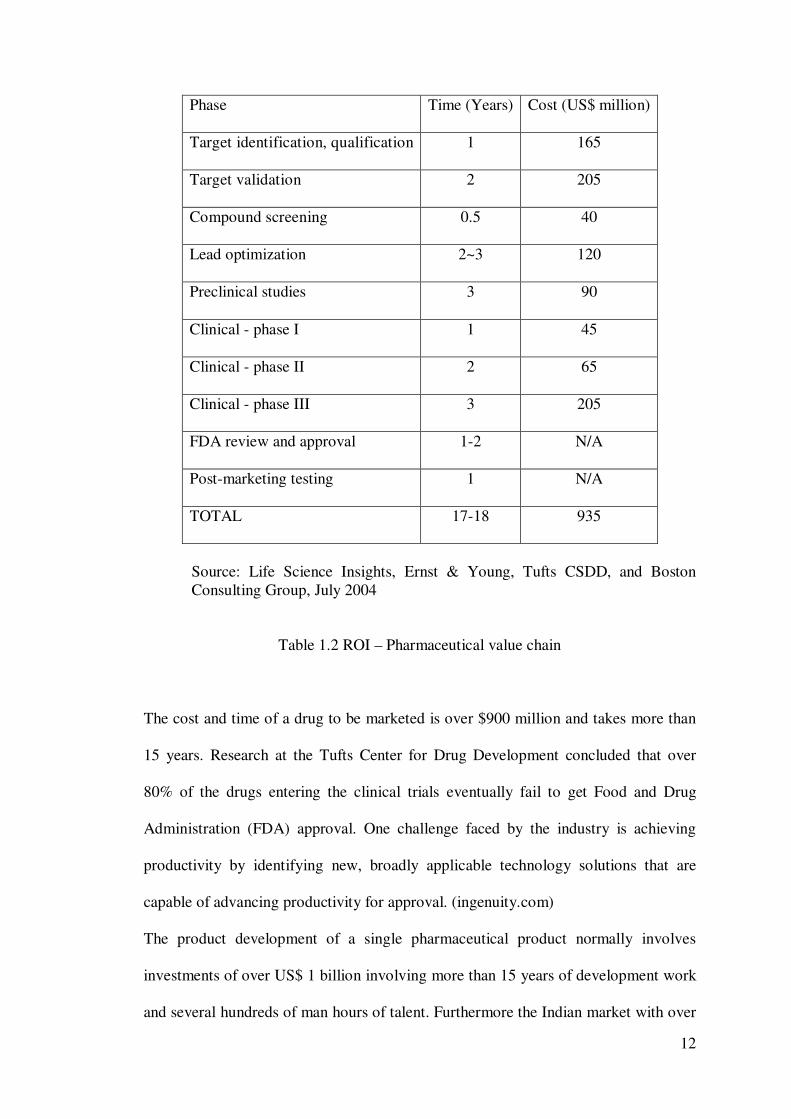
ROI is an underlying concern for all forms of business. The ROI that is realized in
the pharmaceutical value chain discovery to final product is shown below, including
the industry-accepted time and cost per phase
12
Phase Time (Years) Cost (US$ million)
Target identification, qualification 1 165
Target validation 2 205
Compound screening 0.5 40
Lead optimization 2~3 120
Preclinical studies 3 90
Clinical - phase I 1 45
Clinical - phase II 2 65
Clinical - phase III 3 205
FDA review and approval 1-2 N/A
Post-marketing testing 1 N/A
TOTAL 17-18 935
Source: Life Science Insights, Ernst & Young, Tufts CSDD, and Boston Consulting Group, July 2004
Table 1.2 ROI – Pharmaceutical value chain
The cost and time of a drug to be marketed is over $900 million and takes more than
15 years. Research at the Tufts Center for Drug Development concluded that over
80% of the drugs entering the clinical trials eventually fail to get Food and Drug
Administration (FDA) approval. One challenge faced by the industry is achieving
productivity by identifying new, broadly applicable technology solutions that are
capable of advancing productivity for approval. (ingenuity.com)
The product development of a single pharmaceutical product normally involves
investments of over US$ 1 billion involving more than 15 years of development work
and several hundreds of man hours of talent. Furthermore the Indian market with over
13
one billion people and over 75,000 brands there is a need to identify the key driver for
the market based on proper segmentation, targeting and positioning of the product in
order to formulate an effective competitive marketing strategy. There is a need to
offer a value added product that is differentiated from the competitor.
1.5 Packaging
All major industries create wealth however the packaging industry is one that plays a
unique role by way of both creation and preserving the wealth or value created by
many other industries. This is in addition to helping and lengthening the shelf life of
several products like milk, biscuits, drugs and medicines, processed foods, fruits and
vegetables, edible oils, electronic goods etc., besides appliances and industrial
machinery. Packaging, as distinct from “packing”, plays a visible and catalytic role in
the economy by the widespread adoption of branding of products and development
based on consumer preferences to the extent that any consumer product is packaged in
a manner that meets the criteria of safety, convenience and attractiveness. This helps
to gain market share boosting consumption and economic growth.
The Indian packaging industry was US$ 14 billion as of 2009 with a yearly growth
rate of 15%. Indian packaging industry constitutes around 15-20% of the
pharmaceutical industry market and the global market is estimated to be around 10%
of the global pharmaceutical industry. India is emerging as a global powerhouse in the
pharmaceutical business with a robust pipeline of products and healthy performance.
(Source: NSE India & ISB 2005)
14
1.6 Packaging – Marketing strategy
Indian packaging industry is very closely linked to the growth of pharmaceutical and
food industries. In the food and consumer product industries the companies like
Nestle, PepsiCo, United Breweries, Reckitt Benckiser and Asian paints there is a
growing consumer concern over packaging that is forcing consumer goods companies
to focus on the packaging of their products.
"People are becoming more health conscious and a growing trend towards well-
packed, branded products where there is value addition. This is the reason why Fast
Moving Consumer Goods (FMCG) companies have put a lot of emphasis on the
packaging that does not just ensure longer shelf life but also as a marketing strategy
tool. Sales volumes depend on the attractiveness of the packaging and companies are
ready to invest in them. Generally packaging of a product accounts for about 10-15
per cent of the products overall cost many companies are looking for cutting costs so
this has become an important marketing strategic implement.
Marketing strategy is a process that allows the organization to use its limited
resources on the greatest opportunities to increase sales and achieve a sustainable
competitive advantage. Michael Porter described how business needs to achieve and
maintain competitive advantage by looking at the “strategic scope” that is the demand
size and composition of the market you intend to target and the “strategic intent” that
is core competency of the firm. The identification of the relevant packaging
technologies and the prediction of which of these would increase the value or utility
of pharmaceutical product would increase the focus of differentiation from
competition. The need for maximization of the technology is to sustain the
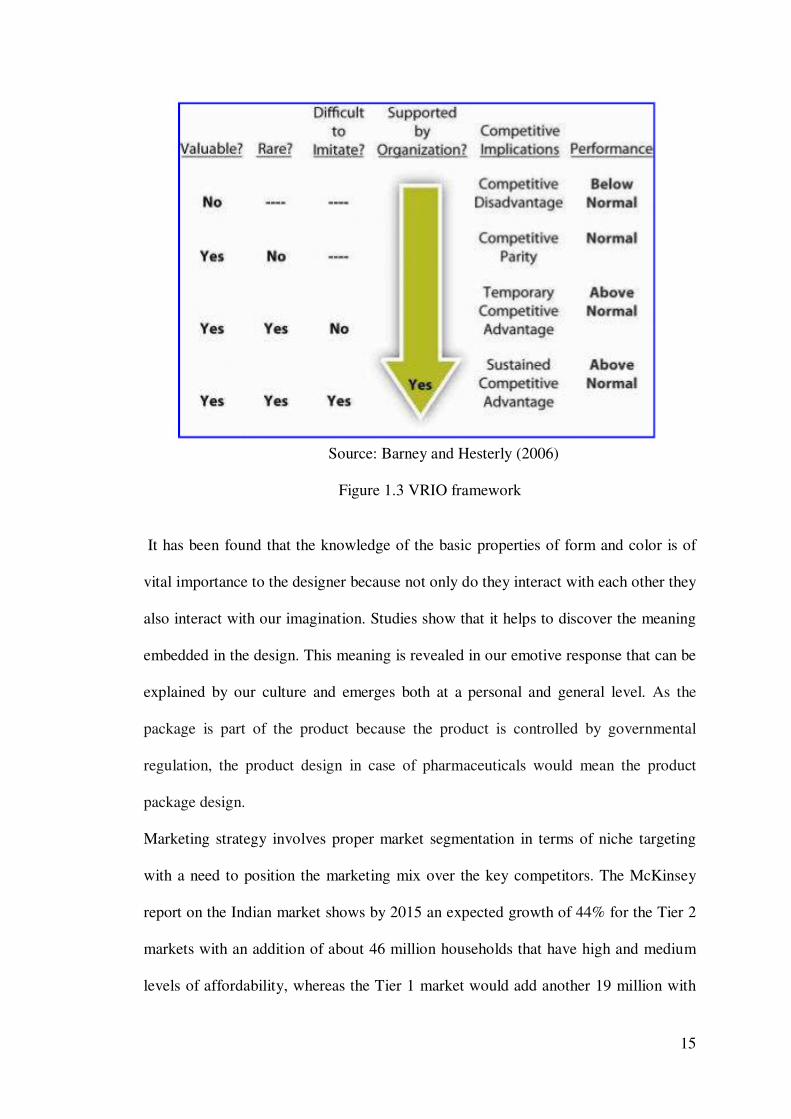
competitive advantage in terms of the VRIO framework as seen below.
15
Source: Barney and Hesterly (2006)
Figure 1.3 VRIO framework
It has been found that the knowledge of the basic properties of form and color is of
vital importance to the designer because not only do they interact with each other they
also interact with our imagination. Studies show that it helps to discover the meaning
embedded in the design. This meaning is revealed in our emotive response that can be
explained by our culture and emerges both at a personal and general level. As the
package is part of the product because the product is controlled by governmental
regulation, the product design in case of pharmaceuticals would mean the product
package design.
Marketing strategy involves proper market segmentation in terms of niche targeting
with a need to position the marketing mix over the key competitors. The McKinsey
report on the Indian market shows by 2015 an expected growth of 44% for the Tier 2
markets with an addition of about 46 million households that have high and medium
levels of affordability, whereas the Tier 1 market would add another 19 million with
16
similar affordability levels. Mumbai and Delhi will continue to be the country’s
biggest markets. The study conducted by McKinsey (2007) confirms specialist
treatments would make up for 45% of the market. The pharmaceutical drug can be
classified by the ‘route of administration’. This can be performed in various types
such as tablets, capsules, oral, inhalers and injections.
Marketing strategy is used for making better marketing campaigns as seen among the
consumers who respond to advertising. When introducing new products they are
usually adopted by a few customers and then gradually, to the rest of the market. In
order to achieve commercial success it is important to please initial customers, as they
will influence many subsequent customers’ brand choices. Before we place and
promote the product it is required to understand the STP strategy.
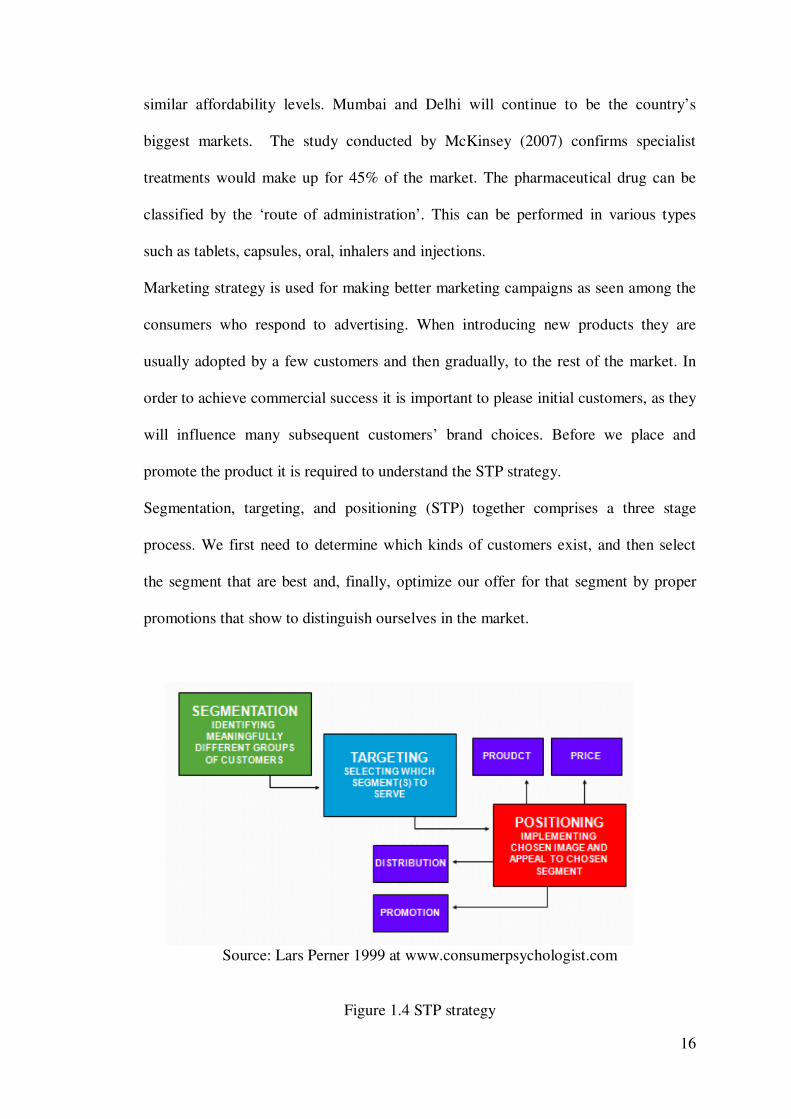
Segmentation, targeting, and positioning (STP) together comprises a three stage
process. We first need to determine which kinds of customers exist, and then select
the segment that are best and, finally, optimize our offer for that segment by proper
promotions that show to distinguish ourselves in the market.
Source: Lars Perner 1999 at www.consumerpsychologist.com
Figure 1.4 STP strategy
17
Segmentation involves finding out the consumers’ awareness and perception based on
their needs. Generically, there are three approaches to marketing. In the
undifferentiated strategy, almost all customers are treated equally, with the company
not making any specific marketing effort to satisfy any particular group. This usually
works for the product that is a standard one where the competitor really can’t offer a
marketing mix differently than another one. Usually, this is the case only for
commodities. In the concentrated strategy, one company chooses to focus on a
particular segment that exists while leaving the other segments to the competitors. For
example, focus on price sensitive consumers. In contrast, there is the differentiated
strategy: This involves offering quality that the customer values.
Segmentation calls for some tough choices. There are a large number of variables that
are used to differentiate customers of the product category; however, in practice, it is
difficult to work with more than a few at a time. Thus, a decision needs to be taken to
determine which variables will be optimal in distinguishing different groups of
customers. In the pharmaceutical industry these variables have been identified as
technological variables of the packaging that add value in the use of the
pharmaceutical product.
The strategy involves in selecting those variables together to arrive at the right
combinations that become strategic under the VRIO framework.
Segmentation is based on several types of variables. The main variable is
demographic. Demographic variables refers to education, income, gender, location
(rural vs. urban, North, East West & South) etc. It is also possible to segment based
on lifestyle and added values. Segmentation can also be on benefits sought, essentially
bypassing the demographic explanatory variables.
18
In the next step we need to decide the target of one or more segments. Our choice
should generally depend on several factors. First, how other competitors are serving
the existing segments? It may be more difficult to appeal to an already well served
segment instead of serving the segment whose needs are not being served well.
Secondly, it depends on how large is the segment, and the growth potential expected?
(The downside to the large, growing segment is that several competitors can be
attracted to it). Thirdly, it depends on the strengths of the company that will help to
offer particularly to one group of customers?
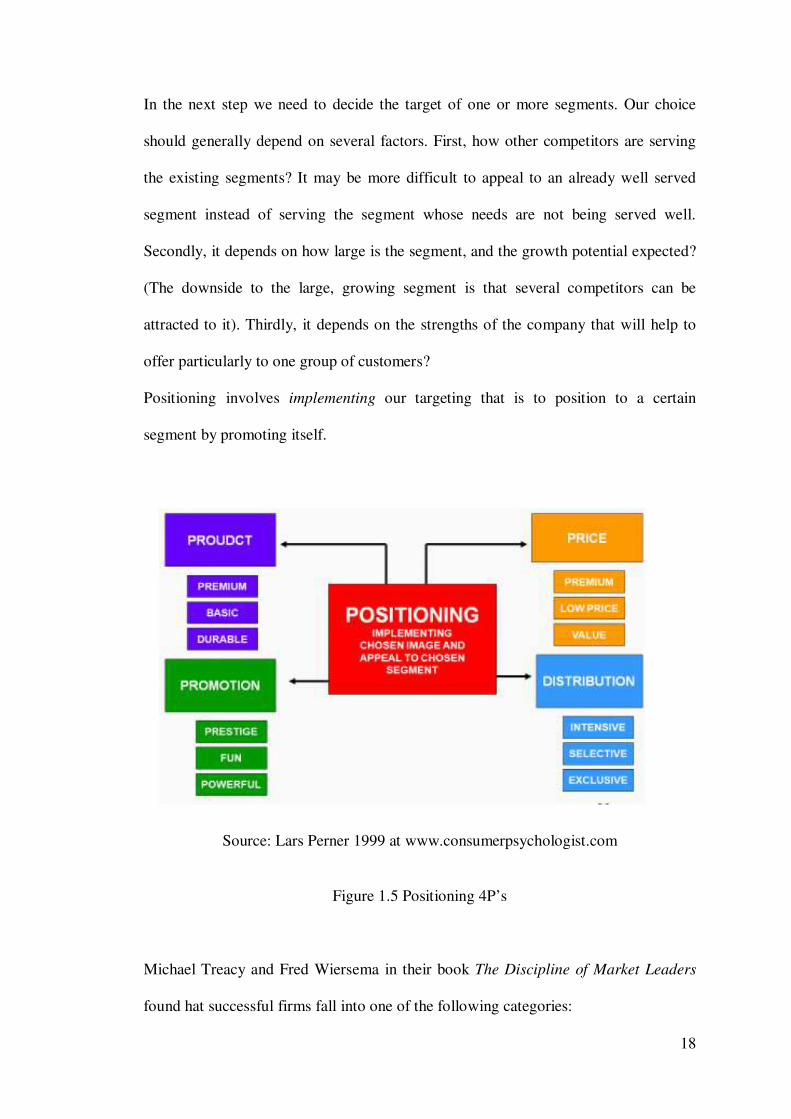
Positioning involves implementing our targeting that is to position to a certain
segment by promoting itself.
Source: Lars Perner 1999 at www.consumerpsychologist.com
Figure 1.5 Positioning 4P’s
Michael Treacy and Fred Wiersema in their book The Discipline of Market Leaders
found hat successful firms fall into one of the following categories:
19
Operationally excellent firms, who maintains a strong competitive advantage by using
exceptional efficiency, enables the firm to provide service that is reliable to the
consumer than those of their competitors who are less well organized. The emphasis
is mostly on reliable performance, and less on customizing the offering for the
specific customer. Here elaborate logistical designs are used using systems that are
extensive and forecasting specific needed quantities of supplies.
Customer intimate firms, who will excel in serving specific needs of the customer’s,
where there is less emphasis on efficiency, that is sacrificed for providing precise
requirements that is wanted by the customer. Reliability is also stressed.
Technologically excellent firms that produce advanced products with the latest
technology, thus constantly maintaining leadership in innovation. These firms have
costly technology needing constant refinement. They cannot be as efficient as
operationally excellent firms nor do they adapt their products to the needs of the
individual customer.
Treacy and Wiersema suggested that in addition to excelling on one value dimensions
the firms must meet acceptable levels of the other two.
Repositioning is an attempt to change customer perceptions of the brand, because the
existing position is less attractive. Repositioning in practice is very difficult to
accomplish. A great amount of financing is often needed for promotional efforts, and
in usually the repositioning fails in many cases. (www.consumerpsychologist.com)
1.7 Packaging – Culture (Demographic variable)
Business conduct varies from culture to culture. In general business is enhanced when
different cultural background find new approaches to old problems thus creating
solutions that combine cultural perspectives and examining the problem at hand from
each other's differing cultural perspectives.
20
Problems in business conducted across cultures determine the problems or differences
in traditions; communication practices, and thought processing.
Most barriers when across cultures derive from misgauge of the LESCANT
(Language, Environ, Social, Context, Authority, Nonverbal, and Time) factors. By
assessing in advance the roles these variables, one can improve one's ability to be
strategically effective. The LESCANT factors are:-
1. Language
2. Environmental and technological considerations
3. Social organization
4. Context and face-saving
5. Authority conception
6. Nonverbal communication behavior
7. Time conception
Demographics are clearly related to the regions subculture or segmentation. Here the
need is to shift focus from analyzing specific subcultures and trying to understand the
implications for the entire population of its makeup
Alaka Malwade Basu of India’s Institute of economic growth in her book ‘Culture,
the status of women and demographic behavior examined the cultural influences on
demographic behavior in Delhi. In her study of migrants one from North India and
other from South India differed in their cultural beliefs, attitudes and practices even
though they had similar socio-economic circumstances, religions and living
environments. The health culture was researched and found to be different showing
that the importances of health policies are culturally sensitive showing that the
influence of behavior is dependent on culture. (scholarspace.manoa.hawaii.edu)
21
Rohitashya Chattopadhyay, qualitative analysis based study on "Cultural influences
on Indian television commercials showed the participant observation and interviews
of how cultural texts influence the visual language of Indian television commercials.
Data was collected from five Indian cities-Bengaluroo, Chennai, Kolkata, Mumbai,
and New Delhi. The analysis showed different influence of texts from the different
regions where the commercial was produced. This shows that the four regions are
culturally different. Rohitashya C (2007)
The Indian, civilization dimension showed cultural pluralism and syncretism that
encompasses racial diversity, linguistic heterogeneity. This is a fusion, and synthesis
in behavior patterns, customs, beliefs and rituals.
Though each group or community does not exist in a social vacuum it has an ethos of
its own and is distinct in identity. Singh K S (2002)
The material traits at the regional level show certain complementarities that are
marked by local differentiation. Usually a cluster of material traits in the region unites
different sections and communities. Bose N K (1961)
The unity of India is usually taken for granted; it is seldom examined critically. This
is due to unity that pervades the Indian society that is rather elusive and enigmatic
The development process must ensure people participation at the grass roots level by
taking cognizance of the perceptions and needs; this is closely linked to the culture.
The cultural policy needs to be embedded in cultural pluralism framework and
democratic decentralization. As a corollary of the above a policy that imposes unitary
solutions without taking into account of the regional variations and specificities will
be counter-productive. Thus, policy for development needs to be looking at the
culture-specific dimensions. Momin A R (1992) Kosambi (inae.org)
22
When working on a packaging design the basic criteria for packaging effectiveness
are universal for customers. Here people in different cultures tend to evaluate things
differently. The various foreign influences on Indian culture manifested itself in the
typical behavior and intellect of people in the vast geographical regions of India as
studied by (Subrata 2007)
When working on a packaging design the basic criteria for packaging effectiveness
are universal for customers. However within the market a brand’s packaging is judged
relative to its competitors. This is relevant to the context of the customer’s other
choices. Here people in different cultures tend to evaluate things differently. So, while
designing a package system the sensitivities of the different cultures need to be
analyzed. It is established that culture is a differentiating factor for the product
package design. Consumers differ in their decision making because of individual
values and perceptions. Studies in the Indian food industry show that gender and
frequency of visits impact the perceptions of the package.
The medical education system in India is one of the largest in the world with over 250
medical colleges controlled by the Medical Council of India (MCI). There is a
disproportionate growth that is based on the political strength of the states. The
growth is mainly in the Western and Southern region of India that is in and around the
metro cities of Mumbai and Chennai. The patients have also become demanding high
quality. In the healthcare sector high quality means innovative technology, effective
medication and higher staff to patient ratio. This shows that the patients are opting for
treatment in the metro cities that provide these services. In the understanding of the
patients perception of quality healthcare the general satisfaction in terms of doctor
interaction, and the accessibility and convenience of treatment were rated as very high.
Here the patient prefers the metro cities for their healthcare treatments.
23
Chapter – 2
LITERATURE REVIEW
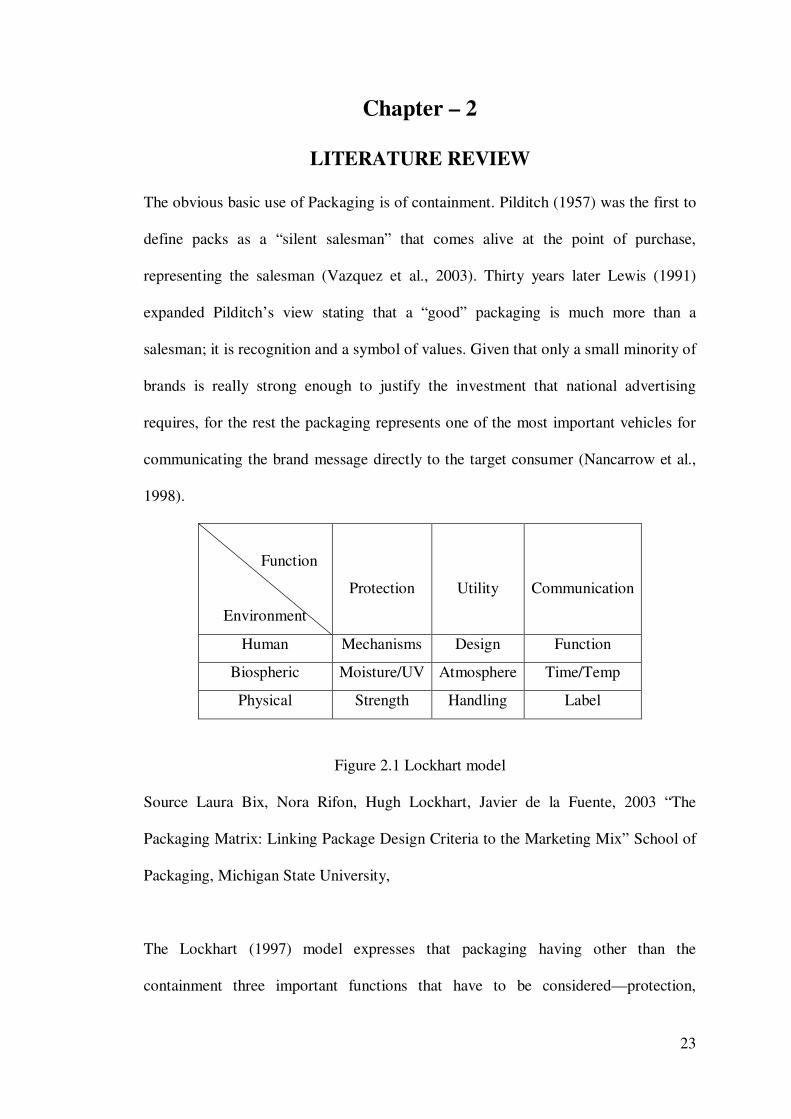
The obvious basic use of Packaging is of containment. Pilditch (1957) was the first to
define packs as a “silent salesman” that comes alive at the point of purchase,
representing the salesman (Vazquez et al., 2003). Thirty years later Lewis (1991)
expanded Pilditch’s view stating that a “good” packaging is much more than a
salesman; it is recognition and a symbol of values. Given that only a small minority of
brands is really strong enough to justify the investment that national advertising
requires, for the rest the packaging represents one of the most important vehicles for
communicating the brand message directly to the target consumer (Nancarrow et al.,
1998).
Function
Environment
Protection
Utility
Communication
Human Mechanisms Design Function
Biospheric Moisture/UV Atmosphere Time/Temp
Physical Strength Handling Label
Figure 2.1 Lockhart model
Source Laura Bix, Nora Rifon, Hugh Lockhart, Javier de la Fuente, 2003 “The
Packaging Matrix: Linking Package Design Criteria to the Marketing Mix” School of
Packaging, Michigan State University,
The Lockhart (1997) model expresses that packaging having other than the
containment three important functions that have to be considered—protection,
24
convenience and communication. These are related to the packaging environments
wherein the package has to perform its functions in namely - physical environment
ambient environment / biosphere and human environment.
The key driver to maximizing the intersection value of each packaging function and
packaging environment without diminishing the overall performance of the
pharmaceutical package is to look at the convenience or utility function in the human
environment. Here the key driver that maximizes this function has been identified as
‘technology innovation’.
‘Innovation’ is process that is iterative initiated by the market perceptions and/or the
service opportunity for an invention that is technology based which leads to the
commercial success in terms of development, production, and marketing of the
product.
This definition addresses two important points one the process comprises the
technological development combined with market introduction to end-users through
adoption and diffusion, and second the process is iterative in nature this implies
varying degrees of innovativeness and thus there are different types of innovations.
It was Abernathy and Clark’s (1985) who focused on competitive significance using
matrix categorization by mapping the technology competence against market
environments. They worked out four categories for innovations. These are ‘regular’,
‘niche creation’, ‘architectural’, and ‘revolutionary’.
Innovations using existing established technical and production competences that are
targeted to existing markets and customers are ‘regular’ and they often involve
incremental process improvements in the technology.
In ‘niche creations’ there is a need to support a new market position that requires a
refining, improving or changing a stable and well-specified existing technology.
25
These would be building on technical competence and improving product
applicability especially in emerging market segments. ‘Architectural innovations’
look at new market linkages with the creation of new industries or reformation of
existing ones using new technology and ‘Revolutionary innovations’ target existing
markets and customers using disruption of the technical and production competence.
Technological innovations have two directions where discontinuities may originate; a
marketing direction or a technological direction. Product innovation requires a new
marketplace to evolve, and/or new marketing strategies for the firm. Similarly,
product innovations may need a paradigm shift in the science or technology
embedded in a product, using new R&D resources, and/or new process in production
for a firm.
Naser Azad and Leila Hamdavipour (2012) studied the relationship between a good
packaging program and customer's confidence that results in purchasing of goods and
services by gathers customers' opinion among a sample of customers visiting a chain
store. They concluded that the package design, color, graphic, symbol, product
information, and technology are important factors influencing the customers decision
for buying a product.
2.1 Technologies relevant to pharmaceutical packaging
The technology is a key important driver for the pharmaceutical packaging.
Technology is a result of innovation. Innovations range from radical ones – ‘that
cause marketing and technological discontinuities on both a macro and micro level’ –
to incremental ones – that ‘occur only at a micro level and cause either a marketing or
technological discontinuity but not both’ (Garcia and Calantone, 2002). The more
radical an innovation, the higher the uncertainty and risk; at the extreme end it is
disruptive in nature. Radical innovation involves ‘the development or application of
26
significantly new technologies or ideas into markets that are often non-existent’
(McDermott, 1999). Packaging innovation according to Garcia et al (2002) results in
“discontinuity in marketing and/or technological factors” that may precipitate newer
designs. According to Rice et al. (1998) discontinuous innovations are ‘game
changers’ that has potential for a 5–10 times performance improvement compared to
existing products or is the basis for a 30–50% reduction in costs or has performance
features that are new to the world. The study done by Kesseler et al (1999) showed
that the model of innovation speed depends on the strategic orientation of the product
features that is the criteria and scope of the process involved in making the product.
This is coupled with the organization capabilities. It was found by Bierly &
Chakrabarti (1996) that in the pharmaceutical industry the technological cycle time
for the development was significantly faster for those firms that generated the
knowledge internally as there is greater sense of ownership of the process and
understanding including interpretation of the ideas. This is based on the level of
uncertainty or market circumstances. The innovative technology would therefore be
based on the contingency approach that is ranging from ‘radical’ that specifies clearly
the product features to ‘incremental’ that allows some vagueness. In addition to
product features and technology Cooper et al (1991) shows better quality benefits are
vital in customer satisfaction of technical services. This is an important evaluation
criterion while buying a product. Here Schmidt (1998) has shown that the new
processes helps in designing the package.
Not all new products are new. At one end are radical innovations that stem from
technological discontinuities offering new, unique, or superior solutions to the
customers needs and at the other end incremental improvements that include line
extensions, cost reductions, and “me-too” products that are not new to the market
27
Radical innovations are more likely to fail than incremental ones due to technical
reasons like product performance, quality and incorrect market positioning, lack of
product awareness, not delivering benefits that consumers appreciate and are willing
to pay for, however radical innovations may provide the opportunity to define the
technological or market standards that create barriers to entry, and provide above-
normal economic returns resulting in strategic implications.
Maria et al (2010) in their study of marketing, logistics and ethics in packaging
innovation in the retail grocery sector found that packaging is a strategic tool. They
took a holistic view by providing a conceptual instrument for the integration of the
multidimensional relationship between the three perspectives. Management of the
packaging innovation can be optimized according to (Deshpande (1991) and Narver et
al (2004) if the firm realizes its value added potential using a market oriented
approach as there is positive relationship between market orientation and business
performance. Pelham (2000) and Wilson (1996) found that market orientation was
significantly related to product quality that was significantly associated with growth
share and profitability especially for small organizations. They concluded that a high
level of market orientation can provide a strong source of competitive advantage.
Marketing orientation includes the concept of customer orientation and competitive
orientation according to Day (1990, 1994). This ability to create and maintain
relationships of the firms’ most valuable customers is the basis for a competitive
advantage. To keep this edge over competitors the firm needs to master the following
capabilities. First, a customer relationship orientation in the organizations values
mind-set and norms. Second, the organization must deepen its knowledge of their
customers throughout the organization. Third, the main processes need to be
28
internally integrated and externally aligned to the corresponding processes of their
customers.
In innovation adoption research, diffusion modelers (Gatignon and Robertson, 1985)
focused their investigations at the aggregate level, and produced models that are
capable of predicting sales of new products. This has been extended to include
marketing variables of advertising (Horsky and Simon, 1983; Kalish, 1985), and other
parameters such as competitive effects (Robertson and Gatignon, 1986) as these
competitive effects play an important role in the formulation and execution of
innovation strategies.
Lisa (2002) studies showed that the innovative technologies have helped in reducing
dispensing errors due to the wrong identification of the drugs at the point of care
where unit dose pack is used. This helps in reducing mistakes due to dosing however
due to manual repacking being done at the customers end (in the hospital or retail
pharmacy) most of the drug manufacturers are doing the packaging in house or third
party contracting. Berman (2004) noted that there are naming confusions that results
in errors arising from sound-alike or look-alike medication names. In the United
States medication name confusion are common and there is a need for innovative
technological systems and recommendations that help to reduce the occurrence of
such errors.
In India the study done by Srivastava et al (2010) studied 55 medical practitioners of
Government Medical College, Haldwani, Uttarakhand and 40 Pharmacist of Haldwani
town regarding the problems with reference drug label medico-legal aspects, missing
label, font sizes, translation in local languages. This study highlighted the problem
faced by the physician and pharmacist and there was a need for effective suggestion
for improvement which if implemented would reduce medication error that are an
29
important cause of excessive cost, patients morbidity, mortality and medico-legal and
unethical practices. There were several remedial measures suggested like bar coding
to help identify the drug. A laptop computer that is programmed to identify the bar
code can be used to announce the name of the drug and display the name on the
computer screen in large font size along with its color code (Alan Mary 2001).
Prefilled syringes and flag labeling can help to facilitate layout order in the syringes
and ampoules (Filik et al 2006). Minor alternations like water proof labels, embossing,
improvement in glue quality and increased font sizes so that the eye can visualize the
label details well thus decreasing the chances of medication error to a greater extent.
(Gabriele 2006, Wogalter et al 2003). Here it has been found that technology helps to
solve these issues Jean (2008).
It was noticed that there is inconvenience and longer time taken to punch out the
tablets as a result the strip packaging may reduce the tablets readily swallowed by
adults. Studies in U.K. and Hong Kong show that blister packs were associated with
lower number of tablets being ingested and also had large overdoses due to loose
preparations. It was noted in Australia when there was a change in packaging for
carbamazepine tablets from bottles to blister packs, there was a decrease in the
number of tablets ingested by patients thus reducing the number of tablets available in
individual preparations or prescriptions reduces the likelihood of severe poisonings.
In France, the content of the paracetamol pack has been legally limited to 8 g. This is
one reason why severe liver damage and deaths due to paracetamol poisonings are
less common in France compared to United Kingdom (UK) where such package is not
changed. In adults Dettol poisoning causes serious complications like pulmonary
aspiration if a large amount is ingested. This risk may be reduced by restricting the
bottle size and its opening Chan (2000).
30
Drug administration errors are especially common in infants even though the infant
population are exposed to drugs, there are not much data concerning
pharmacokinetics or the influence of pediatric diseases. Formulations are most often
suited for adults and rendering the dosage calculation of drug is complex for infants.
The common drug administration error in infants is dosage. The goal is to
aggressively achieve zero drug error rates, with systems that aim to eliminate human
error. In the case of the nuclear industry, telecommunications or air traffic control
services error reduction policies with zero error is not achieved by looking at the fault
in the individual, but by identifying system faults and in picking up faults before they
occur. These policies need to be adapted to medicine by using interventions
specifically by clear labeling, legible prescriptions, standard dosages and generally by
proper education programs and non punitive error reporting in order to reduce the
number of errors made especially in giving medication to infants
Anderson et al (1999). Children need safe use of medicines as they are more prone to
medication errors during each stage of the medicines management process especially
for the dose calculation errors. The main interventions were computerized physician
order entry (CPOE) that showed some degree of reduction in medication errors
however studies still showed a significant increase in mortality even after the
implementation of CPOE. Further research showed that unit dose dispensing systems
and educational management programs were shown to reduce medication errors in
children Conroy et al (2007).
Rose (2000) showed that more than half of all poison exposures happen in children
under the age of six, and in those cases more than 90% of those poison exposures
occur in a residence. This is mainly because young children cannot protect themselves
and the parents and child-care providers need to provide them a safe environment.
31
Programs and informational materials will assist the health care professionals in
providing effective programs.
Peterson et al (1999) studies on 209 pharmacists in Australia showed that majority
(84%) of the dispensing errors were due to high prescription volume, pharmacist
fatigue and overwork, interruptions during dispensation and similar or confusing
names. They identified that the most important factors that help reduce the risk of
dispensing errors were, having mechanisms for a proper dispensing procedure,
improving the packaging and labeling of the drug product, having distinct drug name
and updating the knowledge of drugs. Out of 20 variables considered by them, the
package/labeling was sixth most important variable with a median response of 72mm
on a 100mm visual analogue scale. They also noted that there was a statistically
significant correlation with the increased period of registration as a pharmacist and a
declining contribution to errors of packaging and labeling of products.
Lipowski et al (2002) studied how much time can be saved using unit-of-use
packaging in a community pharmacy and the number of errors that occur when unit-
of-use packaging is used compared to bulk packaging in dispensing prescriptions.
They studied a total of 100 typical prescription orders and found the time saved using
unit-of-use packaging as compared to count-and-pour dispensing was 46.5 minutes
per 100 prescriptions that represented an average time savings of more than 27
seconds per prescription. Also in the bulk package dispensing the pharmacists assisted
the medication for 26% of the prescriptions as compared to 4% when unit-of-use
packaging was used because while the technician dispensed prescriptions the
occupied pharmacist were verifying the prescription orders of the dispensed products.
In total four counting errors were noted when executing the bulk package trial and no
errors while using unit-of-use packaging. Thus unit-of-use packaging reduces the time
32
needed for dispensing and increases the efficiency of the pharmacists' dispensing
activities. Unit-of-use packaging also reduced the number of counting errors. Lisa
(2002)
Haynes et al (2001) (2002) studied interventions to assist patients' adherence to the
prescribed medications. They researched the bibliographies for records from 1967
through August 2001 and found that (19 of 39 studies) forty-nine percent of the
interventions tested were statistically significant with the increases in medication
adherence. Adherence is defined as the extent of a patient's behavior (to attend
clinics, take medication or modify their habits) coinciding with medical or health
advice. Compliance and concordance are synonyms for adherence. Many different
interventions, used alone and in combination, were tested like more instructions for
the patients (oral and written material); increased communication (automated
telephone, computer-assisted patient monitoring; family intervention); ways to
increase the convenience (provision at the worksite, simplified dosing); reminders
(tailoring to the daily habits; special pill packaging reminders; units of medication
that dispense dose and medication charts; appointments and reminders and refills for
prescription); and rewards for both improved adherence (e.g., partial payment for
blood pressure monitoring equipment).
Avid Holdings plc, 100% owned subsidiary Pill protect Trade Mark (TM), offers
pharmaceutical companies with packaging solutions for blister package drugs
containing aspirin, paracetamol and elemental iron. Each product is given an F= rating,
that records the number of units accessed by children during testing. The lower F=
rating shows higher the level resistance. In the US an equivalent of F=8 rating is the
minimum requirement for BS 8404 compliance. Pill protect(TM) made the special
child resistant senior friendly packaging solutions for blister packs with a successful
33
trial of an F=1 product that is a highly resistant blister packaged drug to children that
is senior-friendly. Stephen (2008) 3 Point (2006)
With respect to PVC as pharmaceutical packaging material Van Dooren (1991)
studies showed that the metabolic effects of the monomer of PVC, vinyl chloride and
of the commonly used plasticizer diethyl-hexyl-phthalate did not scientifically justify
for a total or partial ban as they were cheap, versatile, high-performing plastic
material for medical and pharmaceutical applications.
Kippen et al (2005) survey using convenience sample of 55 self-selecting participants
from five community-based groups containing a cross-section of people aged 60 years
and older reported that the participants had a sense of their life being controlled by
when and how they needed to use medication. They experienced impacts on their
lifestyle and struggled in dealing with sometimes debilitating side-effects. Their
routine activities like ease of mobility and travel had become challenging to their
autonomy and independence. The study showed that packaging was reported to be
often not ‘user friendly’ and prescribing usually was done in a way that could create
waste and confusion. There is a need on embarking on medication regimens that can
significantly impact their lifestyle and proper packaging could remove the barriers
thus creating a positive experience of ageing through exacerbating loss of control in
life situations.
A significant cost contributor to the medical care was due to inadequate medication
compliance in every therapeutic area. There is no assurance that patients will take
their prescribed medications however the severe consequence. Of special concern are
elderly patients because of their related problems like cognitive skills and memory,
deficits in physical dexterity, and the number of medications prescribed. Healthcare
providers prescribe a simple dosage regimen to overcome compliance problems in the
34
elderly for all medications to be taken, for example 1 or 2 doses daily. This helps the
patient by selecting cues that helps or assists them in remembering to take prescribed
doses (like time of day, meal-time, or some other daily ritual), or by providing devices
that simplifies remembering the doses like medication boxes, and thereby regularly
monitor compliance. There are available a variety of compliance aids that help
patients to organize their medications like plastic boxes or alarms that aid to
remember dose times. The pharmaceutical packaged in standard pharmacy bottles will
be identified by special labels, or dosage charts are provided to check the daily
schedule. Widely used in hospitals are single-unit doses, that may be cumbersome for
elderly patients having difficulty in opening the foil-backed wrappers. Medication
boxes having compartments that are filled by the patient, family member or a home
healthcare provider on a weekly basis are useful organizers that help to simplify the
patient's self-administration responsibilities. A feedback like microelectronic devices
shows patients whether they have taken the scheduled doses. Some systems are so
designed that notifies the patients within a day if their scheduled doses were omitted.
Cramer (1998) The studies done by Eisen et al (1998) to determine the relationship
between patient medication compliance and the prescribed daily dose frequency
looked at the medication compliance of 105 patients using antihypertensive
medications. The data analysis from special pill containers that records electronically
the date and time of medication removal showed that inaccurate compliance using the
simple pill count method can be thereby avoided. Defining compliance as the percent
of days where the prescribed number of doses was removed. Their study found that
compliance improved to 83.6% on a once-daily regimen from 59.0% on a three-time
daily regimen. This showed that compliance improves dramatically as the frequency
of the prescribed dose decreases. The most important action for the health care
35
providers is to improve compliance by selecting medications where the lowest daily
prescribed dose frequency is possible. Leenen et al (1997) evaluated compliance
patterns for once versus twice daily administration of antihypertensive therapy. They
conducted a parallel group randomized design study on the primary care practices
across Canada among patients with mild essential hypertension of either sex (40%
women), with average age of 55 years. 198 patients were randomized to active
treatment. After a four-week placebo period, patients were randomized to amlodipine
5 mg once-a-day or diltiazem slow release (SR) 90 mg twice daily. Doses were
increased to 10 mg and 180 mg. During the 20 weeks of active treatment, the
compliance as assessed by pill counts and medication event monitoring system
(MEMS) that assesses the percentage of prescribed doses taken, the correct doses
taken on time showed a high degree of compliance, for the two treatments. The
hypertensive patients in primary care showed a high degree of overall compliance
with once or twice daily pill-taking, whereas patterns of pill-taking are more erratic
with twice versus once daily medication, particularly in men. The results within the
constraints of a clinical trial, suggested that the negative consequences of partial
compliance for blood pressure control are offset by choosing duration of action of
proper dosing intervals.
Compliance will depend on the health condition and trust between the patient and the
health care provider. Heur et al (1999) found that on an average practitioner spend
less than 60 seconds per prescription in conveying compliance related information to
their patients. They noted that consultations usually end with a prescription and most
of the patients are left alone with their questions and their concerns regarding therapy,
benefits and risks of the medication or the interaction with other drugs and side effects.
36
There are a number of core tasks that are critical or the safe use of pharmaceutical
packaging. The goal is to assess how the customer finds the information that they
need and how they then interpret this information. Packaging is a way to convey
information. Packaging design is such a huge business that if anyone Goggles
“Packaging Design” there are 61 Million hits in three fourth of a second. Arnet (1999)
studies showed that the tools that help compliance are Optical (69%), Ritual (26%)
and control by a third person (6%). It was noted that noncompliance extends the
illness resulting in unnecessary suffering and costs in billion. Improving the
packaging is a fast and easy way to improve patient compliance. World Health
Organization (WHO) 1999 report on infectious diseases showed that user friendly
packaging of drugs is a low cost way of improving compliance for the anti malarial
drug therapy.
Arne et al (2007) study examined patients' acceptance and attitudes towards a new
tablet reminder and protective device. The internet survey study was designed with an
animated presentation of a tablet reminder device and a questionnaire. There were 403
respondents. 87 per cent of the respondents found the tablet card protection was
excellent or acceptable. The majority of respondents reported a high acceptance of the
device functions, irrespective of their demographic and socio-economic background
in terms of its usefulness and design. The concept of the device was found less
appropriate for patients older than 60 years and receiving more than six different
medications. Patients’ acceptance of medical devices is crucial in everyday life.
Hence, an attractive medical devices design for pharmaceuticals and an easy to
understand usage functionality are crucial for such new medical devices.
Jurgen (2007) provided an overview of the current requirements for pharmaceutical
packaging and highlighted the challenges faced by the pharmaceutical industry and
37
packaging manufacturers. The pharmaceutical packaging in Germany has
implemented Braille in pharmaceutical packaging. This shows how packing
manufacturers responded to changes in the legal environment. In response to
increasing competitive pressure the significance of packaging as an important sales
instrument has been discovered by the pharmaceutical industry. Apart from technical
challenges the packaging design expectations are also increasing. Jurgen has shown
the possibilities whereby the plain factual pharmaceutical packaging lives up to the
modern sales and marketing guidelines mainly due to appropriate finishing
technologies.
The NPC (National Product Catalogue) has uniquely identified healthcare products,
including medicines and medical devices and equipment, and the important supply
chain and clinical information about those products such as the product component
and pack sizes. This reduces the chance of introducing erroneous data into
procurement transactions and the resulting errors and costs. This is very important in
the healthcare supply chain where getting the right products at the right place and time
is very critical in ensuring quality patient treatment.
The GTSH (Global Traceability Standard for Healthcare) provides a foundational
framework that describes the traceability process and the minimum requirements for
all stakeholders. This enables maximum interoperability between traceability systems
across the supply chain and across borders. Security, efficiency and traceability in the
healthcare are important government regulations and for the concern of the industries
around the world. The key issues are product recalls, counterfeiting, medication errors,
adverse event reporting, and efficient logistics management. John (2008)
Pfizer’s research, conducted by independent agency StollzNow, confirms that over
half the Australian population (53%) takes prescription medicine on a long term basis
38
Almost 38% all at some stage, choose not to have their prescription filled at often for
a variety of reasons. [9] The common factors are cost of medicine (24%), while 37%
waited to see if their health would improve. When they do have a prescription filled,
only 55% “always” finish the course of medicine. There is a range of reasons for this.
The majority (57%) said that they simply “got better”, while 32% “forgot” to take
their prescribed medicine reasons for non-compliance. Non-compliance can’t be
explained by a single factor like the type or severity of disease. Nor is it linked to age,
socio-economic factors, sex or personality traits. Studies showed that a wide range of
factors contribute to non-compliance of the prescribed medicines. Physical constraints
like memory or dexterity has a profound impact among the elderly. Environmental
constraints like difficulties in paying for the cost of prescribed medicines, the time
taken to visit a doctor, can also influence the ability to follow a prescription (Rob
Horne 2005). According to the World Health Organization (WHO) there are around
55% of patients suffering chronic conditions who comply with the requirements of
their long term therapy. In the less developed countries the rates of compliance are
much lower. In the developed countries like Australia, the poor levels of patient
compliance don’t just affect personal health; they also reduce the overall effectiveness
of the health systems. However the issue of non-compliance can be a more dire issue
in developing countries. According to WHO, “when taken together with the lack of
appropriate diagnosis, the poor access to health care, and the limited access to
medicines, such poor adherence is threatening to render futile any effort to tackle the
chronic conditions, like diabetes, depression and (Human Immunodeficiency Virus)
HIV/AIDS (Acquired Immune Deficiency Syndrome)”. (WHO 2003) Non-
compliance with prescription medicines would also be due to Aluminum foils (Al
foil) unintentional reasons. For example physical and cognitive factors can impact the
39
likelihood that a patient will gain maximum benefit from their medicine. The effect is
further compounded where a person uses multiple medicines or doctors The Home
Medicines Review (HMR) have several methods that can help patients better manage
their medicines. There are several technologies that help boost the profitability of the
product according to Allan (2002).
In the food industry major brands are the targets of blackmailers greatly damaging the
brand name. Therefore the focus within packaging development is on tamper-evident
packaging using either integrated solutions or additional applications like the use of
labels. Analyzing these incidents throughout the world helps to understand the process
in detail. There are two major issues one is the prevention of tampering; and the other
is the capability of finding on the shelf already tampered products by integrated
identification Jansen et al (1999) shows that technology has also being used for
preventing such tampering. Carus et al (2006) found that large sections of the
population encounter difficulty in opening consumer packaging of many kinds. The
screw-caps particularly can cause problems for several people with a variety of
impairments. They described the development and testing of a novel multi-axial force
torque transducer that was designed for studying the loading conditions when tamper-
evident bottle closures are opened manually. This type of transducer that comprises
seven beams is sensitive to direct forces and torques in each of three axes that has
been designed to fit inside a typical 500ml plastic soft bottle. Test data from two user
groups, elderly and young clearly shows that they exhibit significantly different
torque and force profiles when opening the bottles. This will be a valuable tool in
future studies of opening strategies in packaging. The use of (OTC) over-the-counter
medications is increasing yearly among customers for the symptomatic relief of
ailments. Customers have difficulties in reading and understanding or comprehending
40
the information’s given on the OTC medication packages. A standardized format was
necessary to display information on the OTC medication packages; hence on 11
March 1999 FDA announced guidelines for Over-the-counter Human Drugs:
Labeling Requirements. Sujit et al (2003) evaluated the marketed OTC medication
packages to determine the adoption of the FDA guidelines by manufacturers.
Packages of 104 OTC medication products of three different categories, viz. cough
and cold remedies, pain relievers, and stomach remedies, were evaluated in terms of
general information, written information and product claims. They used the
Compugraphic point system scale to measure the font size of the written information.
Additionally the variables recommended by the FDA, like bullets, paragraphs and
hyphenations, were also evaluated. The coded database was analyzed using the SAS
8.2. The study found only some manufacturers adopted the FDA guidelines however
adhering to the guidelines; early implementation would benefit the consumers.
In health care the potential for improving safety by better process surveillance and
reducing human error, together with more efficient treatment processes, has led to a
number of trials of Radio Frequency Identification (RFID) applications. Despite RFID
technology deployment is a recognized potential for patient safety improvement it
was mainly limited to generic supply chain applications. Only recently has it become
significant in specialized health care applications. This is because of a number of
factors including: capital costs for base infrastructure requirements, technical
difficulties especially in hospital environments that includes unrealistic expectations
of the technology. It was a difficult business justification, because of an uncertain
(ROI) return on investment. In order that RFID has cost-effective benefits and
enhance the existing barcode identification there is need for significant technical
infrastructure development within the hospital environment, that encompasses both
41
the appropriate hardware (reader, computer) and the application software enabling the
use of this technology. There are possible gains in patient safety, transparency, and
productivity that justify the development efforts in RFID. Vox Sanguinius (2010)
(David 2008) in the study on modern labeling challenges looked at the global and
local issues for integrated identification and tracking solutions in the pharmaceutical
sector. The label is number one on the FDA recall list as it is one of the most critical
elements of any product. It educates the user on how, where and when to use (or not
use) the product. It displays and achieves compliance to local governance. It reassures
a genuine product, tracking the same from warehouse to the consumer and promoting
the brand, values and mission of the company. Increasingly complex legislative
frameworks demand increased focus on anti-counterfeiting and patient safety.
Technology is helping many global organizations to meet these challenges securely,
collaboratively and efficiently by ensuring that label designs are right first time every
time. David has suggested how the various technologies simplify this, for example the
version information is maintained and cannot be changed with proper audit logs and
use of standard phrases. The suggestion that the records at all stages of the approval
process removes the requirement for specific application training just to approve a
design. This means the (Manufacturing Resource Planning) MRP/ERP (Enterprise
Resource Planning) data to be used at the production time seamlessly.
In the fight against counterfeiting there is a need for an efficient system that is easy to
use and makes the product impossible to copy. Sebastien (2008) had suggested the use
of standard printing technologies, EDI (Electronic data interchange) and HTTPS
(Secured hypertext transfer protocol). This uses a unique identity number for each
product that is based on its own algorithm. This system would return the type of
product that corresponds to each identity code (prescription drug, OTC or
42
supplement) so that the users can more accurately check what he purchased. The
system will check that the product is effectively to be sold in that country/area and
will return the name of the manufacturer. A green light indication means everything is
OK and a red light if there is a problem. This needs the access to the internet which is
now available even in emerging countries like Africa, India, China, East Europe,
Latin America etc. This can be implemented using the international organizations like
World Trade Organization (WTO), WHO, United Nations (UN), European
Commission (EC) etc.
Michael (2008) studied the use of highly secured unique coding solutions with the
technology pyramid multilevel approach for all pharmaceutical packaging materials
and formats – primary and secondary to add a ‘secure fingerprint’ to every single
product, thus allowing the manufacturer/customer to verify individual products are
genuine and how they got to where they are.
Roland (2008) used digital imaging solutions for brand protection and document
security. The genuine pharmaceutical products were distinguished from counterfeits
on a worldwide basis using Cryptographic basis where regular visible is used for
covert marking. More than one billion pharmaceutical and consumer goods were
protected worldwide. The covert solutions need to be seamlessly integrated into the
production workflow. This is very important as there was a 1000% increase of
counterfeit seizures in Europe during 1984-2004 and more than 50% of medicines
purchased via the net were fakes during the same period.
Stephen (2008) studied the packaging for the future that uses nanotechnology that
would have bright colors, better barrier properties, and stronger lighter materials.
Products that flash messages to you, that talk to your phone and products with
artificial intelligence.
43
2.2 Form and color relevant to pharmaceutical packaging
The aspect of the form of the pharmaceutical package in particular the shape, colors
and pictures has an impact on the pharmaceutical consumer beliefs of the product
characteristics. Bone et al (2001) studied the aspect of colors and pictures to
determine the impact on consumer beliefs regarding the important color
characteristics. Their study revealed that when very concrete verbal information is
used there is a long term significant effect on the product belief and purchase
intentions. Roullel, B et al (2005) examined 150 European patients judgment about
the drugs perceived quality based on the prescription drug packaging bearing a
specific color. The impact of packaging color on consumers’ expectancy toward the
drug indicated that packaging color does have an effect on some expectancy items
related to the strength, safety measures and price of the drug in the European context.
The effects of hues were significant on three expectancies that are ‘medicine power’,
‘required caution’ and ‘drug dearness’. Red, brown and grey packages are perceived
as designed for serious illnesses compared to yellow or green packaging. Brown,
orange and red required some precaution of use compared to blue, green and yellow.
Red and brown packages were perceived as more costly than yellow or orange boxes.
The package brightness was also having significant effects for various expectancies.
Their study showed that dark hued packages (red, brown and blue conditions) are
considered as acting more rapidly, more expensive, more curative and more
susceptible of side effects than the light hued conditions (green, yellow, grey and
orange conditions). There was an impact of color screen brightness (metric values) on
the drug expectancies. Red and brown packages entailed greater potency scores
compared to yellow and green hues. There was a significant relationship between the
brightness and perceived drug potency using linear regression. They could not find
44
any significance for the package color to the therapeutic class of treatments; however
there were some trends of associations like reddish hues (red and brown) were
associated with heart condition drugs, while yellow was related to skin medicines.
Here the ICOMED index (for Index of Confidence toward Medicines) is used; this is
composed of two sub-scales: the first one is the individual’s defiance (distrust) level
towards prescription drugs and the second measures the individual’s reliance (trust)
level towards prescription drugs. Their study also noted a gender effect where the
women appear to distrust medicines more than men do. The men had preferred
package of orange (warm) capsules whereas women preferred blue (cool) ones. These
were significant differences in ICOMED scale with the female participants scoring
higher on the defiance scale than their male counterparts did.
Underwood Robert L et al (2001) provided a theoretical framework to understanding
the communicative effects of product imagery on brand attention, specifically, the
attention it has on the customer by incorporating a picture or illustration of the
product on the packaging of the product. Virtual reality simulations (empirical results)
show that package pictures increases the shoppers’ attention to the brand. This effect
occurs only for low familiarity brands (private-label brands) within product categories
that have a relatively high level of experiential benefits.
Heiskanen et al (1995) provided the conceptual framework on the condition for
sustainable consumption. Products usually represent far greater resources that have a
much higher inherent value than the packaging used to protect them. Kooijman (1994)
The product losses due to underperforming packaging causes greater adverse effects
on the environment than the gains due to excessive packaging reduction as seen in the
food industry. In the developing countries the average losses in the supply chain could
be reduced by the use of improved packaging from 40% to 2.5% as seen in the
45
European market. The energy consumption associated with the food losses could be
reduced by more than 50% while also increasing the food availability. G.A. Keoleian
et al (2004) S. Busser et al (2008). This can be applied for the pharmaceutical product
that is more expensive compared to the food products.
There are three components for an ad’s color which are ‘hue’ classified as orange, red,
yellow, green, and blue, ‘saturation’ that is the purity of a color, the degree of
freedom, from its mixture with white and ‘lightness’ that is a relative degree of an
object related to light. It was found that these three color components have an effect
on the ads mood of seeing. Lichtle (2007)
Bottomley, P. A (2006) explored the role color plays in building the brand meaning.
Without prior conditioning, we demonstrate how an appropriately chosen color for a
brand name (logo) can bring inherent and immediate value to a brand. Experiment
showed the ability of color to enhance a brand's desired image classified as both
functional and sensory-social as seen by the effect of red and blue on brands of
products. When people know how brands attempt to position themselves, people
consider colors congruent with those positions to be more appropriate.
The value consumers perceive from buying and using a product differs across cultures.
The consumer perceptions of product value are determined by intrinsic dispositions
internalized cultural values and norms, and external contextual factors. This resulted
in an integrative model by Overby, J et al (2006)
Aslam, M. (2006) study found that colors have powerful effects inducing reactions
based on both instincts and associations. Colors can alter the meanings of the product
or situations with which they are associated and color preferences can predict the
consumers' behavior. A marketer needs to adopt a pan-cultural or a culture-specific
approach while using color in marketing as the study reviewed the psychological and
46
socio-cultural associations and meanings of colors in a cross-cultural marketing
perspective and outlined their role as a marketing cue. The cultural values and desired
customer relationship levels influences the choice of color in corporate and marketing
communications, a cross-cultural perspective of color research is imperative for
developing global marketing strategies.
Madden et al (2000) noted that color is an integral part of the product, packaging
logos that can be used as an effective method to create and sustain the corporate and
brand image in the customers’ minds. Their study in eight countries showed cross
cultural patterns of similarities and dissimilarities in color preferences and
associations with color. Companies are continually looking for enhancing the brand
image developing the marketing programs that clearly position the brand in the
customers’ mind. Their study found that red was associated with active, exciting,
ferocious, hot, vibrant and violent feeling. Blue, green and white were associated with
calming, cold, general, passive, peaceful and still feeling. It was found that value
change in the package is needed as the color component of the pack affects the
individuals’ emotions.
Pires Gon¸calves, Ricardo (2008) study noted that consumers rely on signals that are
extrinsic and intrinsic attributes, to solve their information problem regarding product
quality. The study evaluated how consumers assess quality perception in terms of
specific product characteristics like colors and shapes in product labels. In particular
colors and shapes combinations that are consistent would be expected to enhance
consumers´ product quality perception, while other combinations that are inconsistent
will decrease it.
Schmitt et al (1994) study looked at one of the key challenges facing managers today
that is building an attractive identity for their company and products in the fast-
47
growing markets of the Asia-Pacific region. This region has several ideographic
language systems, a large number of homonyms and sound associations, as well as
varying cultural characteristics, such as supernatural beliefs, aesthetics and color
symbolism, the importance of social relations. This is related on the basis of consumer
perceptions. Marketing practitioners know that a products package color may play an
important role in a consumers purchase decision. Grossman, R. P (1999) applied an
associative learning framework to the color literature to help understand consumer
color choices. This classical conditioning will be used to make suggestions to
practitioners who wish to create or change color associations for their products.
Studies done by Vernon et al (2003) showed that color helps the patients’ memory on
the performance. They had examined the effects of color transformation between test
and study (from black and white to color or from incorrectly colored to correctly
colored) on implicit and explicit measures of memory for diagnostically colored
natural objects (like yellow banana). For deciding whether an object is correctly
colored there were shorter response times to correctly colored-objects than to black-
and-white and incorrectly colored-objects. Color transformation did not influence
priming of picture naming.
Pharmaceutical markets are expanding mainly due to aging population, higher
development costs and direct-to-consumer advertising. This entails more demands
from consumers (patients or trade) and prescriptions from physicians. Pharmaceutical
packaging as a visual communication tool promises to be of utmost importance,
because of safety standards upgrading, expansion of OTC drugs, growing demand for
blister packaging, and developing television advertising.
A medication's perceptual properties are important and have specific meanings for
patients or clients. This may support or detract from compliance and can be used to
48
address the problem of patient/client noncompliance of prescribed medication
regimen. The cognitive dissonance study suggests a correct understanding of the
aspects of noncompliance because medicinal preparations have stimuli that are not
necessarily neutral. With proper efforts, it may be possible to enhance compliance
through perceptual engineering. As noted the researchers have found that size, form,
and color of medication affect compliance. Capsules are viewed as significantly
stronger than pills. Larger preparations are equated with greater strength. Capsule or
pill colors can elicit expectations of medication action. Green is associated with
tranquilizing effects, and yellow is associated with energizing effects. Buckalew et al
(1986). A patient may decide to discontinue or alter medication use because the pill or
capsule simply looks like it will have an effect that the patient does not want to
experience. Some elderly patients with vision or cognitive deficits may be confused
by similarly shaped and colored medications. The nature of the dosage form, such as
the size of the pill or a liquid preparation, can negatively affect compliance if it is
inconvenient to take or unpalatable. Richard P Kusserow (1990)
Thorens et al (2008) investigated ethno culturally determined expectations, beliefs,
and attitudes toward medication among a sample of 100 adult patients hospitalized in
Geneva, Switzerland. They found that the patients' expectations about their treatment
are influenced by pill size, shape, and color, among other factors. The study by
Buckalew et al (1982) showed strong perception capsules to tablets, larger capsules to
smaller ones, and some capsule colors enhanced the expectations about drug action.
There were inter-ethnic variations like Caucasians expected black capsules to be
stimulant, while African-Americans expected them to be sedative.
Eventually, the culture influences compliance and expectations about treatment and
with services Bhugra (2006). A majority of patients rated that taste was most often
49
rated as important, followed by tablet size, shape, color, and package design. The
study confirmed importance patients give for external characteristics of drugs, like
taste and tablet size, and their preference for oral administration. There were few
intercultural differences noticed in this respect.
For food products, it was noted that the attention drawing ability of a package has
been found to heighten the probability of purchase. It’s emphasized that the visual
effect of a product package is relative to a background comprised of competitor
alternatives. (Garber, 1995; Garber et al 2000) It was also seen that people attend to
stimuli that contrast with their background and that is novel, unusual or unexpected
(Engel et al 1995). While using verbal product descriptions, Meyers-Levy and Tybout
(1989) found that products that differ slightly from the prototype are evaluated more
positively than products that are either typical or very atypical. Schoormans and
Robben (1997) confirmed this is also the same for package appearances; a slightly
atypical appearance would catch the attention of consumers, while remaining
acceptable to them. So in general, an appearance that differs slightly from the
prototype will be preferred. In some cases, however, strong differentiation from or
strong similarity to the prototype or another product alternative will be a beneficial
strategy. Furthermore Schmitt and Simonson, (1997) noted that the product or
package appearance can reinforce the image of a brand, as the identity of a brand is
visually expressed in the appearance of products. Consumers couple the meaning of
the brand to elements of the physical appearance of products. This way, a brand image
may transfer to different kinds of products therefore many companies strategically
make consistent use of certain design elements, like a color combination, or a
distinctive form element or style. Creusen et al (2005)
50
The package conveys information to the consumer. Ideally is to supplement detailed
relevant information on the outside of packages and on inserts inside the packages.
Inserts are cost-effective and are regularly used by manufacturers to provide a greater
variety of messages and more practical information. The provision of clear,
understandable information in visual or message form printed on packaging is a
fundamental concept of public health education. Gardner, B.B (1981) notes that every
package that we see on the shelves of the supermarket, drug store, or any retail outlet
is a visual communication, a complex set of symbols that has an impact on the
customer. The purpose of this communication is to make the potential customer desire
the product in order to deliberately to win customers. Schmitt, Bernd H (1997)
The package is the visual identity of the brand. It represents the product at the point of
sale; the representation must be motivating to be effective. The package is the visual
brand image and silent salesman. Here lines (words) are not as effective as forms and
images. Forms and images are shown to have much greater motivating power than
words. It is in the psychological realm where color plays an important role. Color, like
imagery, thus is a vital factor in package design. First, the package must attract
attention. Then there must be a favorable psychological effect with favorable
associations that are transferred to the product it contains. Consumer attitude tests
have shown that effective use of color will heighten the appeal and effectiveness of
packaging. Lynn (1981)
A study on wine consumers showed that they rely mainly on the label on the bottle to
infer the quality of its content. This study from Spain shows that there are strong
preferences for selected color-shape combinations in the label design. Consumers are
well known to rely on the layout, imagery and color used in labels to infer the wine
quality and brand personality Verdu Jover et al., (2004). Colors have meaning as they
51
are a fundamental tool in corporate/marketing strategies and communications. These are
often used for the purpose of product and brand differentiation (Schmitt and Pan,
1994) on the basis of consumer perceptions (Grossman and Wisenblit, 1999). Color is
a very important characteristic for consumers that relates to marketing. Consumers
use color as a variable that is a basis for consumer buying decisions, therefore
marketers need to be aware of the color perceptions of the markets. Understanding
colors and their impact on purchase decisions, marketers can create a metric that
allows them to create new “color associations” between their product offerings. It has
been found that there are differences in color perception among people of varied
geographical areas. Thus the meaning of color, saturation levels and even the
associations and preferences for products of differing colors. The variations in
brightness and saturation levels play an important role in the perception of color and
the corresponding behavioral changes within consumers (Crozier 1996). Marketers
realized that demographic differences can (and probably will) effect the perception of
color (Gorn et al 2004) in their research on the web environment found a link of color
(hue, value and chroma) to the feeling of relaxation that influenced overall evaluation.
Extrinsic packaging attributes provide consumers with a social and aesthetic utility
strongly influencing expectations of sensory perception Gianluca et al, (2006). The
color of the packaging is the least expensive way of changing a product (Parmar, 2004).
The implication of the empirical findings reported is that the “resilient” color-shape
combinations should be used decisively in label design. In depth focus groups
consumers studies revealed that they consider packaging design features when making
purchase decisions Rocchi et al (2005). Surprisingly, color alone did not elicit as strong
preferences as selected shapes did, at least when they are assessed irrespective of the
shape that dominates the label composition. Other compositions, on the other hand, are
52
very resilient for the wine labels, especially those that contain color hues, such as brown,
yellow, black and green, in labels that feature rectangular and hexagonal patterns.
Silayoi and Speece (2004) divide packages into two components visual and
informational. The visual components of packaging are different graphical elements
of the package the size and shape of the package. The graphical elements are layout,
color combinations, typography, and product illustrations. They also contribute to
creating an image for the product or brand. The informational elements include the
displayed products information along with the package’s technology image. Silayoi &
Speece (2007) used a rating based conjoint study for packaged ready-to-eat products
in Thailand and found a strong overall importance of packaging shape, packaging
color and packaging graphics that focused either on visual aesthetics or verbal product
information on the label.
Ampuero and Vila (2006) argued that some general meanings of graphical elements,
like color, exist. Their study found that the packaging in cold and dark colors were
usually associated with high prices and refined aesthetics. In contrast, accessible
products that are directed to price sensitive consumers required light, mainly white,
packaging and safe and guaranteed products were associated with red packaging
Khouw (2006) showed that blue colour hues are cool that is seen as calming and
relaxing whereas red colour hues are warm that is seen as exciting and stimulating.
Contemplating the findings from a design viewpoint it is clear that each colour hue
has its own characteristics. They studied the factors for the interior design of clothing
stores retail spaces that targets to attract specific genders. The research found the
relationship in the interior retail environment between gender and the meaning of
colour. Parallel inter disciplinary studies examined several aspects of human
psychology, culture, and physiology that provided a complete understanding of
53
gender colour their responses to relationships of colour and the meaning of colour.
This study was based on Guilford (1934) early investigations on the colour harmony
combinations that found that a person sees a close relation to the balance in colours or
the opposite. Some evidence was found that more pleasing results were obtained
either due to differences in hue (very large or very small) instead of medium
differences. This tendency was more frequent in women than men.
Colour studies done by Eysenck (1941) noted the relationship between gender and
colour. The study found only one gender difference where women preferred yellow to
orange and men preferred orange to yellow. This was reinforced by Birren (1952)
who also found that men preferred orange to yellow; whereas orange was positioned
by women at the end of the list. Guilford and Smith (1959) study found that there was
general tolerance by men towards achromatic colours than women. Thus, it was
proposed that women might be more colour-conscious and their colour tastes were
more flexible and diverse. McInnis and Shearer (1964) found that men favoured blue
green and the preference of the women were the tints more than the shades. They also
found cool colours were preferred by 76% of women and 56% of men, and almost
equally the women 45% and men 51% chose the bright colours.
Greene (1995) studied the colour identification of 21 colour chips by college students.
The results showed that more elaborate colours were significantly recognized by
women than did the men. The findings indicated that the different gender responses in
colour identification are due to socialization differences of women and men. Men and
women were significantly different. The cultural context of the study must be noted
because traditionally the women from Nepal wear more colourful clothing than their
men.
54
(Singh, 2006) studied cultural color conditioning and found that it plays a significant role
in shaping responses to the color stimuli. Different cultures vary in their individual
response based on the use of color stimuli. As an example the Ndembo of Zambia doesn’t
recognize orange as a responsive or favorable color, whereas the Hindus consider it
sacred. The traditional and religious symbols play an important role in culturally-
conditioned color preference as noted by (Fehrman & Fehrman, 2004). Early Asian
movements like Hinduism, Buddhism, and Confucianism promoted yellow and orange
whereas Muslims and Celts shared green as their sacred color. Christianity while not
embracing any color as sacred however has strong salvation-related meanings to red,
white, and black. There are other color associations, like white for weddings, red ink for
marking mistakes, and figures of speech like green with envy. Color should function as an
important basic tool. Good design incorporates subtle colors in all the shades, tints, hues,
and chromas Designers therefore would use color to relate with their audiences, rather
than just as a tool for psychological manipulation. Color may shout, but it must also
converses to its viewers in witty and intelligent ways. In the competitive field of
packaging color dialogues are matchless especially for advertising, and branding. An
important decision in any area of design is choosing colors. Selecting a color will appear
for years to come and has far reaching consequences that may either bolster or damage
sales in the future (Lambert, 2004). Such a choice must be formulated carefully based
on the understanding of current and future color trends.
Packaging plays two vital roles. The first is to catch the customer’s eye as he
scans supermarket shelves. According to Eiseman (2006, as cited in Alva, 2006), “a
product unseen is unsold”. Packaging second function is to communicate wordlessly
about the product and establish its placement among competitors, a role known as
positioning (Nelson, 1994). Both of these roles are dependent on color choice, which
55
can dramatically improve or decrease the product’s sales if its eye-catching qualities
or positioning is substandard.
Nelson (1994) listed color as packaging design’s “single most important factor”.
When consumers scan store shelves, their eyes pass over each product in three-
hundredths of a second Fehrman & Fehrman, (2004). Furthermore, they scan store
aisles for colors, not for design or text. 62-90% of a customer’s assessment of a
product comes from the colors alone Singh, (2006). Sturgess (2008) wrote, “Color
sets the tone before you can even begin to load the mental software required to read a
product’s label”.
Packaging color destines the product. According to Davis Masten, Principle at
Cheskin Research (1998), “Even a slight shift in the tint or saturation of a particular
color can impact a product’s sales and success”. In packaging, some colors or color
combinations usually carry different connotations than they would have in other
contexts. On a package, white is far from passive for example on soft drink cans,
white implies that the drink is low in calories Nelson, (1994). Bright letters on the
background of white conveys the impression of strength and purity for example the
weight loss drug Alli utilizes a white background across which it splashes red, yellow,
blue, and green letters that testifies its slimming powers Sturgess, (2008). As
Somasundaram, (1995) cites John Steel of Colgate-Palmolive Co. who calls yellow
“intimidating in packages”. Red, on the other hand, is “warm and bright” and sells for
two reasons one it conveys a sense of quality, and two it is “an impulsive color and
makes you want to buy” Cheskin Research, (1998).
(Garber 1995), explicitly considered the role of visual perception and package
appearance in forming the consideration set at the point of purchase. Specifically, the
56
formation of a visually oriented pre attention / attention set precedes and affects the
formation of a subsequent product benefits oriented consideration set.
The empirical test used a series of six computer-simulated shopping trips across four
supermarket categories: flour, raisins, spaghetti and dry cereal. The research showed
how visual perception plays a role at the point of purchase.
According to Kuvykaite et al (2009), the package elements have in a case of different
products an ultimate effect on consumer choice from group of convenience. It was
found that for consumer’s purchase decision the verbal elements of package are the
most important. Analyzing the results of the impact of package elements on
consumers purchase decisions it was found that this depended on the level of
involvement. This states that there is a relatively stronger influence of visual elements
of package on consumer’s purchasing especially for “low involvement” levels,
contrary to those who are in the level of “high involvement”.
Rentie, Brewer (2000) affirmed that 73 percent of purchase decisions are taken in the
selling place. In many cases the consumers evaluate different brands alternatives only
in selling place. It is estimated that the consumer spend about 20 minutes in the shop,
inspecting 20 products a second. This means that the consumer has to decide from
24000 brands. There are theoretical numbers, because in reality consumers are
estimating only a part of these brands. Thus the importance of communication in
selling place is increasing. That situation stimulates to spend less given for traditional
advertising and greater attention should be given to communication in purchase place.
This indicates the increasing significance of product package as a brand
communication and differentiation tool. The package becomes the most important and
the last tool reaching the consumer, transfer the information and strengthen product
positioning in consumer consciousness by influencing the process of his/her decision
57
making process. Product communication strategy, is oriented to particular target
segment, stipulated the communication of the package. Product positioning is
implemented with the help of decisions of marketing mix elements. Those decisions
involve functions and components of the package, based on the package
communicating with the consumer through its features and components of verbal and
nonverbal character. The intermediaries of the package communication message are
components of the package: color, form, size, graphics, images, material, smell, brand,
and name of the product. The country, information about product, special offers,
simplicity, and instructions of usage, ergonomics, ecology of the package, and
innovativeness. All these elements of the package help the evaluation of the product
in qualitative, quantitative, price view, thereby helping in the formation of the product
cognitive and sensorial expectations, the impact to consumer mood, emotions and
attention.
Brieger et al (2007) study aimed at determining the perceptions of both consumers
and sellers of medicines at the community level to learn the color likes and dislikes
that influences the acceptance of a new color-coded child pre pack of anti malarial
drugs. Color is used mainly for branding and coding consumer products including
medications. Consumers associate certain colors in tablets or capsules with the effect
of the drug and the illness it is meant. Color coding was introduced in age-specific pre
packed anti malarial drugs for preschool aged children in Nigeria. Yellow was
designated for the younger ages and blue for the older. Qualitative methods used to
determine perceptions of drug colors like focus group interviews were conducted with
male and female community members, and in-depth interviews held with medicine
sellers in the Igbo-Ora community in southwestern Nigeria. Respondents clearly
associated medicines with their effects and purpose, for example white drugs were
58
associated for pain relief, red for building blood, blue helped to aid sleep, and yellow
perceived for malaria treatment. Medicine vendors had a low opinion of white colored
medicines and community members were ultimately more concerned about the
efficacy. The perceived association between yellow and malaria, because of local
symptom perceptions of eyes turning yellowish during malaria, yielded a favorable
response when consumers were shown the yellow pre packs. Therefore, the results
need the pilot study to be replicated nationally based on the above results.
Studies done by Inas et al (2010) determined the consumers’ preferences and
perceptions in Baghdad towards the color of Oral Solid Dosage Form (OSDF).
Consumers perceived that color of OSDF is related with the therapeutic activity of
medicine. Significant differences in this perception were found to be influenced by
gender, age group and the educational level. White and green perceived to be related
with analgesic effect, orange and yellow related with stimulant effect, and blue to aid
in sleep as noted by Brieger et al. (2007) & deCraen, A., (1996). It can be assumed
that the color of OSDF constitute an important stimuli for consumers to respond to the
treatment. These stimuli plays a crucial role in compliance and continuation with the
prescribed treatment confirming the study of Buckalew et al (1986) & Bowling, A. et
al. (2001). If the color of the medicine was not in accordance with the perceived effect,
consumers may not respond to their treatment Brieger et al (2007) Buckalew et al
(1991).
Research by Aarti More and Dr. Srivastava (2010) showed that the colors, shape, &
taste have an effect on how the patients feel about the medication. The study found
that patients undergo a sensory experience every time they self-administer a drug. A
survey of nearly 600 people found that 75 percent of them linked the color of the
tablet with drug compliance. The color of the medicine also influenced patients’ in the
59
form of their opinions about the taste of the tablet. The research revealed about 14
percent of the participants thought that pink colored tablets are sweeter in taste than
red ones. Majority of participants found that labeled yellow colored tablets as salty
without even knowing it actually tasted so. Eleven percent people believed all white
or blue color tablets are bitter in taste, whereas 10 percent participants thought all
orange-color tablets to be sour in taste. This study concluded without doubt that
patients form their judgments about medications, based on color, even before they
start taking them and the experience stays with them. "If people are given medicines
of a color of their liking, they will be more effective. The study will help consumers
and also pharmaceutical companies in packaging their products based on the
consumers’ liking,” according to Srivastava.
2.3 Design improvements relevant to pharmaceutical packaging
Evans et al (1992) considered packaging is a product property/characteristic, whereas
Olson and Jacoby (1972) considered packaging is an extrinsic element of the product
that does not form part of the physical product itself. Keller (1998) considered
packaging to be an attribute not related to the product.
There were a number of serious incidents in the UK due to accidental overdoses of
methotrexate, Ward, J., Buckle, P., & John Clarkson, P. (2010) study investigated
how the design of methotrexate packaging can influence patient safety, and aimed to
collect evidence to provide a basis for the development of new concepts for revised
designs by the pharmaceutical industry. The research found that patients experienced
a number of difficulties in using their medicines packaging, and due to "coping
strategies" may increase the risk of dosing errors. By investigating the practice of
methotrexate users the design of the system that supports methotrexate use was
proposed to ensure safety.
60
Package 'design' has been examined in terms of its impact on consumer's quality
perception Pieters and Warlop, (1999). Visual attention is a vital and the only way to
acquire information in consumer choice contexts about brands In perceptual analyses
the consumer examine sensory features of the stimulus, such as shape, color, and size,
then they y decipher the stimulus into categorical codes, such as brand name, pictorial
and textual information for a brand package, and they select certain elements of the
stimulus over others. The study examined a total of 52 female and 12 male Dutch
subjects ranging in age from 20 to 49 years who were invited to participate in a
session that lasted approximately 30 minutes. Eye tracking measures showed new
opportunities to develop descriptively the accurate process theories of consumer
information acquisition and decision making. The systematic study of variables like
such as display characteristics or package design, are known to influence consumer
attention in the field. Interesting exploratory results show the filtration patterns of the
consumer due to time pressure and motivation. Highly motivated consumers more
likely skipped the less informative pictorial on the product packages, and were more
likely concentrated on the brand name, which is essential information for making a
choice. Also, the time pressured individuals tend to avoid the cognitively taxing
ingredient information and they tend to prefer the less taxing pictorial information.
Future research needs to look at the information value and the visual attractiveness of
textual and pictorial features on brand packages, and examines to which extent both
influence the perceptual selections early in the choice process, and the final resulting
choices. Marketers can influence salience through attractive display or package design,
but also through their influence on consumer familiarity with brand names, brand
logos and a brand’s visual appearance. The methodology offers important
opportunities for managerial research on packaging design and shelf layouts. In pre-
61
testing packaging design, the attention grabbing power of the brand name, ingredient
information, pictorial and other package cues need to be examined, and their ability to
retain attention under various environmental and consumer conditions need to be
studied.
Murray, J. M., & Delahunty, C. M. (2000) studied eight cheeses were individually
assessed for 20 packaging attributes done by 15 trained assessors using 100 mm
unstructured line scales. Cheeses were evaluated for their packaging, in duplicate in a
sensory laboratory by an incomplete block design (four cheeses per evaluation
session). The packaging design was evaluated for shape unconventional, the amount
of illustrations, graphics or pictures which appear on a cheese label or pack the extent
to which a cheese label or pack are striking, bold or loud, rich colors that is the label
or pack is shaded in colors which are intense and rich, variety of colors on a cheese
label or pack, the extent to which a cheese label or pack is shaded in colors which are
pastel or light, the product performance, sensory information on a cheese label or
pack relating to flavor, texture and appearance, specialized for diet that is the extent to
which a cheese is specialized for consumers following specific diets, for example
vegetarian or low fat diets, the maturity level or the extent to which a cheese has been
matured, branding the extent to which a cheese brand, trademark or manufacturer
name is reinforced on the label or the pack, nutritional information that is the amount
of information on a cheese label or pack relating to nutritional value and other
information (which appears on a cheese label or the pack, including manufacturers
information, ingredient information and product guarantees. The packaging
performance looked at the convenience of pack that is the extent to which a cheese is
perceived to be easy to open, security of pack that is the extent to which a cheese pack
is sealed, fastened, tamper proof and secure, the presentation in pack, the visibility of
62
cheese that is the extent to which a cheese is perceptible to the eye through the pack,
the color of cheese that is the intensity of cheese color ranging from pale yellow to
orange and the overall packaging features. Their products' packaging attributes design
can predispose the consumer to purchase whilst products' sensory attributes confirm
the liking and may determine repeat purchases. Products should, therefore, convey
their sensory character by their pack design and, by doing so; consumer expectations
generated by the pack will be met. In addition, 200 consumers rated the cheeses'
packaging for preference and 207 different consumers rated the cheeses for sensory
preference. Analysis of variance showed that all 20 packaging attributes design and
22 of the sensory attributes discriminated between the cheeses. Principal components
analysis then illustrated the relationships between products and sensory or packaging
attributes designed. Relationships between descriptive packaging design and sensory
attributes investigated and determined showed general associations between products'
sensory and packaging attributes design. Preference mapping for cheeses' packaging
attributes design is a methodological advance in research that aims to investigate
consumer responses towards product packaging design. Cheese purchase information
allowed an assessment of the relationships between consumer preferences for cheese
(in terms of either sensory or packaging attributes design) and reported purchasing
habits. Investigation of the relationships between packaging and sensory attributes
found few specific relationships. The similar studies are done in the design of
pharmaceutical packaging design.
Packaging is a buying and consuming process, often not directly related to the
ingredients essential for the product to function according to Underwood (2003)
whereas Zeithaml et al (1972) maintains halfway between these two positions. With
regard to the main constituents of packaging, there are many different points of view
63
expressed as seen from the studies of Underwood et al., (1998, 2001, 2003); Product
managers and design firms seeks to create packages that break through the clutter of
the market place and communicate positive aesthetic, experiential, functional,
symbolic and or informational benefits to the consumer. Ultimately, by more
accurately matching packaging design elements to package content, buyer
disconfirmation of expectations after initial purchase will be minimized, stimulating
repeat sales. The research examines how packaging design creates and reinforces
brand identity.
Orth, C. U. R., & Malkewitz, K. (2006) found that creative and advertising executives
develop packaging design that is believed to communicate the brand identity best that
is based on past experience and intuition. Consumer feedback is rarely obtained as a
result there is a range of responses and trade-offs exist between package design
elements and responses that brand managers must consider when developing
communications. Therefore guidelines are needed to assist packaging design
stakeholders (e.g., wine marketers, designers, packaging manufacturers) in order to
manage the range of brand impressions created through their design choices. To
develop and refine meaningful guidelines for packaging design selection they studied
to identify packaging design elements that best capture differences among wine
packaging designs, and to determine how those design elements are related to
response dimensions in terms of perceived brand identity and wine-specific brand
impressions. Design involves a several important considerations ranging from the
specification of product components and its functional concerns, to the external and
aesthetic aspects of the product packaging providing the various brand consumers
touch points. Surveying several senior marketing managers, Bruce and Whitehead
(1988) report that 60% of respondents considered design the most important
64
determinant of new product performance where the importance of price is only 17%.
Similarly, an analysis of the performance of 203 new products showed that product
design is the most important determinant of sales success Cooper & Kleinschmidt,
(1987). This evidence is also supported by research that showed a high correlation
between the design quality of visual stimuli and financial performance of the
company Hertenstein, Platt, & Veryzer, (2005; Wallace (2001) Caputo, Tina (2005).
Design’s contributes to a product’s success in several ways. Firstly, in a cluttered
market, packaging designs distinguishes the product from its competitors and helps
gain the recognition in a crowded marketplace Berkowitz, (1987a, 1987b; Bloch,
1995); Schmitt & Simonson, (1997). Packaging design assists in building strong
brands by differentiating the products, cutting through clutter, creating loyalty,
allowing for premium pricing, and protecting against competition Henderson et al.,
(2003); Hutton, (1997); Schmitt & Simonson, (1997). Previous research indicates that
as much as 73 percent of purchase decisions are made at the point of sale thus
implying that the design of packaging plays a pivotal role at the point of sale
Connolly & Davison, (1996). Design pioneer James Pilditch (1972) when calling
packaging design the “silent salesman” ensured that a brand stands out and is
recognized. Accordingly, packaging design is significantly importance especially in
retail outlets with self-service. Packaging has become an increasingly important and
integral part of the selling process
In a research carried out amongst Kingston University students on a sample of 150
students’ brain laterality was done using a tachistoscope. The stimuli were 5 sets of
packaging for grocery products. Each set consisted of an original pack design and a
pack where the laterality of the copy and/or pictorial matter was reversed, (i.e. the
packs were mirror images). The adapted packs were of a high standard and could not
65
be differentiated from the originals. The recall of pack elements is likely to be
influenced by their lateral positioning on the pack, as well as the usually recognized
factors such as font style, size, color, etc. For some pack copy, such as brand name or
flavor description it is important to enhance recall and their research suggested that
these elements should therefore be placed centrally or on the right-hand side of the
pack. For other elements, such as an unappealing legal description or a product
disclaimer, recall is not desired, and these elements should be placed on the left-hand
side. This research concentrated on verbal elements such as pack copy, but there is
some evidence that to maximize recall, pictorial elements, such as product
photography, should be positioned on the left-hand side of the pack. It was found that
pack flashes function as pictorial devices despite containing verbal elements, and
these should therefore be positioned on the left-hand sides of packaging. This is an
important result for the design of price and promotional flashes, which are usually
located laterally, and where rapid perception may be crucial. The theory suggested
that brain laterality will only affect material on the outer sides of the pack. Central
stimuli are seen by both eyes and therefore received simultaneously by both sides of
the brain. Consequently, there is no evidence of laterality for centralized elements of
packaging. Application of this would suggest centralizing key elements such as brand
names whenever possible. Rettie et al (2000). It also influences impulse buying, as the
estimates show that almost half of all purchases are unplanned Philips & Bradshaw,
(1993).
Product design broadly includes a range of engineering related attributes such as
ergonomics, strength, recycle-ability, production-efficiency, and distribution ease as
well as aesthetics Bloch, (1995). Although packaging perception includes a range of
important non-visual elements (i.e., haptics) the focus is on visual appearances
66
because of marketplace prominence and relevance to the product. The study defined
product design as a number of elements chosen and blended into a whole by a
designer or design team to achieve a particular sensory effect Bloch, (2005).
Designers choice the product characteristics such as scale, shape, proportion,
materials, finish, color, ornamentation, and texture. They also decide how to mix
those elements, and determine the level of congruity among product characteristics
that may elicit a variety of psychological responses from consumers. Cervera Fantoni,
(2003). Generally there are two components: Graphic components: color packaging,
the typography, the graphical shapes used and images introduced; and Structural
components: like shape, size of the containers and the packaging materials used to
manufacture them. Design innovation looks at changes in both components.
The role of design is a means to differentiating products and services and this is
increasing because it becomes difficult to sustain the competitive advantage through
technology alone.
For drug names that look or sound alike the design technique is a recognition memory
task. Filik Ruth et al (2006) reported three experiments by evaluating the proposal that
highlighting sections of drug names using uppercase (“tall man”) lettering and/or
color that may reduce the confusability of similar drug names as medication errors
commonly involve drug names that look or sound alike. Their results showed that
highlighting sections of words using tall man lettering can make similar sounding
names become easier to distinguish.
WHO estimated in 2010 medicines that are counterfeited would be about US$75
billion as reported by Phil Taylor (2005) so establishing an appropriate technology in
the package design can counter the counterfeit is essential for the marketing strategy.
67
The role of design in differentiating products is increasing as it becomes difficult to
sustain competitive advantage through technology alone. Nixon Bill (2003) research
based on two case studies and extensive discussions with design managers and
consultants, highlighted the need for a clear understanding of the importance of the
design activity that is being evaluated and an appreciation of the many varied roles
that it plays from the idea generation stage through to development, packaging,
market positioning and promotion. The span of design in a product's life cycle
encompasses form (appearance), function (performance) and fit (ergonomics). The
research identified several factors influencing the balance between quantitative and
qualitative measures of design performance. The study suggested that the complexity
and dynamics of the competitive environment requires new conceptual models and a
new way of thinking about performance measurement.
Bo Rundh, (2009) studied how packaging and packaging design contributed to the
competitive advantage for marketing a product. A single case study based on five
“corporate stories” about packaging development was analyzed. The study
demonstrated the design process of a package was influenced from external and
internal factors. The outcome of the design process is dependent on the interaction
between the main players in this process. The study showed the importance of the
interaction with customers for package design planning. This results in a package that
triggers customers to make a purchase and or reinforce the brand name of the product.
The management implications based on these results show that packaging is a vital
instrument in modern marketing activities especially for consumer goods. The study
highlighted some factors that trigger purchase of a product by designing a suitable
package. Also packaging design helps to introduce new and better solutions for the
varied marketing and logistic problems in a supply chain. This study identified the
68
need for more research on packaging and marketing strategy. Innovation of new
materials and packaging requires efforts from a number of packaging suppliers before
the system is ready and accepted. According to Rundh (2009), this goal is possible if a
base material supplier becomes a full-service supplier of packaging. This requires the
developing innovative products and total solutions and the continued development of
packaging design expertise in partnership with customers Rundh, (2009).
According to Rundh, packaging may influence most variables in the marketing mix
and increase customer value or lower cost due to: packaging design, ensuring safety,
offering possibilities for price differentiation, reducing costs of transport and storage,
contributing to innovativeness by new solutions, increasing convenience, supporting
communication, and supporting promotion of other products Rundh, (2005).
Understanding the consumers and coming up with the appropriate packaging design is
central to the success of a product. Wells et al. (2007) investigated packaging designs
for retailers’ own labels that provides a means to build store loyalty. They found that
over 73% of the interviewed consumers stated that they relied on packaging to aid
their purchasing decisions. ‘Since so many purchase decisions are made at the point of
sale, the impact of packaging represents an important issue for food suppliers to
consider’.
In the food retail sector the functions of packaging can be summarized under three
headings: marketing (graphic design and format, legislative demands and marketing,
consumer requirements/convenience), logistical (protect, distribute and provide
information), and environmental (recovery/recycling, dematerialization, one-way vs.
reusable, toxicity) Jönson, (2000). Often these demands are conflicting thus requiring
a compromise between packaging functions and the needs to be addressed in a
systematic and wider perspective. The trend is to see that packaging be a part of the
69
larger integrated system containing multiple actors in the supply chain. The
conclusion is that the product and the packaging be developed simultaneously. Chan
et al (2006). A similar conclusion was reached by Olsson and Larsson (2009) who
advocated that creation of higher value for consumers is possible if product and
packaging innovation processes are integrated and the focus should be on both
functionalities. Practically Garcia-Arca et al. (2006) showed a logistical improvement
for frozen food in Spain through packaging rationalization by incorporated
appropriate ‘packaging design’ They showed that the differentiation quality of the
product could be improved, the logistical costs could also be lowered thus improving
the overall quality and service by proper logistics management.
The environmental function helps provide a sustainable packaging across the whole
distribution. Svanes et al. (2010) created a holistic methodology for evaluating the
whole chain using it as a tool in packaging design. They study focused on
optimization of the package rather than minimization. They also set up a number of
indicators for evaluating the packaging design. The aim was not to develop a
guarantee development of environmental and resource efficiency but to have options
wherein there is a balance with the marketing aspects.
Nancarrow et al. (1998) had identified three key issues that need to be addressed by
marketers and packaging designers based on the consumer’s past experience, needs
and wants; packaging design and getting the customers to notice its message; and
evaluating the packaging design and labeling for their effectiveness in the
communications effort.
A powerful package design needs to look at the complexities involved and the power
of the design that is comprehensive when considering packaging in your promotional
mix as research by Laura et al (2003).
70
The research on Sustainable Product Development (SPD) identified the need to move
beyond incremental change (e.g. redesign of existing products) to more fundamental
‘step changes’. These are described as ‘function innovation’ or ‘system innovation’
Nuij (2001). Brezet, H. (1997) found that there is a need for a sustainable society that
needs a sustainable design innovation.
Sustainable packaging is a moving target what's considered most sustainable today
might not be tomorrow. Recognizing this fact and to encourage continuous
improvement, Wal-Mart's has the Packaging Scorecard that rates packages against
others in the same product category. Sustainability comes after stability, compliance,
tamper-evidence, child-resistance and traceability considerations. When designing
and sourcing pharmaceutical packaging, improving sustainability offers the potential
of significant cost savings and other benefits. Looking at what other industries are
doing to improve the sustainability of their packaging gives a number of ideas for
pharmaceutical manufacturers to consider. Although a holistic approach is needed for
a most sustainable package, one can improve package design by thinking about source
reduction, renewable material, recycled content, and recyclable material. In source
reduction strategy the packaging designers and decision makers need to put
concentrated products in smaller containers. Here the product-to-package weight ratio
is an excellent top line indicator for making decisions about packaging efficiency and
sustainability. The most common renewable packaging material, wood fiber, is the
basis of paper, paperboard, and corrugated cardboard packaging. It's been widely used
for decades, and in developed markets this mean new trees are planted to replace
harvested wood. To ensure fiber is derived from responsibly managed sources, a
growing number of packaging buyers require certification of fiber-based packaging.
However, packagers are using other materials such as palm fiber. The idea of using
71
agricultural waste or nonfood crops, such as switch grass, rather than corn to produce
biopolymers, is gaining interest. Recycling reduces greenhouse-gas emissions and
waste. As with other materials such as glass and aluminum, recycling plastic requires
less energy than producing packaging from virgin materials.
Most packaging materials can be recycled, but collection programs and participation
are not universal. Increasing the recycling rate would require a national policy, a
producer "take-back" scheme such as the one used in Europe, and more public
education about recycling is suggested. There has been resistance to this type of
legislation, but opposition could dissolve in the face of rising concerns about finite
resources, energy consumption, and low recycling rates. With or without passage of
national legislation/policy, the pharmaceutical industry can reap immediate benefits
by increasing the sustainability of its packaging. The advances should simplify
administration and the environmental impact of the packaging. Hallie Forcinio (2007).
This has been developed by industry issues that concern the society and environment
Von Weiszacker et al (1997).
It is widely recognized that radical changes are needed to products and packaging if
we need to move towards a more sustainable society, some researchers estimate that
environmental impact needs to be reduced by to 95%. This demands that the design
needs to change towards more sustainable practices. In the area of packaging there has
debate about whether making packaging more environmentally compatible would
reduce its ability to protect and promote the product Prendergast, et al (1996). There is
also widespread recognition that there needs to be trade offs between the
marketing/logistics functions and the environment when considering packaging
design Kassaye, W. et al (1992) Livingstone, S. et al (1994).
72
Dewberry, E. et al (1996) focuses on eco design 'design which addresses all
environmental impacts of a product throughout the complete lifecycle of the product,
whilst enhancing the function, quality, and appearance' of the product / package that
substantially reduce global pressures on finite resources and decrease levels of waste
and pollution. The early stages of the product requires critical decisions on materials,
energy requirements, recyclables and loyalty in order to determine the life cycle
performance of the product Lewis et al (2001).
Recently in the UK a prominent issue is the environmental impact of as it is a very
visible product in the waste stream composing around one-third of household rubbish.
Over the past 50 years considerable efforts have been done to reduce the
environmental impacts of packaging by focusing on issues such as light-weighting
and material selection. However, although the weight of packaging per unit of product
has decreased the changes in demographics and lifestyles, smaller family size and the
need for greater convenience have led to an overall increase in the total amount of
packaging used and disposed. Holdway et al (2002)
The pharmaceutical packaging industry demands inspection technologies that are
versatile for example, a reliable leak-testing solution. Also, nondestructive methods
like vacuum decay or airborne ultrasound offers measurable advantage since testing
can be done in any sequence and repeatedly on a single sample unlike destructive
tests. These inspection technologies need to be incorporated into protocols in the
manufacturing process.
Vacuum decay and airborne ultrasound are two efficient nondestructive inspection
methods to test for package and seal integrity, and involve simple, easy-to-follow
testing procedures. Vacuum decay technology can be used to test all types of
pharmaceutical packaging (e.g. vials, syringes, pouches, blisters, sachets, bottles,
73
cups, trays). Tony Stauffer (2009). Design innovation needs to incorporate all aspects
of technology while considering design improvements for the pharmaceutical product
package according to Mortell (1993)
Due to increasing pressures of competition apart from technical challenges, the
packaging design expectations are increasing as observed by Jürgen Munzel (2007).
2.4 Indian culture and education system – its role and impact on
packaging
'Culture' is an abstraction that shows the societies total way of life. It is the group's
history result to an adaptation of the physical environment. It refers to the shared
patterns of feeling and behavior, beliefs, and the basic concepts and values that the
group members carry in their minds that are a guide to their conduct. Religion, social
relationships, philosophy, economics, scriptures, technology mythology, and various
other aspects of their lives contribute to their culture. Culture is constantly changing
and transmits the next generations. All societies have varying styles that differ from
one group to another. Gautam S, Jain N. (2010)
Unlike many countries that are grappling with aging populations and rising
dependence ratios, India has a rapidly growing young population - a potential
demographic plus. But India needs thriving cities if that dividend is to pay off. The
research by the McKinsey Global Institute (MGI).estimates that urban cities would be
generating around 70 percent of the net new jobs created till 2030; produce more than
70 percent of the GDP, and drive a near four-fold per capita income increase across
the nation. Surging growth and employment in cities will prove a powerful magnet.
India's urban population grew from the 290 million reported in the 2001 census to an
estimated 340 million in 2008, and MGI projects that it could soar further to 590
million by 2030. This expansion in the urban area would happen at a great speed
74
unseen before in India. For nearly 40 years (between 1971 and 2008) India's urban
population had risen by 230 million. It could take only half that time to add the next
250 million. The speed of urbanization poses an unprecedented managerial and policy
challenge. Yet, India has barely engaged in a national discussion on how to handle
this seismic shift in the make-up of the nation. Indeed, India is still debating whether
urbanization is positive or negative, and whether the future lies in its villages or cities.
This is a false dichotomy - villages and cities are inter-dependent.
In a global context, the scale of India's urbanization will be immense. India will have
68 cities with populations of more than one million, 13 cities with more than four
million people and six mega cities with populations of 10 million or more, at least two
of which (Mumbai and Delhi) will be among the five largest cities in the world by the
year 2030, it is estimated. India will have to spend USD 2.2 trillion in cities over the
next 20 years, including USD 1.2 trillion in capital investments. It has to make tier I
and tier II cities near self sufficient through monetizing land assets, maximizing
property tax collections, recovering O&M costs through user charges and pushing for
greater leveraging of debt and private participation. (www.bangaloretrends.com)
India is the second most populous country with the largest democracy in the world
whose history dates back to 2500 B.C., when the Indus River valley inhabitants had
developed an urban culture that was based on commerce and sustenance of
agricultural trade. Aryan tribes had infiltrated from the northwest onto the Indian
subcontinent around 1500 B.C., bringing the evolution of Hinduism, and resulted in
the various empires that followed. Arab incursions began in the 8th century and in the
12th century it was the Turkic followed by the European traders in the late 15th
century. In the 19th century the British had virtual political control of most of India.
Presently India is one of the fastest growing economies in the world with a
75
burgeoning urban middle class. The ethnic split is Indo Aryan 72%, Dravidian 25%,
Mongoloid and others 3%. Ethnically, there are also differences between Indians from
east to west, and north to south. Visitors to India can expect a varied and vibrant
mélange of cultures and traditions in this country, as well as the requisite cultural and
social sensitivities that are associated with such diversity. Indian culture is diverse and
rich as a result that is unique in its own way. So while Indians have accepted modern
means of living, improved lifestyle with almost unchanged core values and beliefs
over time. A person can change his way of eating and living, clothing style, but the
person with rich values usually remains unchanged because these values are deeply
rooted within the mind, heart, body and soul from where our culture originated.
The term culture can be looked at as a state of development of the intellect or manners
associated with a community, group, region or country. The forces like social and
political that influence the growth of a human being defines culture and as per Indian
understanding, there are two kinds of materials available in the world: Prakrit
(natural) and the other is Sanskrit (cultured). Things received from nature, as it is,
may not be usable by human beings they need to be cultured. The metros cities have
seen a lot of family value like celebrating anniversaries and birthdays, observing the
rituals and also outdoor entertainment. The Indian culture has the right mix that it has
imbibed from the western influence and maintaining the traditional ethnic family.
Singh & Krishnan (2005) notes that uncritical transfer of management theories and
techniques based on Western ideologies and value system has contributed in many
ways to organizational inefficiencies and ineffectiveness in cultures such as India
Kanungo and Jaeger, (1990); Singh & Bhandarkar, (1988). The regional cultural
practices influence the business/management style & culture, also described as the
shared values and assumptions that guide behavior in an organization (Tracy, 2000).
76
Indian business culture is characterized as highly diverse and heterogeneous. In
corporate or business meetings it is important to be sensitive to, and appreciate, the
diversity of Indian business culture, which varies across regions, sectors, and
ownership patterns. Scalem M and Manideepa Patnaik (2011)
Cross-cultural comparative studies mostly have been based on the assumption of
cultural homogeneity that equates culture with nation. This assumption overlooks the
cultural diversity that might exist within a nation. This study is based on the review of
four empirical studies conducted by J.B.P. Sinha (2004) and his associates focusing
on cultural diversity within India. A review of these studies revealed seven pan-Indian
cultural preferences: (a) collectivist orientation; (b) respect for status and power; (c)
primacy of personalized relationship; (d) desire to be embedded in an in-group; (e)
families; (f) context-sensitive (situational) behavior; and (g) cynical view about others.
However, it also revealed location-specific cultural preferences. They have analyzed
these preferences, extracted from the findings of these studies for those locations
which have been covered in more than one study, to present a holistic picture of the
culture of each location. Sinha and his associates view cultural differences among
various locations as a consequence of different degrees of infrastructural development
in those locations. The authors are inclined to argue that cultural change is context
sensitive and depends on the historical and cultural legacy inherited by a location.
They argue for an evolutionary emic approach to study cultural diversity within India.
Panda, A., & Gupta, R. K. (2004)
Culture is a construction of both historical and present shared realities in a given
society or group. Triandis (1994) saw two contributors to culture as the history of
people and ecology. Shared historical realities encapsulated as myths, stories and a
shared sense of lineage play a big role in determining culture. As do the historical

77
influences that a society undergoes. Masculinity in a society may have a lot to do with
the historical past that the society shares and so does power distance. Ecology
represents the socio-economic niche in which a society operates. The niche structure
determines to a large extent the manifested aspects of culture. The economic structure
of the society has a role to play in the manifested aspects of culture like power
distance, masculinity and time orientation.
Peterson and Smith (1997) identified culture contributors as language, proximity,
colonization, religion, economic systems, economic development, technical
development, national boundaries, major industry, climate, topography and
indigenous economy. Another parameter they introduced is that of geography which
could play an important role in determining culture as it determines a lot of aspects of
human life. Language is another important determinant especially the root/family of
the language. If the root of the language is common with adjacent languages then
there will be a greater overlap of culture. Language codifies culture within its
grammar and vocabulary and is a key constituent of culture. Religion and the
underlying philosophy of the religion as also the mix of religions in the society will
determine culture. Both language and culture are part of the social construction of
reality and contributors to culture and social structure.
Smith (1992) postulated the basis of national identity as historical territory or
homeland, common myths, common historical memory, mass public culture, common
legal rights & duties and common economy with territorial mobility for members.
These bases reflect different antecedents of culture formation. These bases cover
geographical, historical, institutional, social identity, and the economic elements
embedded in the culture. Broadly then the antecedents of culture can be divided into
historical antecedents and contemporary antecedents. Sinha et al (2002) have
78
identified historical influences and contemporary influences as the contributors to
culture. However like the historical dimension, geographical dimension too has its
constraining effect on the formation of culture. Together they provide the inner core
of cultural understanding. These two factors are hard part of culture antecedents.
There are other elements like social identities, economic parameters, and institutional
factors which can be seen as the softer elements in the antecedents to culture. These
softer elements are also contemporary in nature. Each of these soft and hard elements
would have an impact on the culture of a society or a group. Each of these broad
categories would comprise a set of influences that make these categories. Economic
factors have a role to play in culture formation. The forms of employment, means of
production, the resource scarcity or availability influence culture formation. There are
five antecedents to the culture that is social identity, historical context, economic
parameters, institutional factors and geography as shown in Figure 2.2. Herriot &
Scott-Jackson (2002) argue that social identity refers to those social categories to
which one believes one belongs (e.g. family, religion, nationality, political party,
ethnic group, occupation, locality, work group etc.). Social identity is related in a
logical and coherent way to values assumed by people Gouveia & Albuquerque,
(2002). Vigil & Hanley (2002) argued that social identities are historical constructs.
Dien (2000) argues that cultural identity is constructed and reconstructed through
different levels of historical process. He argues that historical text and symbols
maintain the cultural identity of a group. Economic is embedded in culture and culture
is materialized in the economic Gison & Kong, (2005). Castree (2004) argues that
economy produces the symbols of culture. Fells (2003) analyzed the role of
governmental institutions in formation and management of cultural identity.
Bierbrauer (1994) has studied production of cultural systems by legal institutions.
79
Roller (2002) has also looked into the role of institutions and institutional rules in
shaping the shared values and beliefs of their members. Geographical factors
determine the dwellings, food habits, rituals, the physical structure of people, the
work habit, martial art of the region etc. This factor may explain better the culture
variation than any other dimensions of existing models. Geography is central to
national identity, and while geography is not destiny, it comes awfully close to being
so much tradition that can be invented but it cannot be invented out of nothing
Raymond, (2005). Broers (2003) has also recognized this influence of geography on
multiple aspects of culture. He argued that geography has seminal influence on
political culture and on the historical realities. Rankin (2003) argued that globalization
studies can turn to geography for tools to analyze the significance of place and scale
in understanding the culture. Geography can determine the economic structure, food
habits, structure of society, division of labour and rituals in a society or a group.
Giddens (1984) has also commented on the importance of historical geography in the
social routines. He argued that regionalization is not just a question of space but also
“the zoning of time-space for routine social practices”; regions represent “the
structuration of conduct across time-space,” contexts within which social interaction
takes place.
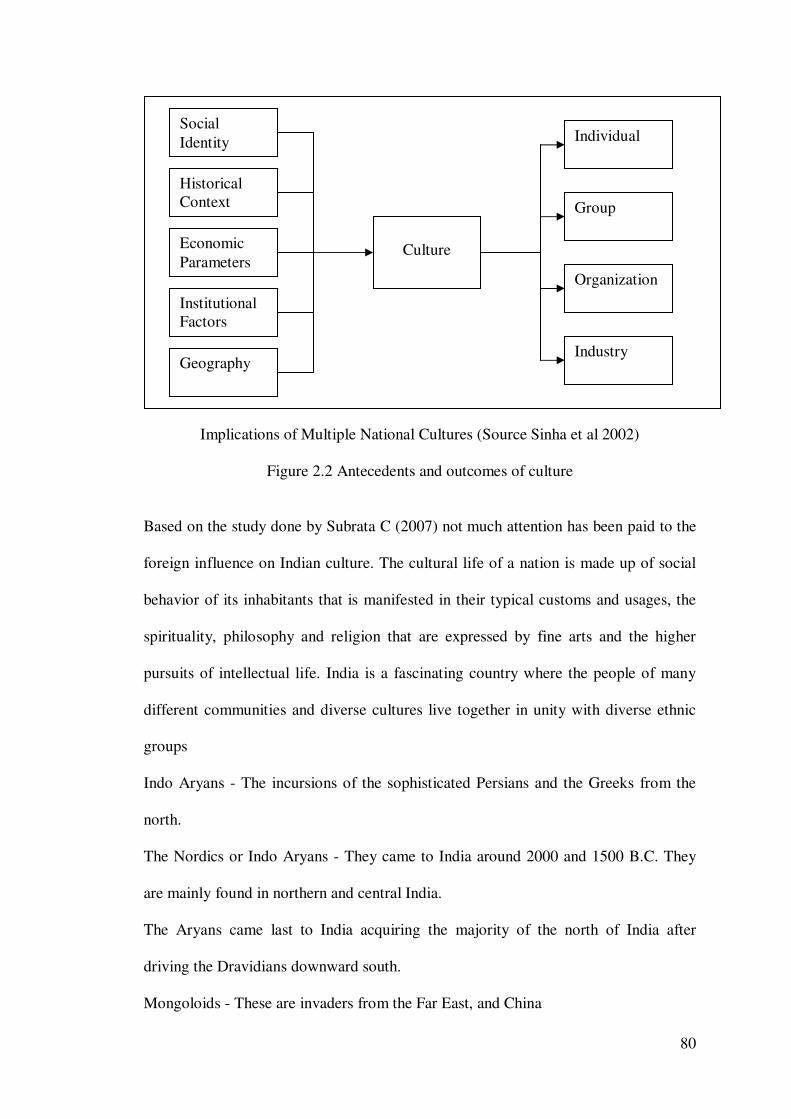
80
Implications of Multiple National Cultures (Source Sinha et al 2002)
Figure 2.2 Antecedents and outcomes of culture
Based on the study done by Subrata C (2007) not much attention has been paid to the
foreign influence on Indian culture. The cultural life of a nation is made up of social
behavior of its inhabitants that is manifested in their typical customs and usages, the
spirituality, philosophy and religion that are expressed by fine arts and the higher
pursuits of intellectual life. India is a fascinating country where the people of many
different communities and diverse cultures live together in unity with diverse ethnic
groups
Indo Aryans - The incursions of the sophisticated Persians and the Greeks from the
north.
The Nordics or Indo Aryans - They came to India around 2000 and 1500 B.C. They
are mainly found in northern and central India.
The Aryans came last to India acquiring the majority of the north of India after
driving the Dravidians downward south.
Mongoloids - These are invaders from the Far East, and China
Social Identity
Historical Context
Economic Parameters
Institutional Factors
Geography
Culture
Individual
Group
Organization
Industry
81
Dravidians - These are the South Indian people reputed to build the Indus valley
civilization, who were the original inhabitants of India. With time they settled in the
south permanently. These are the people who inhabit the South India region such as
Kerala, Tamil Nadu, and Karnataka etc
Western Bracycephals - They are the Alpinoids also including the Parsis. They
inhabited the western part of India. This was subsequently followed by the United
Kingdom, Portuguese and French. Webindia (2011) & Lifestyle (2011)
India is a country located in southern Asia that covers most of the Indian
subcontinent. From the Paleolithic man in India, many races came to India and settled
down. The Indian culture is a mix of seven main races. The tribes like Gonds and
Santhals today represent the earlier Neolithic people. These Neolithic people were
driven to the forests and hills by the later races that migrated to India. India saw
advent of many religions and sects over a period of almost four thousand years. The
India Diasporas has all these in the social fiber even today, albeit with many
variations. The Aryans from the northwest invaded around 1500 BC, pushing the
Dravidian peoples to the south. In the 3rd century BC India was unified by Emperor
Asoka. In the 4 and 5th centuries AD it experienced a golden age before the Muslims
invaded in 1000 and later Baber the Mongol conqueror established in 1526-1857 the
Mogul empire. In the 16 and 17th centuries several European powers had established
trading posts. Finally in 1857 the British assumed authority over India.
The chronological events are
Iron Age
Kiratas (Mongoloid in race) long painful march to the east of
Himalayas arrived in present day Northeast India (Assam &
Sikkim) around 1100BCE- 1000BCE.
82
538 BC: Cyrus the Great, founder of the Persian Achaemenid Empire conquers
northwestern parts of the Indian subcontinent
Ancient India (500 BC–550 AD)
333 BC: Persian rule in the northwest ends after Darius III is defeated by Alexander
the Great, who establishes the Macedonian Empire after inheriting the Persian
Achaemenid Empire.
180 BC: Establishment of the Indo-Greek kingdom.
Medieval India (550–1526 AD)
712: First Muslim, Md. Bin Qasim defeats Raja Dahir
1000: Invasion of Mahmud of Ghazni
1021: Mahmud Ghazni defeats Tarnochalpal and annexes Punjab
1497–1499: Vasco de Gama's first voyage from Europe to India and back
1510–1961 Portuguese India
1696–1869 Danish India
1759–1954 French India
1612–1947 British India
Sir Herbert Risely in his The People of India (p.33) enumerates seven distinct types of
races in India such as Indo-Aryan, Turko-Iranian, Scylhio-Dravidian, Aryo-Dravidian,
Mongolo-Dravidian, Mongoloid and Dravidian. E.J. Rapson in “The Cambridge
History of India”(Vol. I, Chapter II), classified the races of India into four groups
(i.e.) primitive tribes, Mongolians, Dravidians and Aryans. These four races were
identified on the basis of their physical appearance. Each race has distinct traces of its
cultures. The influence of the Mongoloids was not much felt in India till recent times.
The Gurkhas are the best representation of their culture. The Dravidians are given the
unique honor of being called as the indigenous people of India. It cannot be denied

83
that both the Dravidians and Aryans had distinct features, customs, manners, practices
of their own. Hence the Indian people could be identified based on the racial theory.
The same thing applies to creed and sect in India. Jayapaul A et al (1997)
Dravidians
From the studies of Harappan Civilisation, it is evident that probably the people were
of Dravidian origin. They are believed to be migrated from West Asia during pre-
historic initially settled in the mountain ranges in Baluchistan and moved further east
and settled around Punjab. Later, when the Aryans started invading this region, the
Dravidians migrated to the South. They were short stature, dark complexioned,
muscular and flat-nosed. Dravidians were progressive and cultured people. Their
culture was superior to the contemporary cultures elsewhere. They had advanced
administrative methods, using rivers for communication and trade. They knew the art
of shipbuilding and traded with West Asia. They had a matriarchal social structure.
The invading Aryans had adopted many aspects of the culture of the Dravidians
Aryans
There are conflicting views regarding the influx of Aryans in India. However, the
most accepted logic is based on the Vedic literature that indicates the conditions
prevailing at that. Most anthropologists concur that the Aryans originated in cold
regions, mostly the Central Asia. It is believed that the Germans, Persians, Romans,
Greeks, Celts and they belonged to the same origin. During a mass migration of
Aryans, the groups entered India, Persia and Europe. The comparative study of these
languages (including that of Sanskrit) suggests their common origin. The Aryans
worshipped Fire and Sun (the most revered entities to fight the low temperatures and
create energy for use). They used horse for travel. Their physical features were typical
– tall and fair with light colored eyes and sharp aquiline nose and long brown hair.
84
The word Aryan denotes a culture that is a mix of Avesta and Rigved and adopted by
the Eastern part of Indo-Europeans race.
Mongoloids
The Mongoloids hailed from the region of cold climate in the North Central Asia
(Mongolia). They were culturally not so advanced. However, their migration to China
and settling down astride yellow River brought about cultural enhancement. In India,
the Mongoloids entered through Central Asia. Entry of Mongoloids across Himalayas
was restricted due to the inhospitable land.
This shows ample evidence that the North, South, East and West of India have a
different cultural behavior due to the historical influences of India. Therefore the
customer behavior will be inherently different in each of the above regions but is
homogenous as the culture prevalent in that particular region.
India has people of human groups carrying a diversity of cultural traits and genes
having most of the primary ethnic strains Mediterranean, Mongoloid, Proto-
Australoid, Negrito and several composite ethnic strains. Like any other plural society,
India offers a cauldron where the processes of unification as well as of
fragmentalization are unceasingly taking place. This presents a situation of cultural,
biological and environmental richness and diversity, and one where the constant
interactions between communities are aiding the formation of bridges, thus creating a
sense of unity. It is in these terms that India offers an ideal case for examining unity in
diversity both biological and socio-cultural perspectives. Lahr and Foley (1998),;
Cann (2001); Bamshad et al. (2004); Bhasin, M. K. (2006).
Yathish TR et al (2009) in their research looked at the phenomenal increase in the
medical and nursing colleges in India resulting in unregulated growth that has
adversely affected the quality of training in medical institutions of India concentrating
85
on the four major metro cities. Admissions to government medical colleges in each
Indian state are conducted on the state quota thus concentrating education on the four
major metro cities based on the studies of Ajay Mahal et al (2006) usually the system
restricts the student to the state wherein they did the schooling.
The eight Indian metro cities have health care delivery formats that can be compared
to the best across the world. However this level of health care has not yet percolated
to the Tier II, III Cities and Rural India. Also of great concern for the people residing
in Tier II, Tier III cities and especially Rural India is the fact that they have to travel
long distances to access healthcare services. (ISB 2008)
2.5 Strategic implications of pharmaceutical packaging
In the game of marketing customers see the pack ultimately. Therefore the package is
a vital differentiator for the product on offer as noted by Arnold, (2003). In terms of
marketing strategy for the consumer it is important to find a workable value
proposition that is unique and attractive. That means the manufacturer need carve out
or develop a market niche for the product that responds to a particular segment. Paul
Green (2000). McCarthy's 4 P marketing mix classification can be viewed by
manufacturer as the customers' four Cs that is customer value, the cost to satisfy,
convenience and communication (4C perspective).
Two separate studies were done to find out the trade-offs in package values between
different players in the value chain that was created through development of value-
adding package solutions. It was observed that the positive effects of brand
advertising cannot compensate for less efficient packaging. When creating packaging
solutions the market need will be turned into a higher demand chain pull attracting
business. The packaging solutions created gave the value chain great advantages for a
majority of stakeholders. Olsson A., Györei M. (2002).
86
Brand owners are operating in a fiercely competitive market environment, faced with
meeting consumer demands for high quality products at low costs while competing
against other brands for shelf space and product recognition. The packaging, being
usually the first visual contact with consumers, should be distinctive and attractive in
order to maximize the market appeal of the product (CWMI 1999). This provides
brand owners with one of its strongest marketing tools. Packaging design is need for
successful marketing. The marketing departments are dedicated to “get the packaging
right.” sometimes leading to a lopsided product-packaging cost ratio. This was seen in
10 out of 40 food industry sectors where the packaging costs exceeded the costs of
edible foodstuff ingredients (Hicks 2002).
Koenigsberg, O., Kohli, R., & Montoya, R. (2010) has described a model examining
how a firm might choose the package size and price for a product that deteriorates
over time. Their model considers four factors: (1) the usable life of the product, (2)
the rates at which consumers use the product, (3) the relation between package size
and the variable cost of the product, and (4) the minimum quantities consumers seek
to consume for each dollar they spend (reservation quantities). It was seen that when
the cost increases as a linear or convex function of the package size, the firm should
make packages of the smallest possible size. Smaller packages would reduce waste
and allow consumers to more closely match their purchases with desired consumption.
This in turn allows the firm to charge a higher unit price and also sell more unit
volume. The results imply that in a market with multiple package sizes (produced by
the same or competing firms), at least one of the packages must have the smallest
possible size, provided the fixed cost of making the product is sufficiently low. In
case of concave cost functions, the firm may find it optimal to make larger than
smallest-size packages.
87
Packaging today is a very important marketing tool. Better packaging will result in
good protection, reduced losses damage and wastage, and saved transportation costs
of products. It enhances the product value and helps in expanding the markets within
and out of the country (Jakhar, 2004). For many products, the first contact for the
buyer is with the package.
A quality product is not enough a substitute for an effective package, but having an
effective packaging can help in changing the way people think in favor of the product,
it helps to retain customers and attract new ones, thereby increasing visibility of the
product and company. It helps to reinforce the brand image in the store and at home
thus enhancing the cost effectiveness of the marketing budget, and increasing the
competitive edge and profits of the product (Masten, 1996).
Bhattacharjee B J (2005) studies in Karimganj in South Assam a remote urban area
the packages of several products where the people get accustomed with the product
even before introduction in the local market. Being dejected most of these recent
products are usually not available readily in the market. However, by the newspapers
and television advertisement people come to be aware about the special features of
packaging of the particular product. The study based on a sample size of 73 randomly
collected people of both the sexes and several age groups. This study concluded that
mostly the people think packaging is a necessarily important for the product as it
increases the sale even though it is a cost. People strongly believed the need to modify
the package along with time as that helps in the identification of the product. They
wanted that the packing should be hygienic; differentiable from fake products as it
reliably expresses the product.
88
Wells et al (2007) has included packaging into the marketing mix. The packaging is a
‘silent salesperson’ that helps to differentiate from the vast range of seemingly similar
brands as noted by Smith and Taylor (2004).
Ampuero and Vila, (2006) has noted that packaging is both the product and brand.
Packaging is usually a part of product strategy or the related product subcategory in
the traditional 4Ps as stated by Calver (2004); Kotler et al., (2005); and Kotler and
Keller, (2008). Now with the considerable progress in technology and customer
choice, Fill (2009) observed that packaging is used to make the decisions on the brand
choice therefore the marketing aspects of packaging are very important from the
marketing communications view point. Several consumer product companies develop
the packaging designs into an optimal pack size. Ivaňez Gimeno, (2000), quoted in
Ampuero et al, (2006.) Oertel, Peterman et al, (2002) noted that the key marketing
drivers are convenient use of the packaging
Packaging is a communicator of the brand according to Meyers and Lubliner (1998),
therefore packaging is tool for communication and branding as observed by
Underwood and Ozzane (1998) and Silayoi and Speece (2004) wherein various
marketing messages can be expressed as observed by Schmitt and Simonson (1997),
Fill (2009) and Underwood (2003)
Convenience is commonly considered by Scholderer and Grunert (2005) as something
(e.g. consumption) that can be done with reduced effort. It is influencing consumer
behaviour and it contributes to the success of a product in the market, especially for
non-durable consumer products as observed by Olsen et al (2007). McDaniel and
Baker (1977) noted that if the packaging design lacks convenience side it could result
in a negative perception of a product. This convenience is related to the point of sale
according to Olsson et al (2002), so convenience or utility is one of the essential
89
functions of packaging as observed by Robertson (2006). As packaging provides
convenience to the middlemen (e.g. retailers, transportation companies) and the
customer as noted by Prendergast and Pitt, (1996) in reality customers have little or
no knowledge of the general consumption patterns and so cannot affect the
marketplace. This is more so in a highly industrialized society as researched by
Heiskanen, E. et al (1995) for more effective adaptation or the execution of
advertising the local preferences such as cultural dimensions are vital as they
influence the customer perception. According to L van den Berg-Weitzel et al (2001)
there is a need to consider opting for a design that is local or global based on the
culture for marketing success. It is apparent that packaging plays a predominant role
on customers’ attitudes of the brand from the research studies of Karsaklian (2009).
The design of the packaging can stimulate a positive attitude towards the brand from
studies done by Orth et al (2008), using the Gestalt psychology. Rundh (2005) noted
that the package attracts customers’ attention to particular brand and influences the
customer perceptions about the product. The Packaging acts as a communication tool
for transmitting symbolism of the product and the corporation or brand. This was
observed by Underwood, (2003) and Kuvykaite et al. (2009). It shows that the visual
elements aid in consumer’s purchase decision however the model defined by Bloch
(1995) that provides an approach explaining the systematic relationship between the
product form and the consumer responses that can be ‘cognitive’ (product beliefs and
categorization) and ‘affective’ (positive and negative responses). Bloch concluded
that the personal preferences that are influenced by the consumer’s culture are more
important. Delivering value added products are vital so pharmaceutical makers
needed to enrich their production process with the unique knowledge that will reap
the rewards as observed by Simon Williams (2005). From the managerial point of
90
view, for packaging to develop its functions suitably, the structural and graphic design
of the packaging with the optimum size of the pack need to be subjected to rigor of
positioning in order to occupy a niche in the market as noted by Ivan˜ez Gimeno
(2000). So, according to Underwood (2003) packaging is, specifically related to the
strategic decisions of the marketing mix and, hence to positioning decisions.
From the customers view point, packaging is crucial, as it is the first thing that the
customer sees before making the final purchase decision. Cervera Fantoni (2003) and
Sonsino (1990) noted that this function has increased with the popular self-service
sales systems that caused packaging to move to the foreground for causing a purchase.
That is why packaging has been called the “silent salesman”, as the package informs
the customer of the qualities and benefits they can obtain from the product as
observed by Vidales Giovannetti, (1995). According to McDaniel et al, (1977) the
packaging provides the manufacturers the last opportunity to persuade potential
customers before brand selection thus, all the packaging elements, like texts, colors,
structure, images and personalities need to be combined to provide the customer with
visual sales when purchasing and using the product as observed by McNeal and Ji,
(2003).
91
2.6 Research gap - Pharmaceutical packaging
The Lockhart (1997) model of packaging has a gap in addressing the strategic
implications for enhancing the utility value of the pharmaceutical packaging. This
research looks at the gap in the packaging model on the basis the innovative
technologies, the form and shape of the package, and on the design of the package
that increases the value of the package. These additions helps in enhancing the
protection, communication and utility of the package thereby making it a strategic
sales tool in addition to the traditional 4P’s of the marketing mix.
2.6.1 Research gap - Pharmaceutical packaging - Technologies relevant to
pharmaceutical packaging
There are several research gaps that exist in the packaging of pharmaceutical products
with reference to Packaging functions. This research attempts to study under what
conditions and through which the Packaging functions would create a competitive
advantage in terms of evolving suitable marketing strategies.
It was Lockhart (1997) who synthesized this concept into a tool referred to as “The
Packaging Matrix.” The obvious basic use of Packaging is of containment. The matrix
has nine intersections Packaging functions. Other than the containment there are three
important functions of packaging that have to be considered—protection, convenience
and communication. These are connected to the Packaging environments wherein the
package has to perform its functions in three different environments - Physical
environment ambient environment / Biosphere and Human environment. Failure to
consider all three environments during package development will result in poorly
designed packages, increased costs and consumer complaints. The Lockhart model is
old one and not able to give the strategic implications for making crucial decisions
especially in the case of pharmaceutical packaging. This gap in the Lockhart model
92
has been identified and adopted in the Indian context. The modified Lockhart model is
more effective in maximizing the intersection of each packaging function and
packaging environment without diminishing the overall performance of the
pharmaceutical package. The utility function in the human environment needs to be
properly elaborated so that the proper positioning strategy is done. This function is
very vague and not able to accurately describe the value addition been available to the
customer. There is need to properly define the variable that describe the utility or
value function in the package that fully explains the main attributes of the package.
Once this is properly identified the awareness and perception level of this variable to
the customer needs to be accessed so that the proper design can be done on the
product package so that the proper positioning of the marketing mix can be done to
the customer. The literature has identified several variables that describe the utility or
value of the package however there is a gap in specifically mentioning the key word
that predicts the utility or value of the product package.
2.6.2 Research gap - Pharmaceutical packaging - Form and color relevant
to pharmaceutical packaging
The traditional positioning of the product based on the value or utility of the package
would not be sufficient to implement a competitive marketing strategy because of big
clutter of similar brands in the market. In addition to value there is need for the
product to be unique. The literature has identified that the form of the package and
color has important emphasis on the marketing and branding of the product, however
the pharmaceutical companies have not fully utilized this potential in differentiating
their products compared to the consumer goods or food sector. There has been some
research on the color of the pharmaceutical product and package to the customers’
perception and relating the same to sales. There is a gap in the research to use the
93
utility value of the package along with the form and color that gives the uniqueness to
formulate a competitive advantage.
2.6.3 Research gap - Pharmaceutical packaging - Design improvements
relevant to pharmaceutical packaging
The sustenance of the competitive advantage is possible when the value addition that
is identified and developed along with the uniqueness of the product package needs to
be designed in such a way that specific improvements can be done to cater to the
customers’ needs. Here the design improvements are looked at from the point of
innovative technology and the form and color of the package with reference to the
additional costs the customers can pay. Based on the customers’ needs the technology
should be so designed to support them. What are required for the designers are a clear
philosophy like an inclusive design and an approach like human factors in order to
develop user centered solutions meeting the customers’ needs. This has been done for
IT, engineering products, mobile phones etc. In the automobile sector its’ found that
design determines more than 75% of the cost and hence the improvement in design
represents an opportunity to decrease cost and increase the value. There are several
research studies on the improvement in the process of the drug manufacturing by
design changes in equipments. There have been studies on the pharmaceutical
package design improvements and the human factors involved however there is a gap
in the identification of the pharmaceutical type and its’ importance in design
improvement requirements for the pharmaceutical package based on the innovative
technologies and the form and color. Once identified the design improvements uses
technical methods that help the company to lead in competition and obtain above
average returns. These technological innovations drive the product service attributes
and extends the value chain. The ability to innovate develop and apply new
94
technologies is a critical determinant of the positioning for the product and the
company. The process of identifying the exact product and the specific technology
would sustain the company in the competition. The literature is not sufficient in this
identification of the product type that needs the technology improvements. Also the
degree of importance is not given in the literature surveyed.
2.6.4 Research gap - Pharmaceutical packaging - Strategic implications of
pharmaceutical packaging
The basic functions of packaging are for product identification and the safe delivery
to the ultimate end user. The strategic based functions are design related. This is
related to the innovative technologies and the form and color of the package. These
are reflected in the value or utility or the quality. Quality is the measure of the
customers’ awareness and perception. It is the business management of the customers’
beliefs on the quality that determines the strategy. As products are targeted to smaller
patient populations companies need to provide strategic value differentiation of their
product package. In the food industry study has been done on the influence of the
design process from the internal and external factors. This helps in new and better
solutions to the marketing strategy. Packaging has been a relatively unexplored
research area as compared to advertising, pricing and personal selling. Packaging
design based on innovative technologies has an influence on the perceived product
quality and there has been very few studies done using these variables. As the Indian
market has varied cultures the impact of the design along with the marketing mix
offered can offer strategic implications not only for the huge Indian market but also
for several global players.
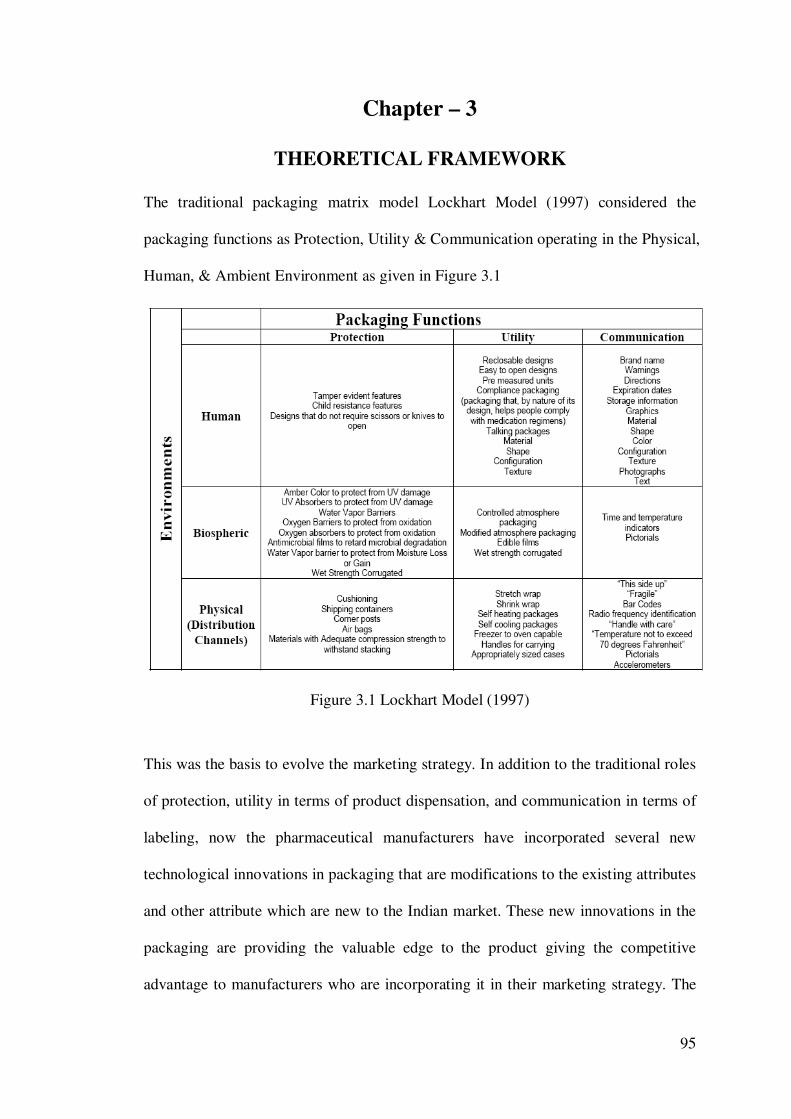
95
Chapter – 3
THEORETICAL FRAMEWORK
The traditional packaging matrix model Lockhart Model (1997) considered the
packaging functions as Protection, Utility & Communication operating in the Physical,
Human, & Ambient Environment as given in Figure 3.1
Figure 3.1 Lockhart Model (1997)
This was the basis to evolve the marketing strategy. In addition to the traditional roles
of protection, utility in terms of product dispensation, and communication in terms of
labeling, now the pharmaceutical manufacturers have incorporated several new
technological innovations in packaging that are modifications to the existing attributes
and other attribute which are new to the Indian market. These new innovations in the
packaging are providing the valuable edge to the product giving the competitive
advantage to manufacturers who are incorporating it in their marketing strategy. The
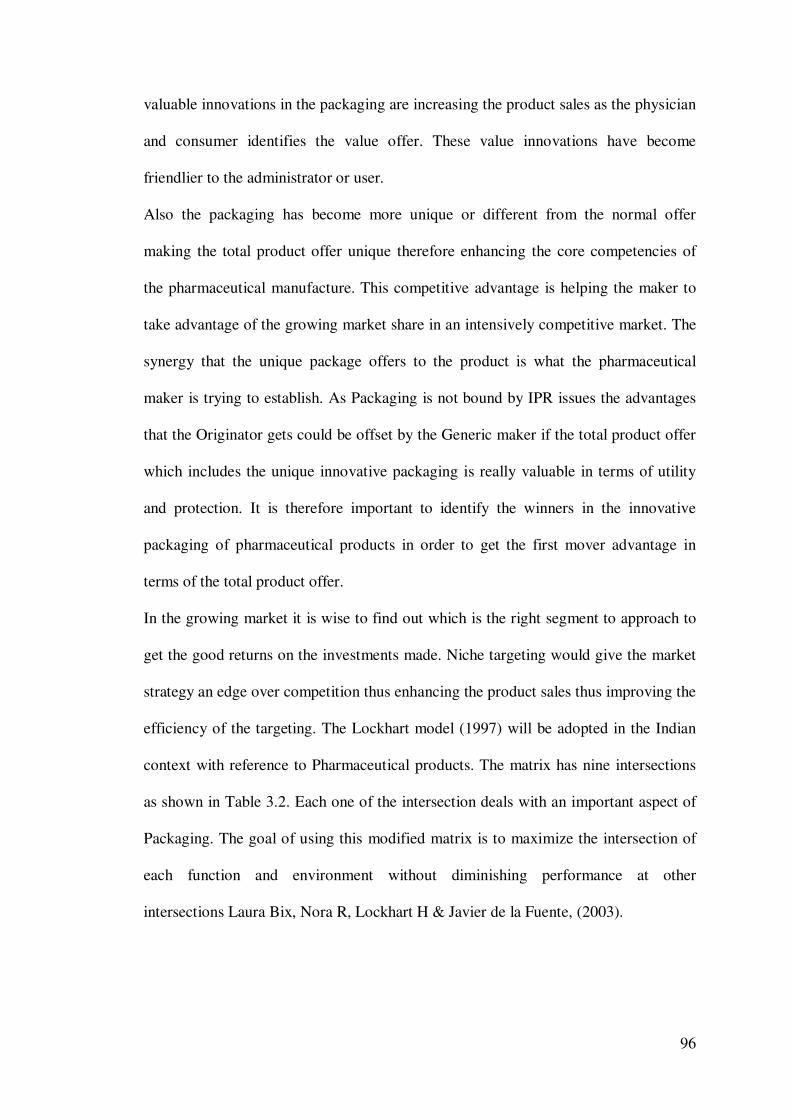
96
valuable innovations in the packaging are increasing the product sales as the physician
and consumer identifies the value offer. These value innovations have become
friendlier to the administrator or user.
Also the packaging has become more unique or different from the normal offer
making the total product offer unique therefore enhancing the core competencies of
the pharmaceutical manufacture. This competitive advantage is helping the maker to
take advantage of the growing market share in an intensively competitive market. The
synergy that the unique package offers to the product is what the pharmaceutical
maker is trying to establish. As Packaging is not bound by IPR issues the advantages
that the Originator gets could be offset by the Generic maker if the total product offer
which includes the unique innovative packaging is really valuable in terms of utility
and protection. It is therefore important to identify the winners in the innovative
packaging of pharmaceutical products in order to get the first mover advantage in
terms of the total product offer.
In the growing market it is wise to find out which is the right segment to approach to
get the good returns on the investments made. Niche targeting would give the market
strategy an edge over competition thus enhancing the product sales thus improving the
efficiency of the targeting. The Lockhart model (1997) will be adopted in the Indian
context with reference to Pharmaceutical products. The matrix has nine intersections
as shown in Table 3.2. Each one of the intersection deals with an important aspect of
Packaging. The goal of using this modified matrix is to maximize the intersection of
each function and environment without diminishing performance at other
intersections Laura Bix, Nora R, Lockhart H & Javier de la Fuente, (2003).
97
Figure 3.2 Lockhart Matrixes. (Source Lockhart Model 1997)
This model is a general and traditional one with the assumption that all the nine
quadrants are equally important. It is therefore difficult to evolve a strategy as it is
based on traditional information related to the Consumer Product. Looking at the
packaging environment (that is the three rows of the Lockhart Model) we can
conclude that
a) The Physical environment lies in the realm of the Physical and Engineering field.
b) The Biospheric environment lies in the realm of the Pure and Applied Sciences.
c) The Human environment lies in the realm of Management
This research would be looking at the Human environment and in specific to the
Utility function that is Intersection 9 in Table 3.2 of the Lockhart matrix as this deals
with the Management and hence the evolution of Strategy in respect to the package of
Pharmaceutical Products. It is this Utility value that would be the origin for the other
Functions in Packaging like Protection (Intersection 1) and Communication
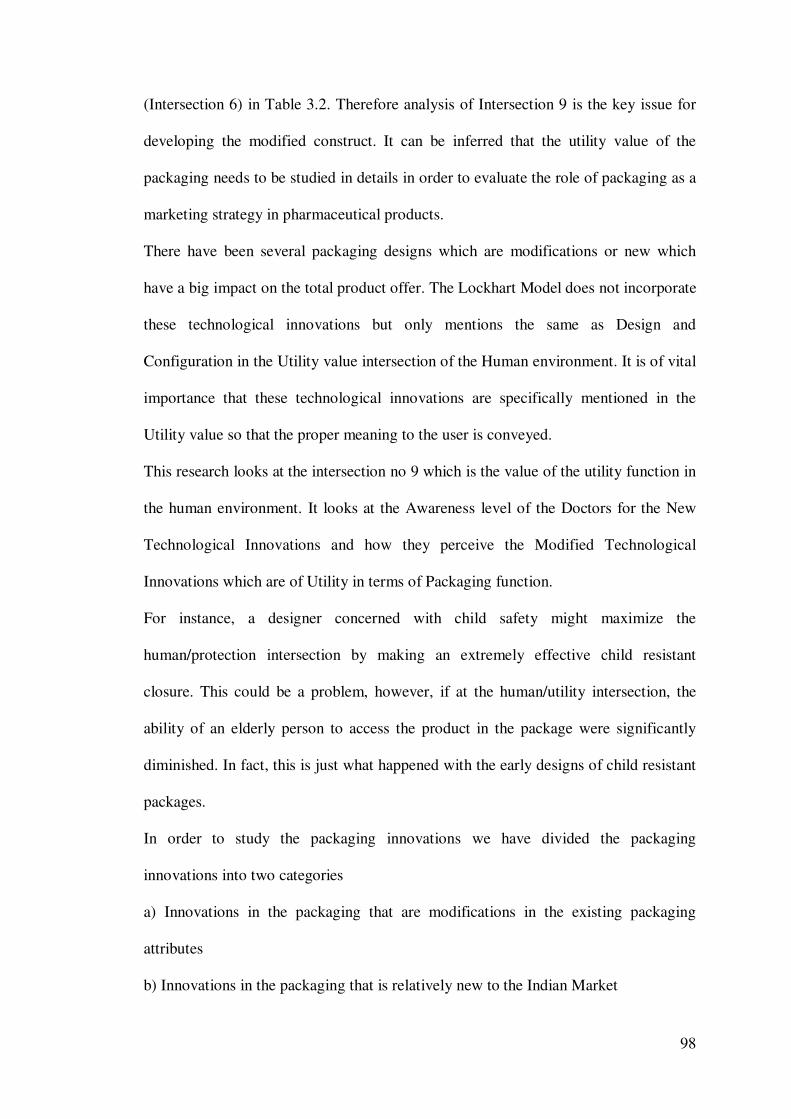
98
(Intersection 6) in Table 3.2. Therefore analysis of Intersection 9 is the key issue for
developing the modified construct. It can be inferred that the utility value of the
packaging needs to be studied in details in order to evaluate the role of packaging as a
marketing strategy in pharmaceutical products.
There have been several packaging designs which are modifications or new which
have a big impact on the total product offer. The Lockhart Model does not incorporate
these technological innovations but only mentions the same as Design and
Configuration in the Utility value intersection of the Human environment. It is of vital
importance that these technological innovations are specifically mentioned in the
Utility value so that the proper meaning to the user is conveyed.
This research looks at the intersection no 9 which is the value of the utility function in
the human environment. It looks at the Awareness level of the Doctors for the New
Technological Innovations and how they perceive the Modified Technological
Innovations which are of Utility in terms of Packaging function.
For instance, a designer concerned with child safety might maximize the
human/protection intersection by making an extremely effective child resistant
closure. This could be a problem, however, if at the human/utility intersection, the
ability of an elderly person to access the product in the package were significantly
diminished. In fact, this is just what happened with the early designs of child resistant
packages.
In order to study the packaging innovations we have divided the packaging
innovations into two categories
a) Innovations in the packaging that are modifications in the existing packaging
attributes
b) Innovations in the packaging that is relatively new to the Indian Market
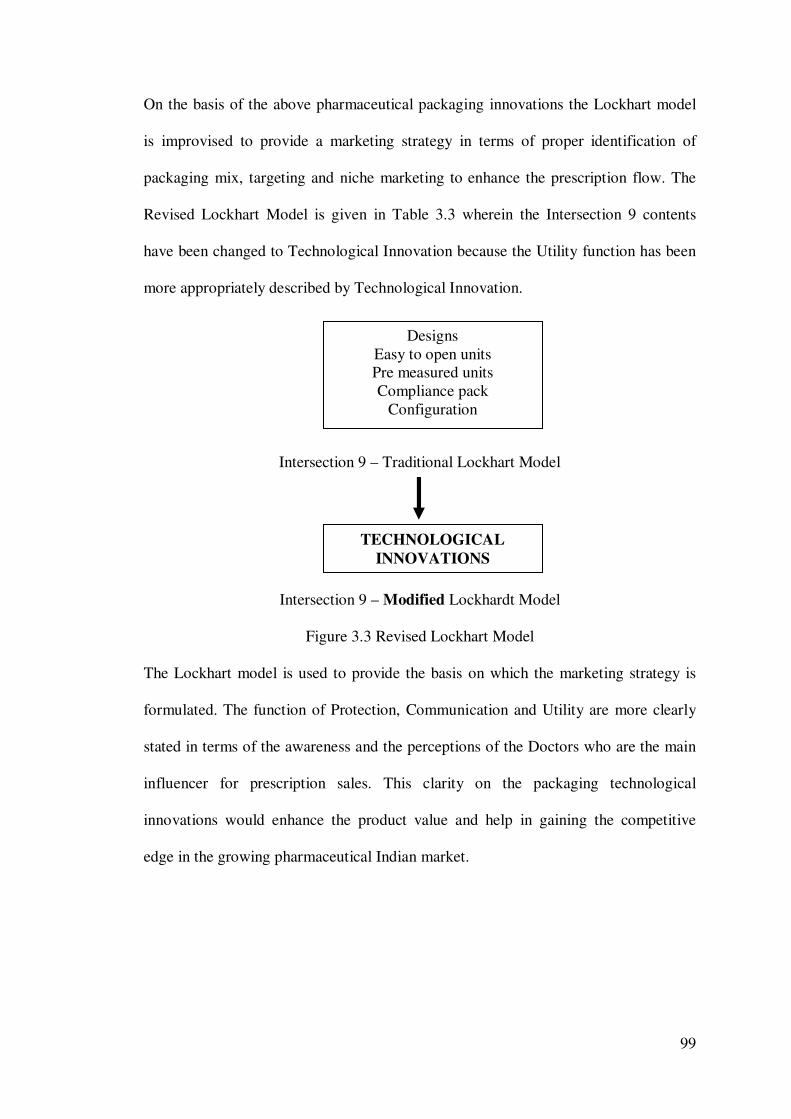
99
On the basis of the above pharmaceutical packaging innovations the Lockhart model
is improvised to provide a marketing strategy in terms of proper identification of
packaging mix, targeting and niche marketing to enhance the prescription flow. The
Revised Lockhart Model is given in Table 3.3 wherein the Intersection 9 contents
have been changed to Technological Innovation because the Utility function has been
more appropriately described by Technological Innovation.
Intersection 9 – Traditional Lockhart Model
Intersection 9 – Modified Lockhardt Model
Figure 3.3 Revised Lockhart Model
The Lockhart model is used to provide the basis on which the marketing strategy is
formulated. The function of Protection, Communication and Utility are more clearly
stated in terms of the awareness and the perceptions of the Doctors who are the main
influencer for prescription sales. This clarity on the packaging technological
innovations would enhance the product value and help in gaining the competitive
edge in the growing pharmaceutical Indian market.
Designs Easy to open units Pre measured units Compliance pack
Configuration
TECHNOLOGICAL
INNOVATIONS
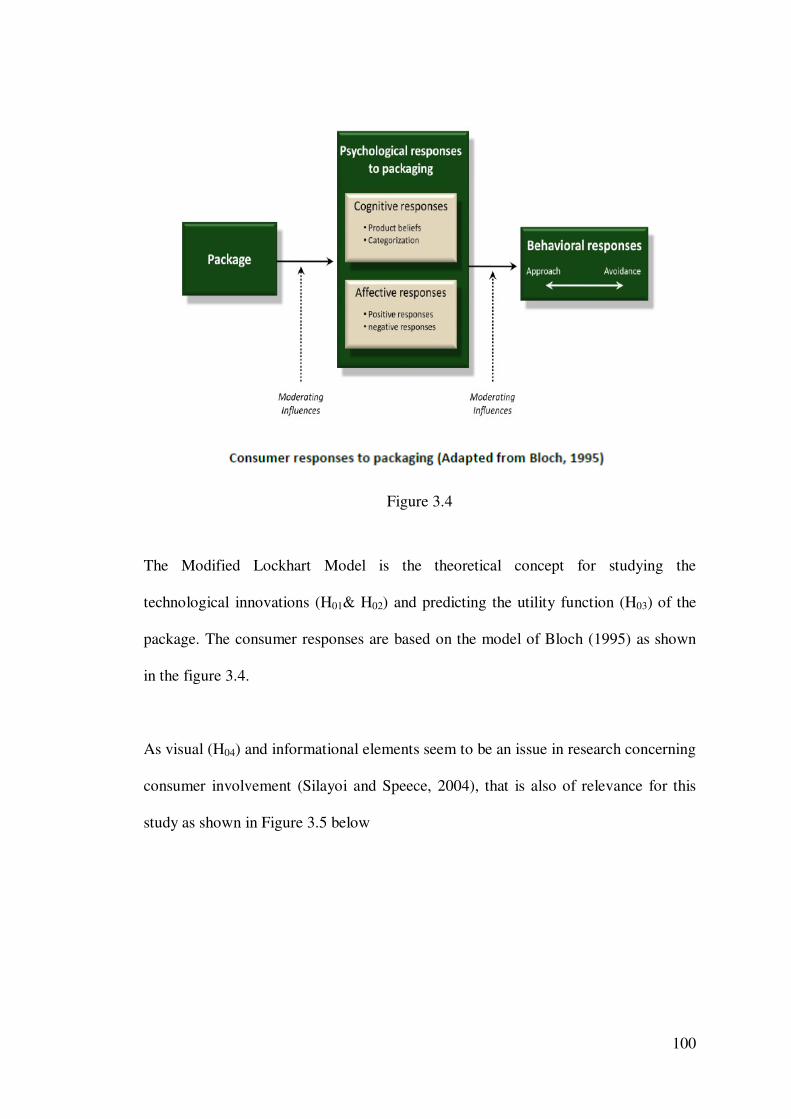
100
Figure 3.4
The Modified Lockhart Model is the theoretical concept for studying the
technological innovations (H01& H02) and predicting the utility function (H03) of the
package. The consumer responses are based on the model of Bloch (1995) as shown
in the figure 3.4.
As visual (H04) and informational elements seem to be an issue in research concerning
consumer involvement (Silayoi and Speece, 2004), that is also of relevance for this
study as shown in Figure 3.5 below
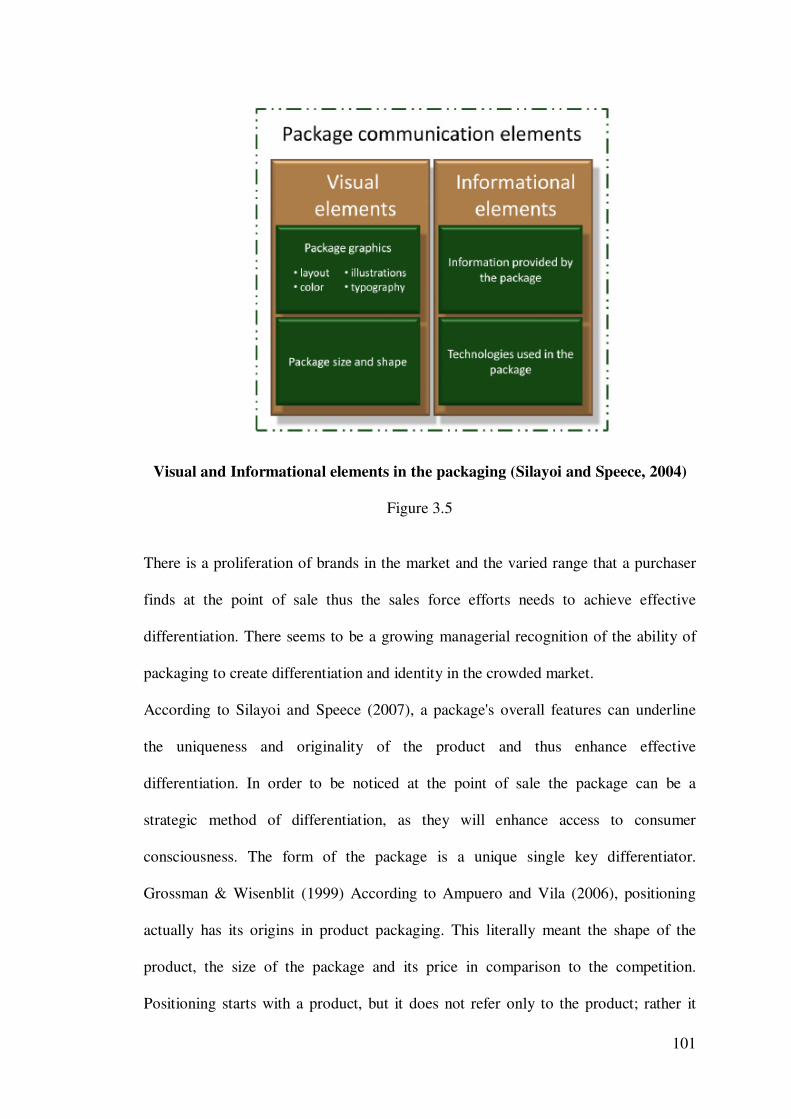
101
Visual and Informational elements in the packaging (Silayoi and Speece, 2004)
Figure 3.5
There is a proliferation of brands in the market and the varied range that a purchaser
finds at the point of sale thus the sales force efforts needs to achieve effective
differentiation. There seems to be a growing managerial recognition of the ability of
packaging to create differentiation and identity in the crowded market.
According to Silayoi and Speece (2007), a package's overall features can underline
the uniqueness and originality of the product and thus enhance effective
differentiation. In order to be noticed at the point of sale the package can be a
strategic method of differentiation, as they will enhance access to consumer
consciousness. The form of the package is a unique single key differentiator.
Grossman & Wisenblit (1999) According to Ampuero and Vila (2006), positioning
actually has its origins in product packaging. This literally meant the shape of the
product, the size of the package and its price in comparison to the competition.
Positioning starts with a product, but it does not refer only to the product; rather it
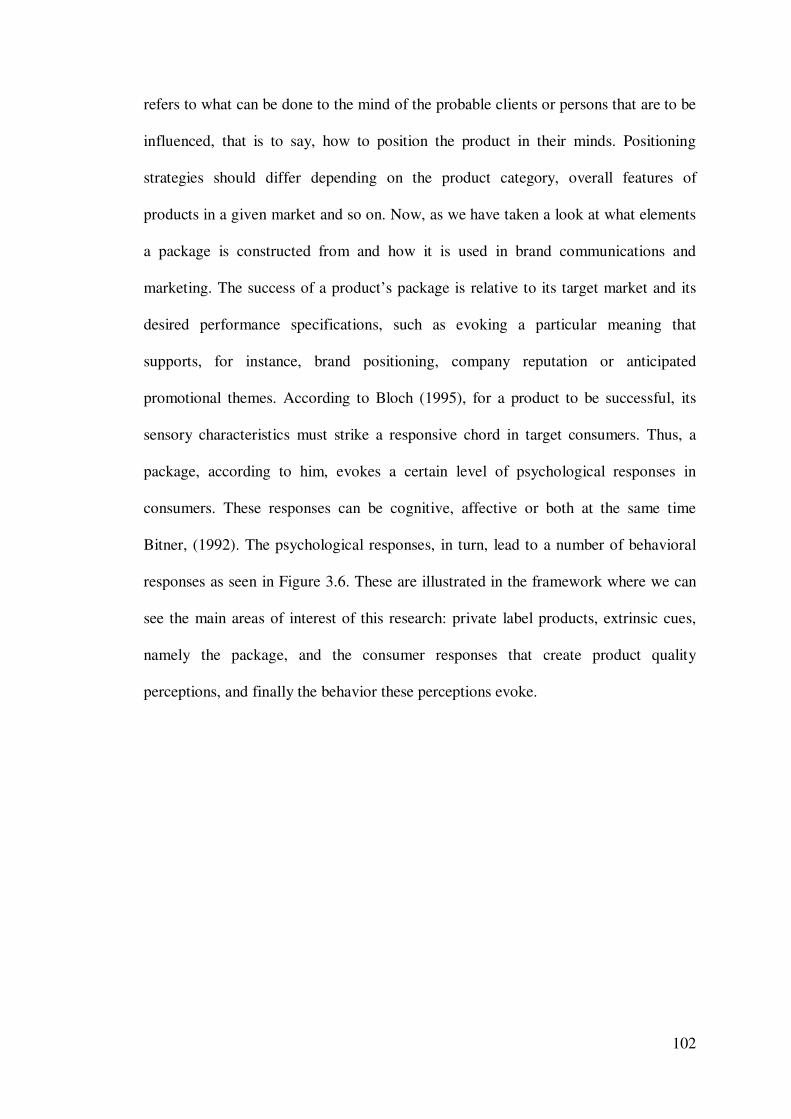
102
refers to what can be done to the mind of the probable clients or persons that are to be
influenced, that is to say, how to position the product in their minds. Positioning
strategies should differ depending on the product category, overall features of
products in a given market and so on. Now, as we have taken a look at what elements
a package is constructed from and how it is used in brand communications and
marketing. The success of a product’s package is relative to its target market and its
desired performance specifications, such as evoking a particular meaning that
supports, for instance, brand positioning, company reputation or anticipated
promotional themes. According to Bloch (1995), for a product to be successful, its
sensory characteristics must strike a responsive chord in target consumers. Thus, a
package, according to him, evokes a certain level of psychological responses in
consumers. These responses can be cognitive, affective or both at the same time
Bitner, (1992). The psychological responses, in turn, lead to a number of behavioral
responses as seen in Figure 3.6. These are illustrated in the framework where we can
see the main areas of interest of this research: private label products, extrinsic cues,
namely the package, and the consumer responses that create product quality
perceptions, and finally the behavior these perceptions evoke.
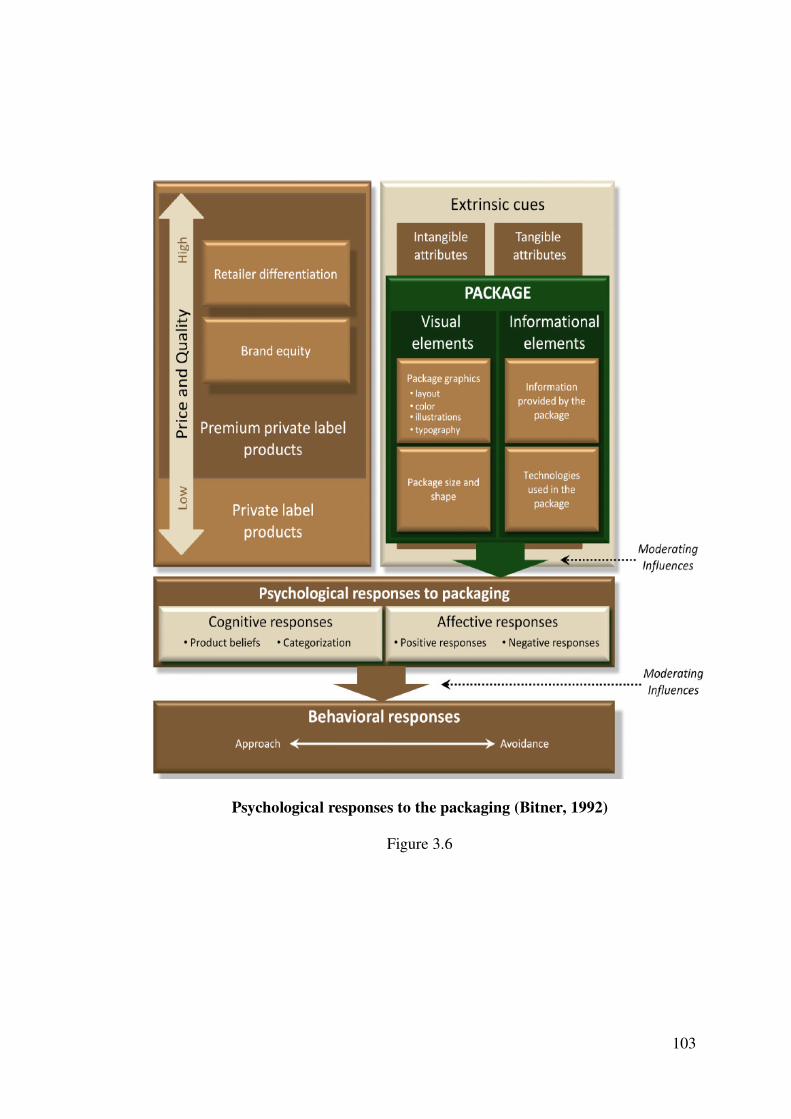
103
Psychological responses to the packaging (Bitner, 1992)
Figure 3.6
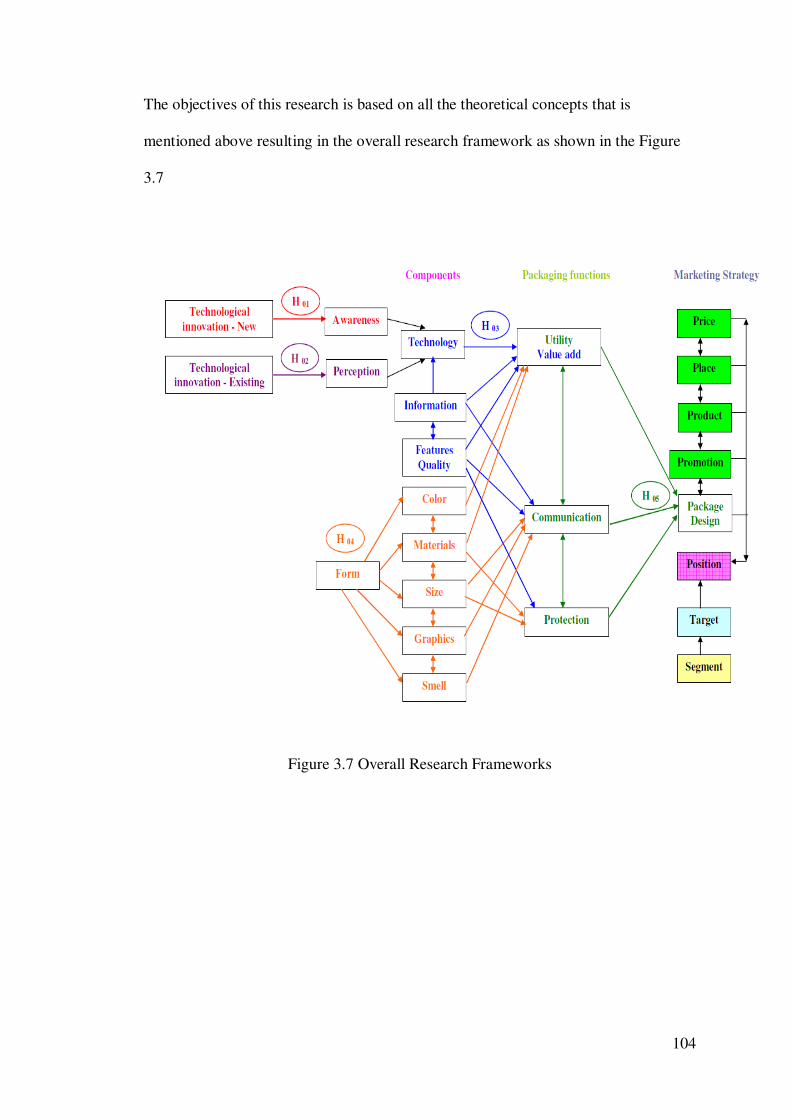
104
The objectives of this research is based on all the theoretical concepts that is
mentioned above resulting in the overall research framework as shown in the Figure
3.7
Figure 3.7 Overall Research Frameworks
105
Chapter – 4
OBJECTIVES, HYPOTHESIS &
RESEARCH METHODOLOGY
The literature survey showed nine different value adding technological innovations
that are available worldwide for the pharmaceutical packaging. These are categorized
into two types
A) Innovations that are modifications in the existing packaging for the Indian market,
like medication error avoidance - Berman A. (2004), ease of identification - George
Barrie Sep (2008), availability improvement - Jansen and Schelhove (1999), avoid
loss of precious drug - Kippen et al (2005) & administration of right dose - Peterson
G.M et al (1999)
B) Innovations in the packaging that is relatively new to the Indian Market, like child
resistance packaging - Arne Christensen et al (2007), compliance pack - Allan Wilson
(2002), bar coding / RFID - Lisa Pierce (2002) & friendly administer pack - Phil
Taylor. (2005), the other variable that describes the utility of the package is the color,
shape and texture. They affect both the doctors who prescribe and the customers who
used the medicine. These are further enhanced by the form & shape, design function
and quality of the package. These are the independent variables that explain the utility
or value of the package. The pharmaceutical customers are the doctors, patients and
traders. The doctors are further studied based on the location and specialization. The
patients are further studied based on the location and their gender. The various types
of pharmaceuticals studied are tablet, capsules, orals, injections and inhalers. The
design are based on the identified pharmaceutical packages available in the Indian
market
106
4.1 Objectives
The objectives are formulated as
1: To study the technological pharmaceutical packaging innovations available for the
Indian pharmaceutical customer.
2. To study the utility value of the packaging innovations for the Indian doctors
3. To study the effect of form and color of the pharmaceutical package on the Indian
pharmaceutical customers.
4. To study the design improvements for the various pharmaceutical types in the
Indian market among the pharmaceutical customers.
107
4.2 Hypothesis
The hypotheses based on the objectives are stated as:
H01: There is no difference in the awareness level among the Indian pharmaceutical
customers for the new innovative packaging attributes.
H11: There is difference in the awareness level among the Indian pharmaceutical
customers for the new innovative packaging attributes.
H02: There is no difference in the perception of importance among the Indian
pharmaceutical customers for the existing packaging attributes.
H12: There is difference in the perception of importance among the Indian
pharmaceutical customers for the existing packaging attributes.
H03: The utility value of the pharmaceutical package is not important in adding value
for the pharmaceutical customers.
H13: The utility value of the pharmaceutical package is important in adding value for
the pharmaceutical customers.
.
108
H04: The form and color of the pharmaceutical package has no influence or effect on
the pharmaceutical customers.
H14: The form and color of the pharmaceutical package has an influence or effect on
the pharmaceutical customers.
H05: The design improvements in the packaging for the various pharmaceutical types
are not important for the Indian pharmaceutical customers.
H15: The design improvements in the packaging for the various pharmaceutical types
are important for the Indian pharmaceutical customers.
109
4.3 Research Methodology
The research describes the relationship between the value or utility function of the
packaging of the pharmaceutical product and the innovative technology, form and
color of the package and the design of the package. The population is the doctors,
patients and retailers in India selected from the strata of the four metro cities in a
random manner. This is a descriptive study that uses a stratified random sampling.
The study identifies the innovative technologies in the packaging, its’ importance
along with the form and color and the ranking for design improvements needed so that
the proper targeting and position can be done to offer a value added product that is
strategically different and unique from the competitor.
Secondary data: Literature collected from various journals like Packaging Technology
and Science, Medical Marketing, Pharmacy World & Science, Consumer Policy,
Advertising, Consumer Research, Marketing communication, Social and
Administrative Pharmacy, Clinical Psychology, Psychiatry, Pharmacy Practice, Drug
Development Research, Product Innovations Management, Wine Business Research,
Food Quality and Preference, Product and Brand Management, Young consumers,
Market Research Society, Marketing Theory and Practice, Marketing, Marketing
Theory and Practice, Technology, Design Management, Consumer Marketing, Retail
& Distribution Management, Brand Management, Pharmaceutical Technology,
Human Factors and Ergonomics Society, Conferences on Pharmaceutical packaging
and labeling, IDS Packaging, Pharmacy World & Science.
The primary data was collected by the use of questionnaire to measure several
attributes related to the packaging matrix using the five point Likert scale would be
used. In case of finding out the interest in certain technology preference or
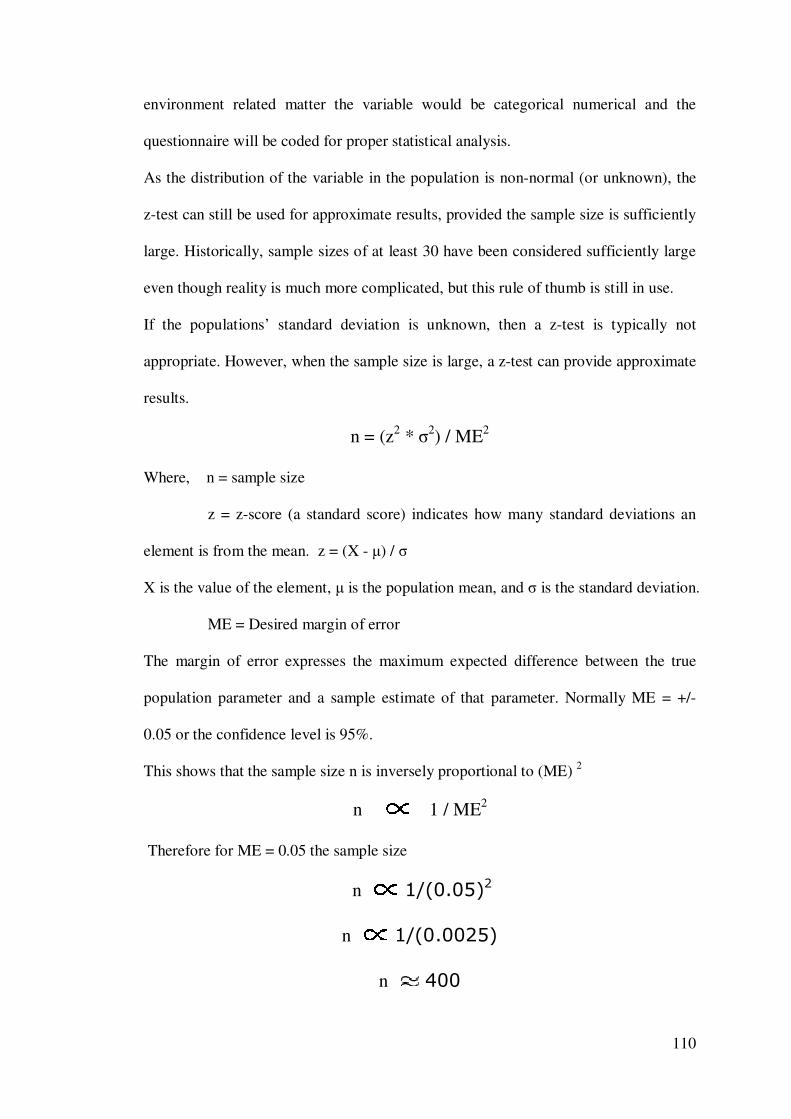
110
environment related matter the variable would be categorical numerical and the
questionnaire will be coded for proper statistical analysis.
As the distribution of the variable in the population is non-normal (or unknown), the
z-test can still be used for approximate results, provided the sample size is sufficiently
large. Historically, sample sizes of at least 30 have been considered sufficiently large
even though reality is much more complicated, but this rule of thumb is still in use.
If the populations’ standard deviation is unknown, then a z-test is typically not
appropriate. However, when the sample size is large, a z-test can provide approximate
results.
n = (z2 * σ2) / ME2
Where, n = sample size
z = z-score (a standard score) indicates how many standard deviations an
element is from the mean. z = (X - µ) / σ
X is the value of the element, µ is the population mean, and σ is the standard deviation.
ME = Desired margin of error
The margin of error expresses the maximum expected difference between the true
population parameter and a sample estimate of that parameter. Normally ME = +/-
0.05 or the confidence level is 95%.
This shows that the sample size n is inversely proportional to (ME) 2
n 1 / ME2
Therefore for ME = 0.05 the sample size
n 1/(0.05)2
n 1/(0.0025)
n 400
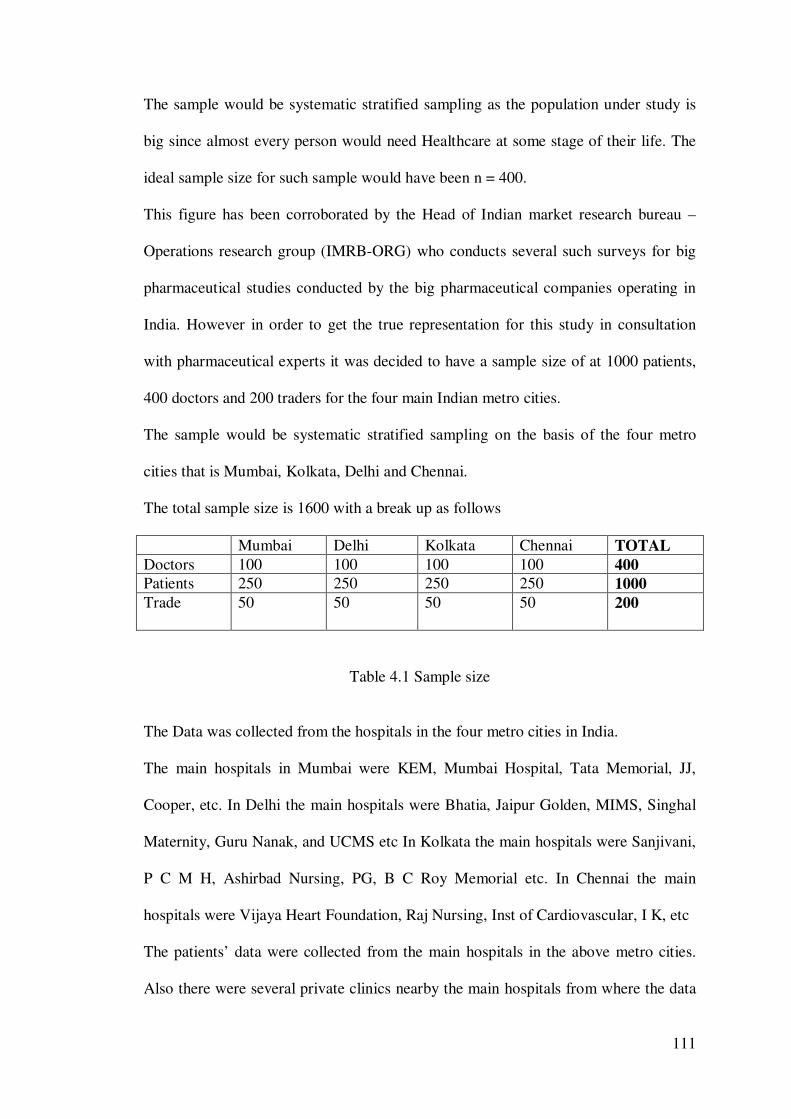
111
The sample would be systematic stratified sampling as the population under study is
big since almost every person would need Healthcare at some stage of their life. The
ideal sample size for such sample would have been n = 400.
This figure has been corroborated by the Head of Indian market research bureau –
Operations research group (IMRB-ORG) who conducts several such surveys for big
pharmaceutical studies conducted by the big pharmaceutical companies operating in
India. However in order to get the true representation for this study in consultation
with pharmaceutical experts it was decided to have a sample size of at 1000 patients,
400 doctors and 200 traders for the four main Indian metro cities.
The sample would be systematic stratified sampling on the basis of the four metro
cities that is Mumbai, Kolkata, Delhi and Chennai.
The total sample size is 1600 with a break up as follows
Mumbai Delhi Kolkata Chennai TOTAL
Doctors 100 100 100 100 400
Patients 250 250 250 250 1000
Trade 50 50 50 50 200
Table 4.1 Sample size
The Data was collected from the hospitals in the four metro cities in India.
The main hospitals in Mumbai were KEM, Mumbai Hospital, Tata Memorial, JJ,
Cooper, etc. In Delhi the main hospitals were Bhatia, Jaipur Golden, MIMS, Singhal
Maternity, Guru Nanak, and UCMS etc In Kolkata the main hospitals were Sanjivani,
P C M H, Ashirbad Nursing, PG, B C Roy Memorial etc. In Chennai the main
hospitals were Vijaya Heart Foundation, Raj Nursing, Inst of Cardiovascular, I K, etc
The patients’ data were collected from the main hospitals in the above metro cities.
Also there were several private clinics nearby the main hospitals from where the data
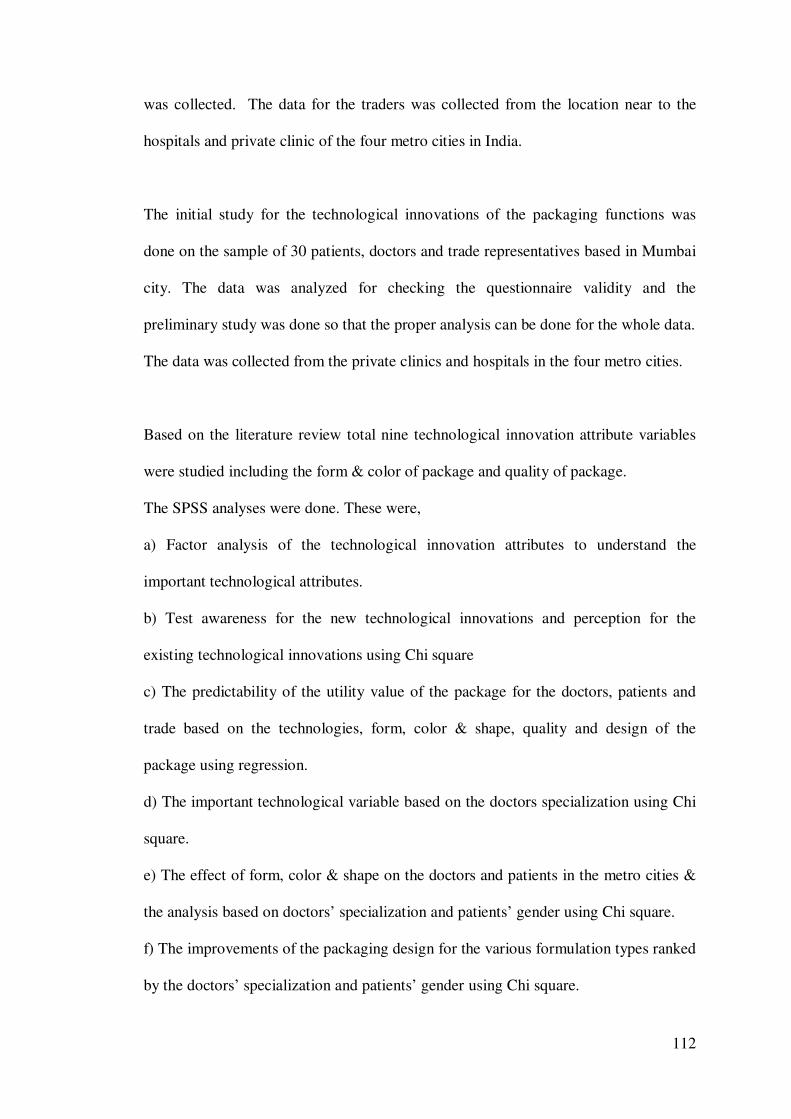
112
was collected. The data for the traders was collected from the location near to the
hospitals and private clinic of the four metro cities in India.
The initial study for the technological innovations of the packaging functions was
done on the sample of 30 patients, doctors and trade representatives based in Mumbai
city. The data was analyzed for checking the questionnaire validity and the
preliminary study was done so that the proper analysis can be done for the whole data.
The data was collected from the private clinics and hospitals in the four metro cities.
Based on the literature review total nine technological innovation attribute variables
were studied including the form & color of package and quality of package.
The SPSS analyses were done. These were,
a) Factor analysis of the technological innovation attributes to understand the
important technological attributes.
b) Test awareness for the new technological innovations and perception for the
existing technological innovations using Chi square
c) The predictability of the utility value of the package for the doctors, patients and
trade based on the technologies, form, color & shape, quality and design of the
package using regression.
d) The important technological variable based on the doctors specialization using Chi
square.
e) The effect of form, color & shape on the doctors and patients in the metro cities &
the analysis based on doctors’ specialization and patients’ gender using Chi square.
f) The improvements of the packaging design for the various formulation types ranked
by the doctors’ specialization and patients’ gender using Chi square.
113
Chapter – 5
RESULTS AND DISCUSSIONS
Statistical Package for the Social Sciences (SPSS) 17.0 was used for the data analysis.
The questions were coded and entered into SPSS. The variables were checked for
skewness and kurtosis and an Ln transformation was done as slight skewness was
noticed.
A total of 400 doctors were surveyed among the four metro cities in India. The
doctors profile details in terms of the general practitioners (GPs’) and specialists in
the four metro cities are shown in Table 5.1
Doctors
Metro City
Total Mumbai Delhi Kolkata Chennai
GPs’ 76 70 65 68 279
Specialists 24 30 35 32 121
TOTAL 100 100 100 100 400
Table 5.1 Doctors’ profile
Inference Table 5.1: The breakup of the 400 doctors surveyed is 279 GPs’ and 121
specialists that are analyzed in the study. The ratio of GP’s to specialists was
approximately 70:30
The details of the 121 specialists in the four metro cities are shown in Table 5.2
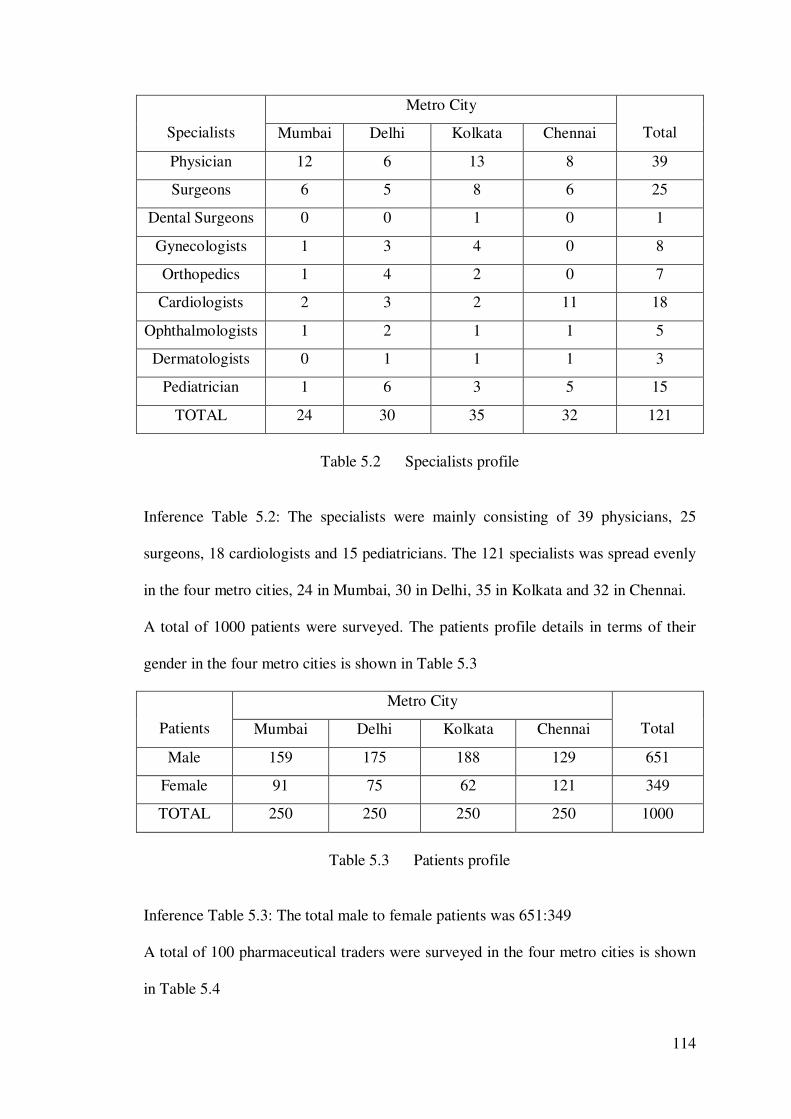
114
Specialists
Metro City
Total Mumbai Delhi Kolkata Chennai
Physician 12 6 13 8 39
Surgeons 6 5 8 6 25
Dental Surgeons 0 0 1 0 1
Gynecologists 1 3 4 0 8
Orthopedics 1 4 2 0 7
Cardiologists 2 3 2 11 18
Ophthalmologists 1 2 1 1 5
Dermatologists 0 1 1 1 3
Pediatrician 1 6 3 5 15
TOTAL 24 30 35 32 121
Table 5.2 Specialists profile
Inference Table 5.2: The specialists were mainly consisting of 39 physicians, 25
surgeons, 18 cardiologists and 15 pediatricians. The 121 specialists was spread evenly
in the four metro cities, 24 in Mumbai, 30 in Delhi, 35 in Kolkata and 32 in Chennai.
A total of 1000 patients were surveyed. The patients profile details in terms of their
gender in the four metro cities is shown in Table 5.3
Patients
Metro City
Total Mumbai Delhi Kolkata Chennai
Male 159 175 188 129 651
Female 91 75 62 121 349
TOTAL 250 250 250 250 1000
Table 5.3 Patients profile
Inference Table 5.3: The total male to female patients was 651:349
A total of 100 pharmaceutical traders were surveyed in the four metro cities is shown
in Table 5.4
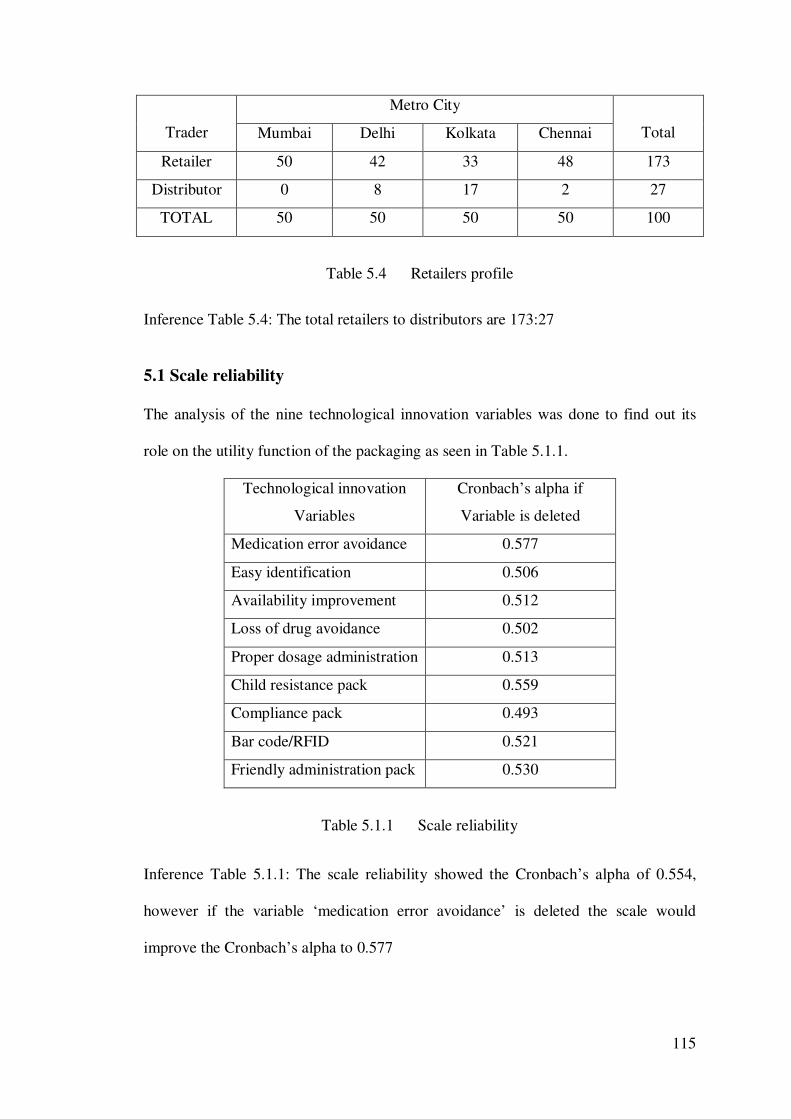
115
Trader
Metro City
Total Mumbai Delhi Kolkata Chennai
Retailer 50 42 33 48 173
Distributor 0 8 17 2 27
TOTAL 50 50 50 50 100
Table 5.4 Retailers profile
Inference Table 5.4: The total retailers to distributors are 173:27
5.1 Scale reliability
The analysis of the nine technological innovation variables was done to find out its
role on the utility function of the packaging as seen in Table 5.1.1.
Technological innovation
Variables
Cronbach’s alpha if
Variable is deleted
Medication error avoidance 0.577
Easy identification 0.506
Availability improvement 0.512
Loss of drug avoidance 0.502
Proper dosage administration 0.513
Child resistance pack 0.559
Compliance pack 0.493
Bar code/RFID 0.521
Friendly administration pack 0.530
Table 5.1.1 Scale reliability
Inference Table 5.1.1: The scale reliability showed the Cronbach’s alpha of 0.554,
however if the variable ‘medication error avoidance’ is deleted the scale would
improve the Cronbach’s alpha to 0.577
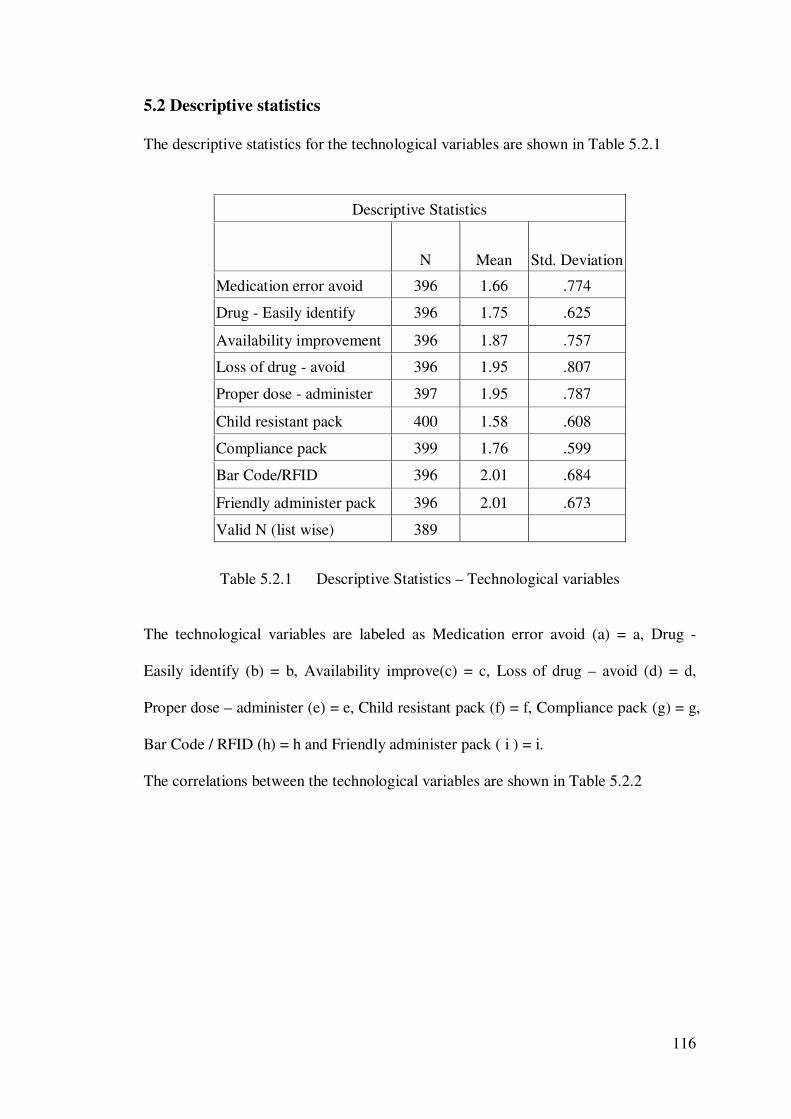
116
5.2 Descriptive statistics
The descriptive statistics for the technological variables are shown in Table 5.2.1
Descriptive Statistics
N Mean Std. Deviation
Medication error avoid 396 1.66 .774
Drug - Easily identify 396 1.75 .625
Availability improvement 396 1.87 .757
Loss of drug - avoid 396 1.95 .807
Proper dose - administer 397 1.95 .787
Child resistant pack 400 1.58 .608
Compliance pack 399 1.76 .599
Bar Code/RFID 396 2.01 .684
Friendly administer pack 396 2.01 .673
Valid N (list wise) 389
Table 5.2.1 Descriptive Statistics – Technological variables
The technological variables are labeled as Medication error avoid (a) = a, Drug -
Easily identify (b) = b, Availability improve(c) = c, Loss of drug – avoid (d) = d,
Proper dose – administer (e) = e, Child resistant pack (f) = f, Compliance pack (g) = g,
Bar Code / RFID (h) = h and Friendly administer pack ( i ) = i.
The correlations between the technological variables are shown in Table 5.2.2
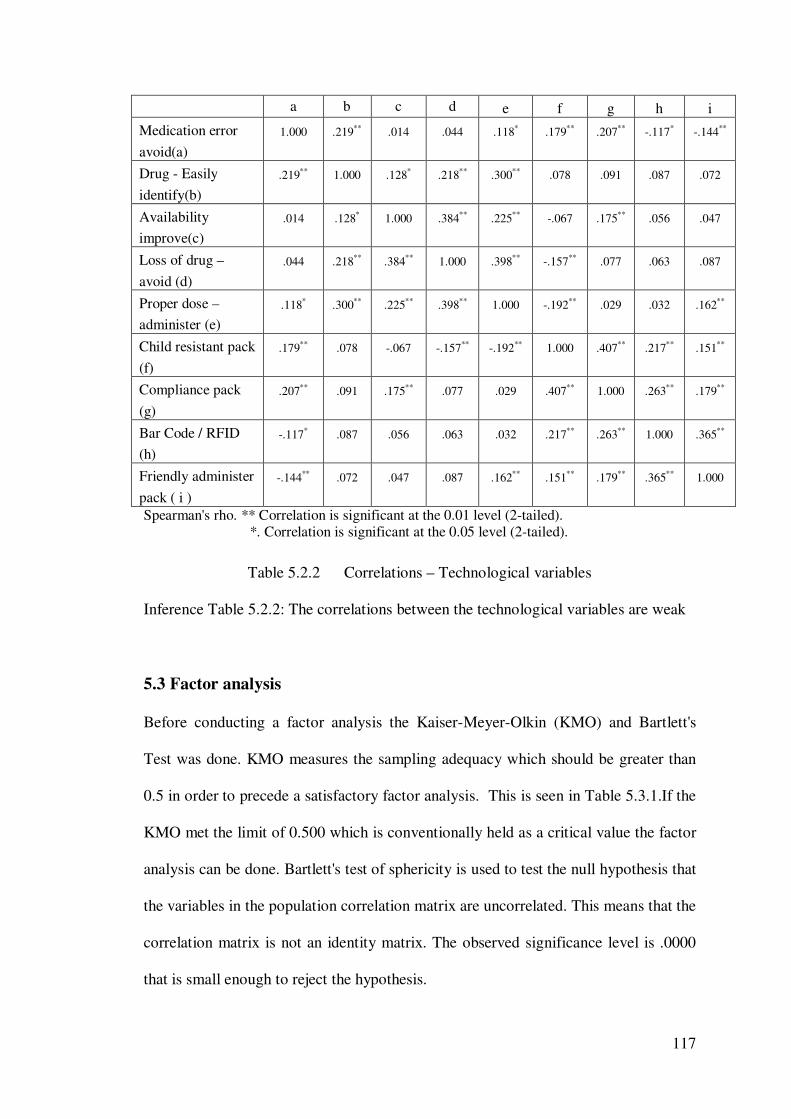
117
a b c d e f g h i
Medication error
avoid(a)
1.000 .219** .014 .044 .118* .179** .207** -.117* -.144**
Drug - Easily
identify(b)
.219** 1.000 .128* .218** .300** .078 .091 .087 .072
Availability
improve(c)
.014 .128* 1.000 .384** .225** -.067 .175** .056 .047
Loss of drug –
avoid (d)
.044 .218** .384** 1.000 .398** -.157** .077 .063 .087
Proper dose –
administer (e)
.118* .300** .225** .398** 1.000 -.192** .029 .032 .162**
Child resistant pack
(f)
.179** .078 -.067 -.157** -.192** 1.000 .407** .217** .151**
Compliance pack
(g)
.207** .091 .175** .077 .029 .407** 1.000 .263** .179**
Bar Code / RFID
(h)
-.117* .087 .056 .063 .032 .217** .263** 1.000 .365**
Friendly administer
pack ( i )
-.144** .072 .047 .087 .162** .151** .179** .365** 1.000
Spearman's rho. ** Correlation is significant at the 0.01 level (2-tailed). *. Correlation is significant at the 0.05 level (2-tailed).
Table 5.2.2 Correlations – Technological variables
Inference Table 5.2.2: The correlations between the technological variables are weak
5.3 Factor analysis
Before conducting a factor analysis the Kaiser-Meyer-Olkin (KMO) and Bartlett's
Test was done. KMO measures the sampling adequacy which should be greater than
0.5 in order to precede a satisfactory factor analysis. This is seen in Table 5.3.1.If the
KMO met the limit of 0.500 which is conventionally held as a critical value the factor
analysis can be done. Bartlett's test of sphericity is used to test the null hypothesis that
the variables in the population correlation matrix are uncorrelated. This means that the
correlation matrix is not an identity matrix. The observed significance level is .0000
that is small enough to reject the hypothesis.
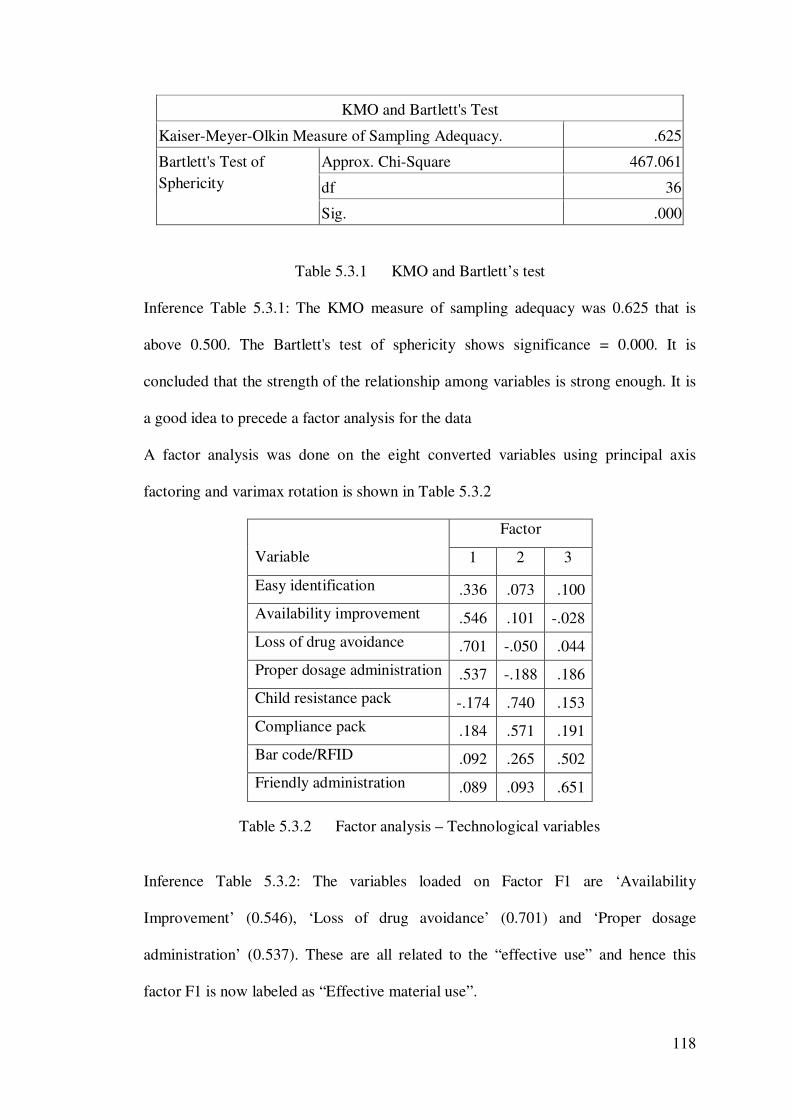
118
KMO and Bartlett's Test
Kaiser-Meyer-Olkin Measure of Sampling Adequacy. .625
Bartlett's Test of Sphericity
Approx. Chi-Square 467.061
df 36
Sig. .000
Table 5.3.1 KMO and Bartlett’s test
Inference Table 5.3.1: The KMO measure of sampling adequacy was 0.625 that is
above 0.500. The Bartlett's test of sphericity shows significance = 0.000. It is
concluded that the strength of the relationship among variables is strong enough. It is
a good idea to precede a factor analysis for the data
A factor analysis was done on the eight converted variables using principal axis
factoring and varimax rotation is shown in Table 5.3.2
Variable
Factor
1 2 3
Easy identification .336 .073 .100
Availability improvement .546 .101 -.028
Loss of drug avoidance .701 -.050 .044
Proper dosage administration .537 -.188 .186
Child resistance pack -.174 .740 .153
Compliance pack .184 .571 .191
Bar code/RFID .092 .265 .502
Friendly administration .089 .093 .651
Table 5.3.2 Factor analysis – Technological variables
Inference Table 5.3.2: The variables loaded on Factor F1 are ‘Availability
Improvement’ (0.546), ‘Loss of drug avoidance’ (0.701) and ‘Proper dosage
administration’ (0.537). These are all related to the “effective use” and hence this
factor F1 is now labeled as “Effective material use”.
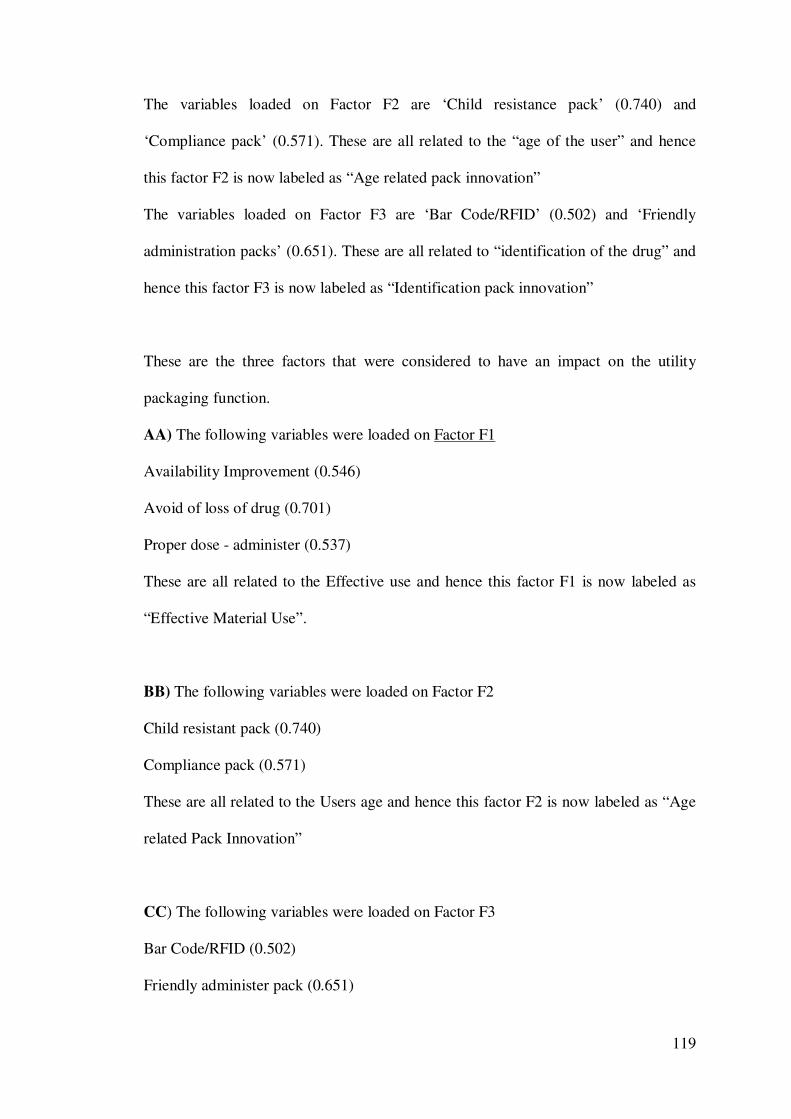
119
The variables loaded on Factor F2 are ‘Child resistance pack’ (0.740) and
‘Compliance pack’ (0.571). These are all related to the “age of the user” and hence
this factor F2 is now labeled as “Age related pack innovation”
The variables loaded on Factor F3 are ‘Bar Code/RFID’ (0.502) and ‘Friendly
administration packs’ (0.651). These are all related to “identification of the drug” and
hence this factor F3 is now labeled as “Identification pack innovation”
These are the three factors that were considered to have an impact on the utility
packaging function.
AA) The following variables were loaded on Factor F1
Availability Improvement (0.546)
Avoid of loss of drug (0.701)
Proper dose - administer (0.537)
These are all related to the Effective use and hence this factor F1 is now labeled as
“Effective Material Use”.
BB) The following variables were loaded on Factor F2
Child resistant pack (0.740)
Compliance pack (0.571)
These are all related to the Users age and hence this factor F2 is now labeled as “Age
related Pack Innovation”
CC) The following variables were loaded on Factor F3
Bar Code/RFID (0.502)
Friendly administer pack (0.651)
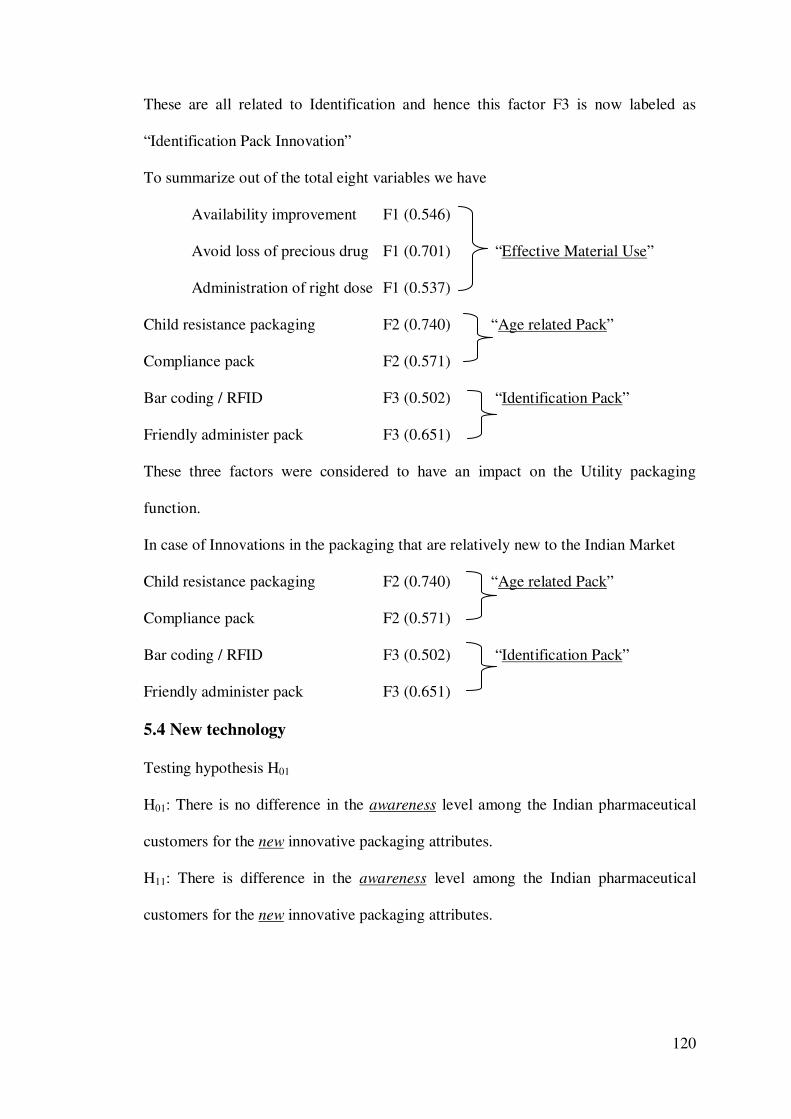
120
These are all related to Identification and hence this factor F3 is now labeled as
“Identification Pack Innovation”
To summarize out of the total eight variables we have
Availability improvement F1 (0.546)
Avoid loss of precious drug F1 (0.701) “Effective Material Use”
Administration of right dose F1 (0.537)
Child resistance packaging F2 (0.740) “Age related Pack”
Compliance pack F2 (0.571)
Bar coding / RFID F3 (0.502) “Identification Pack”
Friendly administer pack F3 (0.651)
These three factors were considered to have an impact on the Utility packaging
function.
In case of Innovations in the packaging that are relatively new to the Indian Market
Child resistance packaging F2 (0.740) “Age related Pack”
Compliance pack F2 (0.571)
Bar coding / RFID F3 (0.502) “Identification Pack”
Friendly administer pack F3 (0.651)
5.4 New technology
Testing hypothesis H01
H01: There is no difference in the awareness level among the Indian pharmaceutical
customers for the new innovative packaging attributes.
H11: There is difference in the awareness level among the Indian pharmaceutical
customers for the new innovative packaging attributes.
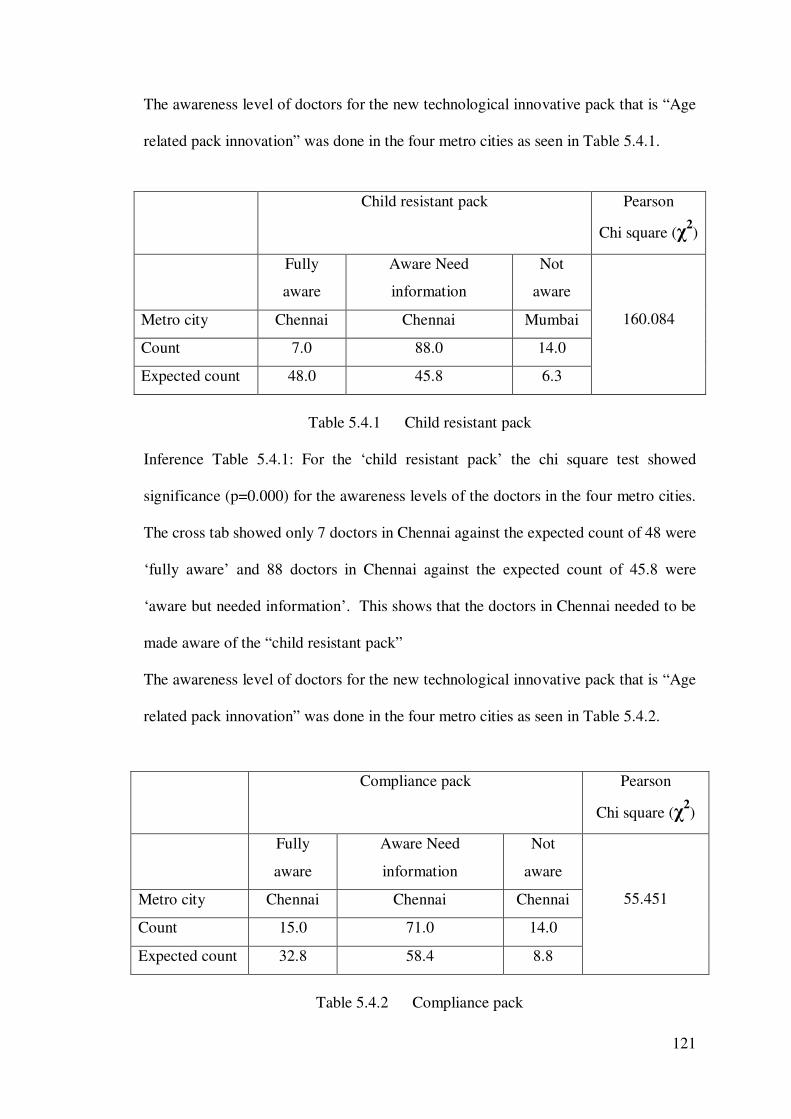
121
The awareness level of doctors for the new technological innovative pack that is “Age
related pack innovation” was done in the four metro cities as seen in Table 5.4.1.
Child resistant pack Pearson
Chi square (χ2)
Fully
aware
Aware Need
information
Not
aware
160.084 Metro city Chennai Chennai Mumbai
Count 7.0 88.0 14.0
Expected count 48.0 45.8 6.3
Table 5.4.1 Child resistant pack
Inference Table 5.4.1: For the ‘child resistant pack’ the chi square test showed
significance (p=0.000) for the awareness levels of the doctors in the four metro cities.
The cross tab showed only 7 doctors in Chennai against the expected count of 48 were
‘fully aware’ and 88 doctors in Chennai against the expected count of 45.8 were
‘aware but needed information’. This shows that the doctors in Chennai needed to be
made aware of the “child resistant pack”
The awareness level of doctors for the new technological innovative pack that is “Age
related pack innovation” was done in the four metro cities as seen in Table 5.4.2.
Compliance pack Pearson
Chi square (χ2)
Fully
aware
Aware Need
information
Not
aware
55.451 Metro city Chennai Chennai Chennai
Count 15.0 71.0 14.0
Expected count 32.8 58.4 8.8
Table 5.4.2 Compliance pack
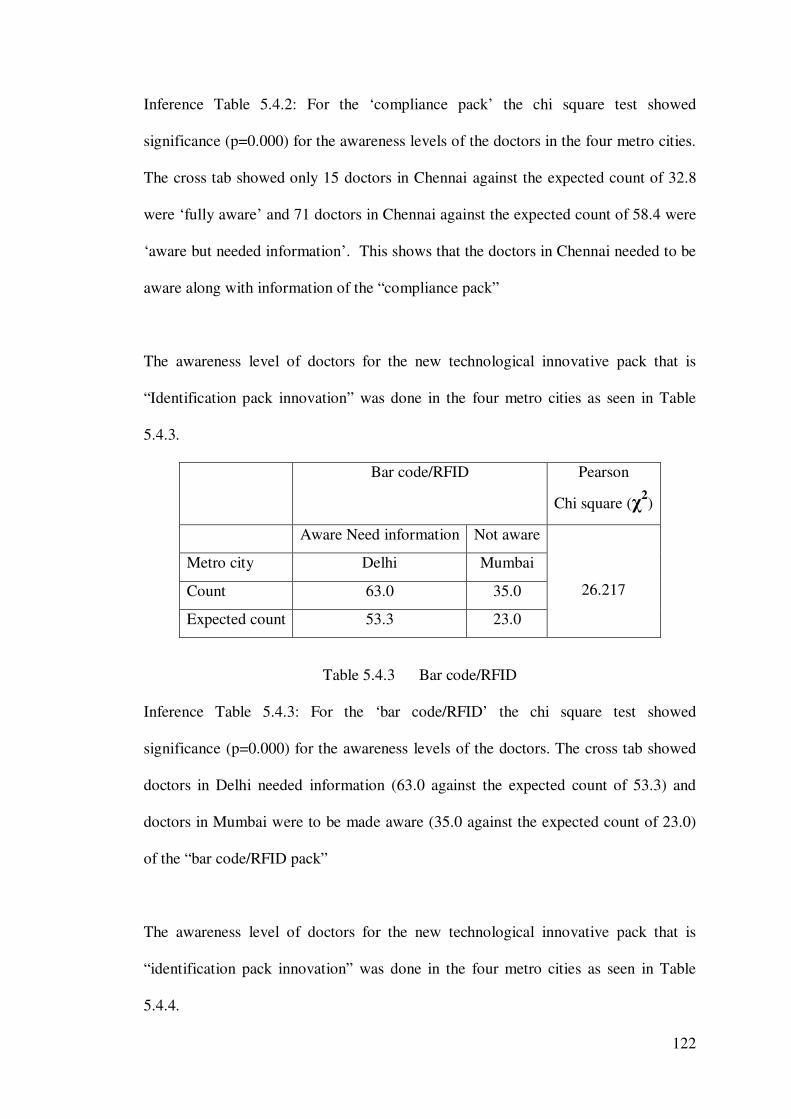
122
Inference Table 5.4.2: For the ‘compliance pack’ the chi square test showed
significance (p=0.000) for the awareness levels of the doctors in the four metro cities.
The cross tab showed only 15 doctors in Chennai against the expected count of 32.8
were ‘fully aware’ and 71 doctors in Chennai against the expected count of 58.4 were
‘aware but needed information’. This shows that the doctors in Chennai needed to be
aware along with information of the “compliance pack”
The awareness level of doctors for the new technological innovative pack that is
“Identification pack innovation” was done in the four metro cities as seen in Table
5.4.3.
Bar code/RFID Pearson
Chi square (χ2)
Aware Need information Not aware
26.217
Metro city Delhi Mumbai
Count 63.0 35.0
Expected count 53.3 23.0
Table 5.4.3 Bar code/RFID
Inference Table 5.4.3: For the ‘bar code/RFID’ the chi square test showed
significance (p=0.000) for the awareness levels of the doctors. The cross tab showed
doctors in Delhi needed information (63.0 against the expected count of 53.3) and
doctors in Mumbai were to be made aware (35.0 against the expected count of 23.0)
of the “bar code/RFID pack”
The awareness level of doctors for the new technological innovative pack that is
“identification pack innovation” was done in the four metro cities as seen in Table
5.4.4.
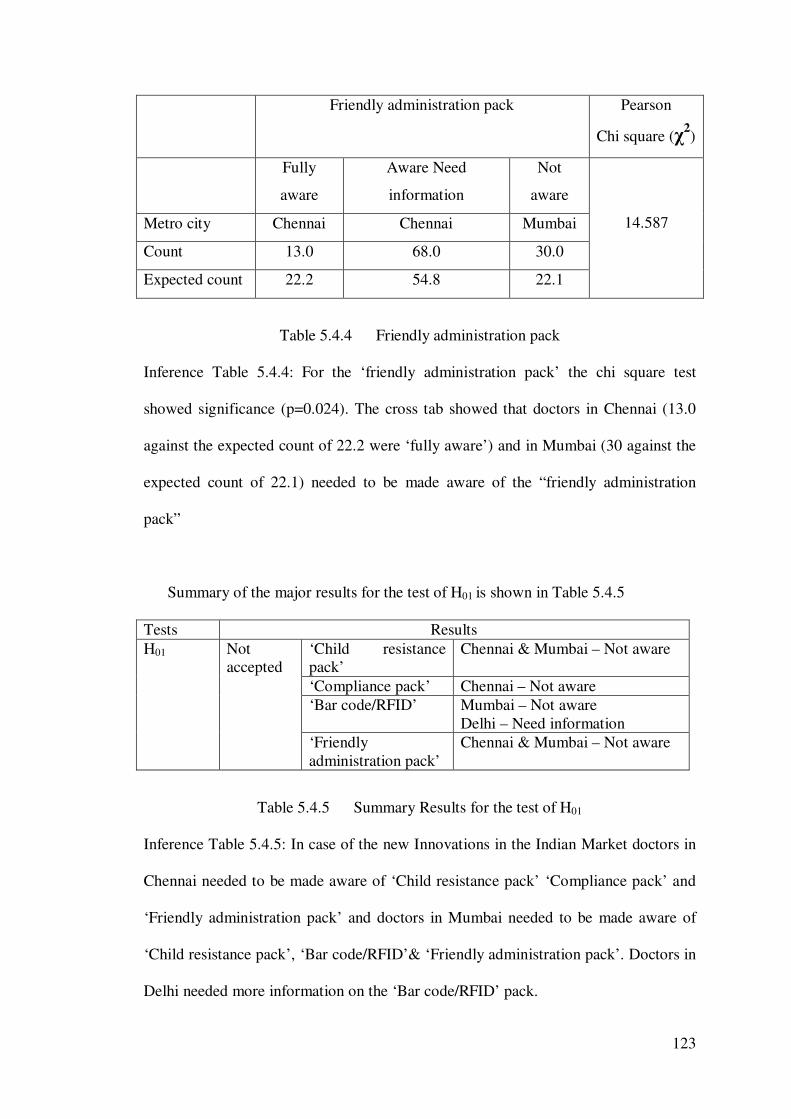
123
Friendly administration pack Pearson
Chi square (χ2)
Fully
aware
Aware Need
information
Not
aware
14.587 Metro city Chennai Chennai Mumbai
Count 13.0 68.0 30.0
Expected count 22.2 54.8 22.1
Table 5.4.4 Friendly administration pack
Inference Table 5.4.4: For the ‘friendly administration pack’ the chi square test
showed significance (p=0.024). The cross tab showed that doctors in Chennai (13.0
against the expected count of 22.2 were ‘fully aware’) and in Mumbai (30 against the
expected count of 22.1) needed to be made aware of the “friendly administration
pack”
Summary of the major results for the test of H01 is shown in Table 5.4.5
Tests Results H01 Not
accepted ‘Child resistance pack’
Chennai & Mumbai – Not aware
‘Compliance pack’ Chennai – Not aware ‘Bar code/RFID’ Mumbai – Not aware
Delhi – Need information ‘Friendly administration pack’
Chennai & Mumbai – Not aware
Table 5.4.5 Summary Results for the test of H01
Inference Table 5.4.5: In case of the new Innovations in the Indian Market doctors in
Chennai needed to be made aware of ‘Child resistance pack’ ‘Compliance pack’ and
‘Friendly administration pack’ and doctors in Mumbai needed to be made aware of
‘Child resistance pack’, ‘Bar code/RFID’& ‘Friendly administration pack’. Doctors in
Delhi needed more information on the ‘Bar code/RFID’ pack.
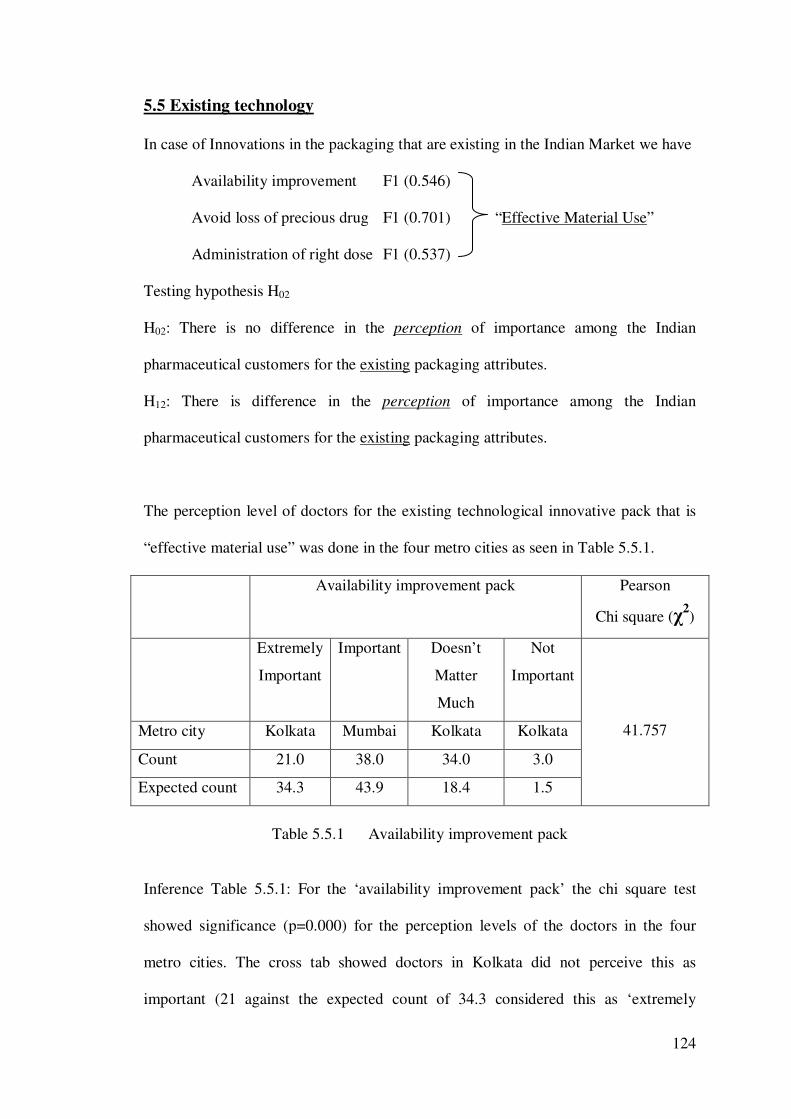
124
5.5 Existing technology
In case of Innovations in the packaging that are existing in the Indian Market we have
Availability improvement F1 (0.546)
Avoid loss of precious drug F1 (0.701) “Effective Material Use”
Administration of right dose F1 (0.537)
Testing hypothesis H02
H02: There is no difference in the perception of importance among the Indian
pharmaceutical customers for the existing packaging attributes.
H12: There is difference in the perception of importance among the Indian
pharmaceutical customers for the existing packaging attributes.
The perception level of doctors for the existing technological innovative pack that is
“effective material use” was done in the four metro cities as seen in Table 5.5.1.
Availability improvement pack Pearson
Chi square (χ2)
Extremely
Important
Important Doesn’t
Matter
Much
Not
Important
41.757 Metro city Kolkata Mumbai Kolkata Kolkata
Count 21.0 38.0 34.0 3.0
Expected count 34.3 43.9 18.4 1.5
Table 5.5.1 Availability improvement pack
Inference Table 5.5.1: For the ‘availability improvement pack’ the chi square test
showed significance (p=0.000) for the perception levels of the doctors in the four
metro cities. The cross tab showed doctors in Kolkata did not perceive this as
important (21 against the expected count of 34.3 considered this as ‘extremely
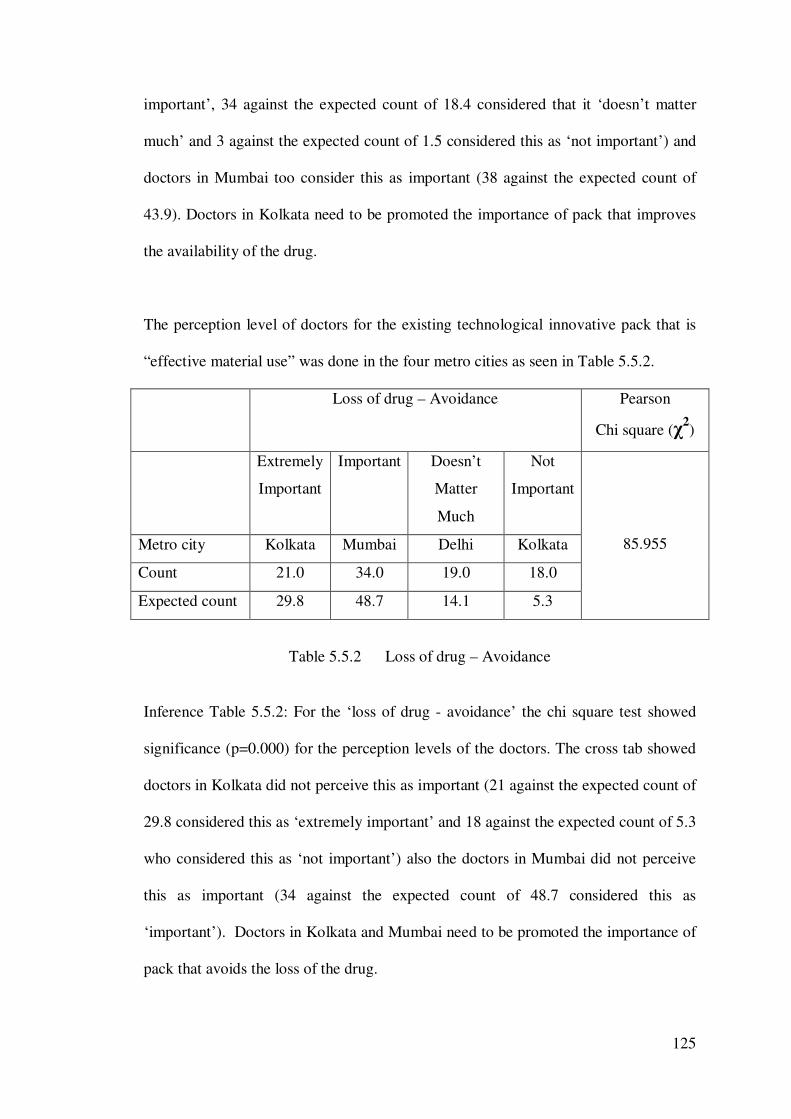
125
important’, 34 against the expected count of 18.4 considered that it ‘doesn’t matter
much’ and 3 against the expected count of 1.5 considered this as ‘not important’) and
doctors in Mumbai too consider this as important (38 against the expected count of
43.9). Doctors in Kolkata need to be promoted the importance of pack that improves
the availability of the drug.
The perception level of doctors for the existing technological innovative pack that is
“effective material use” was done in the four metro cities as seen in Table 5.5.2.
Loss of drug – Avoidance Pearson
Chi square (χ2)
Extremely
Important
Important Doesn’t
Matter
Much
Not
Important
85.955 Metro city Kolkata Mumbai Delhi Kolkata
Count 21.0 34.0 19.0 18.0
Expected count 29.8 48.7 14.1 5.3
Table 5.5.2 Loss of drug – Avoidance
Inference Table 5.5.2: For the ‘loss of drug - avoidance’ the chi square test showed
significance (p=0.000) for the perception levels of the doctors. The cross tab showed
doctors in Kolkata did not perceive this as important (21 against the expected count of
29.8 considered this as ‘extremely important’ and 18 against the expected count of 5.3
who considered this as ‘not important’) also the doctors in Mumbai did not perceive
this as important (34 against the expected count of 48.7 considered this as
‘important’). Doctors in Kolkata and Mumbai need to be promoted the importance of
pack that avoids the loss of the drug.
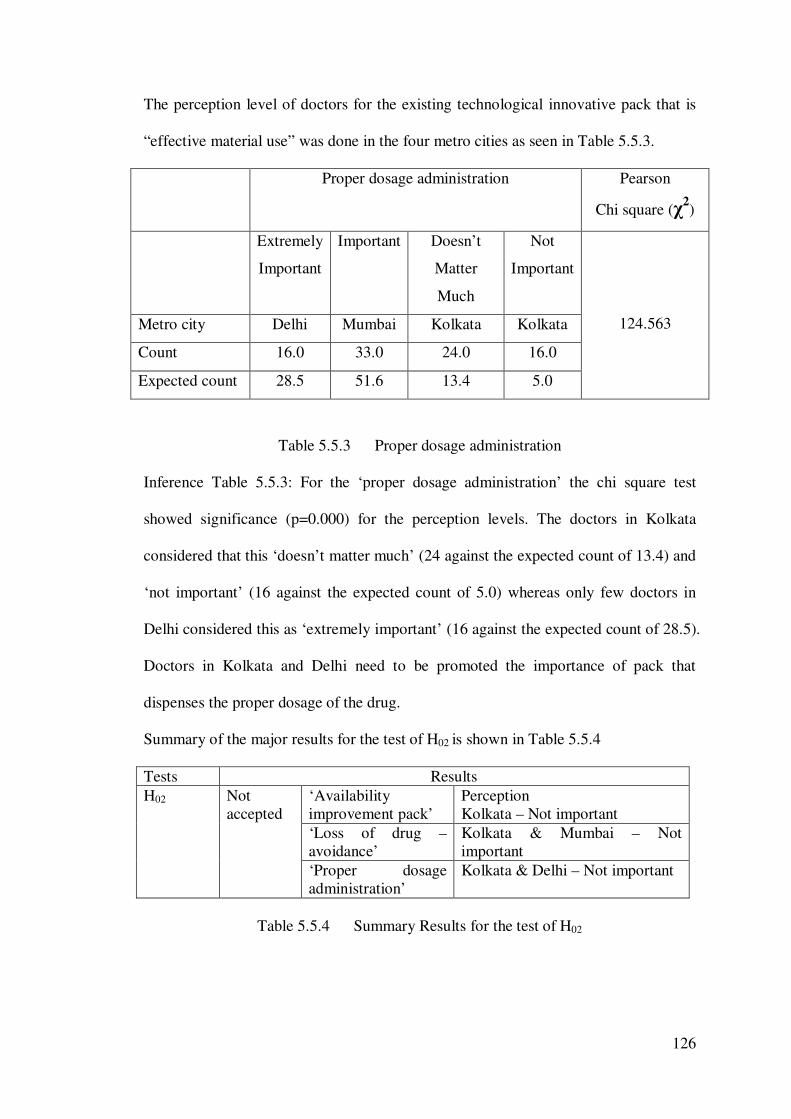
126
The perception level of doctors for the existing technological innovative pack that is
“effective material use” was done in the four metro cities as seen in Table 5.5.3.
Proper dosage administration Pearson
Chi square (χ2)
Extremely
Important
Important Doesn’t
Matter
Much
Not
Important
124.563 Metro city Delhi Mumbai Kolkata Kolkata
Count 16.0 33.0 24.0 16.0
Expected count 28.5 51.6 13.4 5.0
Table 5.5.3 Proper dosage administration
Inference Table 5.5.3: For the ‘proper dosage administration’ the chi square test
showed significance (p=0.000) for the perception levels. The doctors in Kolkata
considered that this ‘doesn’t matter much’ (24 against the expected count of 13.4) and
‘not important’ (16 against the expected count of 5.0) whereas only few doctors in
Delhi considered this as ‘extremely important’ (16 against the expected count of 28.5).
Doctors in Kolkata and Delhi need to be promoted the importance of pack that
dispenses the proper dosage of the drug.
Summary of the major results for the test of H02 is shown in Table 5.5.4
Tests Results H02 Not
accepted ‘Availability improvement pack’
Perception Kolkata – Not important
‘Loss of drug – avoidance’
Kolkata & Mumbai – Not important
‘Proper dosage administration’
Kolkata & Delhi – Not important
Table 5.5.4 Summary Results for the test of H02
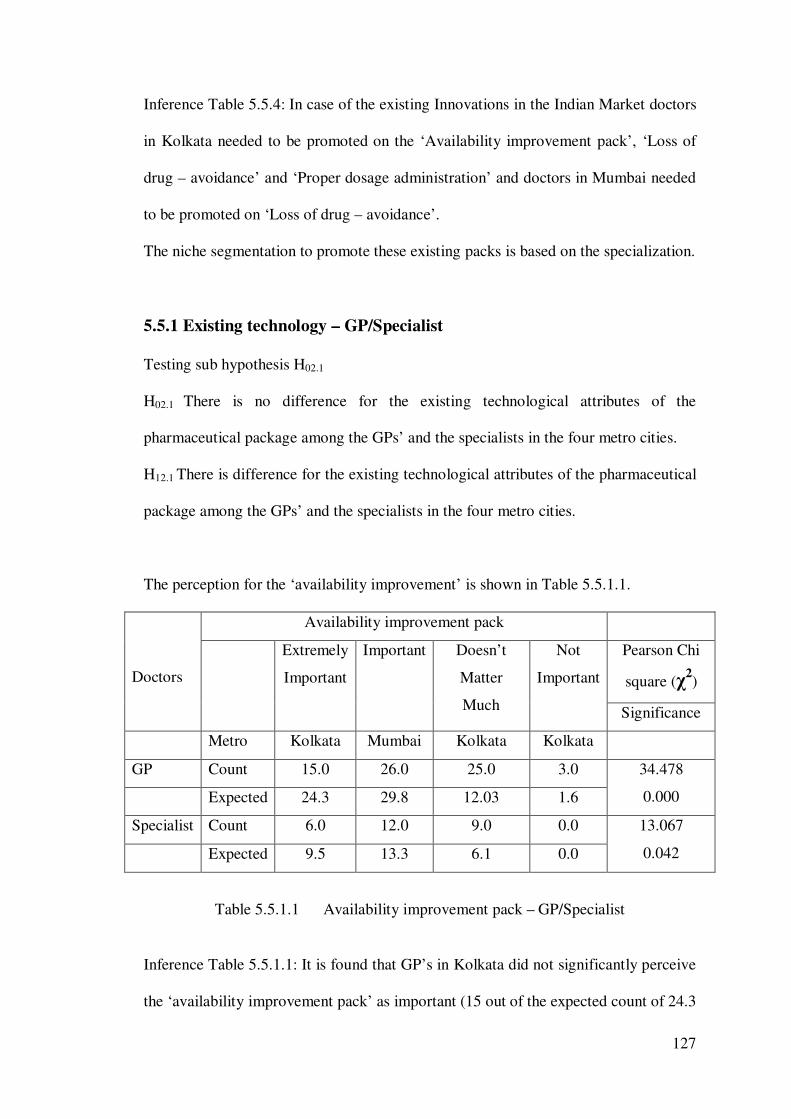
127
Inference Table 5.5.4: In case of the existing Innovations in the Indian Market doctors
in Kolkata needed to be promoted on the ‘Availability improvement pack’, ‘Loss of
drug – avoidance’ and ‘Proper dosage administration’ and doctors in Mumbai needed
to be promoted on ‘Loss of drug – avoidance’.
The niche segmentation to promote these existing packs is based on the specialization.
5.5.1 Existing technology – GP/Specialist
Testing sub hypothesis H02.1
H02.1 There is no difference for the existing technological attributes of the
pharmaceutical package among the GPs’ and the specialists in the four metro cities.
H12.1 There is difference for the existing technological attributes of the pharmaceutical
package among the GPs’ and the specialists in the four metro cities.
The perception for the ‘availability improvement’ is shown in Table 5.5.1.1.
Doctors
Availability improvement pack
Extremely
Important
Important Doesn’t
Matter
Much
Not
Important
Pearson Chi
square (χ2)
Significance
Metro Kolkata Mumbai Kolkata Kolkata
GP Count 15.0 26.0 25.0 3.0 34.478
0.000 Expected 24.3 29.8 12.03 1.6
Specialist Count 6.0 12.0 9.0 0.0 13.067
0.042 Expected 9.5 13.3 6.1 0.0
Table 5.5.1.1 Availability improvement pack – GP/Specialist
Inference Table 5.5.1.1: It is found that GP’s in Kolkata did not significantly perceive
the ‘availability improvement pack’ as important (15 out of the expected count of 24.3
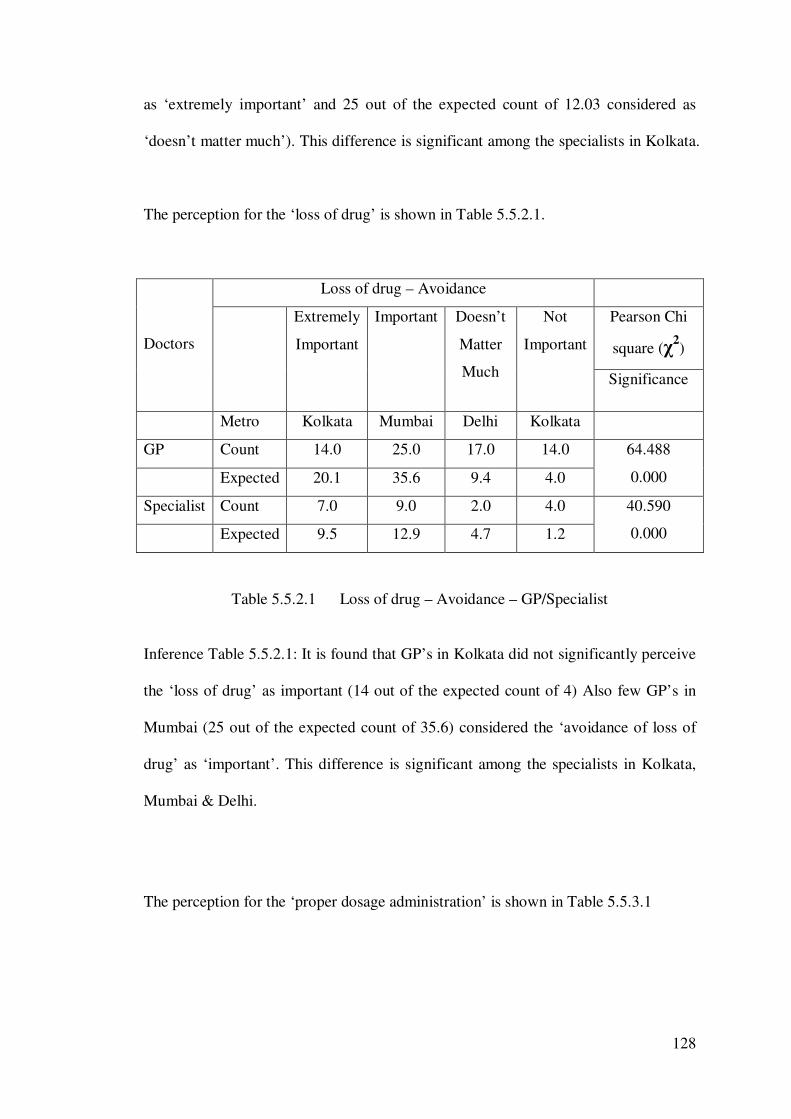
128
as ‘extremely important’ and 25 out of the expected count of 12.03 considered as
‘doesn’t matter much’). This difference is significant among the specialists in Kolkata.
The perception for the ‘loss of drug’ is shown in Table 5.5.2.1.
Doctors
Loss of drug – Avoidance
Extremely
Important
Important Doesn’t
Matter
Much
Not
Important
Pearson Chi
square (χ2)
Significance
Metro Kolkata Mumbai Delhi Kolkata
GP Count 14.0 25.0 17.0 14.0 64.488
0.000 Expected 20.1 35.6 9.4 4.0
Specialist Count 7.0 9.0 2.0 4.0 40.590
0.000 Expected 9.5 12.9 4.7 1.2
Table 5.5.2.1 Loss of drug – Avoidance – GP/Specialist
Inference Table 5.5.2.1: It is found that GP’s in Kolkata did not significantly perceive
the ‘loss of drug’ as important (14 out of the expected count of 4) Also few GP’s in
Mumbai (25 out of the expected count of 35.6) considered the ‘avoidance of loss of
drug’ as ‘important’. This difference is significant among the specialists in Kolkata,
Mumbai & Delhi.
The perception for the ‘proper dosage administration’ is shown in Table 5.5.3.1
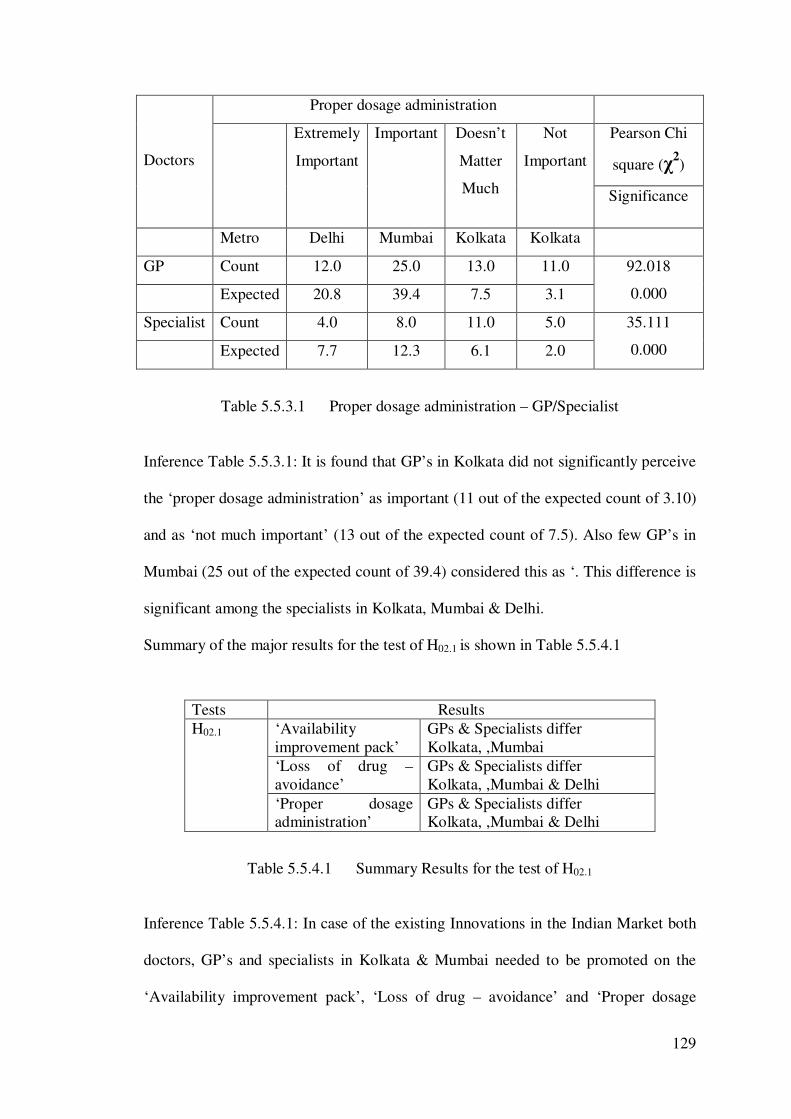
129
Doctors
Proper dosage administration
Extremely
Important
Important Doesn’t
Matter
Much
Not
Important
Pearson Chi
square (χ2)
Significance
Metro Delhi Mumbai Kolkata Kolkata
GP Count 12.0 25.0 13.0 11.0 92.018
0.000 Expected 20.8 39.4 7.5 3.1
Specialist Count 4.0 8.0 11.0 5.0 35.111
0.000 Expected 7.7 12.3 6.1 2.0
Table 5.5.3.1 Proper dosage administration – GP/Specialist
Inference Table 5.5.3.1: It is found that GP’s in Kolkata did not significantly perceive
the ‘proper dosage administration’ as important (11 out of the expected count of 3.10)
and as ‘not much important’ (13 out of the expected count of 7.5). Also few GP’s in
Mumbai (25 out of the expected count of 39.4) considered this as ‘. This difference is
significant among the specialists in Kolkata, Mumbai & Delhi.
Summary of the major results for the test of H02.1 is shown in Table 5.5.4.1
Tests Results H02.1 ‘Availability
improvement pack’ GPs & Specialists differ Kolkata, ,Mumbai
‘Loss of drug – avoidance’
GPs & Specialists differ Kolkata, ,Mumbai & Delhi
‘Proper dosage administration’
GPs & Specialists differ Kolkata, ,Mumbai & Delhi
Table 5.5.4.1 Summary Results for the test of H02.1
Inference Table 5.5.4.1: In case of the existing Innovations in the Indian Market both
doctors, GP’s and specialists in Kolkata & Mumbai needed to be promoted on the
‘Availability improvement pack’, ‘Loss of drug – avoidance’ and ‘Proper dosage
130
administration’ and doctors in Delhi (both GP’s and specialists) needed to be
promoted on ‘Loss of drug – avoidance’ and ‘Proper dosage administration’.
5.6 Additional value for utility function
Testing hypothesis H03
H03: The utility value of the pharmaceutical package is not important in adding value
for the pharmaceutical customers.
H13: The utility value of the pharmaceutical package is important in adding value for
the pharmaceutical customers.
The regression was done to check the increased predictability of the value of the
package based on the Lockhart model. For the doctors the value addition was better
predicted when technological innovation attributes, form, quality and design were
included as shown in Table 5.6.1
The regression model was build by the stepwise addition of the technological
variables for the doctors
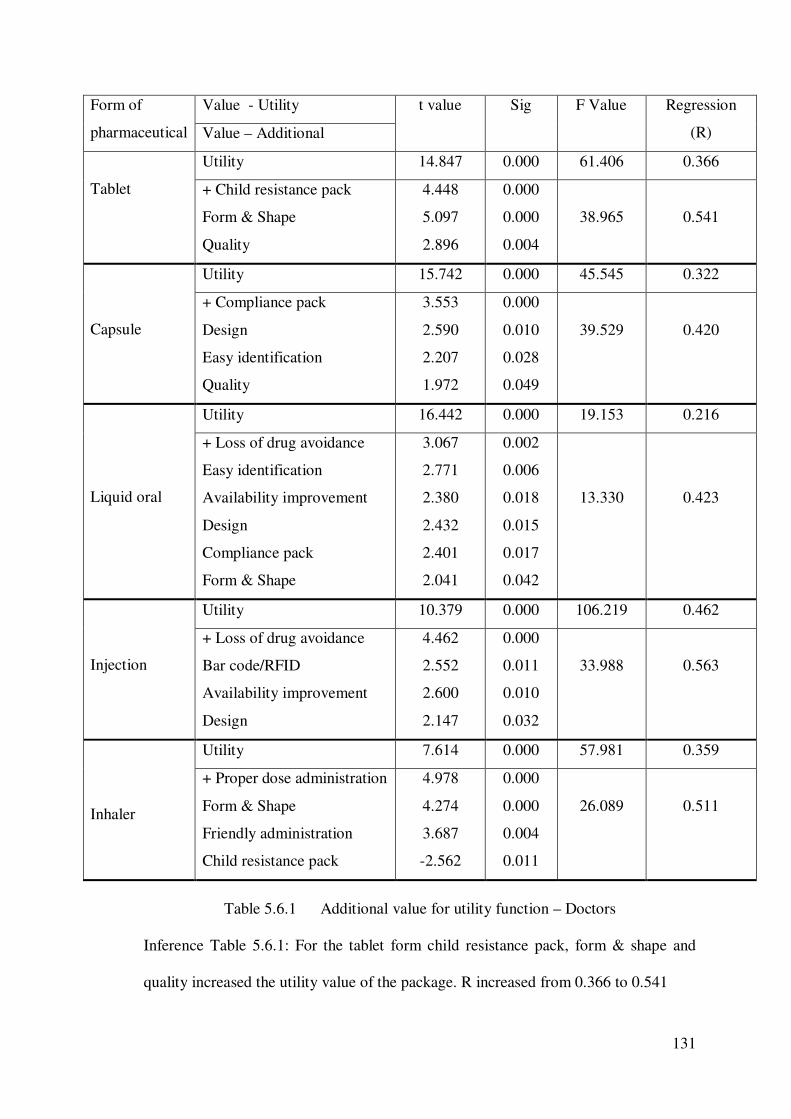
131
Form of
pharmaceutical
Value - Utility t value Sig F Value Regression
(R) Value – Additional
Tablet
Utility 14.847 0.000 61.406 0.366
+ Child resistance pack
Form & Shape
Quality
4.448
5.097
2.896
0.000
0.000
0.004
38.965
0.541
Capsule
Utility 15.742 0.000 45.545 0.322
+ Compliance pack
Design
Easy identification
Quality
3.553
2.590
2.207
1.972
0.000
0.010
0.028
0.049
39.529
0.420
Liquid oral
Utility 16.442 0.000 19.153 0.216
+ Loss of drug avoidance
Easy identification
Availability improvement
Design
Compliance pack
Form & Shape
3.067
2.771
2.380
2.432
2.401
2.041
0.002
0.006
0.018
0.015
0.017
0.042
13.330
0.423
Injection
Utility 10.379 0.000 106.219 0.462
+ Loss of drug avoidance
Bar code/RFID
Availability improvement
Design
4.462
2.552
2.600
2.147
0.000
0.011
0.010
0.032
33.988
0.563
Inhaler
Utility 7.614 0.000 57.981 0.359
+ Proper dose administration
Form & Shape
Friendly administration
Child resistance pack
4.978
4.274
3.687
-2.562
0.000
0.000
0.004
0.011
26.089
0.511
Table 5.6.1 Additional value for utility function – Doctors
Inference Table 5.6.1: For the tablet form child resistance pack, form & shape and
quality increased the utility value of the package. R increased from 0.366 to 0.541
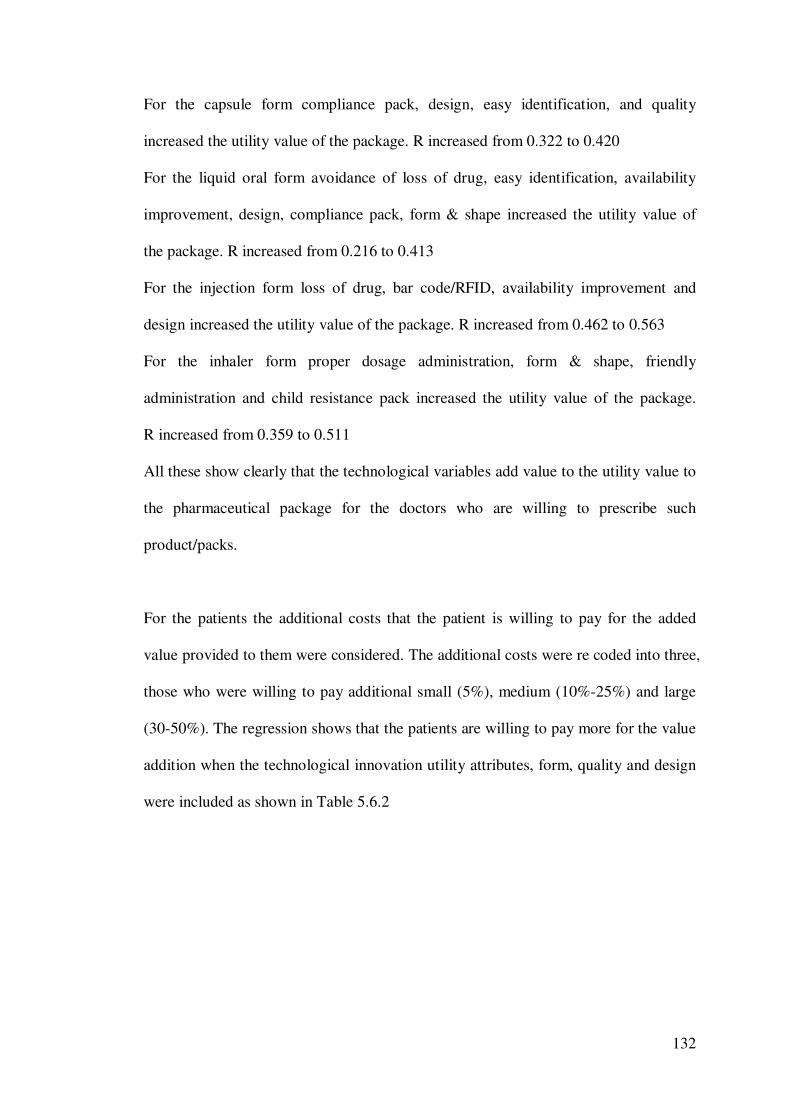
132
For the capsule form compliance pack, design, easy identification, and quality
increased the utility value of the package. R increased from 0.322 to 0.420
For the liquid oral form avoidance of loss of drug, easy identification, availability
improvement, design, compliance pack, form & shape increased the utility value of
the package. R increased from 0.216 to 0.413
For the injection form loss of drug, bar code/RFID, availability improvement and
design increased the utility value of the package. R increased from 0.462 to 0.563
For the inhaler form proper dosage administration, form & shape, friendly
administration and child resistance pack increased the utility value of the package.
R increased from 0.359 to 0.511
All these show clearly that the technological variables add value to the utility value to
the pharmaceutical package for the doctors who are willing to prescribe such
product/packs.
For the patients the additional costs that the patient is willing to pay for the added
value provided to them were considered. The additional costs were re coded into three,
those who were willing to pay additional small (5%), medium (10%-25%) and large
(30-50%). The regression shows that the patients are willing to pay more for the value
addition when the technological innovation utility attributes, form, quality and design
were included as shown in Table 5.6.2
133
Form of
pharmaceutical
Utility Value t value Sig F Value Regression (R)
Utility Value – Additional cost
Tablet
Convenience availability
Form & Shape
Wastage – Excess purchase
4.242
3.168
2.323
0.000
0.002
0.020
13.308
0.201
Quality
Form & Shape
Administration friendly
Instructions
8.770
2.675
-2.528
2.037
0.000
0.008
0.012
0.042
27.715
0.325
Capsule
Quality
Convenience availability
Instructions
3.873
3.173
2.877
0.000
0.002
0.004
12.719
0.197
Form & Shape
Wastage – Excess purchase
7.264
4.234
0.000
0.000
42.567 0.290
Liquid oral
Instructions
Form & Shape
Administration friendly
Counterfeit – Fake
2.887
-2.968
3.004
-2.419
0.004
0.003
0.003
0.016
8.775
0.190
Design
Form & Shape
Counterfeit – Fake
-5.604
4.815
-2.283
0.000
0.000
0.023
19.836
0.245
Injection
Instructions
Wastage – Excess purchase
Administration friendly
Design
4.190
-2.852
2.972
2.506
0.000
0.004
0.003
0.012
12.662
0.227
Design
Quality
Form & Shape
-5.742
2.749
2.103
0.000
0.006
0.036
16.089
0.223
Inhaler
Instructions
Administration friendly
3.862
2.218
0.000
0.027
14.037 0.171
Design -5.230 0.000 27.351 0.170
Table 5.6.2 Additional value for utility function - Patients
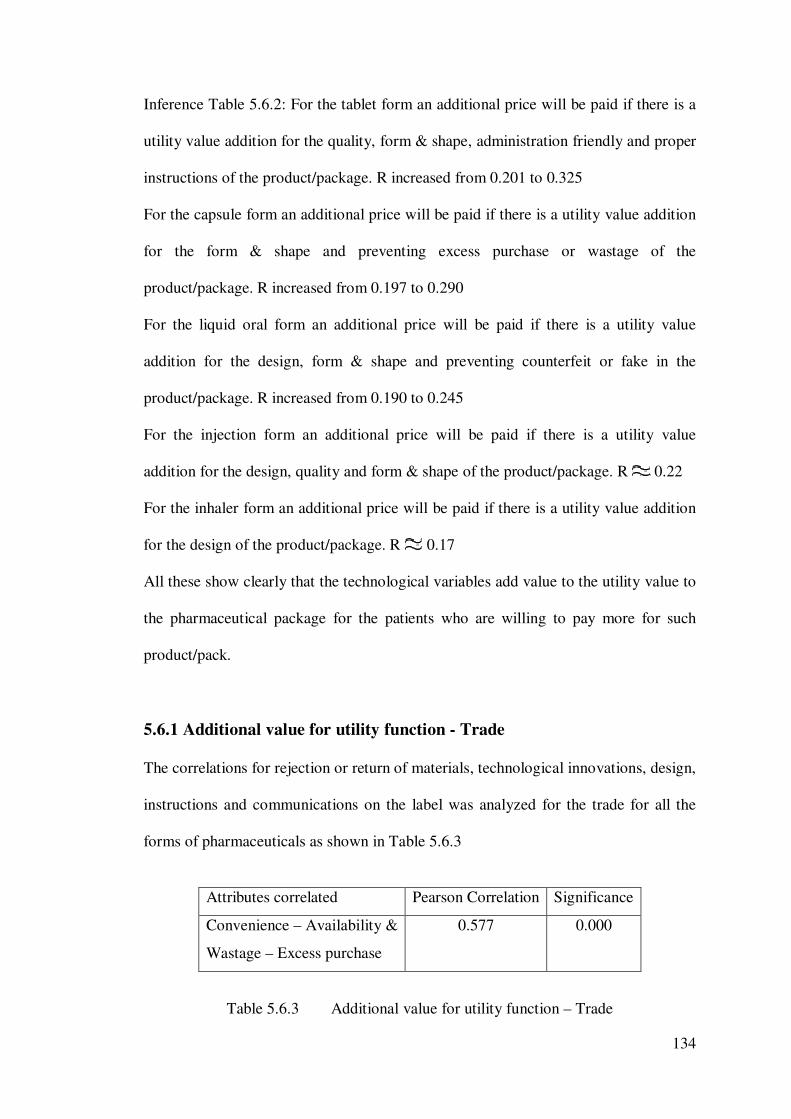
134
Inference Table 5.6.2: For the tablet form an additional price will be paid if there is a
utility value addition for the quality, form & shape, administration friendly and proper
instructions of the product/package. R increased from 0.201 to 0.325
For the capsule form an additional price will be paid if there is a utility value addition
for the form & shape and preventing excess purchase or wastage of the
product/package. R increased from 0.197 to 0.290
For the liquid oral form an additional price will be paid if there is a utility value
addition for the design, form & shape and preventing counterfeit or fake in the
product/package. R increased from 0.190 to 0.245
For the injection form an additional price will be paid if there is a utility value
addition for the design, quality and form & shape of the product/package. R 0.22
For the inhaler form an additional price will be paid if there is a utility value addition
for the design of the product/package. R 0.17
All these show clearly that the technological variables add value to the utility value to
the pharmaceutical package for the patients who are willing to pay more for such
product/pack.
5.6.1 Additional value for utility function - Trade
The correlations for rejection or return of materials, technological innovations, design,
instructions and communications on the label was analyzed for the trade for all the
forms of pharmaceuticals as shown in Table 5.6.3
Attributes correlated Pearson Correlation Significance
Convenience – Availability &
Wastage – Excess purchase
0.577 0.000
Table 5.6.3 Additional value for utility function – Trade
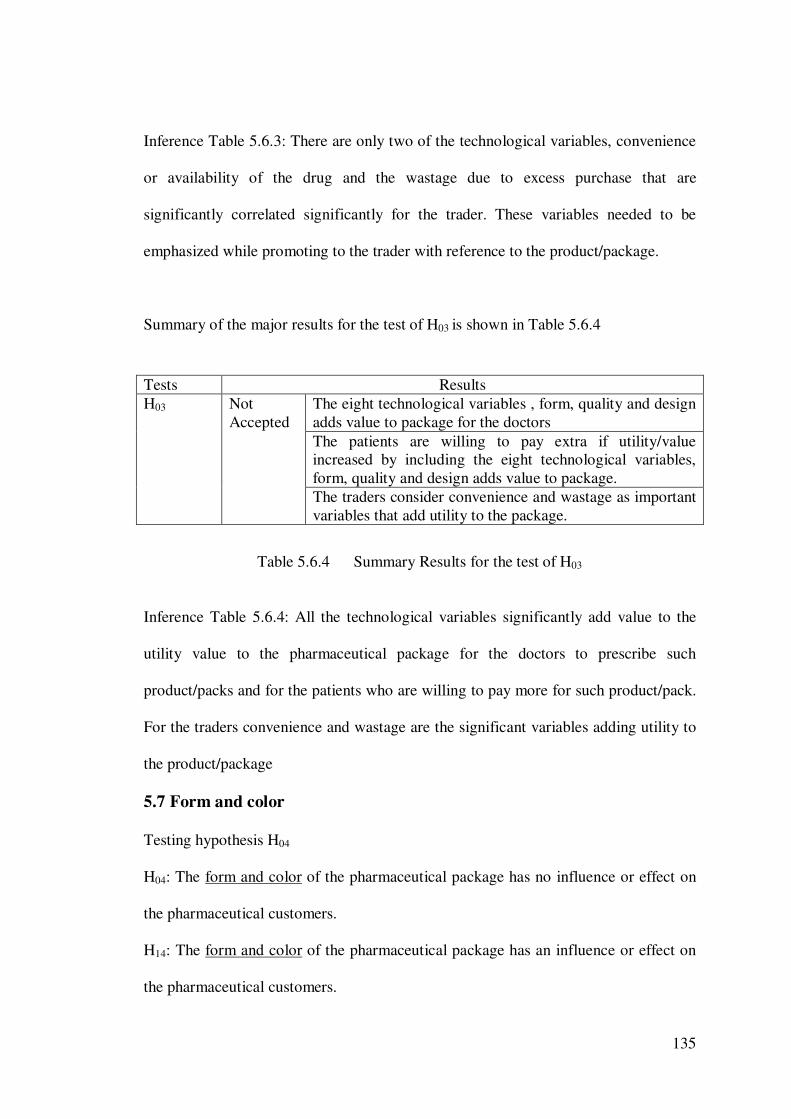
135
Inference Table 5.6.3: There are only two of the technological variables, convenience
or availability of the drug and the wastage due to excess purchase that are
significantly correlated significantly for the trader. These variables needed to be
emphasized while promoting to the trader with reference to the product/package.
Summary of the major results for the test of H03 is shown in Table 5.6.4
Tests Results H03 Not
Accepted The eight technological variables , form, quality and design adds value to package for the doctors The patients are willing to pay extra if utility/value increased by including the eight technological variables, form, quality and design adds value to package. The traders consider convenience and wastage as important variables that add utility to the package.
Table 5.6.4 Summary Results for the test of H03
Inference Table 5.6.4: All the technological variables significantly add value to the
utility value to the pharmaceutical package for the doctors to prescribe such
product/packs and for the patients who are willing to pay more for such product/pack.
For the traders convenience and wastage are the significant variables adding utility to
the product/package
5.7 Form and color
Testing hypothesis H04
H04: The form and color of the pharmaceutical package has no influence or effect on
the pharmaceutical customers.
H14: The form and color of the pharmaceutical package has an influence or effect on
the pharmaceutical customers.
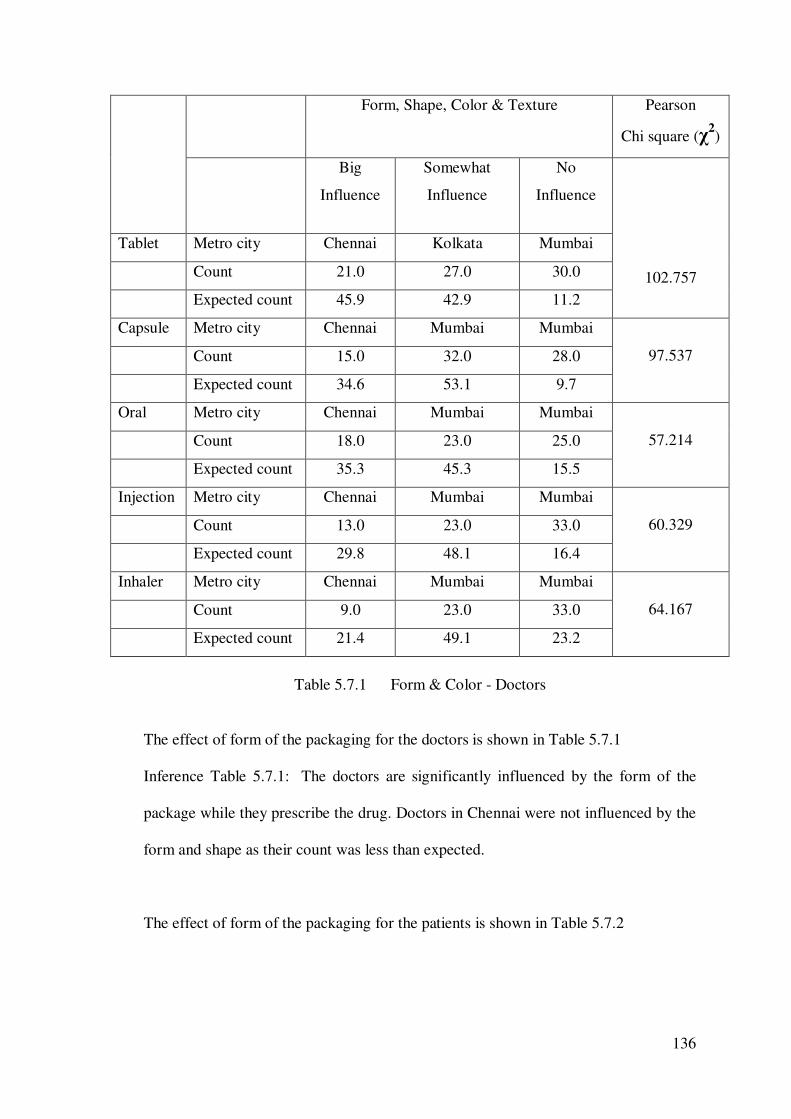
136
Form, Shape, Color & Texture Pearson
Chi square (χ2)
Big
Influence
Somewhat
Influence
No
Influence
102.757
Tablet Metro city Chennai Kolkata Mumbai
Count 21.0 27.0 30.0
Expected count 45.9 42.9 11.2
Capsule Metro city Chennai Mumbai Mumbai
97.537
Count 15.0 32.0 28.0
Expected count 34.6 53.1 9.7
Oral Metro city Chennai Mumbai Mumbai
57.214 Count 18.0 23.0 25.0
Expected count 35.3 45.3 15.5
Injection Metro city Chennai Mumbai Mumbai
60.329 Count 13.0 23.0 33.0
Expected count 29.8 48.1 16.4
Inhaler Metro city Chennai Mumbai Mumbai
64.167 Count 9.0 23.0 33.0
Expected count 21.4 49.1 23.2
Table 5.7.1 Form & Color - Doctors
The effect of form of the packaging for the doctors is shown in Table 5.7.1
Inference Table 5.7.1: The doctors are significantly influenced by the form of the
package while they prescribe the drug. Doctors in Chennai were not influenced by the
form and shape as their count was less than expected.
The effect of form of the packaging for the patients is shown in Table 5.7.2
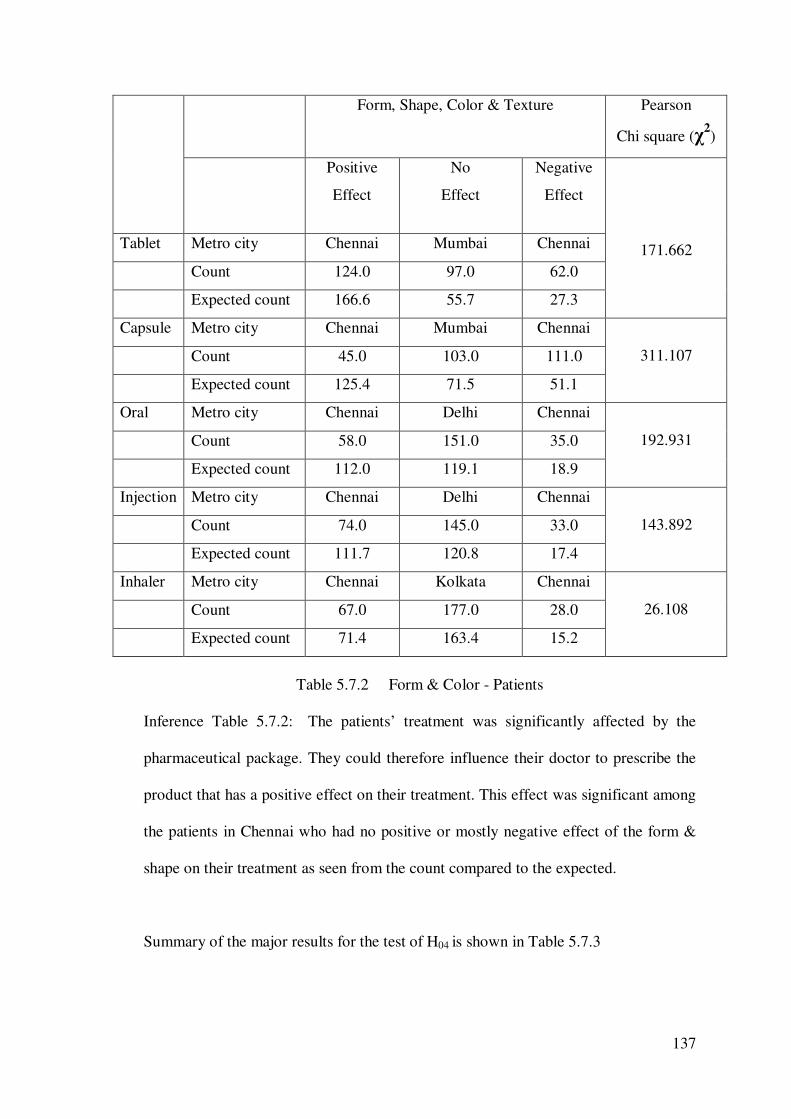
137
Form, Shape, Color & Texture Pearson
Chi square (χ2)
Positive
Effect
No
Effect
Negative
Effect
171.662 Tablet Metro city Chennai Mumbai Chennai
Count 124.0 97.0 62.0
Expected count 166.6 55.7 27.3
Capsule Metro city Chennai Mumbai Chennai
311.107
Count 45.0 103.0 111.0
Expected count 125.4 71.5 51.1
Oral Metro city Chennai Delhi Chennai
192.931 Count 58.0 151.0 35.0
Expected count 112.0 119.1 18.9
Injection Metro city Chennai Delhi Chennai
143.892 Count 74.0 145.0 33.0
Expected count 111.7 120.8 17.4
Inhaler Metro city Chennai Kolkata Chennai
26.108 Count 67.0 177.0 28.0
Expected count 71.4 163.4 15.2
Table 5.7.2 Form & Color - Patients
Inference Table 5.7.2: The patients’ treatment was significantly affected by the
pharmaceutical package. They could therefore influence their doctor to prescribe the
product that has a positive effect on their treatment. This effect was significant among
the patients in Chennai who had no positive or mostly negative effect of the form &
shape on their treatment as seen from the count compared to the expected.
Summary of the major results for the test of H04 is shown in Table 5.7.3
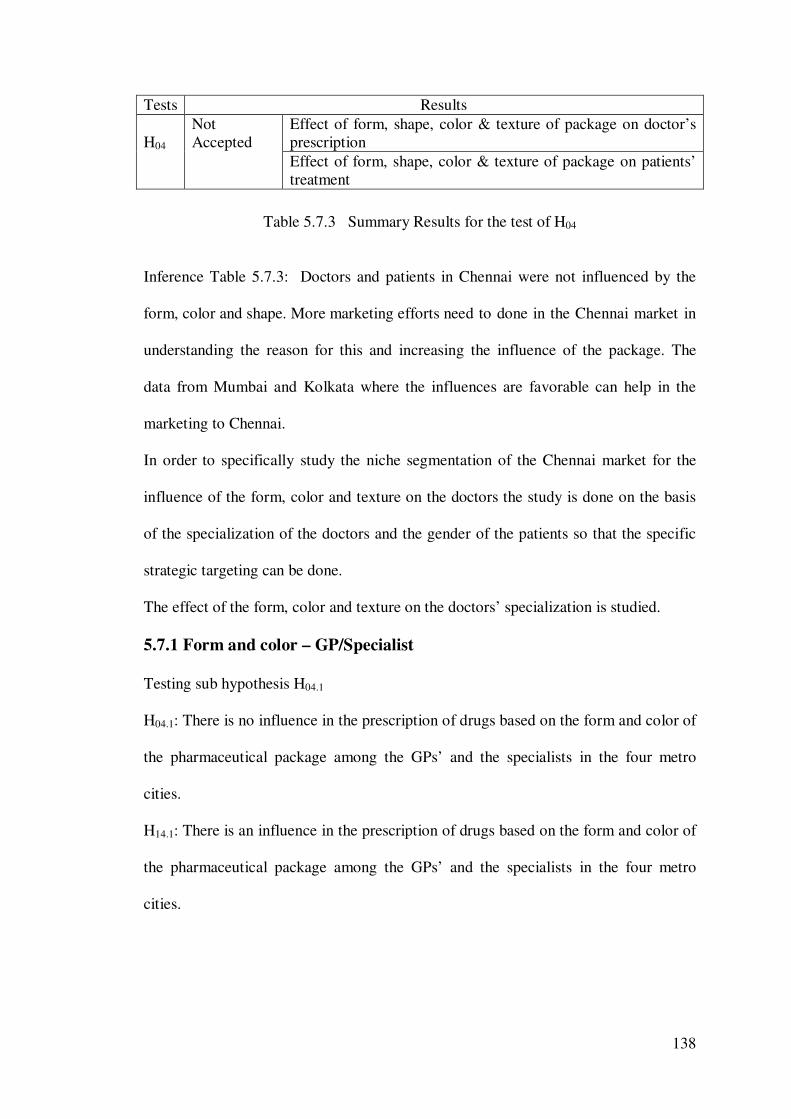
138
Tests Results H04
Not Accepted
Effect of form, shape, color & texture of package on doctor’s prescription Effect of form, shape, color & texture of package on patients’ treatment
Table 5.7.3 Summary Results for the test of H04
Inference Table 5.7.3: Doctors and patients in Chennai were not influenced by the
form, color and shape. More marketing efforts need to done in the Chennai market in
understanding the reason for this and increasing the influence of the package. The
data from Mumbai and Kolkata where the influences are favorable can help in the
marketing to Chennai.
In order to specifically study the niche segmentation of the Chennai market for the
influence of the form, color and texture on the doctors the study is done on the basis
of the specialization of the doctors and the gender of the patients so that the specific
strategic targeting can be done.
The effect of the form, color and texture on the doctors’ specialization is studied.
5.7.1 Form and color – GP/Specialist
Testing sub hypothesis H04.1
H04.1: There is no influence in the prescription of drugs based on the form and color of
the pharmaceutical package among the GPs’ and the specialists in the four metro
cities.
H14.1: There is an influence in the prescription of drugs based on the form and color of
the pharmaceutical package among the GPs’ and the specialists in the four metro
cities.
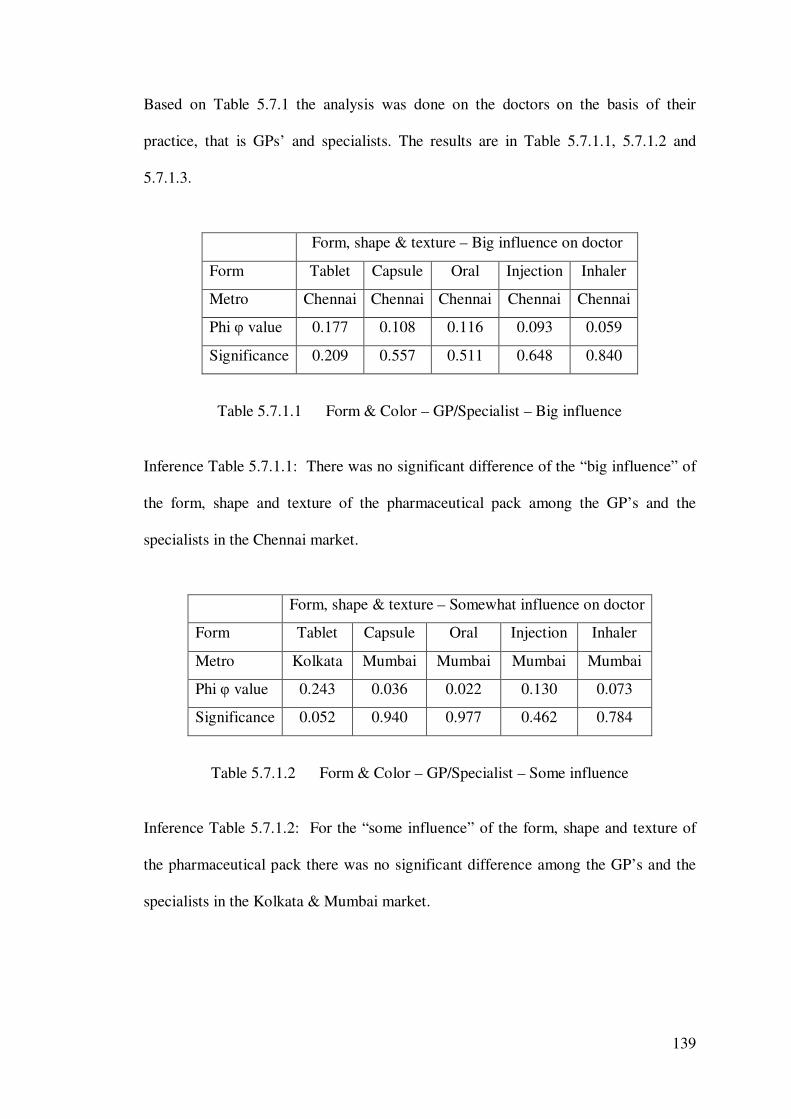
139
Based on Table 5.7.1 the analysis was done on the doctors on the basis of their
practice, that is GPs’ and specialists. The results are in Table 5.7.1.1, 5.7.1.2 and
5.7.1.3.
Form, shape & texture – Big influence on doctor
Form Tablet Capsule Oral Injection Inhaler
Metro Chennai Chennai Chennai Chennai Chennai
Phi φ value 0.177 0.108 0.116 0.093 0.059
Significance 0.209 0.557 0.511 0.648 0.840
Table 5.7.1.1 Form & Color – GP/Specialist – Big influence
Inference Table 5.7.1.1: There was no significant difference of the “big influence” of
the form, shape and texture of the pharmaceutical pack among the GP’s and the
specialists in the Chennai market.
Form, shape & texture – Somewhat influence on doctor
Form Tablet Capsule Oral Injection Inhaler
Metro Kolkata Mumbai Mumbai Mumbai Mumbai
Phi φ value 0.243 0.036 0.022 0.130 0.073
Significance 0.052 0.940 0.977 0.462 0.784
Table 5.7.1.2 Form & Color – GP/Specialist – Some influence
Inference Table 5.7.1.2: For the “some influence” of the form, shape and texture of
the pharmaceutical pack there was no significant difference among the GP’s and the
specialists in the Kolkata & Mumbai market.
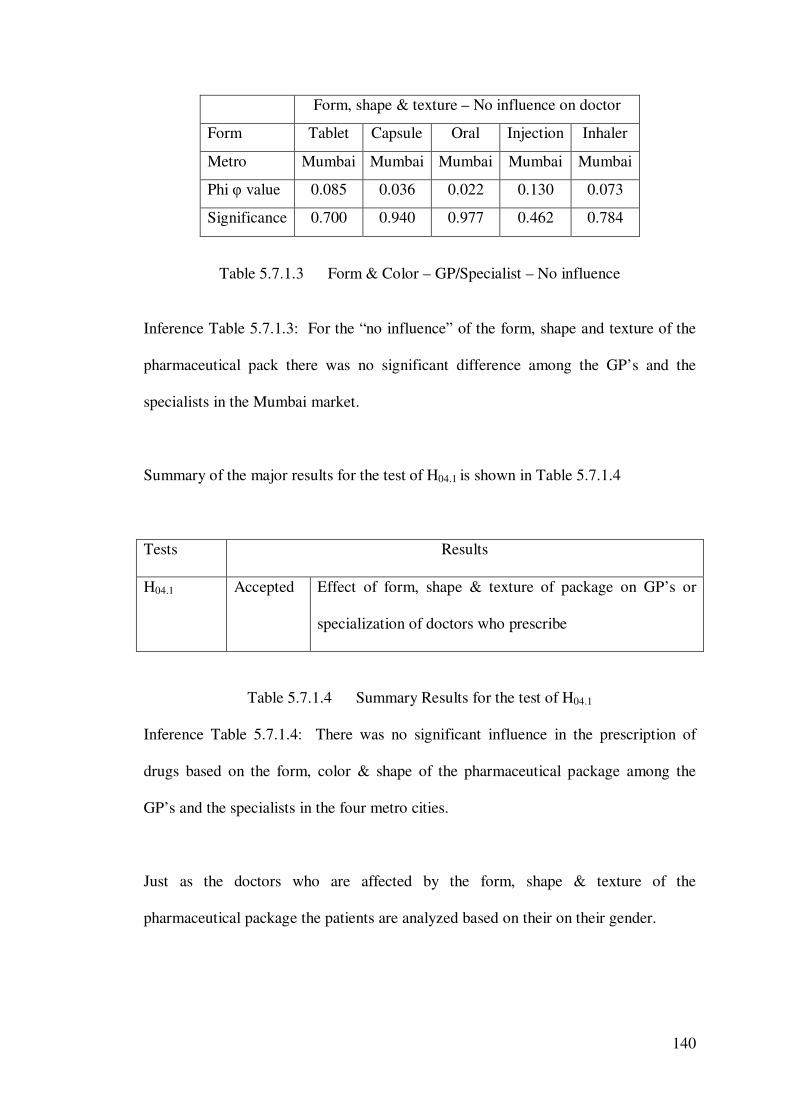
140
Form, shape & texture – No influence on doctor
Form Tablet Capsule Oral Injection Inhaler
Metro Mumbai Mumbai Mumbai Mumbai Mumbai
Phi φ value 0.085 0.036 0.022 0.130 0.073
Significance 0.700 0.940 0.977 0.462 0.784
Table 5.7.1.3 Form & Color – GP/Specialist – No influence
Inference Table 5.7.1.3: For the “no influence” of the form, shape and texture of the
pharmaceutical pack there was no significant difference among the GP’s and the
specialists in the Mumbai market.
Summary of the major results for the test of H04.1 is shown in Table 5.7.1.4
Tests Results
H04.1 Accepted Effect of form, shape & texture of package on GP’s or
specialization of doctors who prescribe
Table 5.7.1.4 Summary Results for the test of H04.1
Inference Table 5.7.1.4: There was no significant influence in the prescription of
drugs based on the form, color & shape of the pharmaceutical package among the
GP’s and the specialists in the four metro cities.
Just as the doctors who are affected by the form, shape & texture of the
pharmaceutical package the patients are analyzed based on their on their gender.
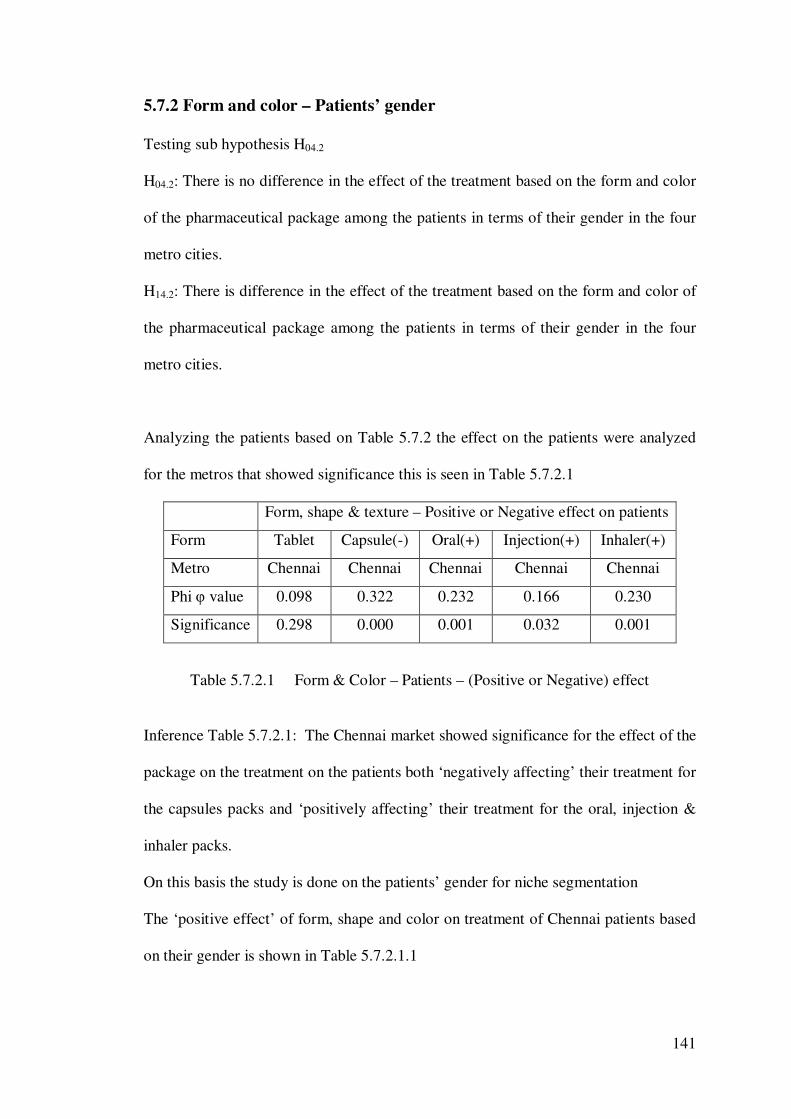
141
5.7.2 Form and color – Patients’ gender
Testing sub hypothesis H04.2
H04.2: There is no difference in the effect of the treatment based on the form and color
of the pharmaceutical package among the patients in terms of their gender in the four
metro cities.
H14.2: There is difference in the effect of the treatment based on the form and color of
the pharmaceutical package among the patients in terms of their gender in the four
metro cities.
Analyzing the patients based on Table 5.7.2 the effect on the patients were analyzed
for the metros that showed significance this is seen in Table 5.7.2.1
Form, shape & texture – Positive or Negative effect on patients
Form Tablet Capsule(-) Oral(+) Injection(+) Inhaler(+)
Metro Chennai Chennai Chennai Chennai Chennai
Phi φ value 0.098 0.322 0.232 0.166 0.230
Significance 0.298 0.000 0.001 0.032 0.001
Table 5.7.2.1 Form & Color – Patients – (Positive or Negative) effect
Inference Table 5.7.2.1: The Chennai market showed significance for the effect of the
package on the treatment on the patients both ‘negatively affecting’ their treatment for
the capsules packs and ‘positively affecting’ their treatment for the oral, injection &
inhaler packs.
On this basis the study is done on the patients’ gender for niche segmentation
The ‘positive effect’ of form, shape and color on treatment of Chennai patients based
on their gender is shown in Table 5.7.2.1.1
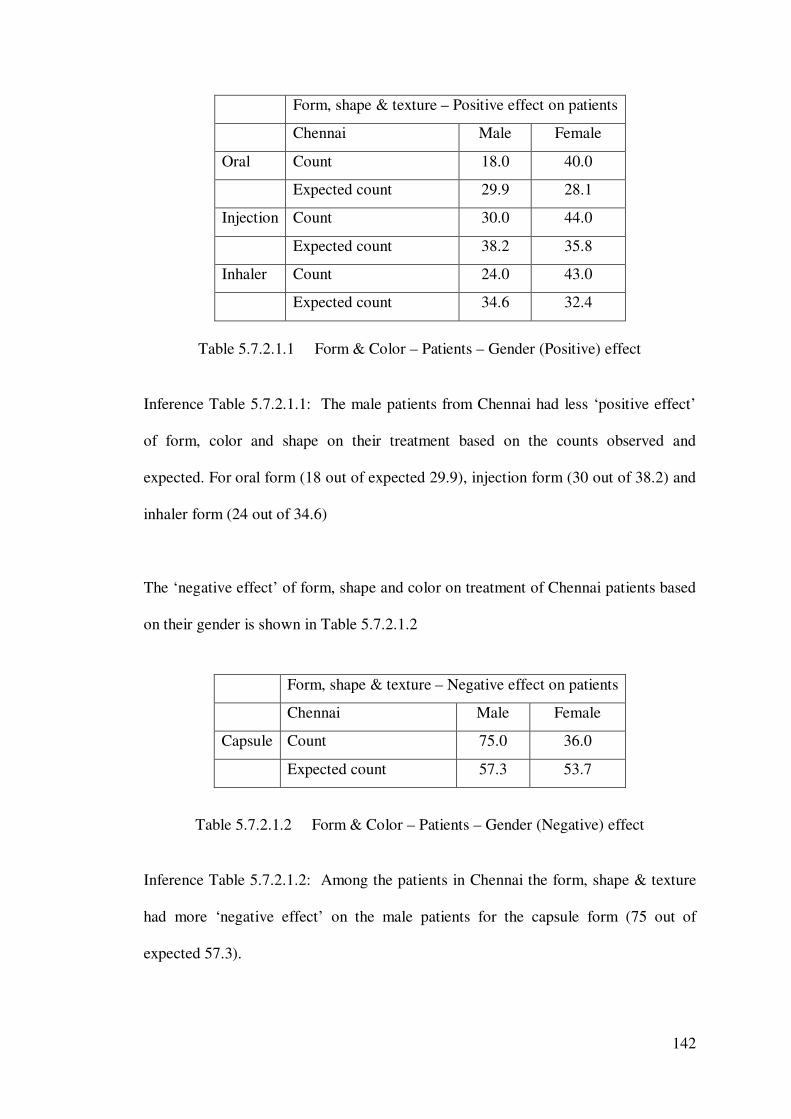
142
Form, shape & texture – Positive effect on patients
Chennai Male Female
Oral Count 18.0 40.0
Expected count 29.9 28.1
Injection Count 30.0 44.0
Expected count 38.2 35.8
Inhaler Count 24.0 43.0
Expected count 34.6 32.4
Table 5.7.2.1.1 Form & Color – Patients – Gender (Positive) effect
Inference Table 5.7.2.1.1: The male patients from Chennai had less ‘positive effect’
of form, color and shape on their treatment based on the counts observed and
expected. For oral form (18 out of expected 29.9), injection form (30 out of 38.2) and
inhaler form (24 out of 34.6)
The ‘negative effect’ of form, shape and color on treatment of Chennai patients based
on their gender is shown in Table 5.7.2.1.2
Form, shape & texture – Negative effect on patients
Chennai Male Female
Capsule Count 75.0 36.0
Expected count 57.3 53.7
Table 5.7.2.1.2 Form & Color – Patients – Gender (Negative) effect
Inference Table 5.7.2.1.2: Among the patients in Chennai the form, shape & texture
had more ‘negative effect’ on the male patients for the capsule form (75 out of
expected 57.3).
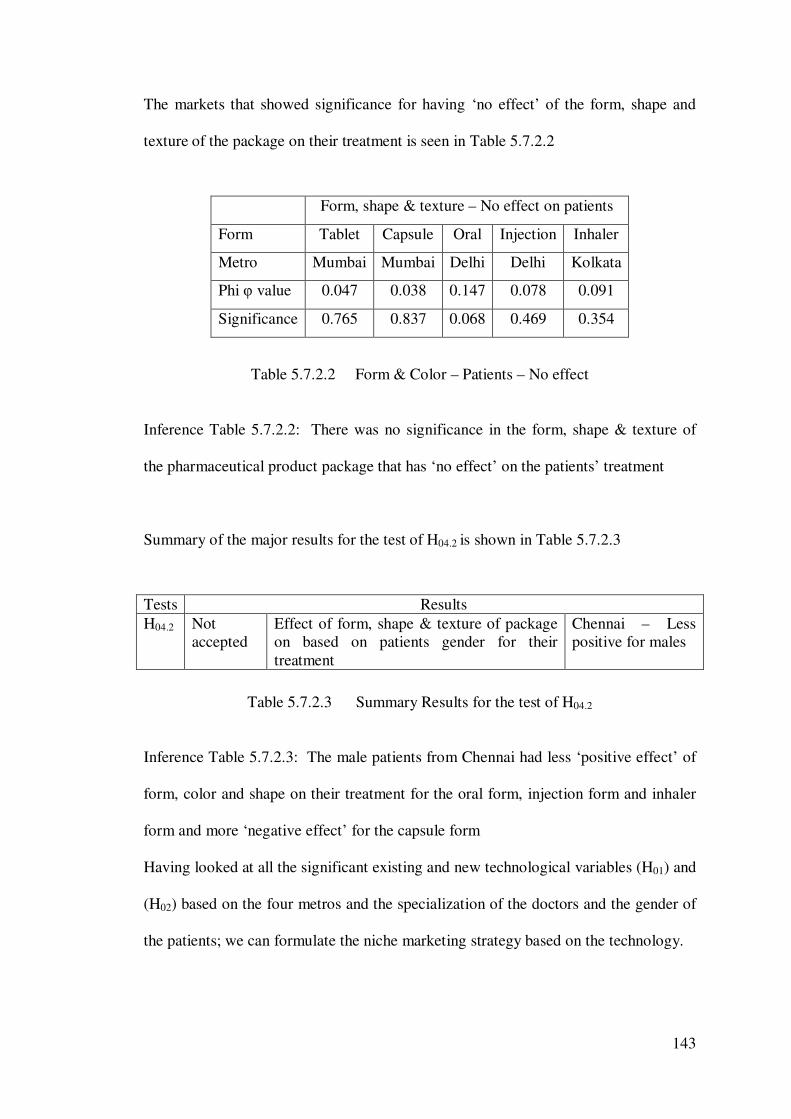
143
The markets that showed significance for having ‘no effect’ of the form, shape and
texture of the package on their treatment is seen in Table 5.7.2.2
Form, shape & texture – No effect on patients
Form Tablet Capsule Oral Injection Inhaler
Metro Mumbai Mumbai Delhi Delhi Kolkata
Phi φ value 0.047 0.038 0.147 0.078 0.091
Significance 0.765 0.837 0.068 0.469 0.354
Table 5.7.2.2 Form & Color – Patients – No effect
Inference Table 5.7.2.2: There was no significance in the form, shape & texture of
the pharmaceutical product package that has ‘no effect’ on the patients’ treatment
Summary of the major results for the test of H04.2 is shown in Table 5.7.2.3
Tests Results H04.2 Not
accepted Effect of form, shape & texture of package on based on patients gender for their treatment
Chennai – Less positive for males
Table 5.7.2.3 Summary Results for the test of H04.2
Inference Table 5.7.2.3: The male patients from Chennai had less ‘positive effect’ of
form, color and shape on their treatment for the oral form, injection form and inhaler
form and more ‘negative effect’ for the capsule form
Having looked at all the significant existing and new technological variables (H01) and
(H02) based on the four metros and the specialization of the doctors and the gender of
the patients; we can formulate the niche marketing strategy based on the technology.
144
The utility of these variables (H03) showed more specifically the value addition of the
package for the doctors and patients that can increase the market share of the product.
A similar analysis based on the four metros and the doctors specialization with the
patients gender was done (H04) for the effect of the form, shape & color of the
package that identified precisely the products that need to be targeted strategically.
To further enhance the strategic impact based on the above four hypotheses the
doctors and the patients ranked the pharmaceutical package that needs design
improvement (H05) for the typical formulations available in the Indian market.
Among the five forms of pharmaceutical products based on expert advice the tablet
form package considered were ‘product in carton’, ‘aluminum foil’, Aluminum –
Aluminum foil (‘Alu-Alu’) and ‘blister pack’. The capsule form package considered
were products in ‘PET bottle’. The liquid oral form package considered were ‘syrup
with spoon’ and in ‘carton’. The injection form package considered were ‘loose pack’,
‘injection in carton’, ‘injection with syringe’ and ‘pre filled syringe’. The inhaler form
package considered were ‘inhalers in carton’.
5.8 Design improvement
Testing hypothesis H05
H05: The design improvements in the packaging for the various pharmaceutical types
are not important for the Indian pharmaceutical customers.
H15: The design improvements in the packaging for the various pharmaceutical types
are important for the Indian pharmaceutical customers.
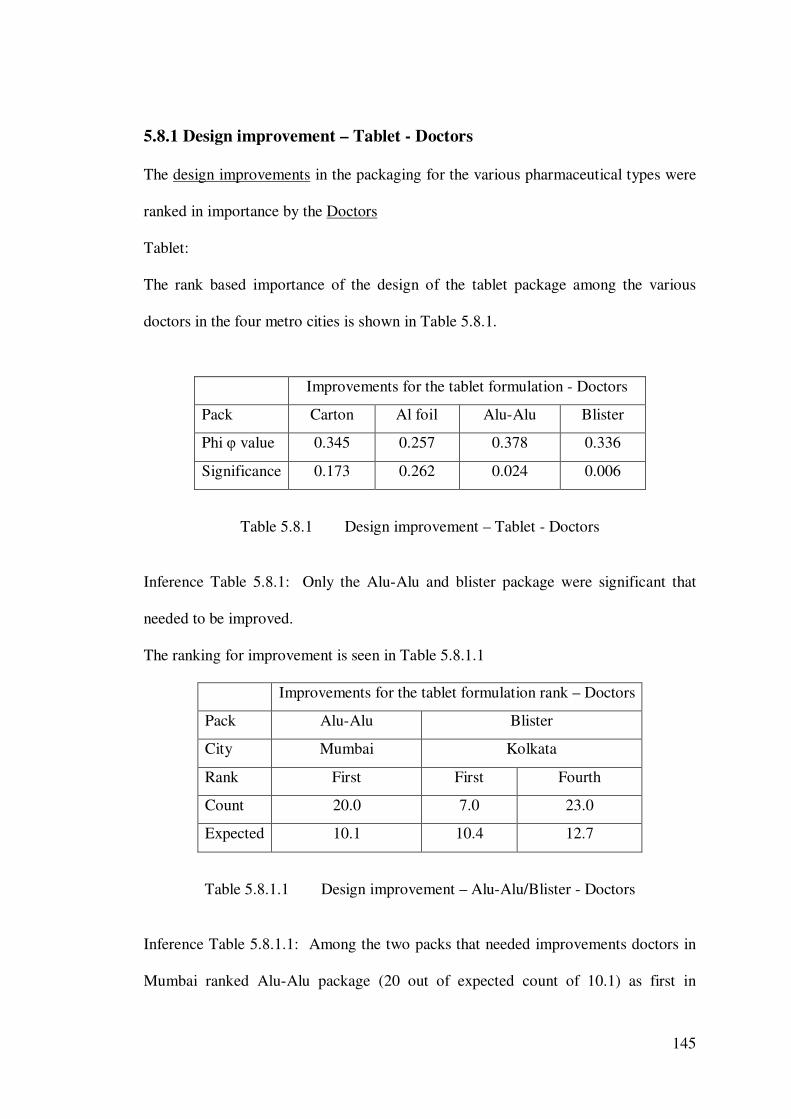
145
5.8.1 Design improvement – Tablet - Doctors
The design improvements in the packaging for the various pharmaceutical types were
ranked in importance by the Doctors
Tablet:
The rank based importance of the design of the tablet package among the various
doctors in the four metro cities is shown in Table 5.8.1.
Improvements for the tablet formulation - Doctors
Pack Carton Al foil Alu-Alu Blister
Phi φ value 0.345 0.257 0.378 0.336
Significance 0.173 0.262 0.024 0.006
Table 5.8.1 Design improvement – Tablet - Doctors
Inference Table 5.8.1: Only the Alu-Alu and blister package were significant that
needed to be improved.
The ranking for improvement is seen in Table 5.8.1.1
Improvements for the tablet formulation rank – Doctors
Pack Alu-Alu Blister
City Mumbai Kolkata
Rank First First Fourth
Count 20.0 7.0 23.0
Expected 10.1 10.4 12.7
Table 5.8.1.1 Design improvement – Alu-Alu/Blister - Doctors
Inference Table 5.8.1.1: Among the two packs that needed improvements doctors in
Mumbai ranked Alu-Alu package (20 out of expected count of 10.1) as first in
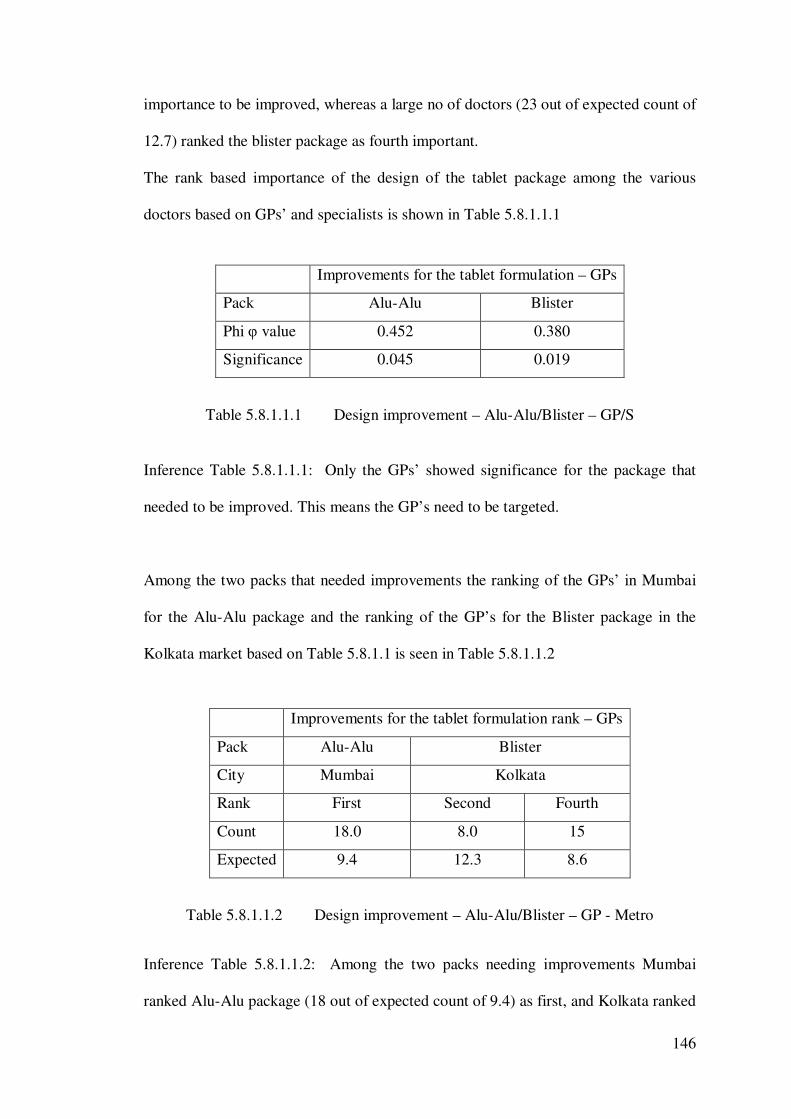
146
importance to be improved, whereas a large no of doctors (23 out of expected count of
12.7) ranked the blister package as fourth important.
The rank based importance of the design of the tablet package among the various
doctors based on GPs’ and specialists is shown in Table 5.8.1.1.1
Improvements for the tablet formulation – GPs
Pack Alu-Alu Blister
Phi φ value 0.452 0.380
Significance 0.045 0.019
Table 5.8.1.1.1 Design improvement – Alu-Alu/Blister – GP/S
Inference Table 5.8.1.1.1: Only the GPs’ showed significance for the package that
needed to be improved. This means the GP’s need to be targeted.
Among the two packs that needed improvements the ranking of the GPs’ in Mumbai
for the Alu-Alu package and the ranking of the GP’s for the Blister package in the
Kolkata market based on Table 5.8.1.1 is seen in Table 5.8.1.1.2
Improvements for the tablet formulation rank – GPs
Pack Alu-Alu Blister
City Mumbai Kolkata
Rank First Second Fourth
Count 18.0 8.0 15
Expected 9.4 12.3 8.6
Table 5.8.1.1.2 Design improvement – Alu-Alu/Blister – GP - Metro
Inference Table 5.8.1.1.2: Among the two packs needing improvements Mumbai
ranked Alu-Alu package (18 out of expected count of 9.4) as first, and Kolkata ranked
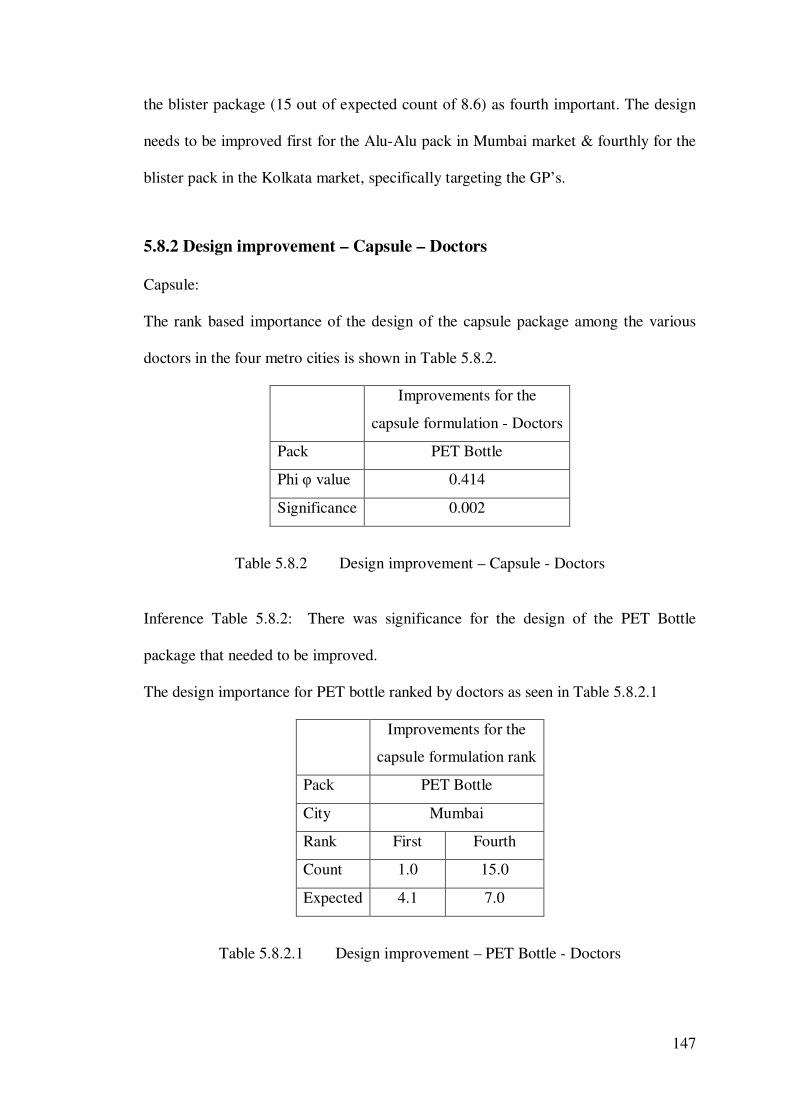
147
the blister package (15 out of expected count of 8.6) as fourth important. The design
needs to be improved first for the Alu-Alu pack in Mumbai market & fourthly for the
blister pack in the Kolkata market, specifically targeting the GP’s.
5.8.2 Design improvement – Capsule – Doctors
Capsule:
The rank based importance of the design of the capsule package among the various
doctors in the four metro cities is shown in Table 5.8.2.
Improvements for the
capsule formulation - Doctors
Pack PET Bottle
Phi φ value 0.414
Significance 0.002
Table 5.8.2 Design improvement – Capsule - Doctors
Inference Table 5.8.2: There was significance for the design of the PET Bottle
package that needed to be improved.
The design importance for PET bottle ranked by doctors as seen in Table 5.8.2.1
Improvements for the
capsule formulation rank
Pack PET Bottle
City Mumbai
Rank First Fourth
Count 1.0 15.0
Expected 4.1 7.0
Table 5.8.2.1 Design improvement – PET Bottle - Doctors
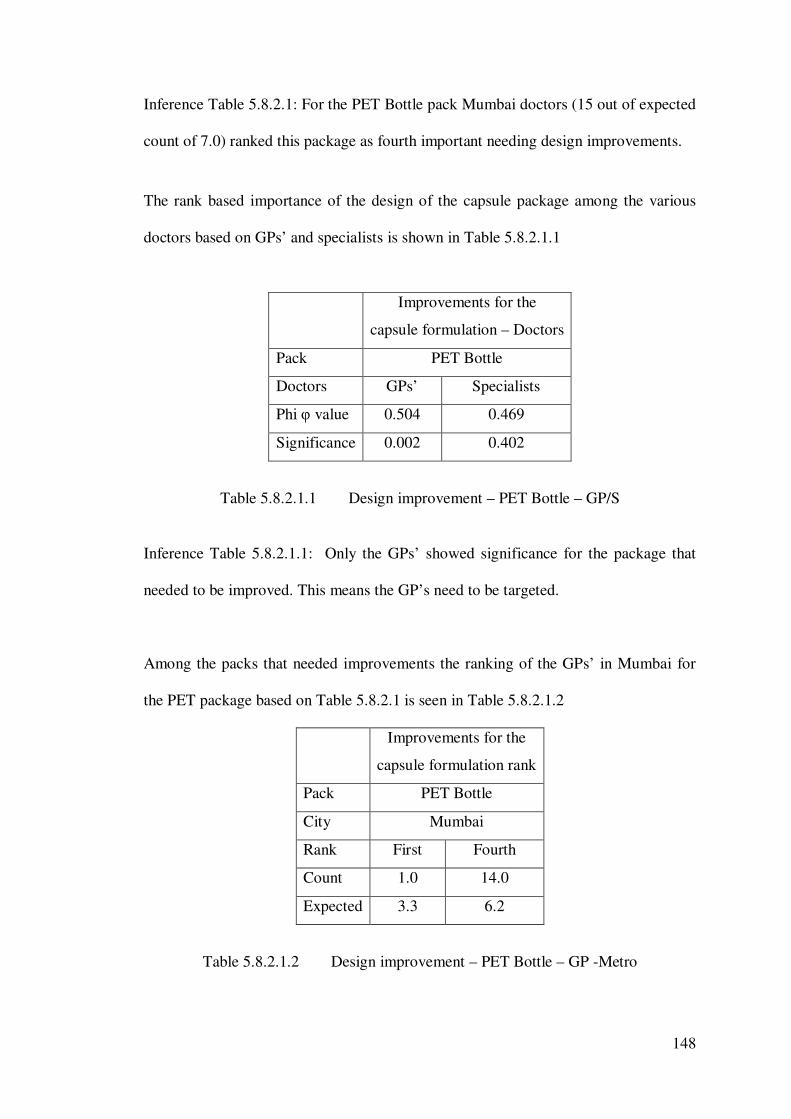
148
Inference Table 5.8.2.1: For the PET Bottle pack Mumbai doctors (15 out of expected
count of 7.0) ranked this package as fourth important needing design improvements.
The rank based importance of the design of the capsule package among the various
doctors based on GPs’ and specialists is shown in Table 5.8.2.1.1
Improvements for the
capsule formulation – Doctors
Pack PET Bottle
Doctors GPs’ Specialists
Phi φ value 0.504 0.469
Significance 0.002 0.402
Table 5.8.2.1.1 Design improvement – PET Bottle – GP/S
Inference Table 5.8.2.1.1: Only the GPs’ showed significance for the package that
needed to be improved. This means the GP’s need to be targeted.
Among the packs that needed improvements the ranking of the GPs’ in Mumbai for
the PET package based on Table 5.8.2.1 is seen in Table 5.8.2.1.2
Improvements for the
capsule formulation rank
Pack PET Bottle
City Mumbai
Rank First Fourth
Count 1.0 14.0
Expected 3.3 6.2
Table 5.8.2.1.2 Design improvement – PET Bottle – GP -Metro
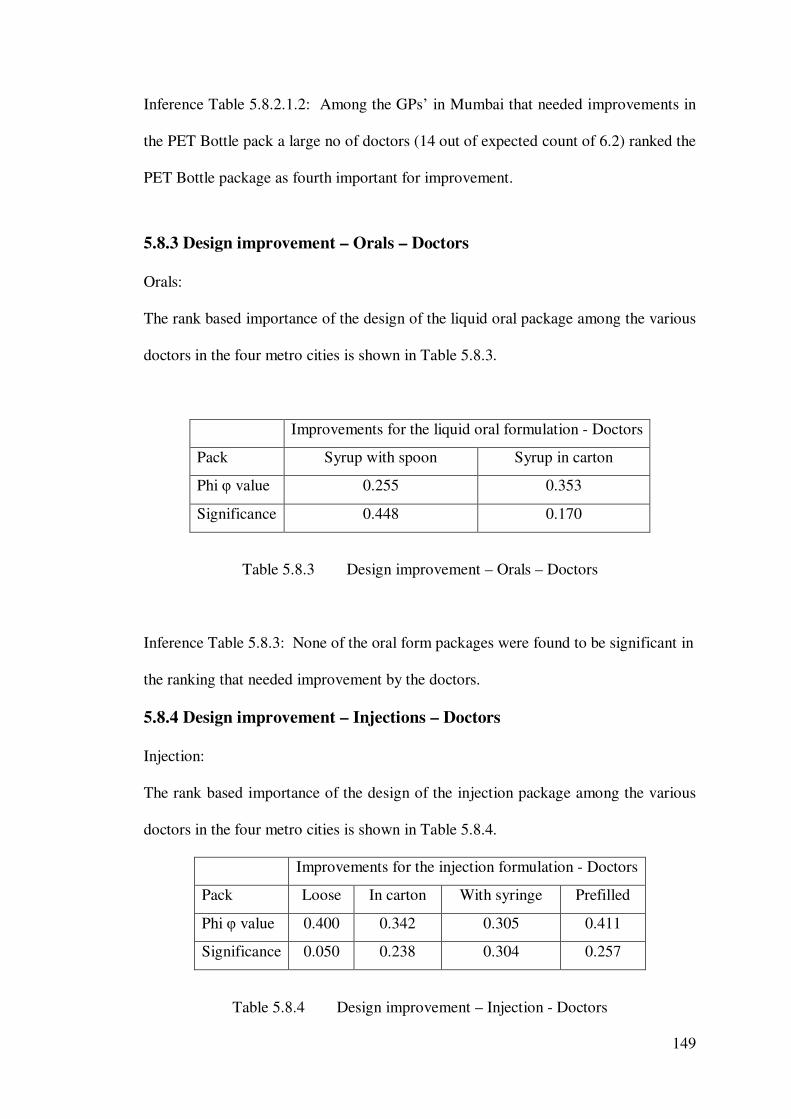
149
Inference Table 5.8.2.1.2: Among the GPs’ in Mumbai that needed improvements in
the PET Bottle pack a large no of doctors (14 out of expected count of 6.2) ranked the
PET Bottle package as fourth important for improvement.
5.8.3 Design improvement – Orals – Doctors
Orals:
The rank based importance of the design of the liquid oral package among the various
doctors in the four metro cities is shown in Table 5.8.3.
Improvements for the liquid oral formulation - Doctors
Pack Syrup with spoon Syrup in carton
Phi φ value 0.255 0.353
Significance 0.448 0.170
Table 5.8.3 Design improvement – Orals – Doctors
Inference Table 5.8.3: None of the oral form packages were found to be significant in
the ranking that needed improvement by the doctors.
5.8.4 Design improvement – Injections – Doctors
Injection:
The rank based importance of the design of the injection package among the various
doctors in the four metro cities is shown in Table 5.8.4.
Improvements for the injection formulation - Doctors
Pack Loose In carton With syringe Prefilled
Phi φ value 0.400 0.342 0.305 0.411
Significance 0.050 0.238 0.304 0.257
Table 5.8.4 Design improvement – Injection - Doctors
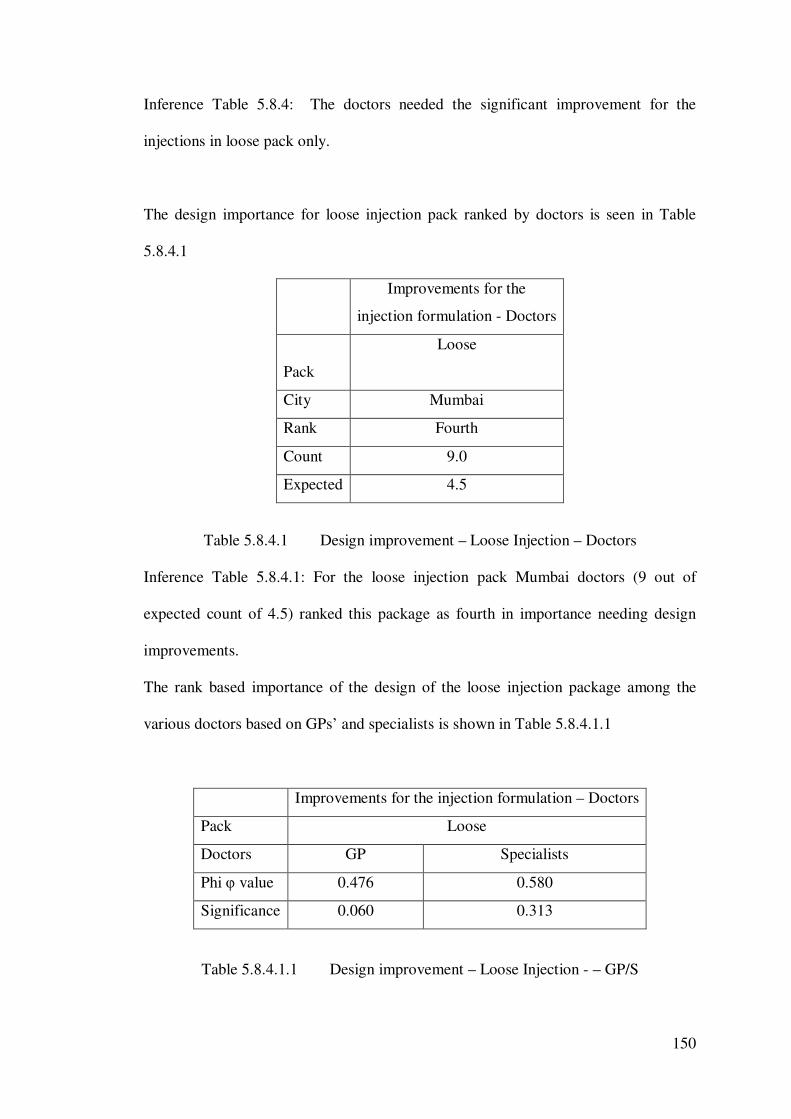
150
Inference Table 5.8.4: The doctors needed the significant improvement for the
injections in loose pack only.
The design importance for loose injection pack ranked by doctors is seen in Table
5.8.4.1
Improvements for the
injection formulation - Doctors
Pack
Loose
City Mumbai
Rank Fourth
Count 9.0
Expected 4.5
Table 5.8.4.1 Design improvement – Loose Injection – Doctors
Inference Table 5.8.4.1: For the loose injection pack Mumbai doctors (9 out of
expected count of 4.5) ranked this package as fourth in importance needing design
improvements.
The rank based importance of the design of the loose injection package among the
various doctors based on GPs’ and specialists is shown in Table 5.8.4.1.1
Improvements for the injection formulation – Doctors
Pack Loose
Doctors GP Specialists
Phi φ value 0.476 0.580
Significance 0.060 0.313
Table 5.8.4.1.1 Design improvement – Loose Injection - – GP/S
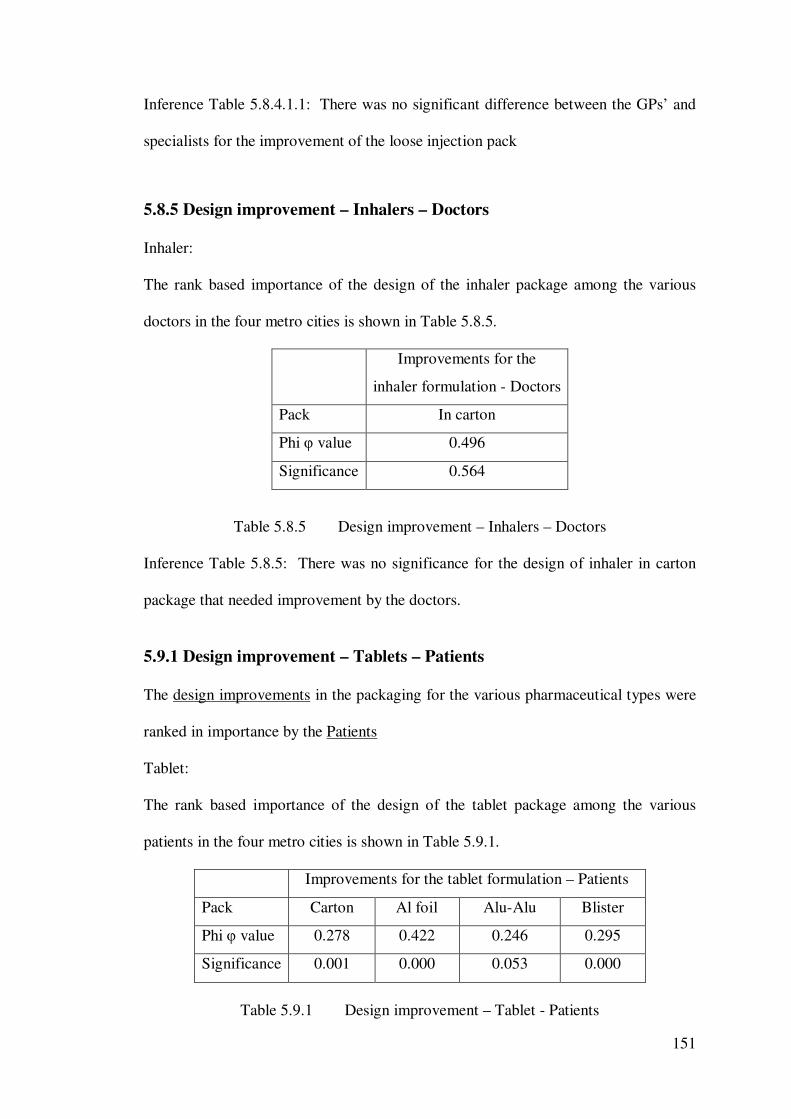
151
Inference Table 5.8.4.1.1: There was no significant difference between the GPs’ and
specialists for the improvement of the loose injection pack
5.8.5 Design improvement – Inhalers – Doctors
Inhaler:
The rank based importance of the design of the inhaler package among the various
doctors in the four metro cities is shown in Table 5.8.5.
Improvements for the
inhaler formulation - Doctors
Pack In carton
Phi φ value 0.496
Significance 0.564
Table 5.8.5 Design improvement – Inhalers – Doctors
Inference Table 5.8.5: There was no significance for the design of inhaler in carton
package that needed improvement by the doctors.
5.9.1 Design improvement – Tablets – Patients
The design improvements in the packaging for the various pharmaceutical types were
ranked in importance by the Patients
Tablet:
The rank based importance of the design of the tablet package among the various
patients in the four metro cities is shown in Table 5.9.1.
Improvements for the tablet formulation – Patients
Pack Carton Al foil Alu-Alu Blister
Phi φ value 0.278 0.422 0.246 0.295
Significance 0.001 0.000 0.053 0.000
Table 5.9.1 Design improvement – Tablet - Patients
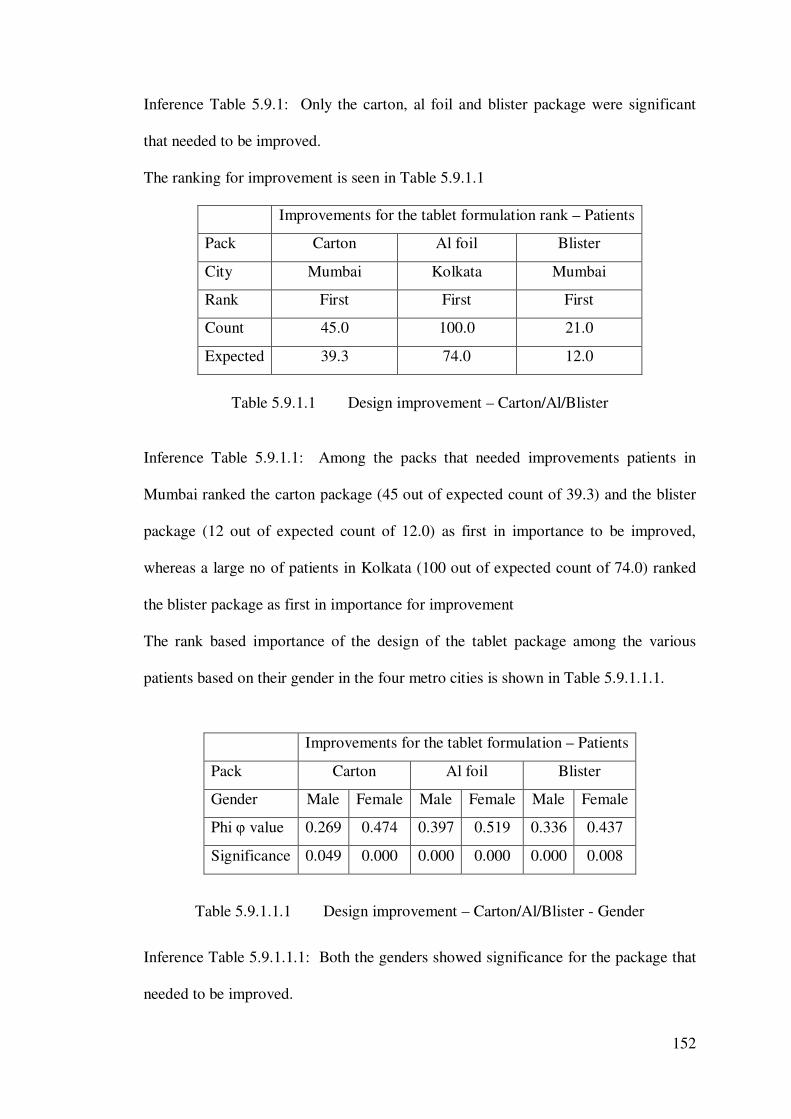
152
Inference Table 5.9.1: Only the carton, al foil and blister package were significant
that needed to be improved.
The ranking for improvement is seen in Table 5.9.1.1
Improvements for the tablet formulation rank – Patients
Pack Carton Al foil Blister
City Mumbai Kolkata Mumbai
Rank First First First
Count 45.0 100.0 21.0
Expected 39.3 74.0 12.0
Table 5.9.1.1 Design improvement – Carton/Al/Blister
Inference Table 5.9.1.1: Among the packs that needed improvements patients in
Mumbai ranked the carton package (45 out of expected count of 39.3) and the blister
package (12 out of expected count of 12.0) as first in importance to be improved,
whereas a large no of patients in Kolkata (100 out of expected count of 74.0) ranked
the blister package as first in importance for improvement
The rank based importance of the design of the tablet package among the various
patients based on their gender in the four metro cities is shown in Table 5.9.1.1.1.
Improvements for the tablet formulation – Patients
Pack Carton Al foil Blister
Gender Male Female Male Female Male Female
Phi φ value 0.269 0.474 0.397 0.519 0.336 0.437
Significance 0.049 0.000 0.000 0.000 0.000 0.008
Table 5.9.1.1.1 Design improvement – Carton/Al/Blister - Gender
Inference Table 5.9.1.1.1: Both the genders showed significance for the package that
needed to be improved.
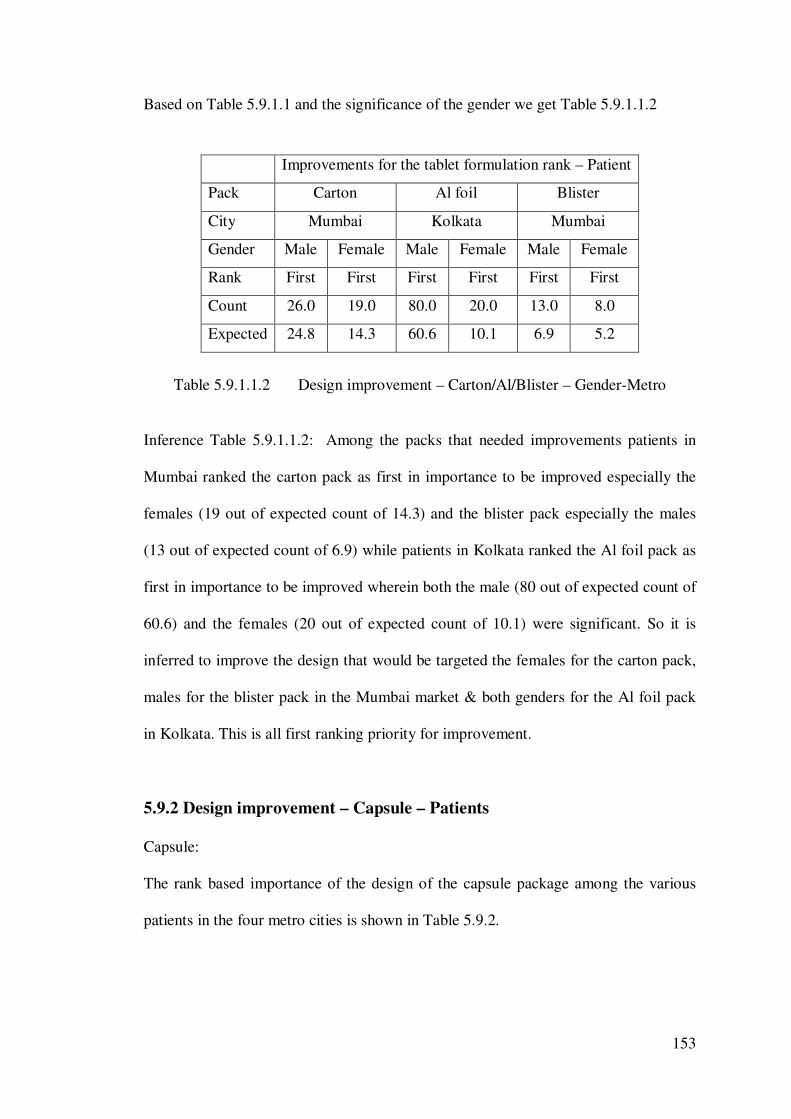
153
Based on Table 5.9.1.1 and the significance of the gender we get Table 5.9.1.1.2
Improvements for the tablet formulation rank – Patient
Pack Carton Al foil Blister
City Mumbai Kolkata Mumbai
Gender Male Female Male Female Male Female
Rank First First First First First First
Count 26.0 19.0 80.0 20.0 13.0 8.0
Expected 24.8 14.3 60.6 10.1 6.9 5.2
Table 5.9.1.1.2 Design improvement – Carton/Al/Blister – Gender-Metro
Inference Table 5.9.1.1.2: Among the packs that needed improvements patients in
Mumbai ranked the carton pack as first in importance to be improved especially the
females (19 out of expected count of 14.3) and the blister pack especially the males
(13 out of expected count of 6.9) while patients in Kolkata ranked the Al foil pack as
first in importance to be improved wherein both the male (80 out of expected count of
60.6) and the females (20 out of expected count of 10.1) were significant. So it is
inferred to improve the design that would be targeted the females for the carton pack,
males for the blister pack in the Mumbai market & both genders for the Al foil pack
in Kolkata. This is all first ranking priority for improvement.
5.9.2 Design improvement – Capsule – Patients
Capsule:
The rank based importance of the design of the capsule package among the various
patients in the four metro cities is shown in Table 5.9.2.
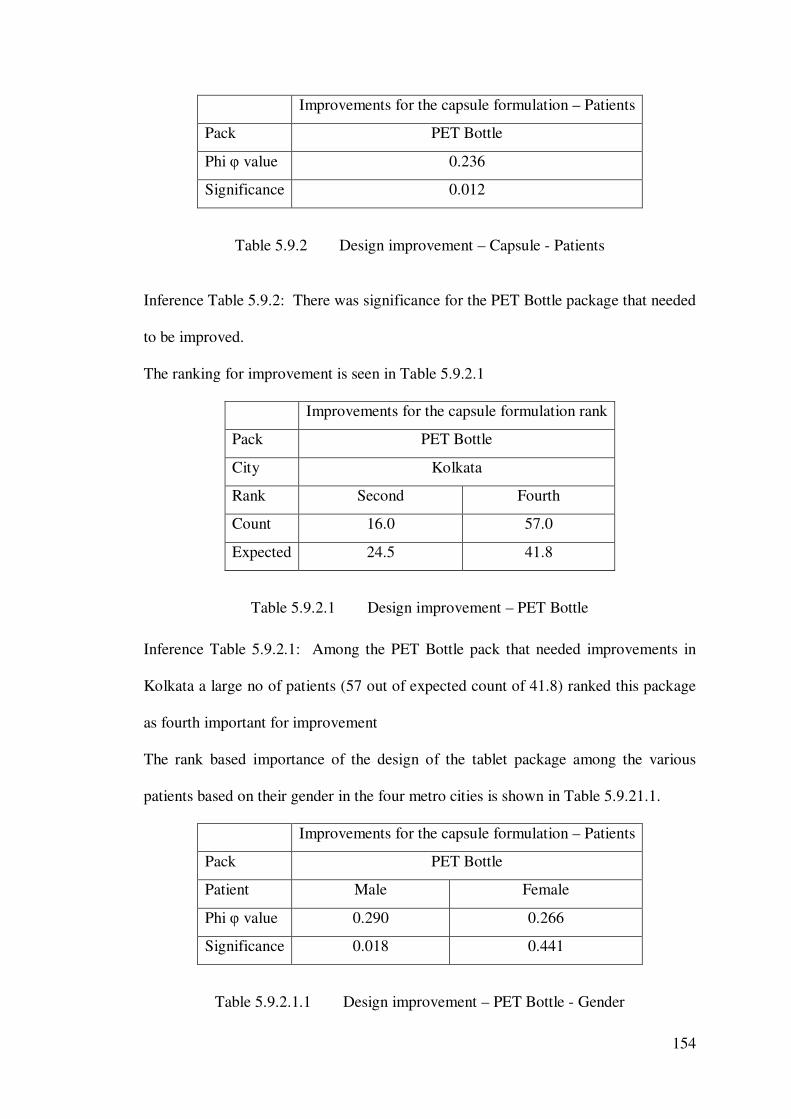
154
Improvements for the capsule formulation – Patients
Pack PET Bottle
Phi φ value 0.236
Significance 0.012
Table 5.9.2 Design improvement – Capsule - Patients
Inference Table 5.9.2: There was significance for the PET Bottle package that needed
to be improved.
The ranking for improvement is seen in Table 5.9.2.1
Improvements for the capsule formulation rank
Pack PET Bottle
City Kolkata
Rank Second Fourth
Count 16.0 57.0
Expected 24.5 41.8
Table 5.9.2.1 Design improvement – PET Bottle Inference Table 5.9.2.1: Among the PET Bottle pack that needed improvements in
Kolkata a large no of patients (57 out of expected count of 41.8) ranked this package
as fourth important for improvement
The rank based importance of the design of the tablet package among the various
patients based on their gender in the four metro cities is shown in Table 5.9.21.1.
Improvements for the capsule formulation – Patients
Pack PET Bottle
Patient Male Female
Phi φ value 0.290 0.266
Significance 0.018 0.441
Table 5.9.2.1.1 Design improvement – PET Bottle - Gender
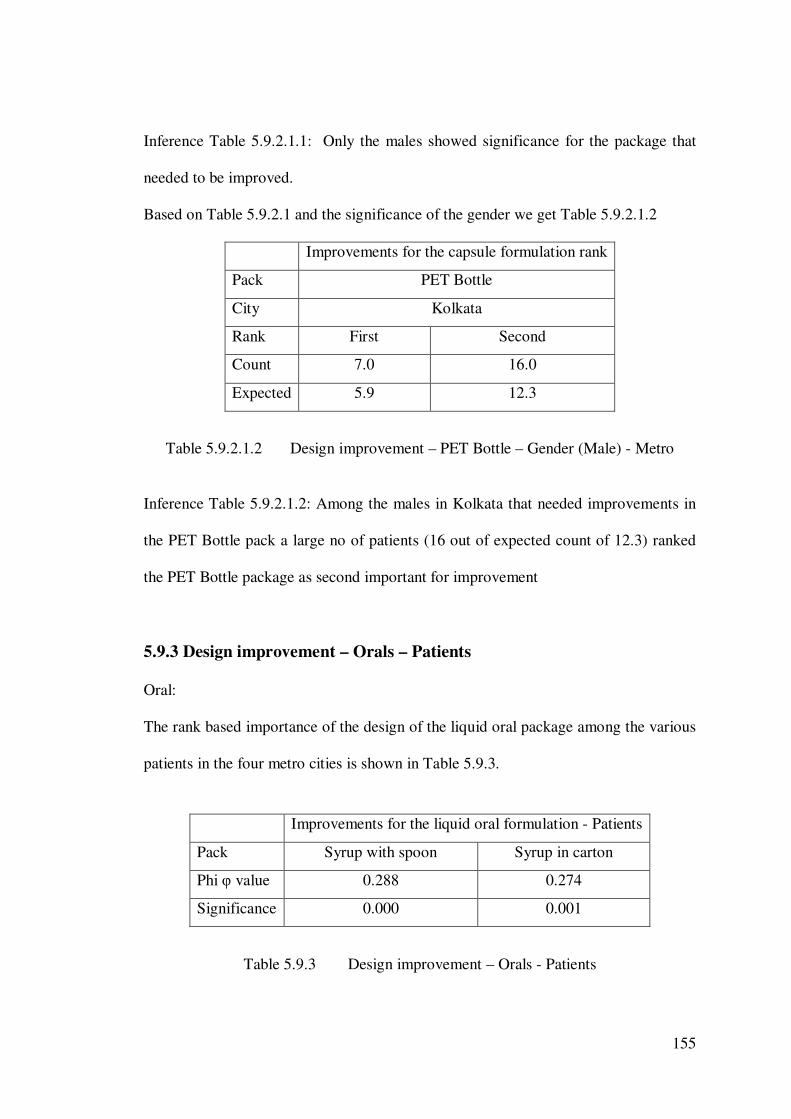
155
Inference Table 5.9.2.1.1: Only the males showed significance for the package that
needed to be improved.
Based on Table 5.9.2.1 and the significance of the gender we get Table 5.9.2.1.2
Improvements for the capsule formulation rank
Pack PET Bottle
City Kolkata
Rank First Second
Count 7.0 16.0
Expected 5.9 12.3
Table 5.9.2.1.2 Design improvement – PET Bottle – Gender (Male) - Metro
Inference Table 5.9.2.1.2: Among the males in Kolkata that needed improvements in
the PET Bottle pack a large no of patients (16 out of expected count of 12.3) ranked
the PET Bottle package as second important for improvement
5.9.3 Design improvement – Orals – Patients
Oral:
The rank based importance of the design of the liquid oral package among the various
patients in the four metro cities is shown in Table 5.9.3.
Improvements for the liquid oral formulation - Patients
Pack Syrup with spoon Syrup in carton
Phi φ value 0.288 0.274
Significance 0.000 0.001
Table 5.9.3 Design improvement – Orals - Patients
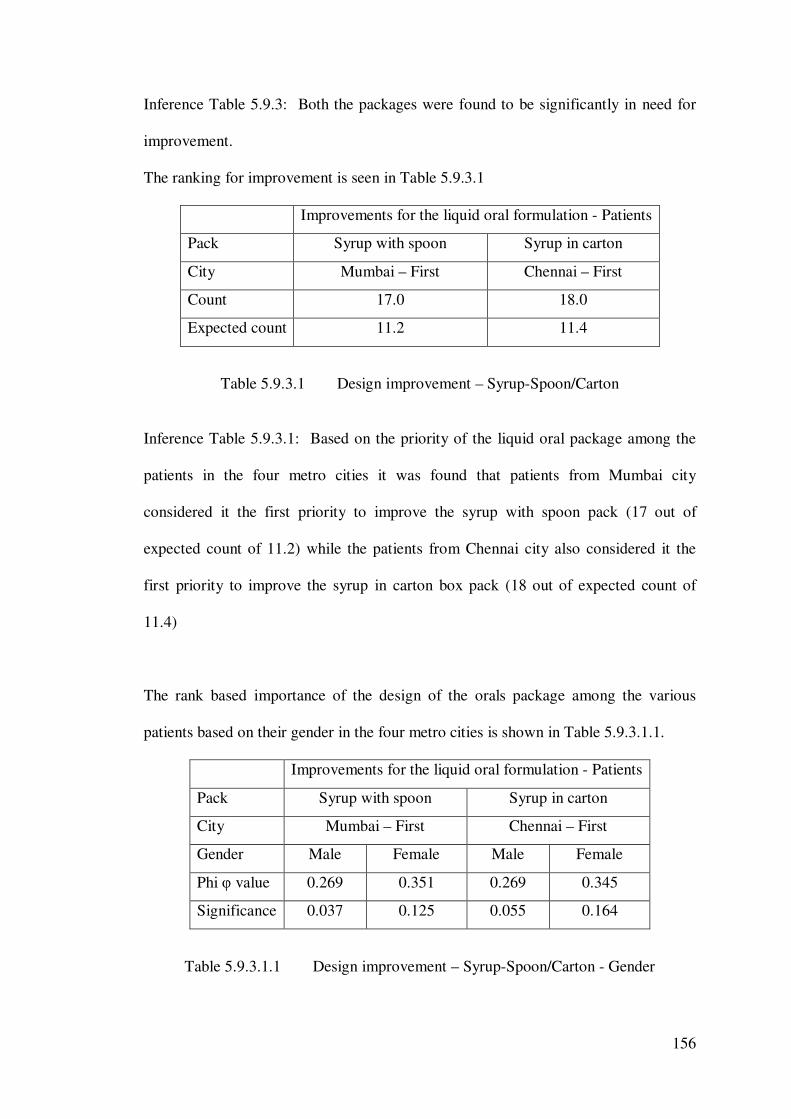
156
Inference Table 5.9.3: Both the packages were found to be significantly in need for
improvement.
The ranking for improvement is seen in Table 5.9.3.1
Improvements for the liquid oral formulation - Patients
Pack Syrup with spoon Syrup in carton
City Mumbai – First Chennai – First
Count 17.0 18.0
Expected count 11.2 11.4
Table 5.9.3.1 Design improvement – Syrup-Spoon/Carton
Inference Table 5.9.3.1: Based on the priority of the liquid oral package among the
patients in the four metro cities it was found that patients from Mumbai city
considered it the first priority to improve the syrup with spoon pack (17 out of
expected count of 11.2) while the patients from Chennai city also considered it the
first priority to improve the syrup in carton box pack (18 out of expected count of
11.4)
The rank based importance of the design of the orals package among the various
patients based on their gender in the four metro cities is shown in Table 5.9.3.1.1.
Improvements for the liquid oral formulation - Patients
Pack Syrup with spoon Syrup in carton
City Mumbai – First Chennai – First
Gender Male Female Male Female
Phi φ value 0.269 0.351 0.269 0.345
Significance 0.037 0.125 0.055 0.164
Table 5.9.3.1.1 Design improvement – Syrup-Spoon/Carton - Gender
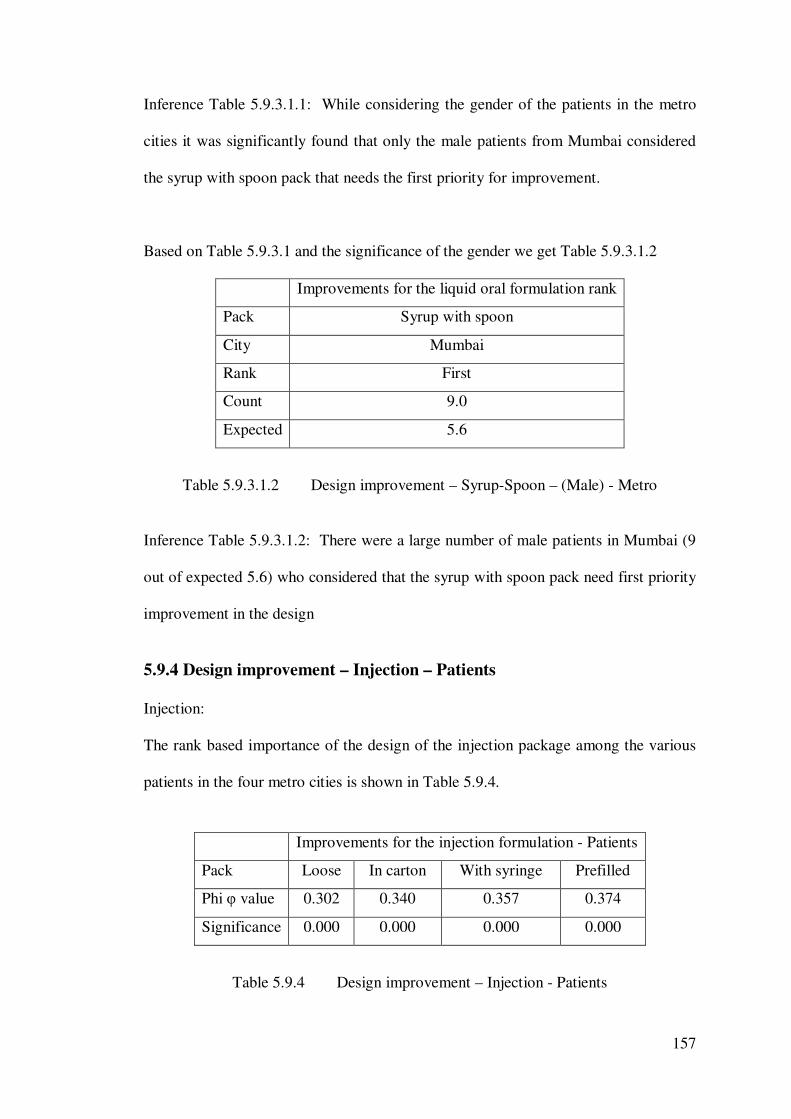
157
Inference Table 5.9.3.1.1: While considering the gender of the patients in the metro
cities it was significantly found that only the male patients from Mumbai considered
the syrup with spoon pack that needs the first priority for improvement.
Based on Table 5.9.3.1 and the significance of the gender we get Table 5.9.3.1.2
Improvements for the liquid oral formulation rank
Pack Syrup with spoon
City Mumbai
Rank First
Count 9.0
Expected 5.6
Table 5.9.3.1.2 Design improvement – Syrup-Spoon – (Male) - Metro
Inference Table 5.9.3.1.2: There were a large number of male patients in Mumbai (9
out of expected 5.6) who considered that the syrup with spoon pack need first priority
improvement in the design
5.9.4 Design improvement – Injection – Patients
Injection:
The rank based importance of the design of the injection package among the various
patients in the four metro cities is shown in Table 5.9.4.
Improvements for the injection formulation - Patients
Pack Loose In carton With syringe Prefilled
Phi φ value 0.302 0.340 0.357 0.374
Significance 0.000 0.000 0.000 0.000
Table 5.9.4 Design improvement – Injection - Patients
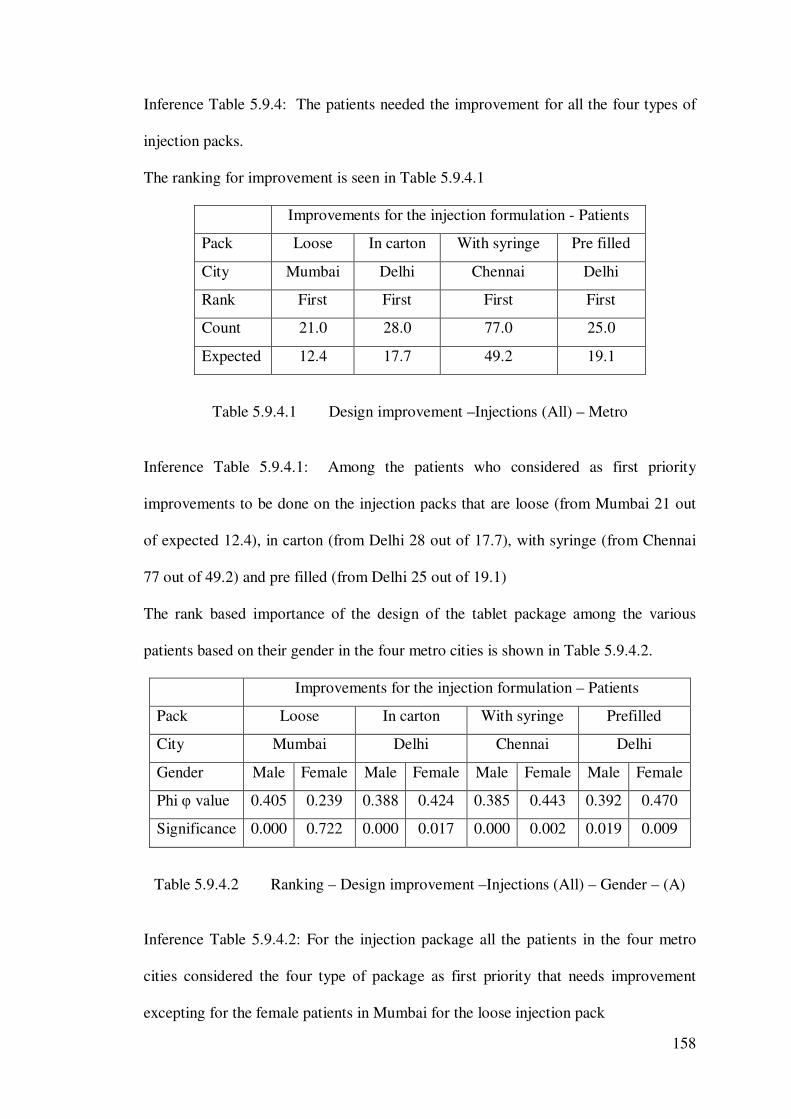
158
Inference Table 5.9.4: The patients needed the improvement for all the four types of
injection packs.
The ranking for improvement is seen in Table 5.9.4.1
Improvements for the injection formulation - Patients
Pack Loose In carton With syringe Pre filled
City Mumbai Delhi Chennai Delhi
Rank First First First First
Count 21.0 28.0 77.0 25.0
Expected 12.4 17.7 49.2 19.1
Table 5.9.4.1 Design improvement –Injections (All) – Metro
Inference Table 5.9.4.1: Among the patients who considered as first priority
improvements to be done on the injection packs that are loose (from Mumbai 21 out
of expected 12.4), in carton (from Delhi 28 out of 17.7), with syringe (from Chennai
77 out of 49.2) and pre filled (from Delhi 25 out of 19.1)
The rank based importance of the design of the tablet package among the various
patients based on their gender in the four metro cities is shown in Table 5.9.4.2.
Improvements for the injection formulation – Patients
Pack Loose In carton With syringe Prefilled
City Mumbai Delhi Chennai Delhi
Gender Male Female Male Female Male Female Male Female
Phi φ value 0.405 0.239 0.388 0.424 0.385 0.443 0.392 0.470
Significance 0.000 0.722 0.000 0.017 0.000 0.002 0.019 0.009
Table 5.9.4.2 Ranking – Design improvement –Injections (All) – Gender – (A)
Inference Table 5.9.4.2: For the injection package all the patients in the four metro
cities considered the four type of package as first priority that needs improvement
excepting for the female patients in Mumbai for the loose injection pack
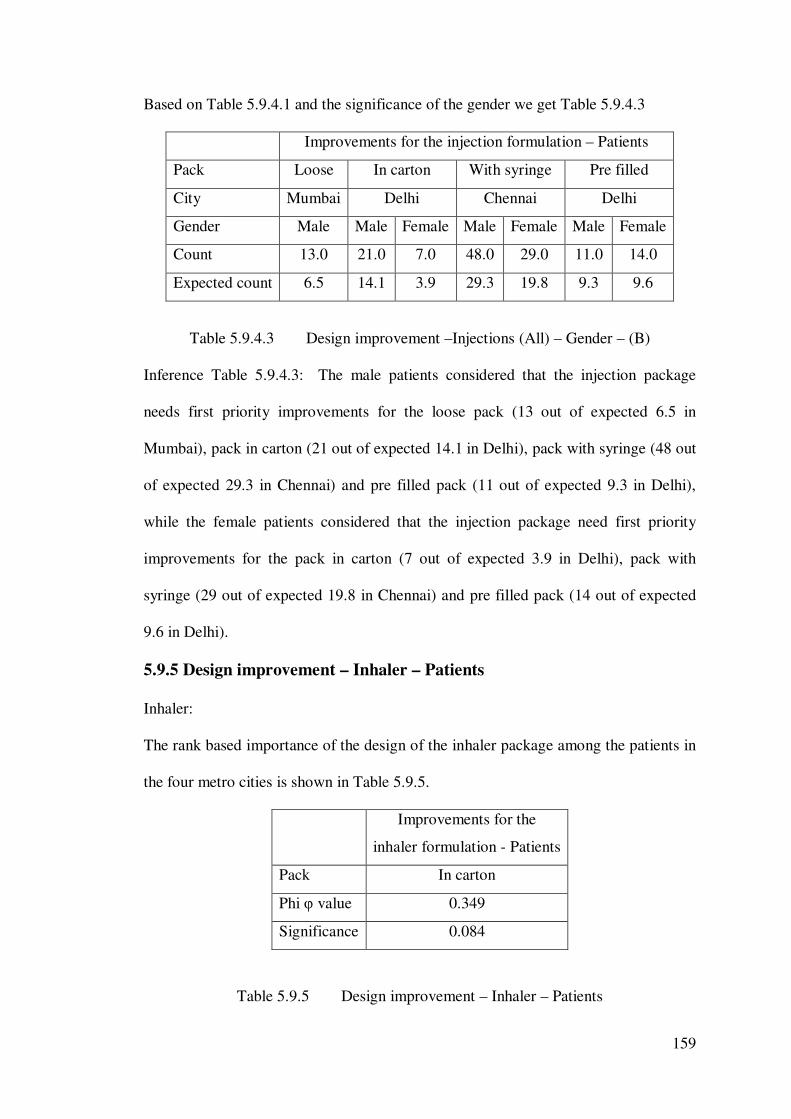
159
Based on Table 5.9.4.1 and the significance of the gender we get Table 5.9.4.3
Improvements for the injection formulation – Patients
Pack Loose In carton With syringe Pre filled
City Mumbai Delhi Chennai Delhi
Gender Male Male Female Male Female Male Female
Count 13.0 21.0 7.0 48.0 29.0 11.0 14.0
Expected count 6.5 14.1 3.9 29.3 19.8 9.3 9.6
Table 5.9.4.3 Design improvement –Injections (All) – Gender – (B)
Inference Table 5.9.4.3: The male patients considered that the injection package
needs first priority improvements for the loose pack (13 out of expected 6.5 in
Mumbai), pack in carton (21 out of expected 14.1 in Delhi), pack with syringe (48 out
of expected 29.3 in Chennai) and pre filled pack (11 out of expected 9.3 in Delhi),
while the female patients considered that the injection package need first priority
improvements for the pack in carton (7 out of expected 3.9 in Delhi), pack with
syringe (29 out of expected 19.8 in Chennai) and pre filled pack (14 out of expected
9.6 in Delhi).
5.9.5 Design improvement – Inhaler – Patients
Inhaler:
The rank based importance of the design of the inhaler package among the patients in
the four metro cities is shown in Table 5.9.5.
Improvements for the
inhaler formulation - Patients
Pack In carton
Phi φ value 0.349
Significance 0.084
Table 5.9.5 Design improvement – Inhaler – Patients
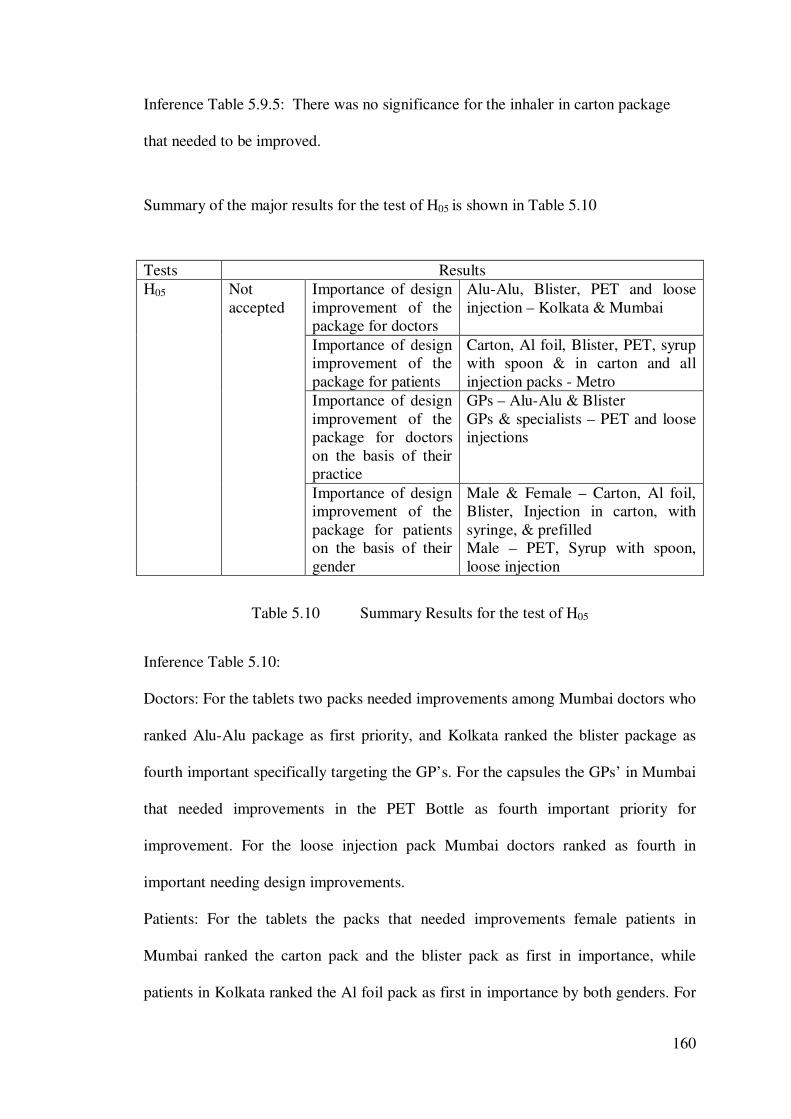
160
Inference Table 5.9.5: There was no significance for the inhaler in carton package
that needed to be improved.
Summary of the major results for the test of H05 is shown in Table 5.10
Tests Results H05 Not
accepted Importance of design improvement of the package for doctors
Alu-Alu, Blister, PET and loose injection – Kolkata & Mumbai
Importance of design improvement of the package for patients
Carton, Al foil, Blister, PET, syrup with spoon & in carton and all injection packs - Metro
Importance of design improvement of the package for doctors on the basis of their practice
GPs – Alu-Alu & Blister GPs & specialists – PET and loose injections
Importance of design improvement of the package for patients on the basis of their gender
Male & Female – Carton, Al foil, Blister, Injection in carton, with syringe, & prefilled Male – PET, Syrup with spoon, loose injection
Table 5.10 Summary Results for the test of H05
Inference Table 5.10:
Doctors: For the tablets two packs needed improvements among Mumbai doctors who
ranked Alu-Alu package as first priority, and Kolkata ranked the blister package as
fourth important specifically targeting the GP’s. For the capsules the GPs’ in Mumbai
that needed improvements in the PET Bottle as fourth important priority for
improvement. For the loose injection pack Mumbai doctors ranked as fourth in
important needing design improvements.
Patients: For the tablets the packs that needed improvements female patients in
Mumbai ranked the carton pack and the blister pack as first in importance, while
patients in Kolkata ranked the Al foil pack as first in importance by both genders. For
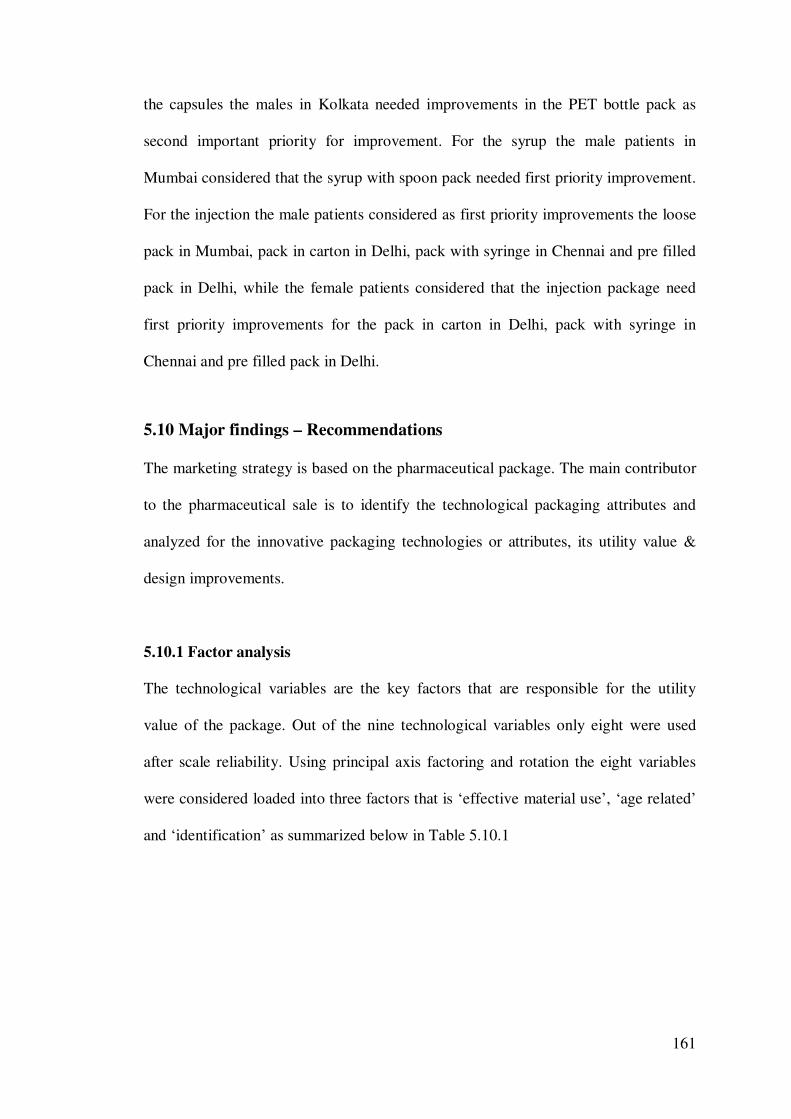
161
the capsules the males in Kolkata needed improvements in the PET bottle pack as
second important priority for improvement. For the syrup the male patients in
Mumbai considered that the syrup with spoon pack needed first priority improvement.
For the injection the male patients considered as first priority improvements the loose
pack in Mumbai, pack in carton in Delhi, pack with syringe in Chennai and pre filled
pack in Delhi, while the female patients considered that the injection package need
first priority improvements for the pack in carton in Delhi, pack with syringe in
Chennai and pre filled pack in Delhi.
5.10 Major findings – Recommendations
The marketing strategy is based on the pharmaceutical package. The main contributor
to the pharmaceutical sale is to identify the technological packaging attributes and
analyzed for the innovative packaging technologies or attributes, its utility value &
design improvements.
5.10.1 Factor analysis
The technological variables are the key factors that are responsible for the utility
value of the package. Out of the nine technological variables only eight were used
after scale reliability. Using principal axis factoring and rotation the eight variables
were considered loaded into three factors that is ‘effective material use’, ‘age related’
and ‘identification’ as summarized below in Table 5.10.1
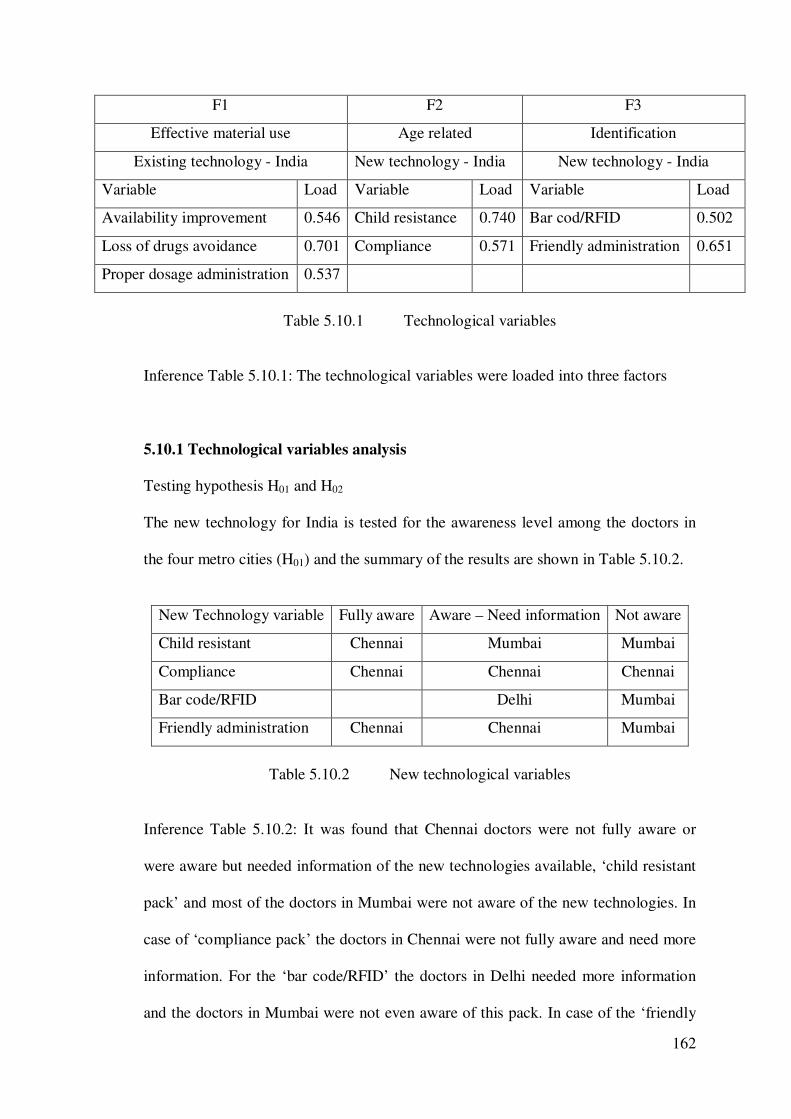
162
F1 F2 F3
Effective material use Age related Identification
Existing technology - India New technology - India New technology - India
Variable Load Variable Load Variable Load
Availability improvement 0.546 Child resistance 0.740 Bar cod/RFID 0.502
Loss of drugs avoidance 0.701 Compliance 0.571 Friendly administration 0.651
Proper dosage administration 0.537
Table 5.10.1 Technological variables
Inference Table 5.10.1: The technological variables were loaded into three factors
5.10.1 Technological variables analysis
Testing hypothesis H01 and H02
The new technology for India is tested for the awareness level among the doctors in
the four metro cities (H01) and the summary of the results are shown in Table 5.10.2.
New Technology variable Fully aware Aware – Need information Not aware
Child resistant Chennai Mumbai Mumbai
Compliance Chennai Chennai Chennai
Bar code/RFID Delhi Mumbai
Friendly administration Chennai Chennai Mumbai
Table 5.10.2 New technological variables
Inference Table 5.10.2: It was found that Chennai doctors were not fully aware or
were aware but needed information of the new technologies available, ‘child resistant
pack’ and most of the doctors in Mumbai were not aware of the new technologies. In
case of ‘compliance pack’ the doctors in Chennai were not fully aware and need more
information. For the ‘bar code/RFID’ the doctors in Delhi needed more information
and the doctors in Mumbai were not even aware of this pack. In case of the ‘friendly
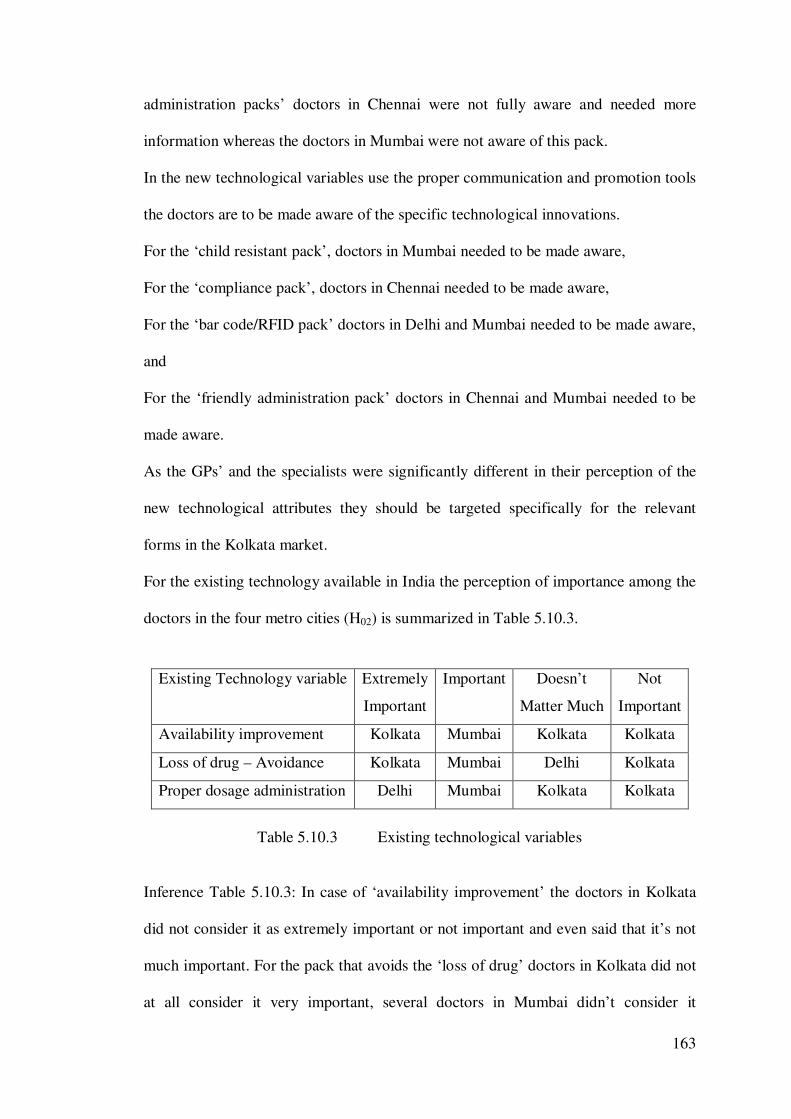
163
administration packs’ doctors in Chennai were not fully aware and needed more
information whereas the doctors in Mumbai were not aware of this pack.
In the new technological variables use the proper communication and promotion tools
the doctors are to be made aware of the specific technological innovations.
For the ‘child resistant pack’, doctors in Mumbai needed to be made aware,
For the ‘compliance pack’, doctors in Chennai needed to be made aware,
For the ‘bar code/RFID pack’ doctors in Delhi and Mumbai needed to be made aware,
and
For the ‘friendly administration pack’ doctors in Chennai and Mumbai needed to be
made aware.
As the GPs’ and the specialists were significantly different in their perception of the
new technological attributes they should be targeted specifically for the relevant
forms in the Kolkata market.
For the existing technology available in India the perception of importance among the
doctors in the four metro cities (H02) is summarized in Table 5.10.3.
Existing Technology variable Extremely
Important
Important Doesn’t
Matter Much
Not
Important
Availability improvement Kolkata Mumbai Kolkata Kolkata
Loss of drug – Avoidance Kolkata Mumbai Delhi Kolkata
Proper dosage administration Delhi Mumbai Kolkata Kolkata
Table 5.10.3 Existing technological variables
Inference Table 5.10.3: In case of ‘availability improvement’ the doctors in Kolkata
did not consider it as extremely important or not important and even said that it’s not
much important. For the pack that avoids the ‘loss of drug’ doctors in Kolkata did not
at all consider it very important, several doctors in Mumbai didn’t consider it
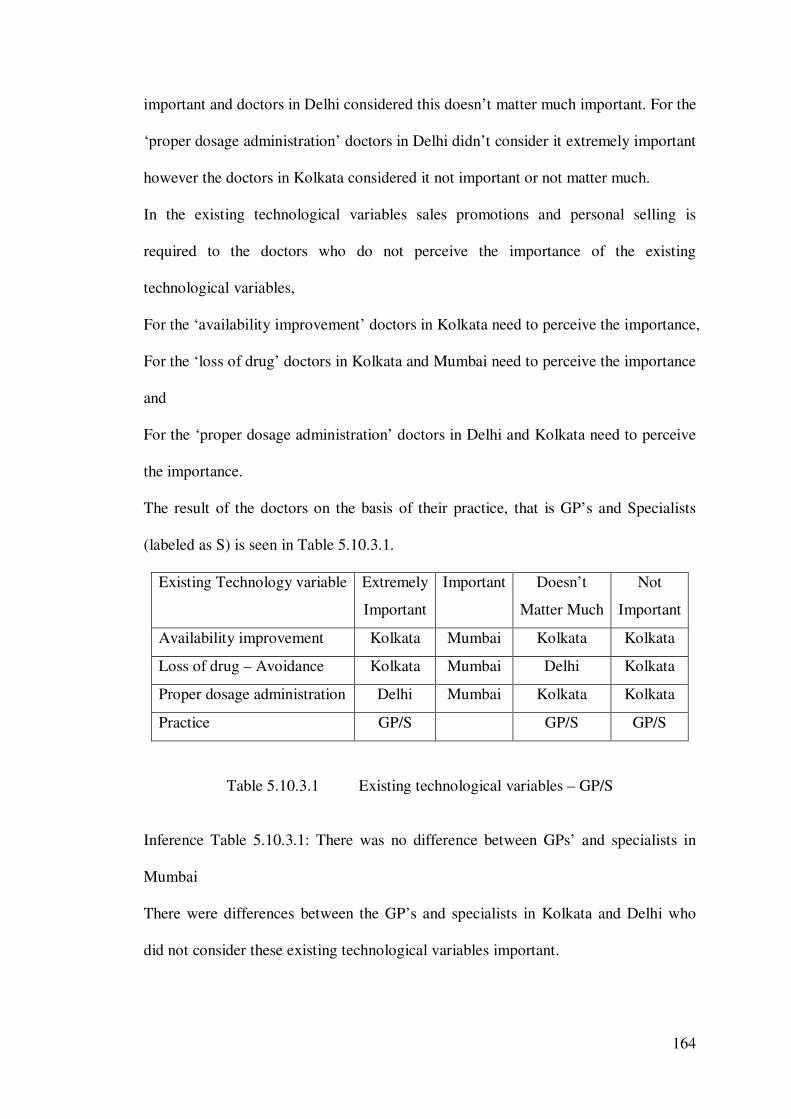
164
important and doctors in Delhi considered this doesn’t matter much important. For the
‘proper dosage administration’ doctors in Delhi didn’t consider it extremely important
however the doctors in Kolkata considered it not important or not matter much.
In the existing technological variables sales promotions and personal selling is
required to the doctors who do not perceive the importance of the existing
technological variables,
For the ‘availability improvement’ doctors in Kolkata need to perceive the importance,
For the ‘loss of drug’ doctors in Kolkata and Mumbai need to perceive the importance
and
For the ‘proper dosage administration’ doctors in Delhi and Kolkata need to perceive
the importance.
The result of the doctors on the basis of their practice, that is GP’s and Specialists
(labeled as S) is seen in Table 5.10.3.1.
Existing Technology variable Extremely
Important
Important Doesn’t
Matter Much
Not
Important
Availability improvement Kolkata Mumbai Kolkata Kolkata
Loss of drug – Avoidance Kolkata Mumbai Delhi Kolkata
Proper dosage administration Delhi Mumbai Kolkata Kolkata
Practice GP/S GP/S GP/S
Table 5.10.3.1 Existing technological variables – GP/S
Inference Table 5.10.3.1: There was no difference between GPs’ and specialists in
Mumbai
There were differences between the GP’s and specialists in Kolkata and Delhi who
did not consider these existing technological variables important.
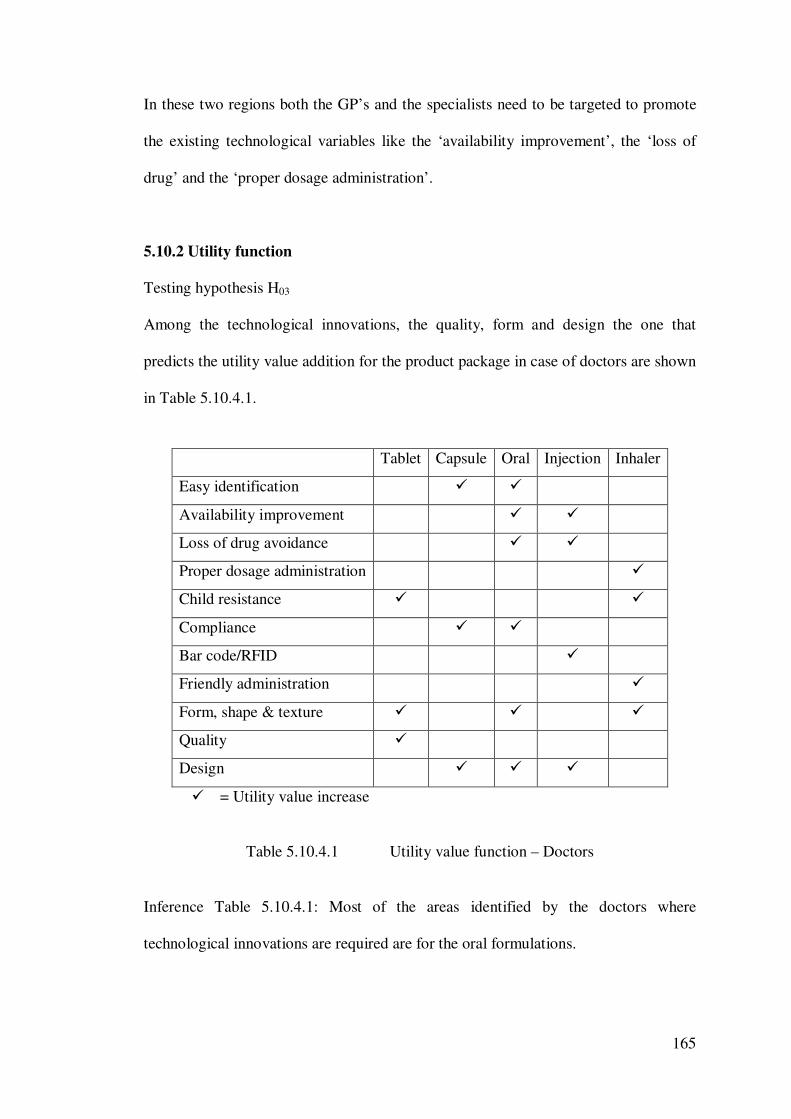
165
In these two regions both the GP’s and the specialists need to be targeted to promote
the existing technological variables like the ‘availability improvement’, the ‘loss of
drug’ and the ‘proper dosage administration’.
5.10.2 Utility function
Testing hypothesis H03
Among the technological innovations, the quality, form and design the one that
predicts the utility value addition for the product package in case of doctors are shown
in Table 5.10.4.1.
Tablet Capsule Oral Injection Inhaler
Easy identification � �
Availability improvement � �
Loss of drug avoidance � �
Proper dosage administration �
Child resistance � �
Compliance � �
Bar code/RFID �
Friendly administration �
Form, shape & texture � � �
Quality �
Design � � �
� = Utility value increase
Table 5.10.4.1 Utility value function – Doctors
Inference Table 5.10.4.1: Most of the areas identified by the doctors where
technological innovations are required are for the oral formulations.
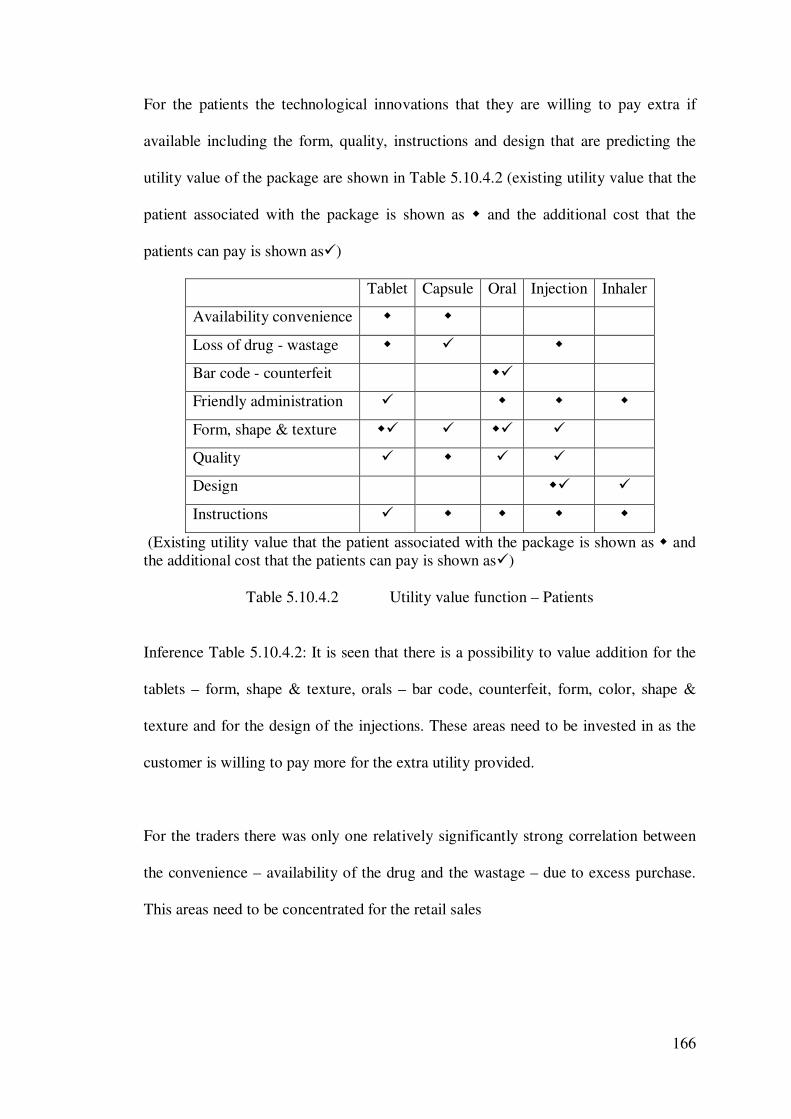
166
For the patients the technological innovations that they are willing to pay extra if
available including the form, quality, instructions and design that are predicting the
utility value of the package are shown in Table 5.10.4.2 (existing utility value that the
patient associated with the package is shown as � and the additional cost that the
patients can pay is shown as�)
Tablet Capsule Oral Injection Inhaler
Availability convenience � �
Loss of drug - wastage � � �
Bar code - counterfeit ��
Friendly administration � � � �
Form, shape & texture �� � �� �
Quality � � � �
Design �� �
Instructions � � � � �
(Existing utility value that the patient associated with the package is shown as � and the additional cost that the patients can pay is shown as�)
Table 5.10.4.2 Utility value function – Patients
Inference Table 5.10.4.2: It is seen that there is a possibility to value addition for the
tablets – form, shape & texture, orals – bar code, counterfeit, form, color, shape &
texture and for the design of the injections. These areas need to be invested in as the
customer is willing to pay more for the extra utility provided.
For the traders there was only one relatively significantly strong correlation between
the convenience – availability of the drug and the wastage – due to excess purchase.
This areas need to be concentrated for the retail sales
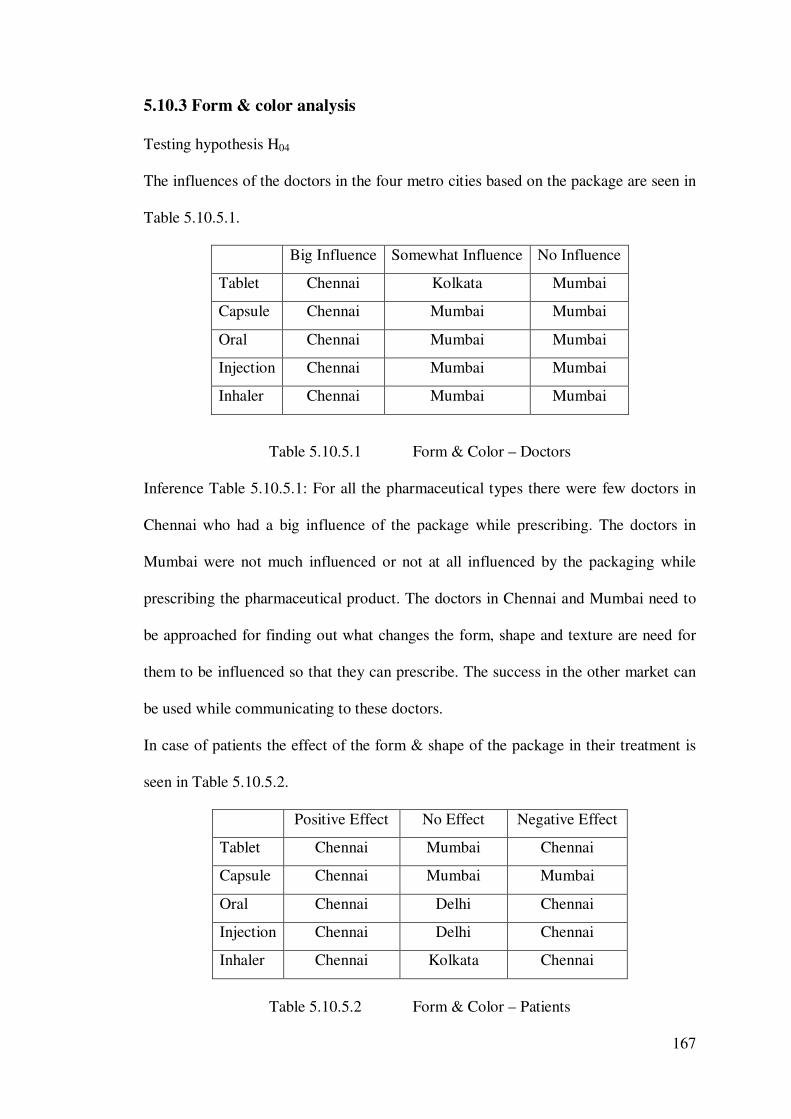
167
5.10.3 Form & color analysis
Testing hypothesis H04
The influences of the doctors in the four metro cities based on the package are seen in
Table 5.10.5.1.
Big Influence Somewhat Influence No Influence
Tablet Chennai Kolkata Mumbai
Capsule Chennai Mumbai Mumbai
Oral Chennai Mumbai Mumbai
Injection Chennai Mumbai Mumbai
Inhaler Chennai Mumbai Mumbai
Table 5.10.5.1 Form & Color – Doctors
Inference Table 5.10.5.1: For all the pharmaceutical types there were few doctors in
Chennai who had a big influence of the package while prescribing. The doctors in
Mumbai were not much influenced or not at all influenced by the packaging while
prescribing the pharmaceutical product. The doctors in Chennai and Mumbai need to
be approached for finding out what changes the form, shape and texture are need for
them to be influenced so that they can prescribe. The success in the other market can
be used while communicating to these doctors.
In case of patients the effect of the form & shape of the package in their treatment is
seen in Table 5.10.5.2.
Positive Effect No Effect Negative Effect
Tablet Chennai Mumbai Chennai
Capsule Chennai Mumbai Mumbai
Oral Chennai Delhi Chennai
Injection Chennai Delhi Chennai
Inhaler Chennai Kolkata Chennai
Table 5.10.5.2 Form & Color – Patients
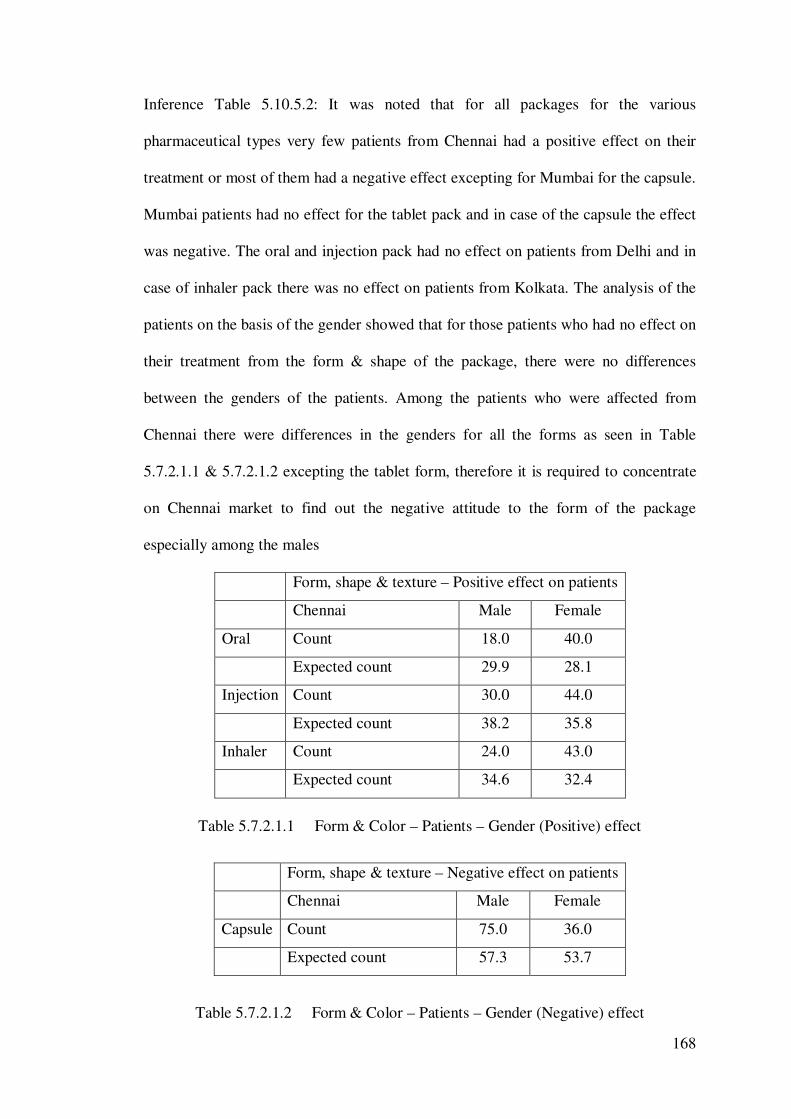
168
Inference Table 5.10.5.2: It was noted that for all packages for the various
pharmaceutical types very few patients from Chennai had a positive effect on their
treatment or most of them had a negative effect excepting for Mumbai for the capsule.
Mumbai patients had no effect for the tablet pack and in case of the capsule the effect
was negative. The oral and injection pack had no effect on patients from Delhi and in
case of inhaler pack there was no effect on patients from Kolkata. The analysis of the
patients on the basis of the gender showed that for those patients who had no effect on
their treatment from the form & shape of the package, there were no differences
between the genders of the patients. Among the patients who were affected from
Chennai there were differences in the genders for all the forms as seen in Table
5.7.2.1.1 & 5.7.2.1.2 excepting the tablet form, therefore it is required to concentrate
on Chennai market to find out the negative attitude to the form of the package
especially among the males
Form, shape & texture – Positive effect on patients
Chennai Male Female
Oral Count 18.0 40.0
Expected count 29.9 28.1
Injection Count 30.0 44.0
Expected count 38.2 35.8
Inhaler Count 24.0 43.0
Expected count 34.6 32.4
Table 5.7.2.1.1 Form & Color – Patients – Gender (Positive) effect
Form, shape & texture – Negative effect on patients
Chennai Male Female
Capsule Count 75.0 36.0
Expected count 57.3 53.7
Table 5.7.2.1.2 Form & Color – Patients – Gender (Negative) effect
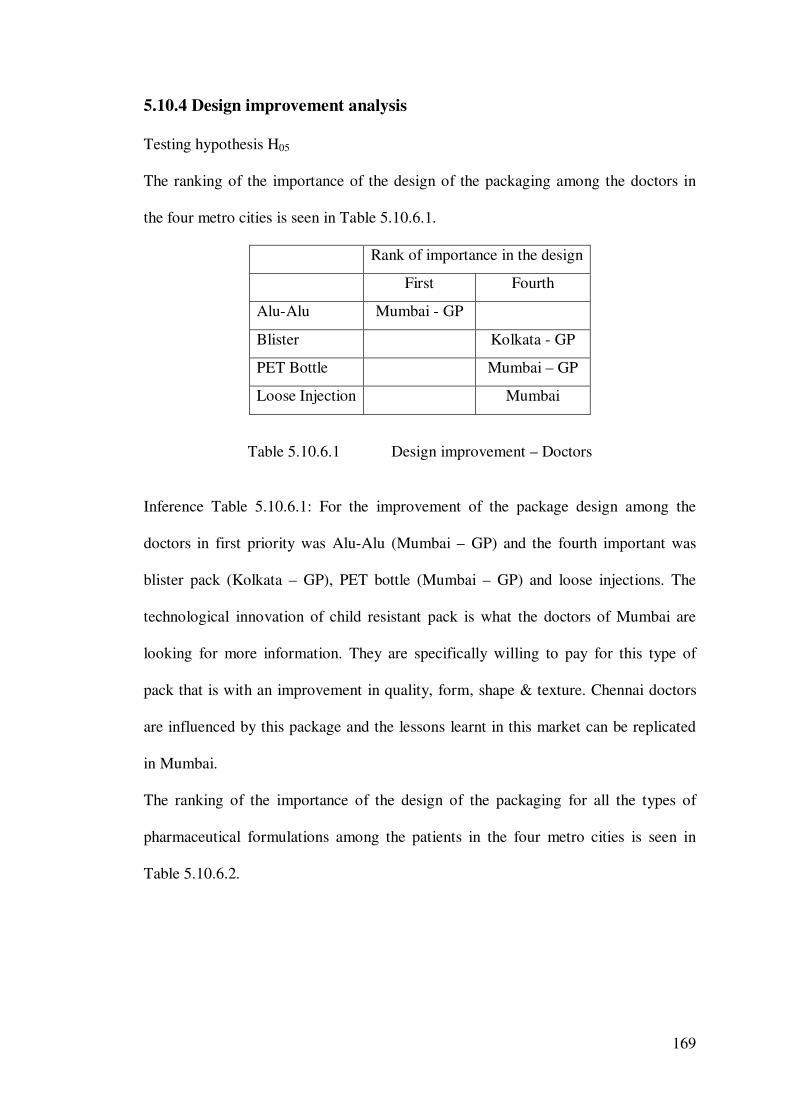
169
5.10.4 Design improvement analysis
Testing hypothesis H05
The ranking of the importance of the design of the packaging among the doctors in
the four metro cities is seen in Table 5.10.6.1.
Rank of importance in the design
First Fourth
Alu-Alu Mumbai - GP
Blister Kolkata - GP
PET Bottle Mumbai – GP
Loose Injection Mumbai
Table 5.10.6.1 Design improvement – Doctors
Inference Table 5.10.6.1: For the improvement of the package design among the
doctors in first priority was Alu-Alu (Mumbai – GP) and the fourth important was
blister pack (Kolkata – GP), PET bottle (Mumbai – GP) and loose injections. The
technological innovation of child resistant pack is what the doctors of Mumbai are
looking for more information. They are specifically willing to pay for this type of
pack that is with an improvement in quality, form, shape & texture. Chennai doctors
are influenced by this package and the lessons learnt in this market can be replicated
in Mumbai.
The ranking of the importance of the design of the packaging for all the types of
pharmaceutical formulations among the patients in the four metro cities is seen in
Table 5.10.6.2.
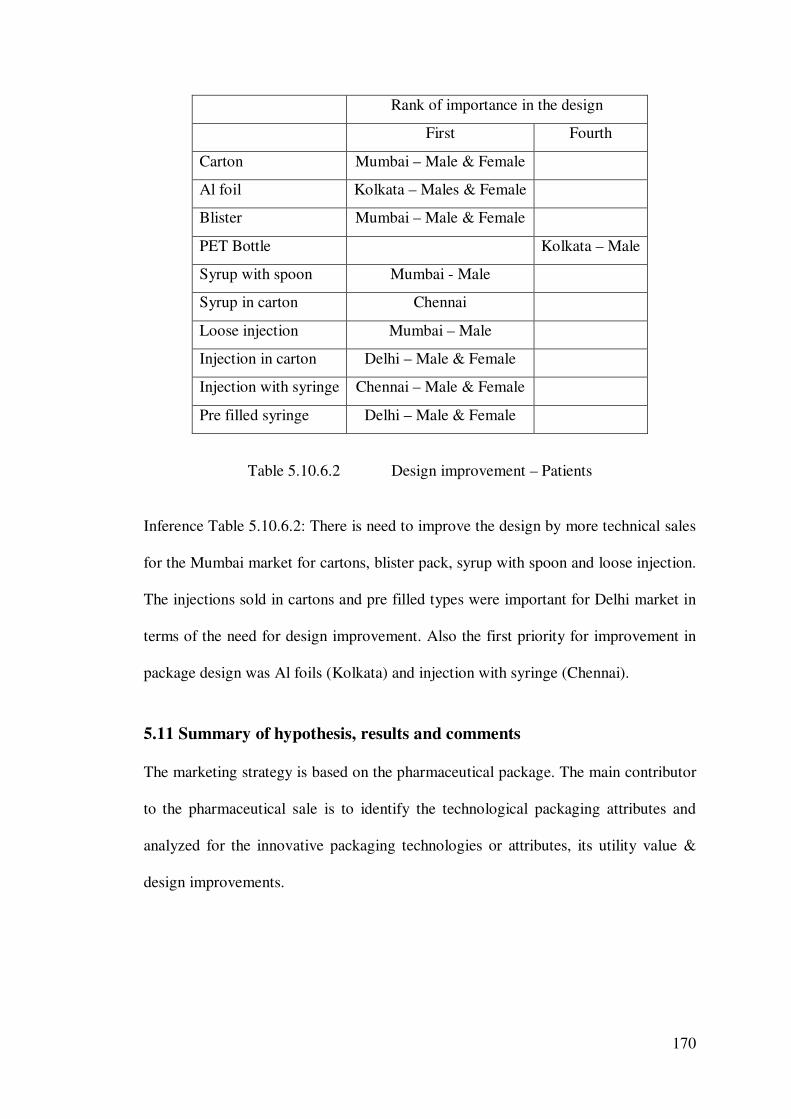
170
Rank of importance in the design
First Fourth
Carton Mumbai – Male & Female
Al foil Kolkata – Males & Female
Blister Mumbai – Male & Female
PET Bottle Kolkata – Male
Syrup with spoon Mumbai - Male
Syrup in carton Chennai
Loose injection Mumbai – Male
Injection in carton Delhi – Male & Female
Injection with syringe Chennai – Male & Female
Pre filled syringe Delhi – Male & Female
Table 5.10.6.2 Design improvement – Patients
Inference Table 5.10.6.2: There is need to improve the design by more technical sales
for the Mumbai market for cartons, blister pack, syrup with spoon and loose injection.
The injections sold in cartons and pre filled types were important for Delhi market in
terms of the need for design improvement. Also the first priority for improvement in
package design was Al foils (Kolkata) and injection with syringe (Chennai).
5.11 Summary of hypothesis, results and comments
The marketing strategy is based on the pharmaceutical package. The main contributor
to the pharmaceutical sale is to identify the technological packaging attributes and
analyzed for the innovative packaging technologies or attributes, its utility value &
design improvements.
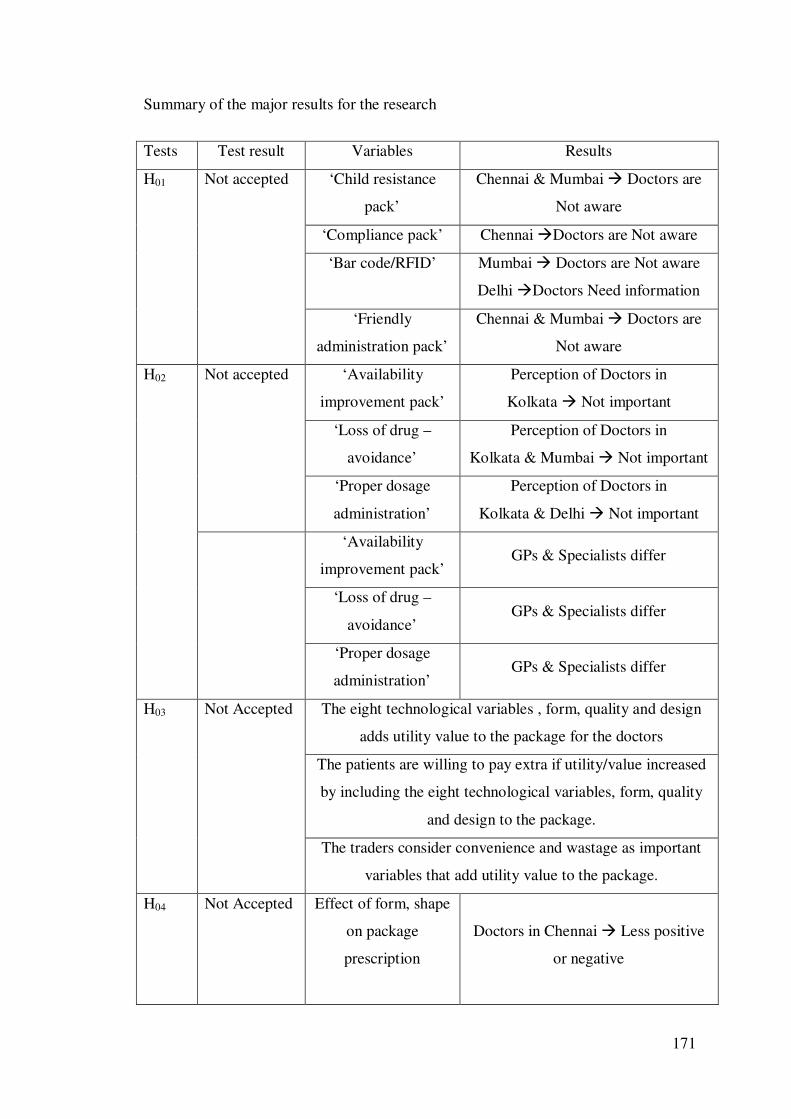
171
Summary of the major results for the research
Tests Test result Variables Results
H01 Not accepted ‘Child resistance
pack’
Chennai & Mumbai � Doctors are
Not aware
‘Compliance pack’ Chennai �Doctors are Not aware
‘Bar code/RFID’ Mumbai � Doctors are Not aware
Delhi �Doctors Need information
‘Friendly
administration pack’
Chennai & Mumbai � Doctors are
Not aware
H02 Not accepted ‘Availability
improvement pack’
Perception of Doctors in
Kolkata � Not important
‘Loss of drug –
avoidance’
Perception of Doctors in
Kolkata & Mumbai � Not important
‘Proper dosage
administration’
Perception of Doctors in
Kolkata & Delhi � Not important
‘Availability
improvement pack’ GPs & Specialists differ
‘Loss of drug –
avoidance’ GPs & Specialists differ
‘Proper dosage
administration’ GPs & Specialists differ
H03 Not Accepted The eight technological variables , form, quality and design
adds utility value to the package for the doctors
The patients are willing to pay extra if utility/value increased
by including the eight technological variables, form, quality
and design to the package.
The traders consider convenience and wastage as important
variables that add utility value to the package.
H04 Not Accepted Effect of form, shape
on package
prescription
Doctors in Chennai � Less positive
or negative
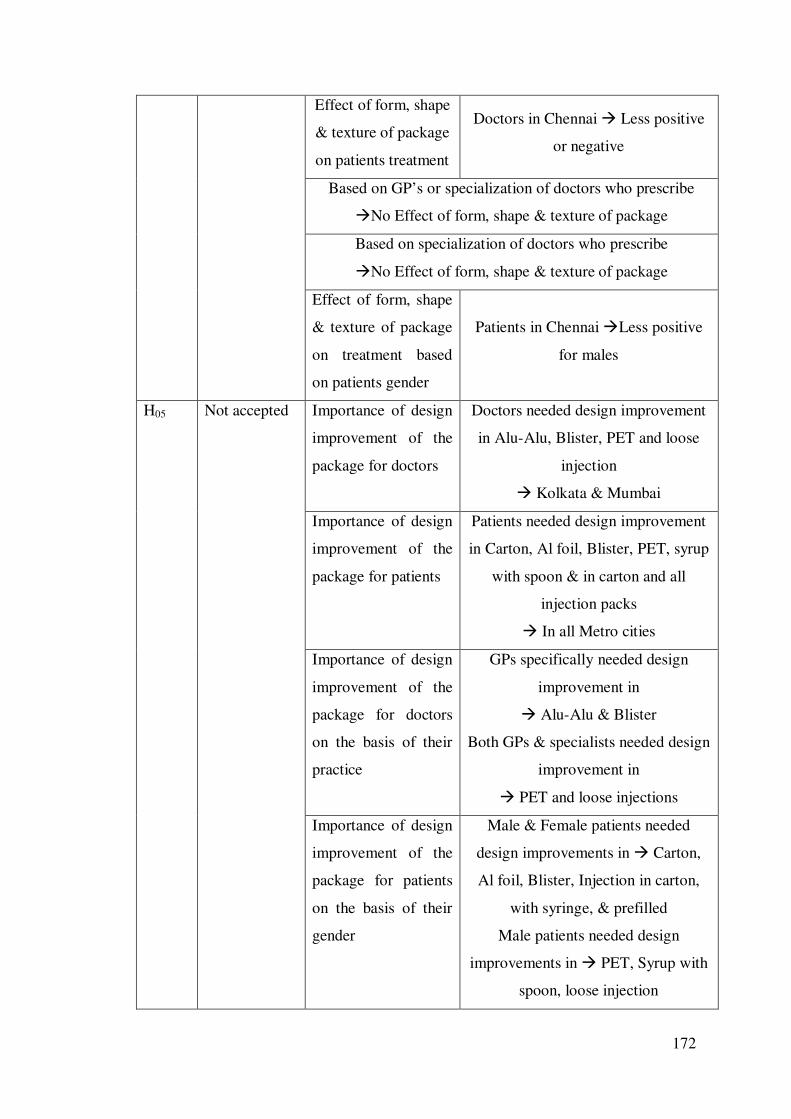
172
Effect of form, shape
& texture of package
on patients treatment
Doctors in Chennai � Less positive
or negative
Based on GP’s or specialization of doctors who prescribe
�No Effect of form, shape & texture of package
Based on specialization of doctors who prescribe
�No Effect of form, shape & texture of package
Effect of form, shape
& texture of package
on treatment based
on patients gender
Patients in Chennai �Less positive
for males
H05 Not accepted Importance of design
improvement of the
package for doctors
Doctors needed design improvement
in Alu-Alu, Blister, PET and loose
injection
� Kolkata & Mumbai
Importance of design
improvement of the
package for patients
Patients needed design improvement
in Carton, Al foil, Blister, PET, syrup
with spoon & in carton and all
injection packs
� In all Metro cities
Importance of design
improvement of the
package for doctors
on the basis of their
practice
GPs specifically needed design
improvement in
� Alu-Alu & Blister
Both GPs & specialists needed design
improvement in
� PET and loose injections
Importance of design
improvement of the
package for patients
on the basis of their
gender
Male & Female patients needed
design improvements in � Carton,
Al foil, Blister, Injection in carton,
with syringe, & prefilled
Male patients needed design
improvements in � PET, Syrup with
spoon, loose injection
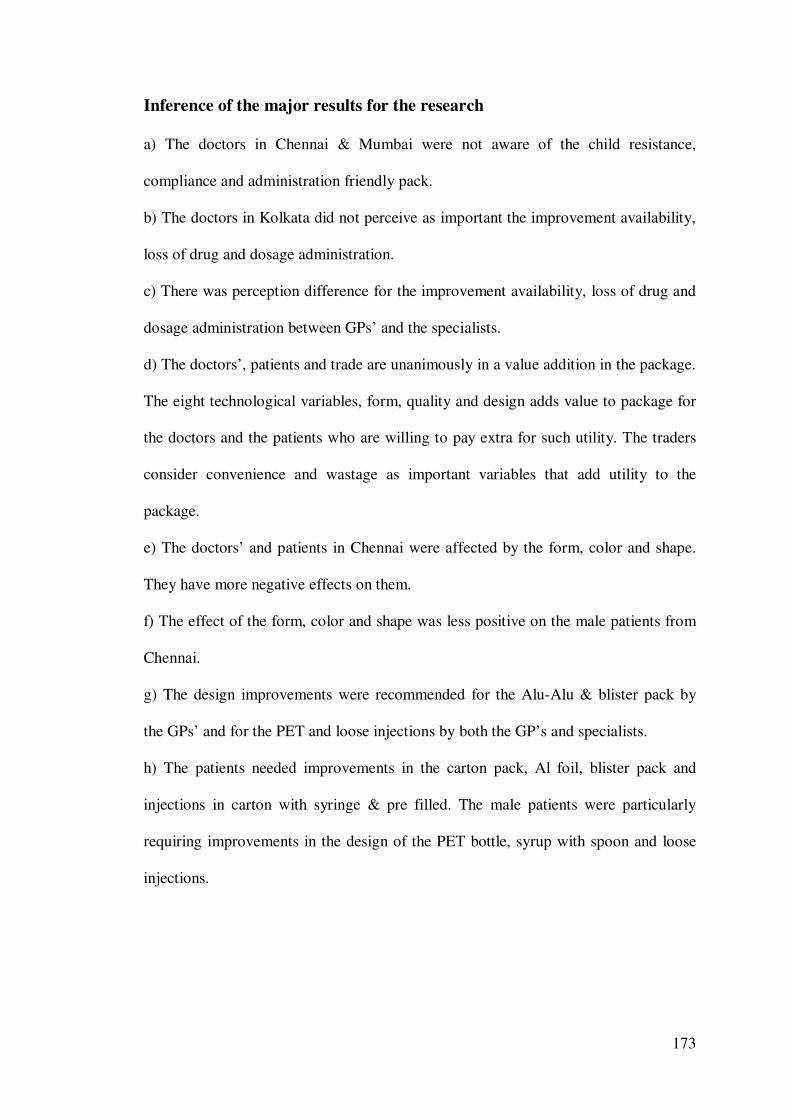
173
Inference of the major results for the research
a) The doctors in Chennai & Mumbai were not aware of the child resistance,
compliance and administration friendly pack.
b) The doctors in Kolkata did not perceive as important the improvement availability,
loss of drug and dosage administration.
c) There was perception difference for the improvement availability, loss of drug and
dosage administration between GPs’ and the specialists.
d) The doctors’, patients and trade are unanimously in a value addition in the package.
The eight technological variables, form, quality and design adds value to package for
the doctors and the patients who are willing to pay extra for such utility. The traders
consider convenience and wastage as important variables that add utility to the
package.
e) The doctors’ and patients in Chennai were affected by the form, color and shape.
They have more negative effects on them.
f) The effect of the form, color and shape was less positive on the male patients from
Chennai.
g) The design improvements were recommended for the Alu-Alu & blister pack by
the GPs’ and for the PET and loose injections by both the GP’s and specialists.
h) The patients needed improvements in the carton pack, Al foil, blister pack and
injections in carton with syringe & pre filled. The male patients were particularly
requiring improvements in the design of the PET bottle, syrup with spoon and loose
injections.
174
5.12 Managerial implications of the research
In the last decade there has been a 70% increase in R&D spending of over US$ 60
Billion. Only three out of ten marketed products produce revenues that match or
exceed the average R&D spending. Also it is noted that from over 100 discovery
ideas on an average it takes around 24 drug candidates to yield one marketed product
over the average time period of 15 years. In this connection manufacturers have
developed sophisticated packaging systems or marketing strategies based on the
existing packaging systems that would support the requirements of the pharmaceutical
products. As the technology and drug development advance the packaging systems
would become more sophisticated. This along with greater marketing skills would
be an important key differentiator in crowded therapeutic areas for solving industry
wide problems.
In an ever crowded market there is need to offer a differentiated product to the
customer. As the product cannot be changed the packaging thus becomes crucial to
offer a value added product to the customer. The contribution of pharmaceuticals to
the GDP is important and the ever increasing market with the growing middle class
makes the manager look at strategically positioning their product. It is the intent of the
company to have sustained advantage and the Lockhart model is useful starting point
to tackle the segmentation of the market and identification of the niche market as it
has the important utility function handled by humans.
The research focused on the utility function that is the key variable that needs to be
suitably addressed before the protection and communication functions are looked at.
It is seen that the relevant technologies related to the package explains the value
addition much clearly to the users. In addition the form, shape and texture also have
an effect on the users. Based on the identification of these factors the design
175
improvement on the packaging type is ranked in terms of importance. The study is
done across the four distinct zones in India that are culturally different in their
awareness and perceptions. The segmentation is done on the basis of the
specialization for the doctors and on the basis of the gender for the patients. The
segmenting, targeting and subsequent positioning will result in the proper
marketing strategy in terms of promotion and placing of the product using the
packaging.
5.13 Limitations of the research
This study focused only one quadrant of the Lockhart Model. The scope and
challenge would be to study the other quadrants like the detailed protection and
communication functions of packaging in the human, physical and ambient packaging
environments. The assumption was that the main market is in the Tier I cities of India.
However the dynamics of Tier I & II cities are rapidly changing and by 2015 several
of the Tier II cities would classify as Tier I. This however enhances the scope of this
research by the incorporation of new cities into the Tier I category.
This study highlighted the importance of the utility packaging function for the human
packaging environment that is the doctors, patients and trade. This is based on the
assumption that the value chain consists of only these three components. There is
possibility of online and virtual business where the supply chain constituents differ.
These are not considered in this research.
The demographic analysis for the doctors is being done in terms of the doctors’
specialization and general practice. Here the other variables are not considered like
the doctors’ experiences and private or public practices that can be related to the value
offer. This is because there is difficulty in certifying the validity of theses information
176
as in India there is high level of exaggerations on giving the experiences or practice
details due to that the final results can be affected. In case of specialization, the study
highlights the niche targeting in terms of nine specializations as these parameters can
be easily checked in terms of the qualifications and titles mentioned on the visiting
cards of the doctors surveyed. No other parameters were considered for the doctors
excepting the GP and specialization details.
For the patients, the study is being done in terms of gender as other demographics
were not incorporated in the data, as the patients would not disclose the correct
information other than their gender. The other variables that could be considered were
age of patient, family income of the patient, type of treatments. These were not easily
available and can be highly manipulated by the patients resulting in the invalid
analysis due to unqualified data. Also the frequency of the treatments for the patients
and the various diseases for which the treatments are done need to be known that
would further complicate the study. Some of the patients are covered by private
insurances and therefore the income criterion is not a suitable variable. Also most of
the patients in India go to the hospital after being treated in the private clinic by their
personal physician so the diagnosis and type of treatment could not be included as
there is overlapping or change of treatment in several cases thus distorting the data.
No other parameters were considered for the patients excepting the gender.
The relationship of the awareness and perceptions of the technological innovations
have been explained in terms of relationships that are explanatory or descriptive
research like ‘more or less’ and ‘important or not important’. There is the possibility
further enhance the scope to a causal research by working out a mathematical
relationship using the appropriate statistical tool to model these relationships so that
the exact targeting can be done and an appropriate quantitative value offer being made.
177
This would enable to prepare a proper budget for a particular region or target market
wherein the right promotions can be done to increase the sales.
All data was collected by certified professionals in the medical research field from the
year 2007-2009. The questionnaires were analyzed by professional experts in the
pharmaceutical field and further tested in a pilot study of 30 for each type of
consumer and such study was analyzed and published at an international marketing
conference. The assumption is that the scale up from 30 to 1600 would not drastically
induce unknown errors in the methodology and analysis.
As all the five types of pharmaceutical product packages were studied the strategic
implications, form and design implications were done for a selected group of
pharmaceutical product package type based on the vast knowledge of experts and
literatures reviewed.
178
Chapter – 6
CONCLUSIONS
The pharmaceutical packaging is a powerful marketing tool that enhances the product
by providing new technology, adding value that helps the doctor, patient and trade to
obtain a differentiated value added product that is of value to them. As the product is
very expensive and the ROI is important as it takes several years to recover the huge
investment it is vital to have a focused marketing strategy especially when the product
failure rates are high. This research has concluded the following for marketing of
pharmaceutical products in India:
a) The doctors in Chennai & Mumbai were not aware of the existing
technological attributes.
b) The doctors in Kolkata did not perceive as important the new technological
attributes. There was statistically significant perception difference in new
attributes between GPs’ and the specialists.
c) It was found that all the customers needed the utility value addition for the
product package. In case of doctors it was maximum for the oral formulation,
whereas for the patients there are specific variables that are required for the
tablet, oral and injection formulations and for the trader a couple of variables
are vital for value addition and increase in the sales.
d) For all the pharmaceutical types the doctors in Chennai & Mumbai need to be
influenced based on the form and shape of the package while prescribing. In
case of patients those from Chennai should be promoted on the positive effects
on the treatment from the form and shape of the package especially to the
males.
179
e) Most important design improvement that doctors required was for the Alu-Alu
pack that was required by the GP’s from Mumbai. The design improvements
were also recommended for the blister pack by the GPs’ and for the PET and
loose injections by both the GP’s and specialists.
f) The patients needed improvements in the carton pack, Al foil, blister pack and
injections in carton with syringe & pre filled. The male patients were
particularly requiring improvements in the design of the PET bottle, syrup
with spoon and loose injections.
g) The study confirmed that the traditional Lockhart model becomes very
effective to formulate strategy when the Utility function specifically focuses
on the “technological innovations” of the package. Once the awareness and
perception of the new and existing technologies are identified and rated in
terms of importance the “form, color and shape” of the package helps the
manufacture to increase the value addition of the package.
h) The “design improvements” of the package in terms of priority or ranking are
then considered to further enhance the package utility.
i) The marketing strategy is formulated using the “technological innovations”,
“form, color and shape” and “design improvement” of the package.
j) The cultural diversity in the “four metros” and the demographic segmentation
in terms of the “doctors specialization” and “gender of the patient” helps in the
STP strategy that is valuable, unique and not easily imitable
180
Chapter – 7
SUGGESTIONS & RECOMMENDATIONS
The marketing strategy is effective if there is a proper identification of the
technological packaging attributes that adds utility value to the package. In the Indian
market there are two types of technologies that are analyzed, one is the new
technology and the other is the existing technologies that add utility value & where
design improvements are suggested.
In the new technology the Doctors in Chennai were not aware of the ‘Child resistance
pack’, ‘Compliance pack’ and the ‘Friendly administration pack’. It is suggested that
the Southern Indian Doctors should be made aware of these new technologies that are
available. Doctors in Mumbai were not aware of the ‘Bar code/RFID’, whereas
Doctors in Delhi needed more information on this attribute. There needs to be more
promotion required in Delhi for this attribute.
Among the existing technology available in the Indian market the Doctors is Kolkata
did not consider important the ‘Availability improvement pack’, ‘Loss of drug –
avoidance’ and the ‘Proper dosage administration’. Here it is the Eastern Indian
Doctors that need to be more perceptive to the existing technology attributes that are
on offer.
The traders consider convenience and wastage as important variables that add utility
to the package.
The Doctors considered the oral formulations to have maximum technological utility.
The Patients are willing to pay more for extra utility function for the form, shape &
texture of tablets; for the bar coding and avoiding of counterfeits in case of oral and
for the design of the injection formulations
181
Based on the form, color and texture of the package that contains the pharmaceuticals
the Doctors in Chennai were not affected to prescribe the product based on the pack.
There needs to be better communication that appeals to the Southern Indian Doctors
in order to enhance the prescription sales based on the package appeal. Also the
patients in South India had less positive effect on their treatment based on the package
especially the males. Here there is need to understand the mind of the patients in
terms of what package would make them consider to have a positive impact on their
treatment thereby persuading the doctor to prescribe or inducing more sales from the
trade in case of OTC products.
The Doctors in Kolkata & Mumbai especially the GP’s needed the package design
improvement in Alu-Alu, Blister, PET and loose injection whereas the Patients in all
the four metro cities of India especially the males needed design improvement in
Carton, Al foil, Blister, PET, syrup with spoon & in carton and all injection packs
With only 30% success in marketing of pharmaceutical products worldwide it is
important that the package is utility based that differentiates the product offered. Due
to IPR the pharmaceutical product itself cannot be differentiated hence the package
becomes the sole differentiator in the marketing strategy in crowded therapeutic
market. The marketer needs to have sustained advantage based on the important
utility function of the package.
In addition the form, shape and texture of the package also have an effect on the users.
Based on the identification of these factors the design improvement on the packaging
type is suggested. The study across the four distinct zones in India that are culturally
different in their awareness and perceptions indicates the segmentation/targeting &
positioning for proper pricing, promotion, distribution of the ultimate final product.
182
ANNEXURE I
BIBLIOGRAPHY
Abernathy WJ, Clark K B, 1985. Innovation mapping the winds of creative
destruction Research Policy 1985; 14 (1):3–22.
Ajay Mahal, Manoj Mohanan “Medical education in India and its implications for
access to care and quality.”; Human resources for health in India. Department of
Health Policy May 2006. pp 1-20
Alan F. Merry et al, 2001. A New Safety-Oriented, Integrated Drug Administration
and Automated Anesthesia Record System. Anesthetic Analogues 2001; 93:385-390.
Ampuero, O. and Vila, N., 2006 “Consumer perceptions of product packaging.”
Journal of Consumer Marketing, Vol. 23 No. 2, pp 100-112
Arne Christensen, Lona Louring Christrup, Paul Erik Fabricius, Ebba Holme Hansen,
2007 “Patient acceptance of a tablet reminder device” Journal of Medical Marketing
(2007) 7, pp.152–161.
Arnold, Catherine, 2003 “Way outside the box: how the most innovative packages
were created.” Packaging;. Pp. 15-16. June 23, 2003.
Aslam M M, 2006, Are you selling the right color, Journal of Marketing
communication, Vol. 12, No. 1, pp. 15-30
Bamshad M, Wooding S, Salisbury BA, Stephens JC 2004 Deconstructing the
relationship between genetics and race. Nat Rev Genet, 5(8): 598-609.
Berkowitz, Marvin 1987a “The Influence of Shape on Product Preferences,”
Advances in Consumer Research, 14(559).
Berkowitz, Marvin 1987b “Product Shape as a Design Innovation Strategy,” Journal
of Product Innovation Management, 4, 274-283.
183
Berman A, 2004, “Reducing Medication Errors Through Naming, Labeling, and
Packaging” Journal of Medical Systems, Volume 28, Number 1, February 2004, pp.
9-29(21)
Bhasin, M. K. 2006 Genetics of Castes and Tribes of India: Indian Population Milieu.
Int J Hum Genet, 6(3), 233-274.
Bhattacharjee, Bidyut Jyoti and Bhattacharjee, Dibyojyoti, 2005 Impact of Packaging
on the Buying Behavior of Consumers in a Communicationally Remote Urban Area
(2005). Research Bulletin of the Institute of Cost and Works Accountants of India,;
Vol. 27, pp. 200-204, 2005. Available at SSRN: http://ssrn.com/abstract=1630695
Bhavana Srivastava, Dr Chandra Prakash, Dr Ajay Kumar Sinha, Dr Sanjay Gaur, Dr.
Mukesh Kumar Prasad, 2010 J Indian Acad Forensic Med, 32(3) 228-230
Bhugra D, 2006: Severe mental illness across cultures. Acta Psychiatr Scand Suppl
2006:17-23.
Bierbrauer, G. 1994 “Toward an understanding of legal culture: Variations in
individualism and collectivism between Kurds, Lebanese, and Germans”, Law &
Society Review, 28(2), 243-264.
Bierly, P and Chakrabarti, A.K, 1996 Determinants of technology cycle time in the
U.S. pharmaceutical industry. R&D Management 26:115-126 (1996)
Birren, F. 1952 Your Color and Yourself, Sandusky: Prang Company Publishers.
Bitner, M. J. 1992 Servicescapes: The impact of physical surroundings on customers
and employees. Journal of Marketing, 56(2), 57-71.
Bloch, Peter H. 1995 “Seeking the Ideal Form: Product Design and Consumer
Response,” Journal of Marketing, 59(July), 16-29.
184
Bloch, Peter H., Frederic F. Brunel, and Todd J. Arnold 2003 “Individual Differences
in the Centrality of Visual Product Aesthetics: Concept and Measurement,” Journal of
Consumer Research, 29(March), 551-565.
Bo Rundh, 2009 "Packaging design: creating competitive advantage with product
packaging", British Food Journal, Vol. 111 Iss: 9, pp.988 – 1002
Bone P.F., France K.R, 2001, “Package Graphics and Consumer Product Beliefs”,
Journal of Business and Psychology, Volume 15, Number 3, 2001, pp. 467-489(23)
Bootman L, 1985 "Maximizing Compliance in the Elderly," Pharmacy Practice for the
Geriatric Patient, Health Sciences Consortium, Carrboro N. C., 1985
Bose N.K., 1961 Peasant Life in India: A Study in Indian Unity and Diversity,
Calcutta, 1961.
Bottomley, P. A., & Doyle, J. 2006 The interactive effects of colors and products on
perceptions of brand logo appropriateness. Marketing Theory, 6(1), 63-83 Retrieved
from http://orca.cf.ac.uk/2579/
Bowling, A., Ebrahim, S. 2001 Measuring patients' preferences for treatment and
perceptions of Risk. Quality in Health Care, 10, 2-8.
Brian Haynes R., MD, PhD, Heather P. McDonald, BSc, Amit X. Garg, MD, MA,
2002; Interventions to Enhance Patient Adherence to Medication Prescriptions
JAMA The Journal of the American Medical Association. 2002; 288(22):2868-2879.
Broers, M. 2003 “The myth and reality of Italian regionalism: A historical geography
of Napoleonic Italy, 1801-1814”, American Historical Review, June, 688-709.
Bruce, Margaret, and Maureen Whitehead 1988 “Putting Design into the Picture: The
Role of Product Design in Consumer Purchase Behavior,” Journal of the Market
Research Society, 30(2), 147-162.
185
Buckalew LW, Coffield KE, 1982: An investigation of drug expectancy as a function
of capsule color and size and preparation form. J Clinical Psycho pharmacology 1982,
2(4):245-248.
Buckalew LW, Coffield KE, 1982: Drug expectations associated with perceptual
characteristics: ethnic factors. Perception Mot Skills 1982, 55(3 Pt 1):915-918.
Buckalew, L.W., Ross, S. 1991 Medication property effect on expectations of actions.
Drug Development Research 23, 101-8
Buckalew, L.W., Sallis, R.E., 1986. “Patient compliance and medication perception,”;
Journal of Clinical Psychology 42, 49-53.
Buckalew W. and R. E. Sallis, 1986 "Patient Compliance and Medication Perception,''
Journal of Clinical Psychiatry 142 (1986): 244-45. As cited in Meichenbaum,
Facilitating Treatment Adherence
Busser S., R. Steiner and N. Jungbluth, 2008 LCA of Packed Food Products Brussels:
ESU Services Ltd. for Flexible Packaging Europe, 2008.
Cann RL, 2001 Genetics clues to dispersal in human populations: Retracing the past
from the present. Science, 291(5509): 1742-1748.
Caputo, Tina 2005 “The Repackaging of Fetzer,” Wines & Vines, 86(5), 20-25.
Carus D. A., C. Grant, R. Wattie, M. S. Pridham, 2006 Development and validation of
a technique to measure and compare the opening characteristics of tamper-evident
bottle closures, Packaging Technology and Science Volume 19, Issue 2, pages 105–
118, March/April 2006
Castree, N. 2004 “Economy and culture are dead! Long live economy and culture!”
Progress in Human Geography, 28(2), 204-226.
186
Chan, F.T.S., Chan, H.K. and Choy, K.L 2006 A systematic approach to
manufacturing packaging logistics.; International Journal of Advanced
Manufacturing; Technology Vol. 29, 1088-1101.
Chan T.Y.K. (2000), “Improvements in the packaging of drugs and chemicals may
reduce the likelihood of severe intentional poisonings in adults”, Human &
Experimental Toxicology, Volume 19, Number 7, 2000, pp. 387-391(0)
Cheskin, 1998 research finds that when it comes to packaging, looks count. (1998,
September 21). PR Newswire, p. 6494.
Connolly, A., and L. Davison 1996 “How Does Design Affect Decisions at the Point
of Sale” Journal of Brand Management, 4(2), 100-107.
Conroy S, Sweis D, Planner C, Yeung V, Collier J, Haines L, Wong IC, 2007.
Interventions to reduce dosing errors in children: a systematic review of the literature.
Drug Safety 2007; 30(12):1111-25.
Cooper, Robert G., and Elko Kleinschmidt 1987 „New Products: What Separates
Winners from Losers?” Journal of Product Innovation Management, 4(3), 169-184.
Cooper, Robert G. Kleinschmidt, Elko J., 1991, “The Impact of Product
Innovativeness on Performance”;, Journal of Product Innovation Management, Vol. 8,
p.240-251.
Cooper MB, DroÈge C, Daugherty PJ, 1991. How buyers and operations personnel
evaluate service. Ind Mark Manage 1991; 20 : 81 ±5.
Cramer J.A., 1998 “Enhancing Patient Compliance in the Elderly: Role of Packaging
Aids and Monitoring”, Drugs & Aging, Volume 12, Number 1, January 1998, pp. 7-
15(9)
187
Creusen, M. E. H. & Schoormans, J. P. L, 2005, “The different Roles of Product
Appearance in Consumer Choice”; The Journal of Product Innovations Management,
Vol. 22:63-81.
Crozier, W.R, 1996 “The Psychology of Color Preferences”, Review of the Progress
in Coloration and Related Topics 26, pp. 63- 72.
CWMI 1999 Packaging waste: Whose responsibility is it anyway? In Proceedings
from Roundtable Three, November 6 1998.; Cornell Waste management Institute,
Ithaca.
deCraen, A., Roos, P., Varies, A.D., Kleijnen, J. 1996 Effect of colour of drug:
systematic review of perceived effect of drug and their effectiveness. BMJ, 313,
1624-
DiMasi JA, RW Hansen, HG Grabowski, 2003. “The price of innovation: new
estimates of drug development costs” Journal of Health Economics
Dien, D. S. 2000 “The evolving nature of self-identity across four levels of history”,
Human Development, 43,1-18.
Eisen SA, Miller DK, Woodward RS, Spitznagel E, Przybeck TR, 1990. The effect of
prescribed daily dose frequency on patient medication compliance Arch Intern Med.
1990 Sep; 150 (9):1881-4.
Engel, James F., Blackwell, Roger D. and Miniard, Paul W 1995 Consumer Behavior.
Orlando, FL: The Dryden Press.
Eysenck, H. J. 1941 A critical and experimental study of colour preferences American
Journal of Psychology, 54, 385-394.
Fehrman, C., & Fehrman, K, 2004. Color: The secret influence. Upper Saddle River,
NJ: Prentice Hall
188
Fells, E. 2003 “The proliferation of identity politics in Australia: An analysis of
ministerial portfolios, 1970-2000”. Australian Journal of Political Science, 38(1), 101-
117
Filik, Ruth, Purdy Kevin, Gale Alastair, Gerrett David, 2006, “Labeling of Medicines
and Patient Safety: Evaluating Methods of Reducing Drug Name Confusion”, Human
Factors: The Journal of the Human Factors and Ergonomics Society; Volume 48,
Number 1, Spring 2006;, pp. 39-47(9)
Gabriele S, 2006 ―The Role of Typography in Differentiating Look Alike/Sound-
Alike Drug Names. Healthcare Quarterly, 2006; 9: 88–95.
Garber, Lawrence L. Jr, 1995 The Package Appearance in Choice, In: Advances in
Consumer Research, Frank R. Kardes and Mita Sujan (eds.). Provo, UT: Association
for Consumer Research, 653–660.
Garber, Lawrence L. Jr, Burke, Richard R. and Jones, J. Morgan, 2000 The Role of
Package Color in Consumer Purchase Consideration and Choice. Cambridge, MA:
Marketing Science Institute (Working Paper Series, Rep. No. 00-104).
Garcia, R. and Calantone, R., 2002, “A critical look at technological innovation
typology and innovativeness terminology: A literature review”, Journal of Product
Innovation Management Vol. 19, No. 2, 110-132
Garcia-Arca, J., Prado-Prado, J.C. and Garcia-Lorenzo, A. 2006 “Logistics
Improvement through Packaging Rationalization: A Practical Experience”, Packaging
Technology and Science, Vol. 19, 303-308.
Gardner, B.B, 1981 “The Package as Communication” In Walter Stern, ed.,
Handbook of Package Design Research John Wiley & Sons, 1981, pp.232-237.
Gatignon, H, 1989, "Technology Diffusion: An Empirical Test of Competitive
Effects," Journal of Marketing, 53 (January), 35-49.
189
Gatignon, H. and T.S. Robertson, 1985, "A Propositional Inventory for New
Diffusion Research," Journal of Consumer Research, 11 (March), 849-867.
Gautam S, Jain N. Indian culture and psychiatry. Indian J Psychiatry [serial online]
2010 [cited 2012 Jan 22]; 52: 309-13. Available from: http://www.indian j
psychiatry.org/ text.asp?2010/ 52/7/309/69259
Gianluca, S., Donato, R., & Cavicchi, A, 2006 Consumer expectations, liking and
willingness to pay for specialty foods: Do sensory characteristics tell the whole story?
Food Quality and Preference, 17(1-2), 53-62.
Gibson, Chris and Kong, Lily, 2005, Cultural economy: a critical review, Progress in
Human Geography, 29(5), 541-561
Giddens, A. 1984 The Constitution of Society. Outline of the Theory of Structuration
(p. 402). University of California Press Retrieved from
http://books.google.com/books?id=cV8xnSIa0-IC
Gorn, G.J. Chattopadhyay, A., Sengupta, J. and S. Tribathi, 2004, “Waiting for the
Web: How Screen Color Affects Time Perception”, V.XLI, May, pp. 215-225
Gouveia, V. V. & Albuquerque, F. J. B. de 2002 “Human values and social identities:
A study in two collectivist cultures”, International Journal of Psychology, 37(6), 333-
342.
Green, K. S. 1995 Blue versus periwinkle: Colour identification and gender.
Perceptual and Motor Skills, 80 (1), 21-32.
Greenspan A, 1994 Culture influences demographic behaviour: evidence from India.
Asia- Pacific Population & Policy 1994 Mar; (28):1-4.
Grossman, R. P, & Wisenblit J. Z, 1999. What we know about consumers’ color
choices. Journal of Marketing Practice Applied Marketing Science, 5(3), 78-88.
Retrieved from http://www.emeraldinsight.com/10.1108/EUM0000000004565
190
Guilford, J. P. 1934 The affective value of colour as a function of hue, tint, and
chroma Journal of Experimental Psychology, June
Guilford, J. P. & Smith, P. C. 1959 A system of colour-preferences. The American
Journal of Psychology, 73 (4), 487-502
Hallie Forcinio, 2007 Sustainable Packaging Resources - Pharmaceutical Technology
assessed from http://pharmtech.findpharma.com/pharmtech Sustainable-Packaging-
Resources/Article/detail/463586
Henderson, Pamela W., Joseph A. Cote, Siew Meng Leong, and Bernd Schmitt 2003
“Building Strong Brands in Asia: Selecting the Visual Components of Image to
Maximize Brand Strength,” International Journal of Research in Marketing, 20, 297-
313.
Herriot, P. & Scott-Jackson, W 2002 Globalization, social identities and employment
British Journal of Management 13, 249-257.
Hertenstein, Julie H., Marjorie B. Platt, and Robert W. Veryzer 2005 “The Impact of
Industrial Design Effectiveness on Corporate Financial Performance,” Journal of
Product Innovation Management, 2(1), 3-21.
Heuer H.O., Heuer S., Lenneke K., 1999: Compliance in der Arzneitherapie.
Wissenschaftliche Verlagsgesellschaft mbH. Stuttgart 1999
Hicks, Alastair. 2002. “Minimum Packaging Technology for Processed Foods:
Environmental Considerations.” In AU Journal of Technology 6(2):89-94.
Holdway, R., D. Walker, and M. Hilton,; 2002 “Ecodesign and Successful packaging”.
Design Management Journal. 13 (4): pp.45-53.
Horsky, D, 1990, "A Diffusion Model Incorporating Product Benefits, Price, Income
and Information," Marketing Science, 4 (Fall), 342-365
191
Inas R I, Izham M.I & Mahmoud A H., 2010 “Consumer Preferences and Perceptions
towards the use Coloured Oral Solid Dosage Forms in Baghdad.” Archives of
Pharmacy Practice 2010; 1(1) pp 15-19.
Guidelines for the Use of RFID Technology in Transfusion Medicine (2010), Vox
Sanguinis, 98, Issue supplement s2: 1–24. April 2010 doi: 10.1111/j.1423-
0410.2010.01324.x
Jakhar, M. 2004 Better packaging promises better living. The Economic Times, 25th
October, 2004, Kolkata, pp. 13.
Jansen R.1, Schelhove G., 1999 “Tamper evidence—a vital issue in packaging
development”, Packaging Technology and Science, Volume 12, Number 6,
November/December 1999, pp. 255-259(5)
Jayapaul Azariah, Hilda Azariah, & Darryl R.J. Macer, 1997 Bioethics in India:
Proceedings of the International Bioethics Workshop in Madras: Bio management of
Bio geo resources, 16-19 Jan. 1997, University of Madras
http://www.eubios.info/india/BII19.HTM
Jönson, G. 2000 “Packaging Technology for the Logisticians”, 2nd edition,
Department of Design Sciences, Division of Packaging Logistics, Lund University,
Lund, Sweden.
Jürgen Munzel, 2007 “Marketing Innovation Pharmaceutical packaging: Technology
and design requirements are on the rise”, Journal of Medical Marketing (2007) 7,
pp136–145
Kalish, S, 1985, "A New Product Adoption Model with Price, Advertising, and
Uncertainty," Management Science, 12 (December), 1569-1585.
192
Kanungo R N & Jaeger A M 1990 “Introduction: The need for indigenous
management in developing counties,” In A.M. Jaeger and R.N. Kanungo (Eds.),
Management in developing countries (pp. 1-19). London: Routledge.
Kessler, E.H. and Chakrabarti, A.K., 1999, “Speeding up the pace new product
development”, Journal of Product Innovation Management, Vol. 16 No. 3, pp. 231-47.
Khanna, Vikramaditya S., 2005 The Economic History of the Corporate Form in
Ancient India (November 1, 2005). Available at SSRN:
http://ssrn.com/abstract=796464 or doi:10.2139/ssrn.796464
Kippen Sandra, Fraser Mary, Ellis Julie, 2005, “As time goes by: issues for older
people with their medication use”, Australasian Journal on Ageing, Volume 24,
Number 2, June 2005 , pp. 103-107(5)
Keoleian G.A., A.W. Phipps, T. Dritz, and D. Brachfeld, 2004 Life Cycle
Environmental Performance and Improvements of a Yoghurt Product Delivery
System London: Packaging Technology and Science vol.17, no. 2, pp. 85-103, 2004
Koenigsberg, O., Kohli, R., & Montoya, R. 2010 Package Size Decisions.
Management Science, 56(3), 485-494. INFORMS Retrieved from
http://www.captura.uchile.cl/jspui/handle/2250/11124
Kooijman, J.M, 1994 Environmental Assessment of Food Packaging: Impact and
Improvement. London: Wiley Interscience: Packaging Technology and Science vol.7
111-121, 1994
Kurian, N. J. 2007 Widening economic & social disparities: implications for India.
The Indian journal of medical research, 126 (4), 374-380 Retrieved from
http://www.ncbi.nlm.nih.gov/pubmed/18032812
193
L van den Berg-Weitzel, G van de Laar, 2001 “Relation between culture and
communication in packaging design”, Journal of Brand Management (2001) 8,
pp.171–184
Lahr M, Foley R 1998. Towards a theory of modern human origins: Geography
demography and diversity in recent human evolution. Am J Phys Anthrop, 27: 137-
176.
Lambert, J. 2004, September 13. Color schemers; Canadian Business, 77(18), 76-82.
Laura Bix, Nora Rifon, Hugh Lockhart, Javier de la Fuente, 2003 “The Packaging
Matrix: Linking Package Design Criteria to the Marketing Mix” School of Packaging,
Michigan State University,
Lawrence L. Garber, Jr. 1995 "THE PACKAGE APPEARANCE IN CHOICE", in
Advances in Consumer Research Volume 22, eds. Frank R. Kardes and Mita Sujan,
Provo, UT: Association for Consumer Research, Pages: 653-660.
Leenen FH, Wilson TW, Bolli P, Larochelle P, Myers M, Handa SP, Boileau G,
Tanner J, 1997. Patterns of compliance with once versus twice daily antihypertensive
drug therapy in primary care: a randomized clinical trial using electronic monitoring.
Can J Cardiol. 1997 Oct; 13(10):914-20.
Lewis, M. 1991 Understanding Brands, Kogan Page, London
Lichtle M C., 2007, the effect of an advertisements color an emotions evoked by an
advertisement and attitude toward the advertisement International Journal of
advertising, Vol. 26, No. 1, pp. 37-62.
Lockhart, H, 1997. “A paradigm for packaging” Packaging Technology and Science,
1997; 10:237-252.
Lynn, Bonnie, 1981, “Color Research in Package Design", in Handbook of Package
Design Research, ed. Walter Stem, New York: John Wiley & Sons, 191-197.
194
Masten. D.L. 1996 Packaging proper role is to sell the product, in Varadrajan, Rajan P.
(Ed). The Business of Marketing, Bombay: Jaico Publishing House.
McDermott, C.M. 1999 “Managing radical new product development in large
manufacturing firms: a longitudinal study”, Journal of Operations Management, Vol.
17, 631-644
Meyers-Levy, Joan and Tybout, Alice M, 1989 Schema Congruity as a Basis for
Product Evaluation. Journal of Consumer Research 16:39–54.
Momin A.R, 1992 "Social mobility and Development among the Tribal Communities
of India." Paper presented at a seminar on Social Mobility and Development,
organized under the auspices of the Joint Indo-Russian Commission in Moscow on
September 27-30, 1992.
Murray, J. M., & Delahunty, C. M. 2000 Mapping consumer preference for the
sensory and packaging attributes of Cheddar cheese;. Food Quality and Preference
11(5), 419-435 Retrieved from http://www.science direct.com /science /article
/B6T6T-40R5BD1-7 /2/0a90933192af07a2279bb13126b7e8b7
Nancarrow, C., Wright, L.T. and Brace, I. 1998 “Gaining competitive advantage from
packaging and labeling in marketing communications”, British Food Journal, Vol.
100 No. 2, pp. 110-20.
Naser Azad and Leila Hamdavipour, 2012 A study on effects of packaging
characteristics on consumer's purchasing confidence. Management Science Letters
Management Science Letters 2 (2012) 397–402
Nelson, R. P 1994 The design of advertising. Dubuque, IA: WCB Brown &
Benchmark.
Nixon Bill, 2003, “Evaluating design performance”, International Journal of
Technology Management, Volume 17, Numbers 7-8, 6 July 2003 , pp. 814-829(16)
195
Nuij, R. 2001 ‘Eco-Innovation: Helped or Hindered by Integrated Product Policy’,
The Journal of Sustainable Product Design, 1: 1, 49-51
Olsson, A., and Larsson A.C. 2009 “Value creation in PSS design through product
and packaging innovation processes”, In Introduction to process/service-system
design, Sakao T. and Lindahl M. (Eds.), 93-109. Springer, London
Olsen, S.O. et al., 2007 “Exploring the relationship between convenience and fish
consumption: A cross-cultural study.” Appetite, Vol. 49 No. 1, pp 84-91
Orth, Ulrich, R. and Malkewitz, Keven, 2008, “Holistic Package Design and
Consumer Brand Impressions.”; Journal of Marketing 72 (3).
Orth, C. U. R., & Malkewitz, K. 2006 PACKAGING DESIGN AS RESOURCE FOR
THE Business, (July), 6-7.
Overby, J. W. Robert B Woodruff and Sarah Fisher Gardial, 2005 The influence of
culture upon consumers� desired value perceptions: A research agenda. Marketing
Theory, 5(2), 139-163 SAGE Publications Retrieved from
http://mtq.sagepub.com/cgi/doi/10.1177/1470593105052468
Parmar, A, 2004 Marketers ask: hues on first? Marketing News 15 February pp. 8–10.
Panda, A., & Gupta, R. K. 2004 Mapping Cultural Diversity within India: A Meta-
analysis of Some Recent Studies. Global Business Review, 5(1), 27-49. Retrieved
from http://gbr.sagepub.com/cgi/doi/10.1177/097215090400500103
Paul Green, 2008 Nov It's Not Easy Being Paul Green Published: November 08, 2000
in Knowledge @ Wharton
Pelham, A. M. 2000. Marketing orientation and other potential influences on
performances in small and medium-sized firms. Journal of Small Business
Management 45-67.
196
Pelham, A. M. and D. T. Wilson, 1996 A longitudinal study of the impact of market
structure, firm structure, strategy and market orientation culture on dimensions of
small-firm performance. Journal of the Academy of Marketing Science 24(1):27-43.
Peterson, Mark F. & Smith, Peter B. 1997 “Does national culture or ambient
temperature explain cross-national differences in role stress? No sweat!” Academy of
Management Journal, 40(4), 930-946
Philips, Hugh, and Roy Bradshaw 1993 “How Customers Actually Shop: Customer
Interaction With the Point of Sale,” Journal of the Market Research Society, 35(1),
51-62.
Pieters, R., & Warlop, L. 1999 Visual attention during brand choice: The impact of
time pressure and task motivation. International Journal of Research in Marketing,
16(1),1-16. Retrieved from http://linkinghub.elsevier.com /retrieve /pii /S0167811
698000226
Pilditch, J. 1969 Design as a function of marketing. How market research influences
design. Journal of the Market Research Society, 11(2), 186-189.
Pires Gon¸calves, Ricardo 2008 Consumer Behavior: Product Characteristics and
Quality Perception MPRA Paper No. 11142 posted 16. October 2008
http://mpra.ub.uni-muenchen.de/11142/
Prendergast, G. and L. Pitt, 1996 “Packaging, marketing, logistics & the environment:
are there trade-offs?”; International Journal of Physical Distribution & Logistics
Management; 26(6): pp.60-72
Rankin, K. N 2003 “Anthropologies and geographies of globalization” Progress in
Human Geography, 27(6), 708-734
Raymond, C. 2005 “Regional geographic Influence on two khmer polities”. Journal of
Third World Studies, 22(1), 135-150.
197
Rentie, R., Brewer, C, 2009 The verbal and visual components of package design /
R.Rentie, C.Brewer // Journal of Product and Brand Management, 2000, Vol.9.
Rettie, Ruth, and Carol Brewer 2000 “The Verbal and Visual Components of Package
Design,” Journal of Product and Brand Management, 9(1), 56-70.
Rice M P, Colarelli O’Connor G, Peters LS, Morone JG, 1998. Managing
discontinuous innovation Research Technology Management 1998; 41(3):52–8.
Richard P Kusserow, 1990 Medication Regimens: Causes of Noncompliance (OEI-
04-89-89121; 06/90) http://oig.hhs.gov/oei/reports/oei-04-89-89121.pdf accessed on
20/12/11
Rita Kuvykaite, Aist÷ Dovaliene, Laura Navickiene, 2009 IMPACT OF PACKAGE
ELEMENTS ON CONSUMER’S PURCHASE DECISION ECONOMICS &
MANAGEMENT: 2009. 14
Rob Horne, John Weinman, Nick Barber Rachel Elliott, 2005 Myfanwy Morgan
Concordance, Adherence and compliance in medicine taking Report for the National
Coordinating Centre for NHS Service Delivery and Organization R & D (NCCSDO)
December 2005 pp 13-14
Robertson, T.S. and H. Gatignon, 1986, "Competitive Effects on Technology
Diffusion," Journal of Marketing, 50 (July), 1-12.
Rohitashya Chattopadhyay, 2007 "Cultural influences on Indian television
commercials: A qualitative analysis" (January 1, 2007). Dissertations available from
ProQuest Paper AAI3292014
Roller, E. 2002 “Reforming the Spanish senate: Mission impossible?” West European
Politics, 25(4), 69-92.
Roullel, B., & Droulers, O, 2005 Pharmaceutical Packaging Color and Drug
Expectancy Advances in Consumer Research, 32(1), 164-171.
198
Rundh, B., 2005 “The Multi-Faceted Dimension of Packaging.” British Food Journal,;
107 (9).
Scalem M and Manideepa Patnaik 2011 Investing in India International Journal of
Business Derivatives Vol I No 2 2011 pp 298-349
Schmitt, B. H., & Pan, Y, 1994 Managing Corporate and Brand Identities in the Asia-
Pacific Region. California Management Review, 36(4), 32-48.
Schmitt, Bernd H., and Alex Simonson 1995 “Managing Corporate Image and
Identity,” Long Range Planning, 28(5), 82-92.
Schmitt, Bernd H. and Simonson, Alex, 1997 Marketing Aesthetics: The Strategic
Management of Brands, Identity, and Image New York: The Free Press.
Schoormans, Jan P. L. and Robben, Henry S. J, 1997 The Effect of New Package
Design on Product Attention, Categorization and Evaluation. Journal of Economic
Psychology 18:271–287.
Silayoi, P., & Speece, M, 2004. Packaging and purchase decisions: An exploratory
study of the impact of involvement and time pressure. British Food Journal, 106(8),
607-628.
Silayoi, P., & Speece, M, 2007 The importance off packaging attributes: a conjoint
analysis approach. European Journal of Marketing, 41(11/12), 1495-1517.
Simon Williams, 2005 “Packaging Becomes Part of the Prescription.” Pharmaceutical
Technology;, 29(3), 130.
Singh K.S., 2002. The People of India: An Introduction, pp. 96-101. People of India
National Series | Publication Date: July 11, 2002
Singh P & Bhandarkar A 1988 “Cultural Ethos in The Organizational Milieu,” Indian
Management, Vol. 27, No. 10
199
Singh N & Krishnan V R 2005 “Towards Understanding Transformational Leadership
In India,” VISION—The Journal of Business Perspective, Vol. 9, No. 2, April–June
Singh, S., 2006 ‘Impact of color on marketing’. Management Decision 44(6): 783-789.
Sinha, J.B.P. 2004 Multinationals in India: Managing the Interface of Cultures. Sage
publications, New Delhi, 2004
Sinha, J.B.P.; Vohra, Neharika; Singhal, Sushila; Sinha, R.B.N.; & Ushashree, S,
2002 “Normative predictions of collectivist-individualist intentions and behavior of
Indians” International Journal of Psychology, 37(5), 309-319
Somasundaram, M. 1995, September 18 Red packages lure shoppers like capes
flourished at bulls—Marlboro, Coca-Cola, Colgate wear most popular color on global
market shelves. The Wall Street Journal, 226 (54), A9
Srivastava, R.K and Aarti T More, 2010,” Some aesthetic considerations for over the-
counter (OTC) pharmaceutical products”, International Journal of Biotechnology; Vol.
11, No 3-4, pp 267-283
Sturgess, D. J. 2008, August 11 A spectrum of missed opportunity Brandweek 49 (29),
15.
Subrata C, 2007 http://www.chitralekha.org/publications/foreign-influence-indian-
culture assessed on 25/04/2011
Sujit S. Sansgiry, Gauri Shringarpure, 2003 Manufacturers' compliance with the US
Food and Drug Administration's Over-the-counter Human Drugs: Labeling
Requirements Packaging Technology and Science Volume 16, Issue 3, pages 91–98,
May/June 2003
Svanes, E., Vold, M., Möller, H., Kvalvåg Pettersen, M., Larsen, H. and Jörgen
Hanssen, O. 2010 “Sustainable Packaging Design: A Holistic Methodology for
Packaging Design”, Packaging Technology and Science, Vol.23, 161-175.
200
Tracy H S & Pearson C M 2000 “Creating an Empowering Culture: Examining the
Relationship between Organizational Culture and Perceptions of Empowerment,”
Journal of Quality Management, Vol 5, Issue 1, Spring.
Triandis, H. C. 1994 “Culture and social behavior”; New York: McGraw-Hill, Inc.
Underwood R. L., Ozanne J. L., 1998 “Is your package an effective communicator? A
normative framework for increasing the communicative competence of packaging”
Journal of Marketing Communications, Volume 4, Number 4, 1 December 1998, pp.
207-220(14)
Underwood Robert L., Noreen M. Klein and Raymond R. Burke, 2001, “Packaging
communication: Attentional effects of product imagery”, The Journal of Product and
Brand Management, 10, 6/7, 403-422
Van Dooren AA, 1991. PVC as pharmaceutical packaging material A literature
survey with special emphasis on plasticized PVC bags. Pharm Week bl Sci. 1991 Jun
21; 13 (3):109-18.
Vazquez, D., Bruce, M. and Studd, R. 2003 “A case study exploring the packaging
design management process within a UK food retailer”, British Food Journal, Vol.
105 No. 9, pp. 20-31
Vigil, J. D. & Hanley, G. 2002 “Chicano macro structural identities and macro
historical cultural forces” Journal of Historical Sociology,15 (3), 395-426.
Yathish TR, Manjula CG, 2009 “How to Strengthen and Reform Indian Medical
Education System: Is Nationalization the Only Answer?” Online J Health Allied Scs.
2009;8(4):1
Wallace, Robert 2001 “Proving Our Value: Measuring Package Design’s Return on
Investment,” Design Management Journal, 12(Summer) , 20-27.
201
Ward, J., Buckle, P., & John Clarkson, P 2010 Designing packaging to support the
safe use of medicines at home. Applied Ergonomics 41(5), 682-694 ELSEVIER SCI
LTD. Retrieved from http://www.ncbi.nlm.nih.gov/pubmed/20153457
Wells, L.E., Farley, H. and Armstrong, G.A 2007 “The importance of packaging
design for own-label food brands”,; International Journal of Retail & Distribution
Management, Vol. 35, No. 9, 677-690.
World Health Organization - Infectious disease report, 1999 Publication Code: WHO
CDS99.1, 1999
Wogalter M.S. and W.J. Vigilante Jr. 2003 ―Effects of Label Format on Knowledge
Acquisition and Perceived Readability by Younger and Older Adults. Ergonomics,
2003; 46(4): 32.
Zeithaml, V.A., Parasuraman, A. and Berry, L.L., 1985. “Problems and strategies in
services marketing” Journal of Marketing, 49, Spring, 33-46.
WEBLIOGRAPHY
http://www.agora.mfa.gr/agora/images/docs/radC6117Packaging%20Industry%20of
%20India.pdf accessed on 24/09/11
http://archives.who.int/prioritymeds/report/append/barr_apx4B.pdf accessed on
10/11/11
http://www.bangaloretrends.com/realty-articles/403-indias-urban-awakening-on-the-
cards.html accessed on 25/12/11
http://cbhidghs.nic.in/writereaddata/linkimages/11%20Health%20Infrastructure83564
93923.pdf accessed on 20/12/11
http://cbhidghs.nic.in/writereaddata/linkimages/11%20Health%20Infrastructure83564
93923.pdf accessed on 20/12/11
202
http://www.celt.iastate.edu/international/culture-extras/CultureResources.pdf accessed
on 22/08/11
http://www.cfses.com/documents/pharma/03-Technology_Trends.PDF accessed on
20/11/11
http://www.communities.wa.gov.au/serviceareas/Documents/FINAL%20Final%2020
09%20Compliance%20090527.pdf accessed on 20/12/11
http://www.consumerpsychologist.com/ accessed on 20/12/11
http://www.countrywatch.com/country_profile.aspx?vcountry=78 accessed on
12/12/11
http://www.cptech.org/ip/health/econ/dimasi2003.pdf accessed on 02/12/11
http://www.crossculturalresearch.com/ccr_website/proceedings05/singh-parashar .doc
accessed on 12/12/11
http://csdd.tufts.edu/ accessed on 22/10/11
http://www.daimi.au.dk/~cstorm/courses/AiBTaS_e08/papers/Molegro2005_DrugDis
covery.pdf accessed on 10/12/11
http://www.deloitte.com/assets/Dcom-United States /Local%20Assets /Documents
/us_lshc_ModernPharma_043009.pdf accessed on 12/12/11
http://www.ftc.gov/os/comments/healthcarecompissues/537778-00008.pdf accessed
on 07/10/11
http://www.ibef.org/download/Healthcare_270111.pdf accessed on 20/12/11
http://www.inae.org/metallurgy/archives_pdf/kosambi.pdf accessed on 20/01/11
http://indiatoday.intoday.in/story/packaging-industry/1/124785.html accessed on
30/08/11
http://www.ingenuity.com/products/ROI_IDC_LSI_7_04.pdf accessed on 12/11/11
203
http://www.isb.edu/MEDIA/USRSITENEWSMGMT.ASPX?TOPICID=452 White
Paper on Pharmaceutical Supply Chain Challenges & Best Practices - Released on the
occasion of “The CII-GMP SUMMIT SERIES – 1” on 20 December 2005
http://lifestyle.iloveindia.com/lounge/ethnic-origin-of-people-of-india - 965.html
assessed on 25/04/2011
http://www.orfonline.org/cms/sites/orfonline/modules/occasionalpaper/attachments/D
rug_Discovery_Book_1260179432814.pdf accessed on 20/12/11
“OTC packaging: pharmaceutical market competition, the 'blind spot'” assessed from
http://eng.hi138.com/?i195296 on 24/5/2010
http://scholarspace.manoa.hawaii.edu/bitstream/handle/10125/3868/p?sequence=1
accessed on 10/10/11
THE PACKAGING INDUSTRY IN INDIA - Indian Industry Profiles
www.indianindustryprofiles.com/newpackagingpresn.ppt accessed on 04/10/11
http://www.mckinsey.com/locations/india/mckinseyonindia/pdf/India_Pharma_2015.
pdf assessed on Sep 2009
http://www.nseindia.com/content/corporate/Beardsell_IER_base.pdf accessed on
20/12/11
www.webindia123.com/india/people.htm assessed on 25/04/2011
http://whqlibdoc.who.int/publications/2003/9241545992.pdf Adherence to long-term
therapies - Evidence for Action. WHO, 2003 accessed on 20/12/11
204
Paper/Article published by Thomas Mathew & Dr. R K Srivastava
• “The Role of Packaging in the Marketing Strategy of Pharmaceuticals
Products” ‘Synergy’ 2008, Volume VI No 1 pp 62-77
• “Strategic importance of the design of the pharmaceutical package for the
doctors in the four metro cities of India” - Asia Pacific Journal of Research
in Business Management’ 2011, Volume 2, Issue 11, Nov 2011 pp 56-72
• “Effect of the pharmaceutical packaging form & color on Indian doctors –
A study on four metro cities” - Asian Journal of Research in Business
Economics and Management” 2011, Volume 1, Issue 3, Dec 2011 pp 241-
252
• “Strategic implications and consequences of pharmaceutical packaging of
inhalers a study on Indian Doctors” Management of Innovation and
Technology (ICMIT), 2010 IEEE June 2010, pp 90-94 assessed from
http://ieeexplore.ieee.org/xpl/freeabs_all.jsp?arnumber=5492832
• “Indian cultural diversity affects attitudes to pharma packaging” William
Reed Business Media SAS 10-Jan-2011accessed from http://www.in-
pharmatechnologist.com/content/view/print/351826 on 24/04/2011
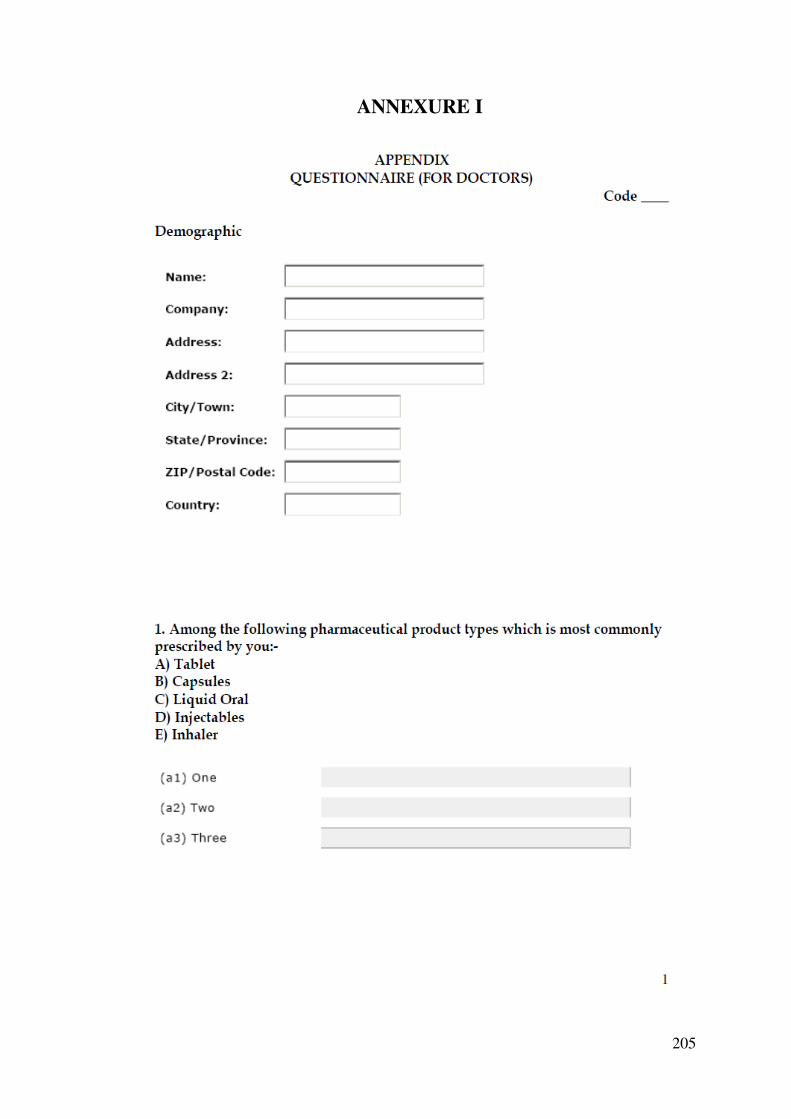
205
ANNEXURE I
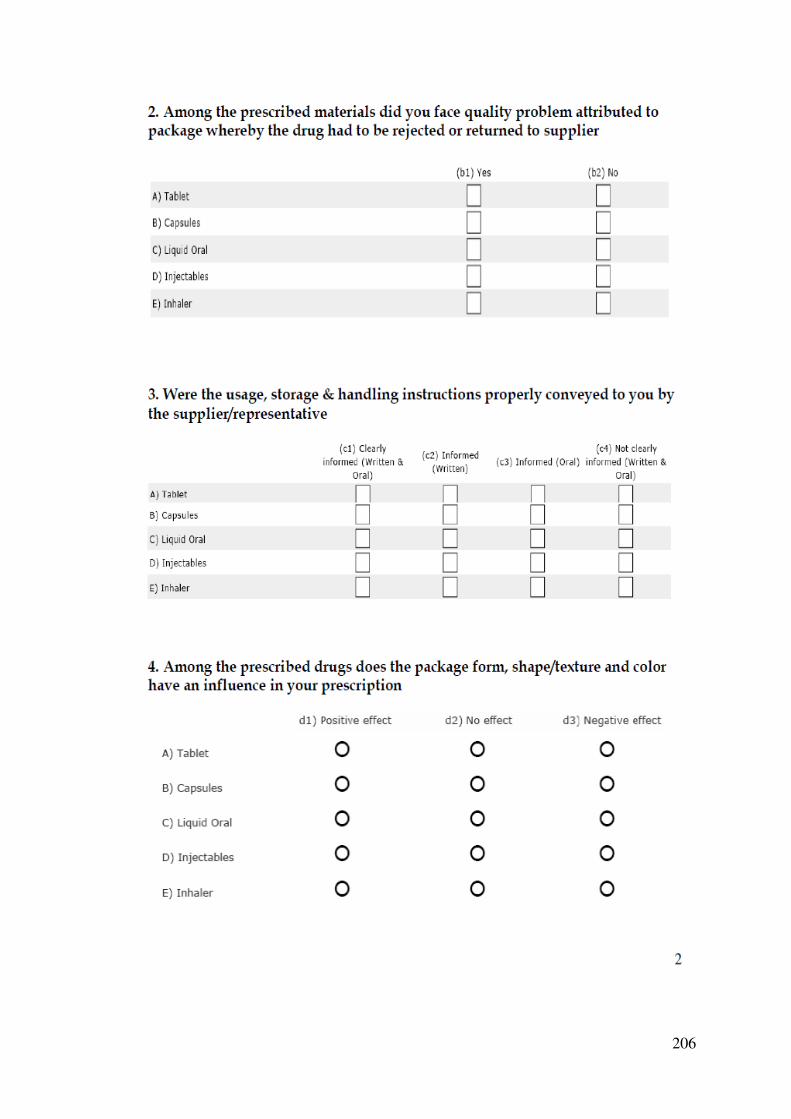
206
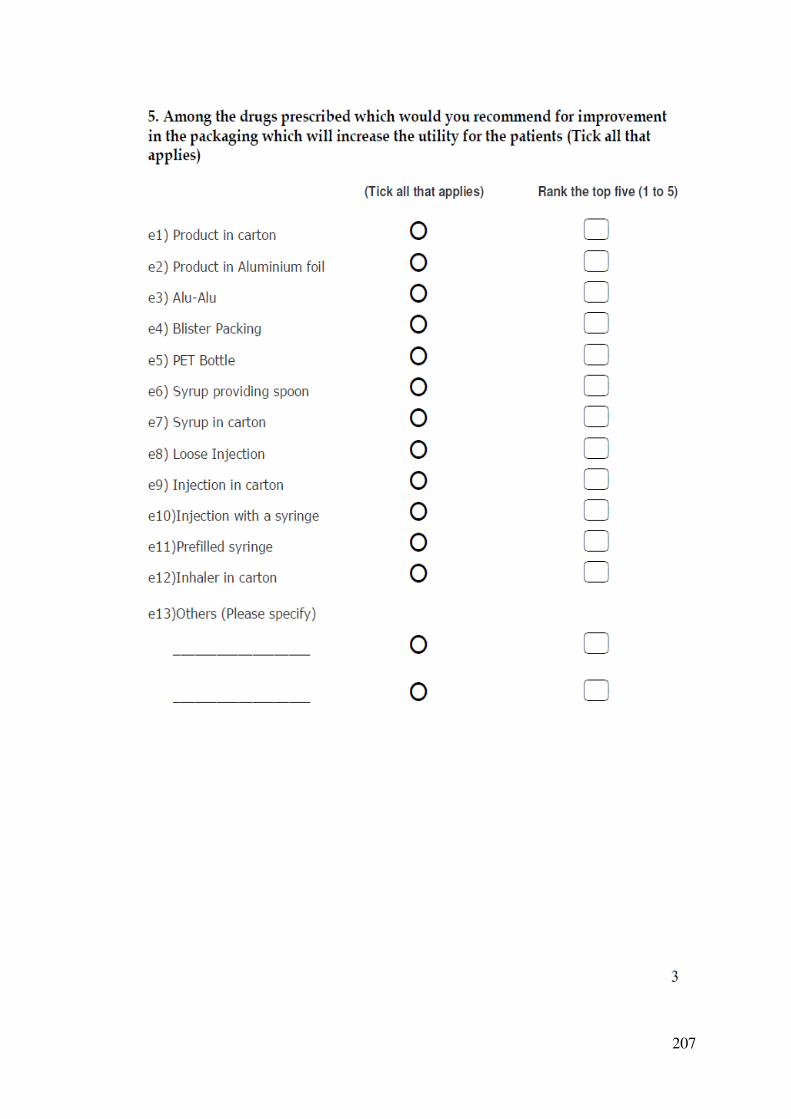
207
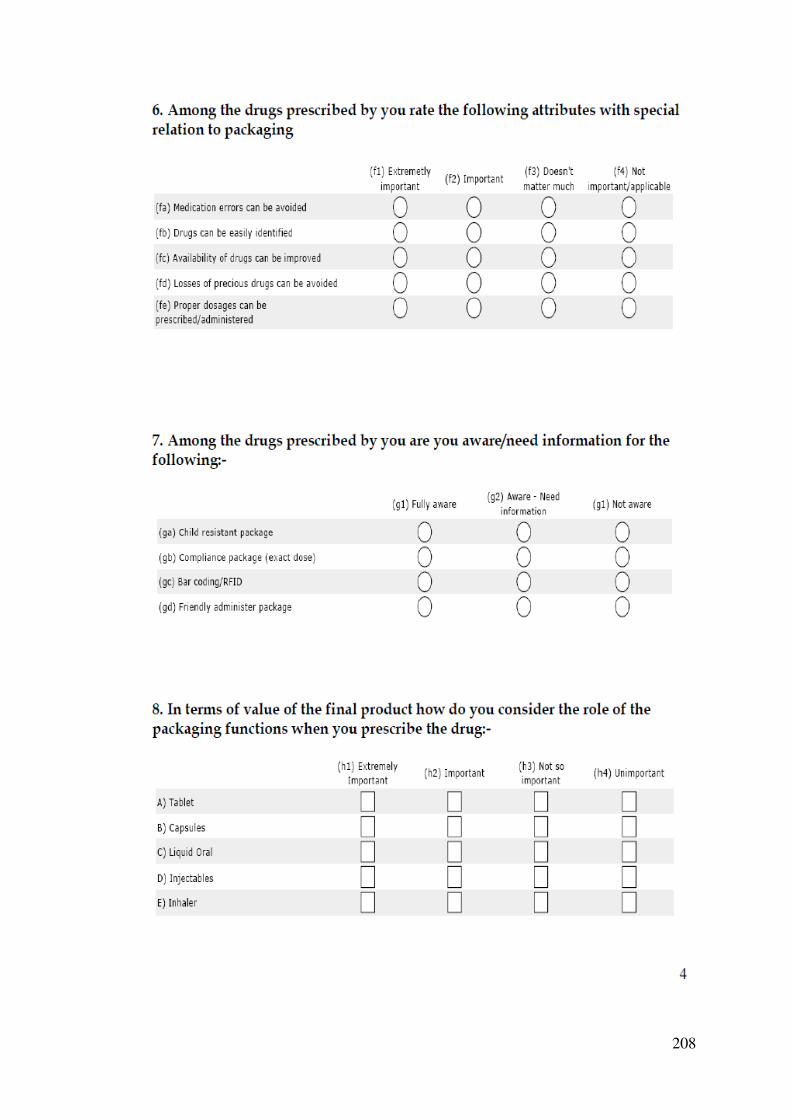
208
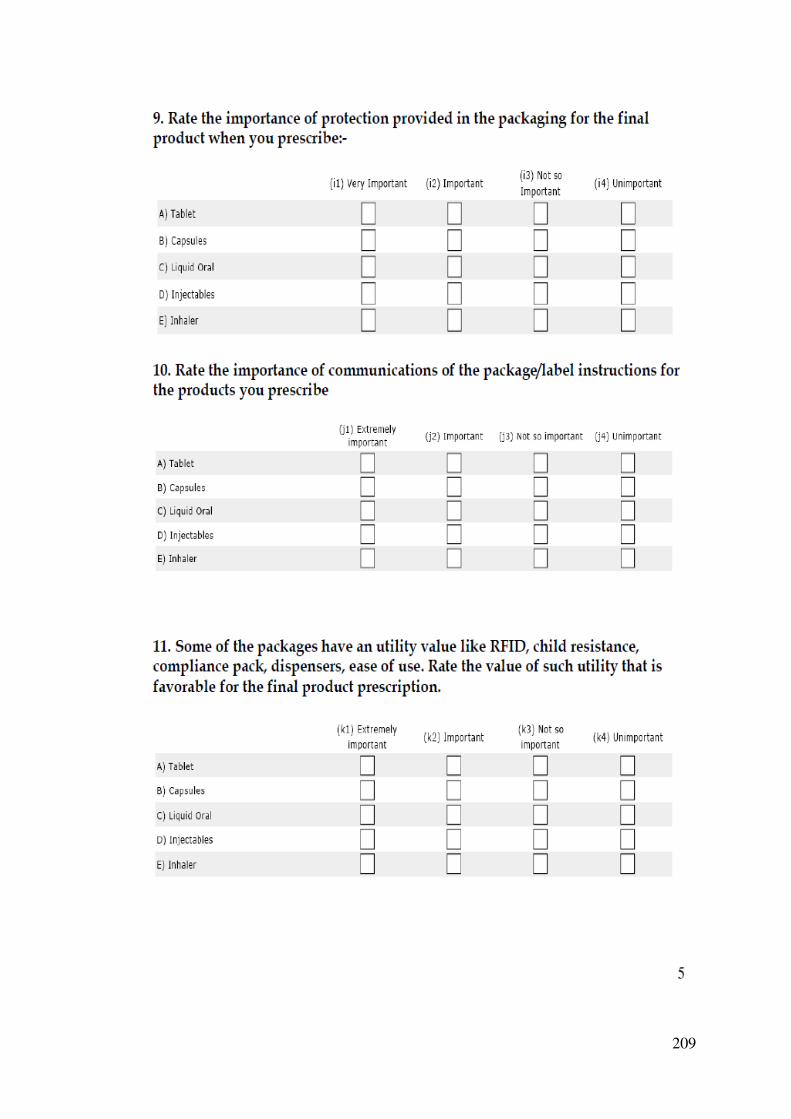
209
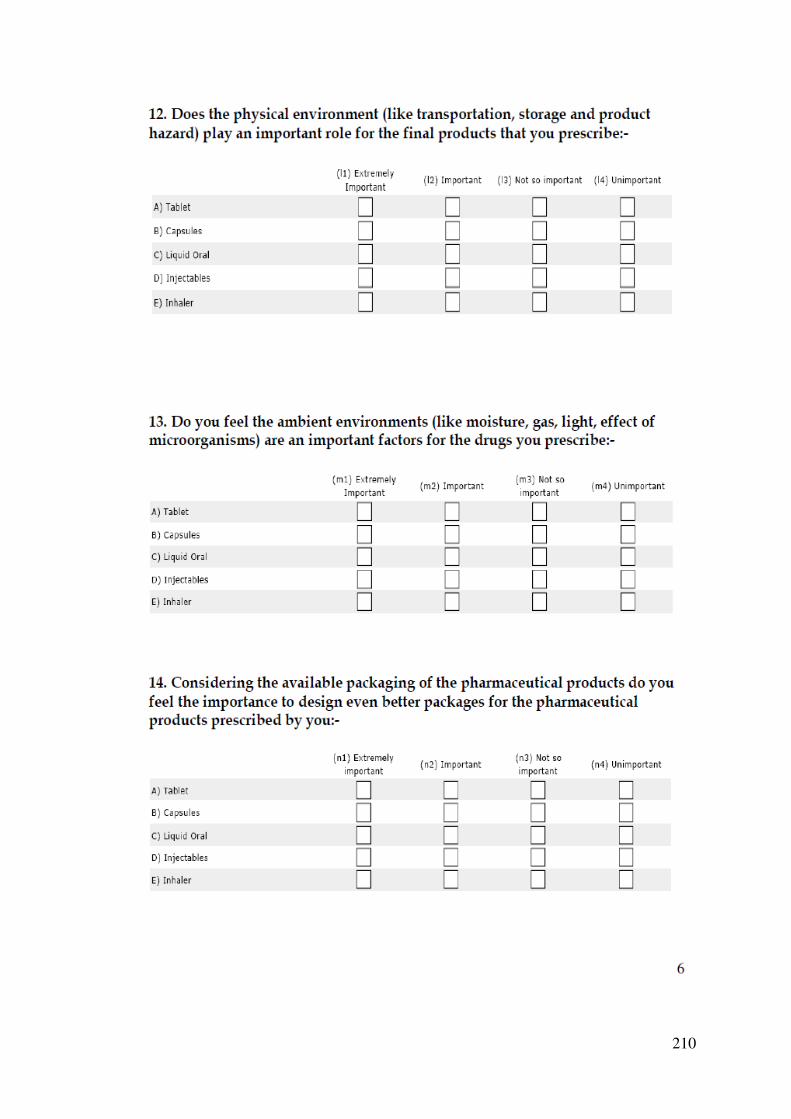
210
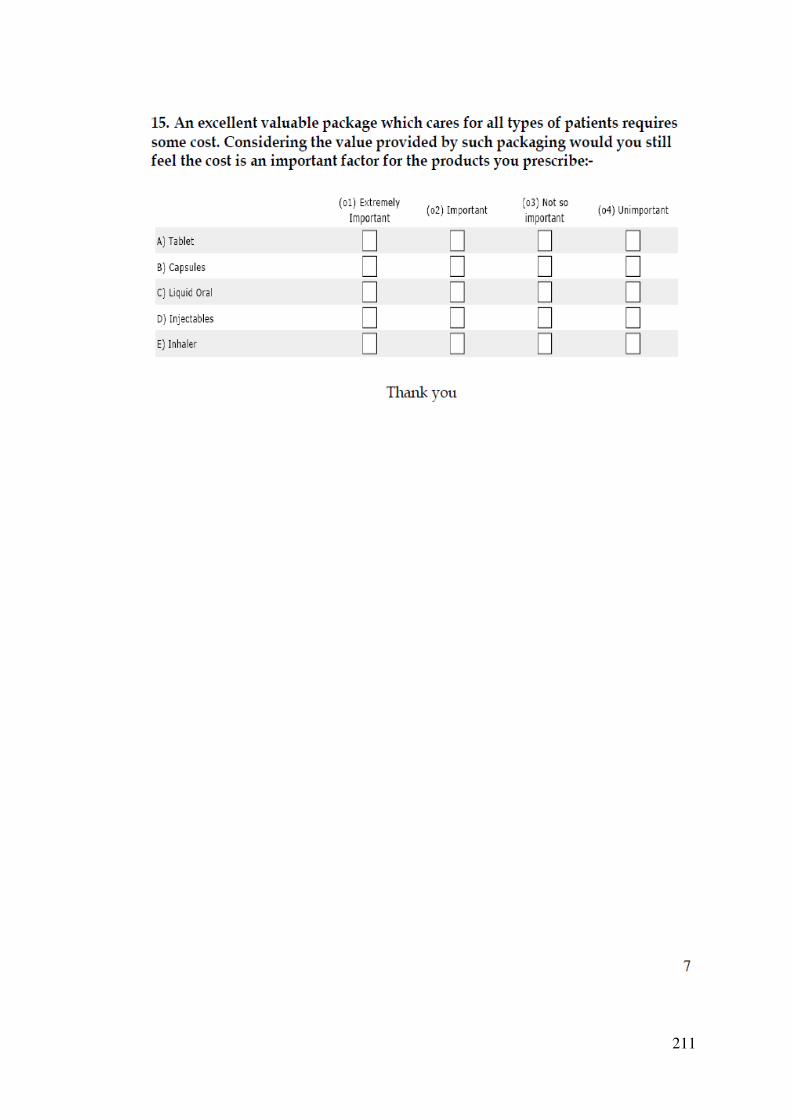
211
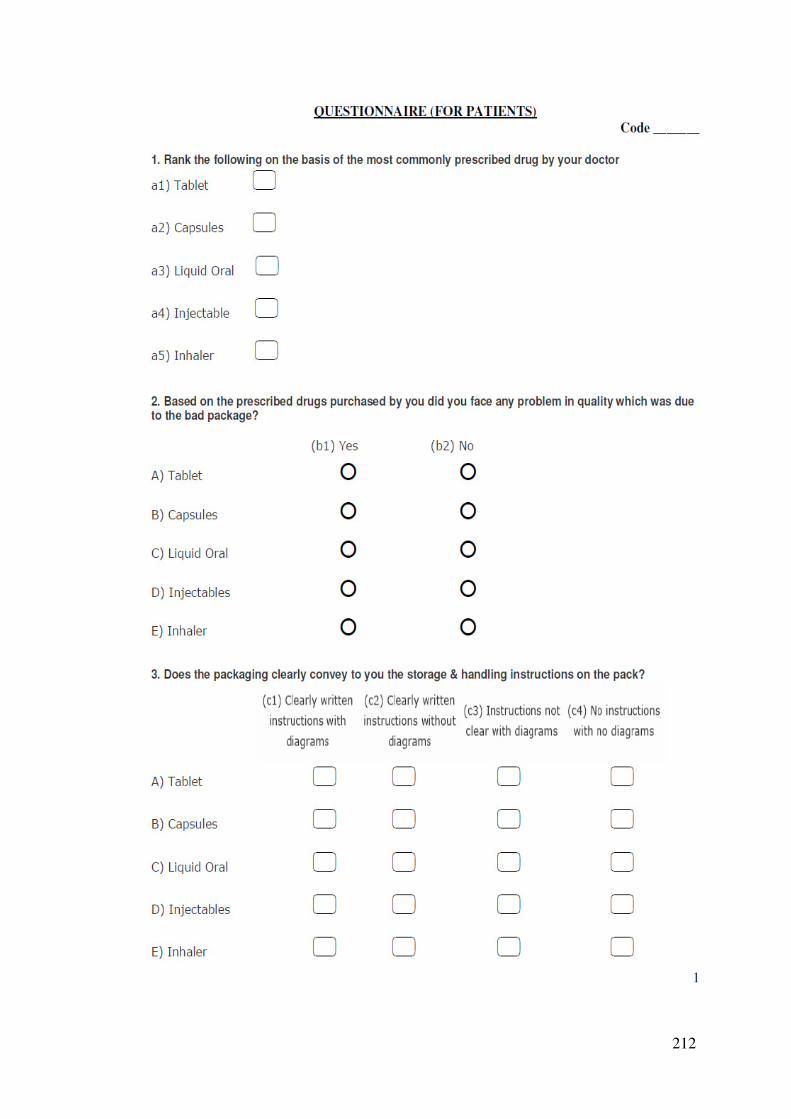
212
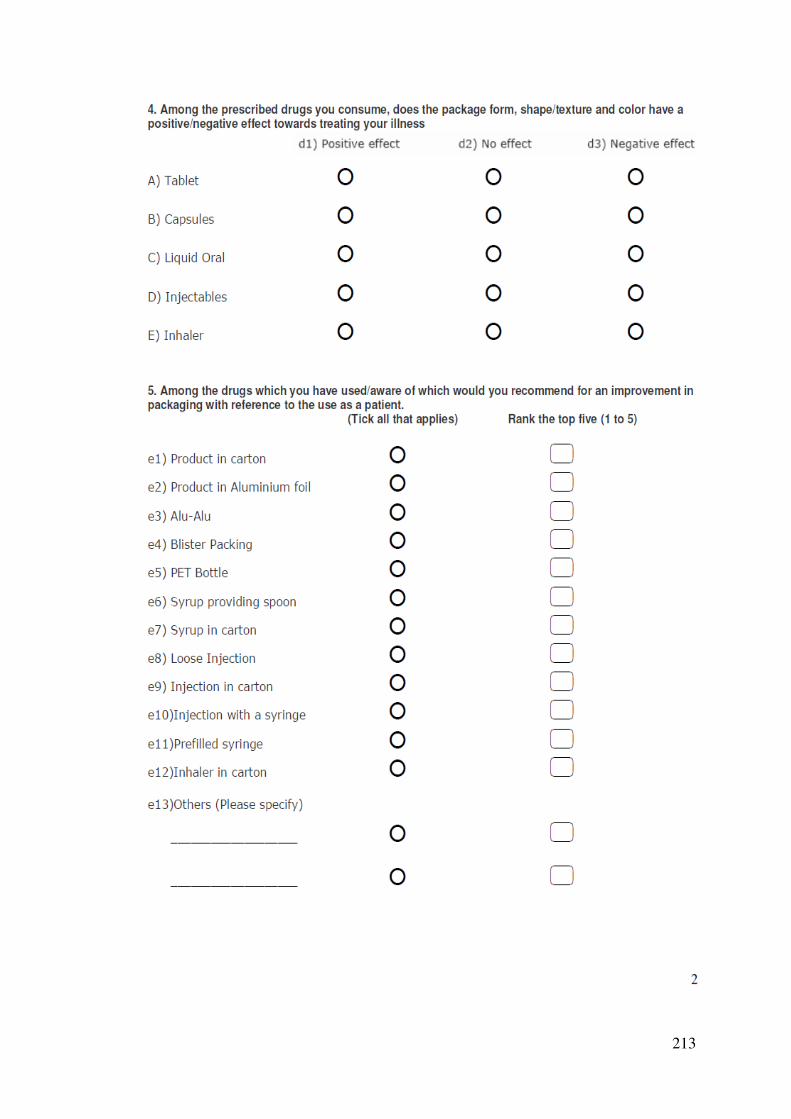
213
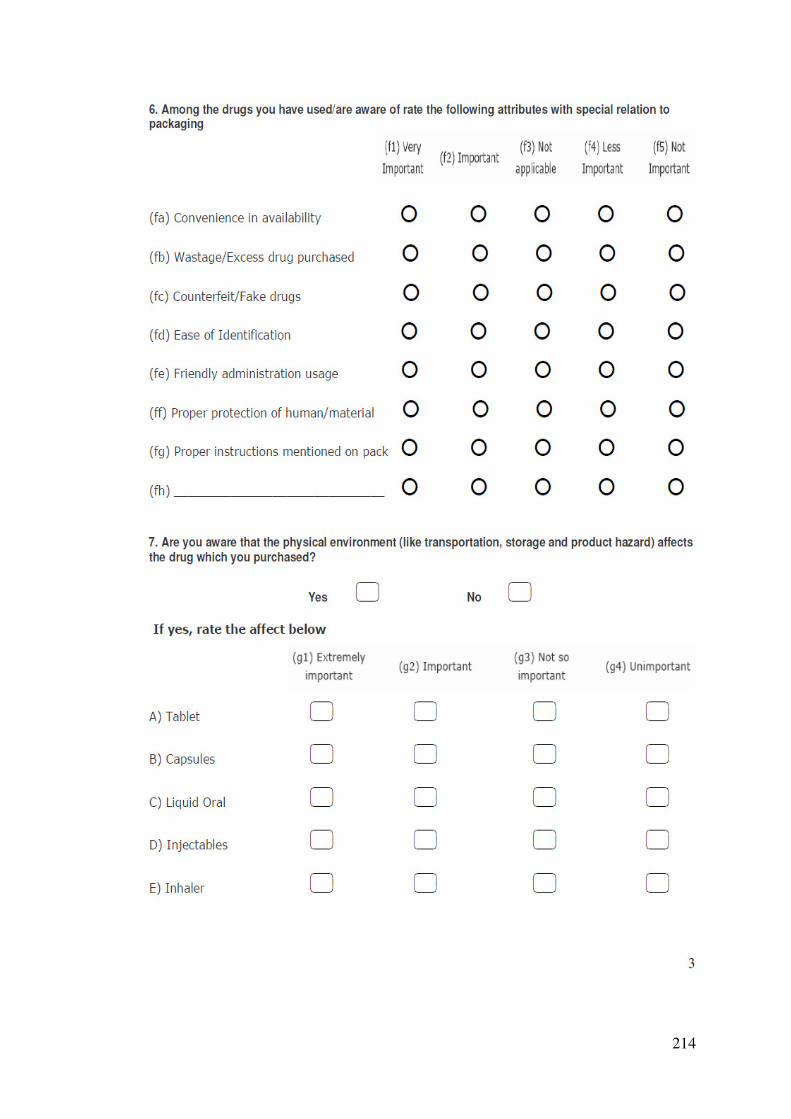
214
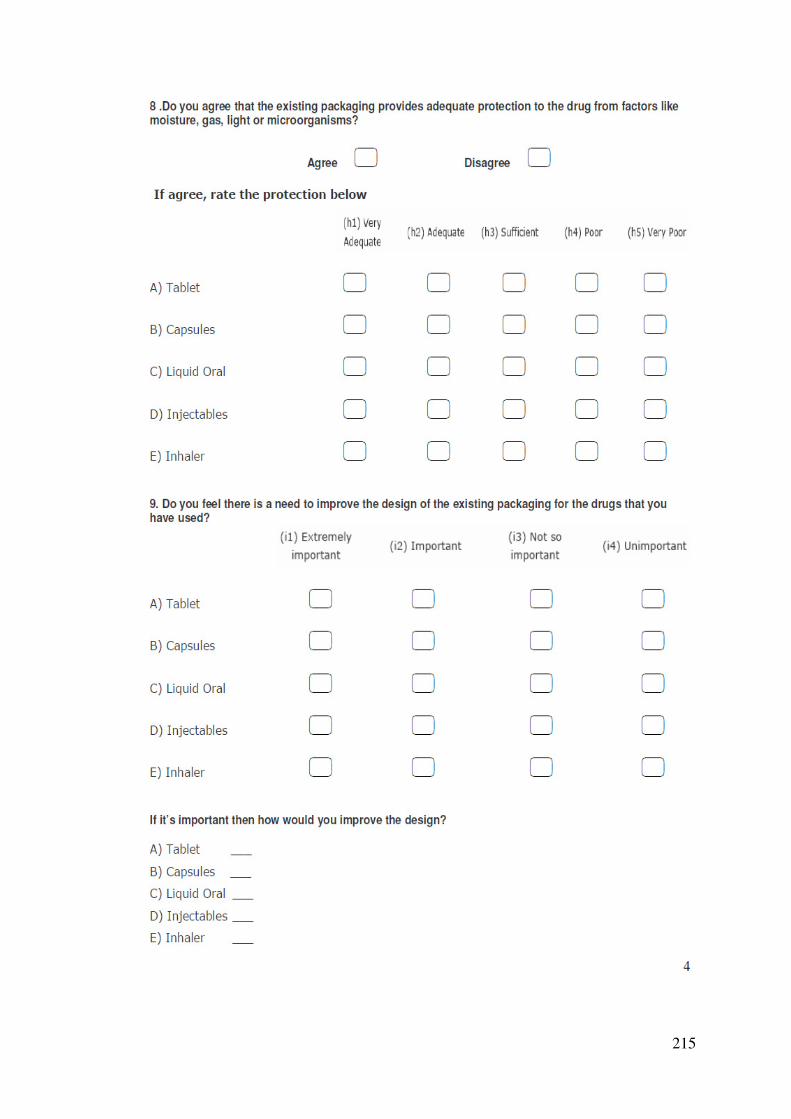
215
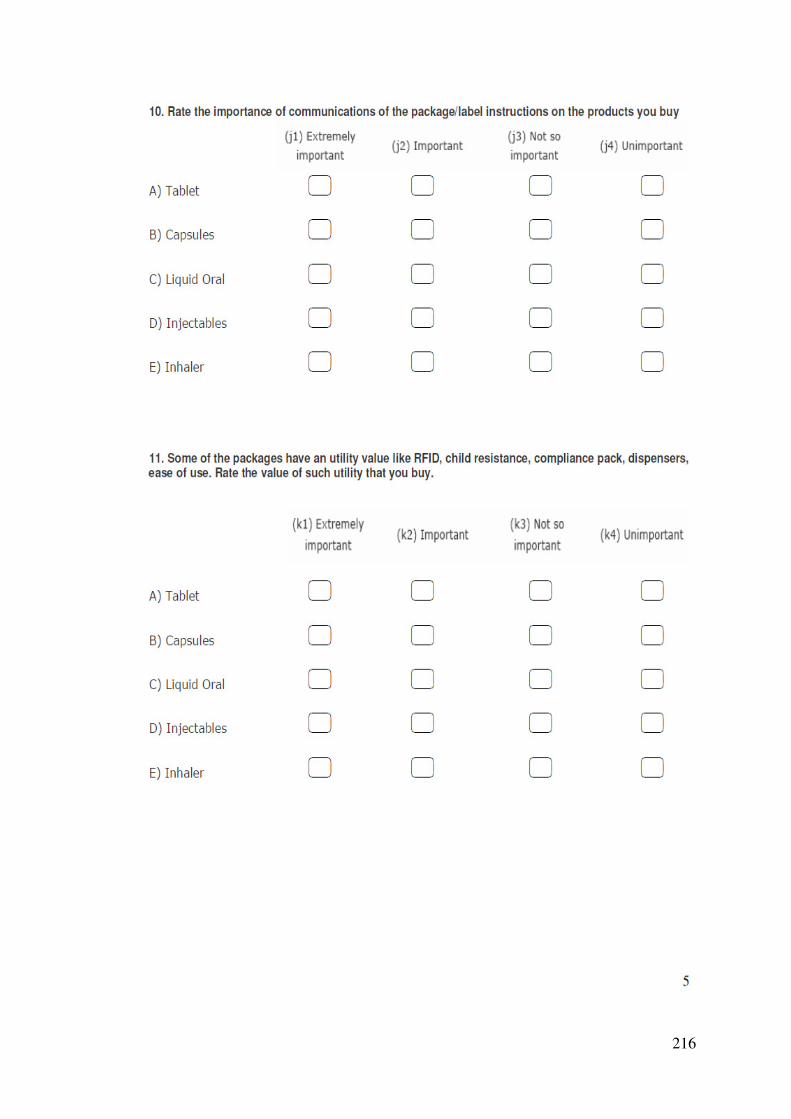
216
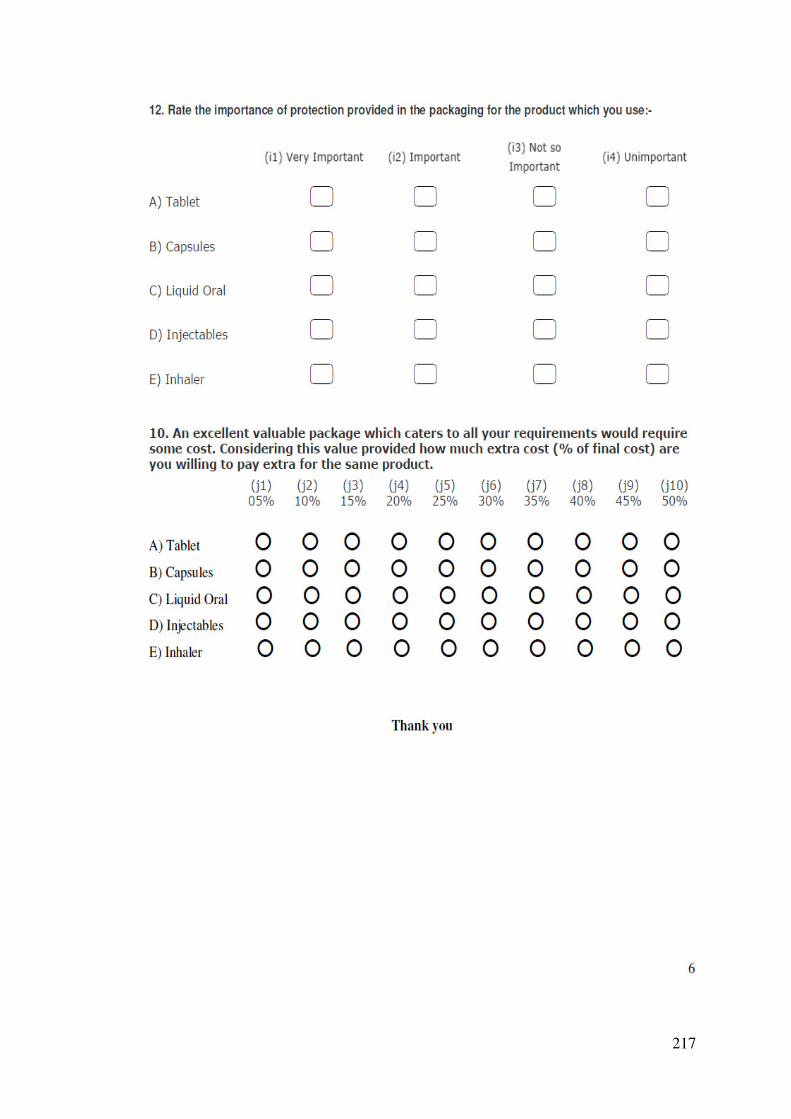
217
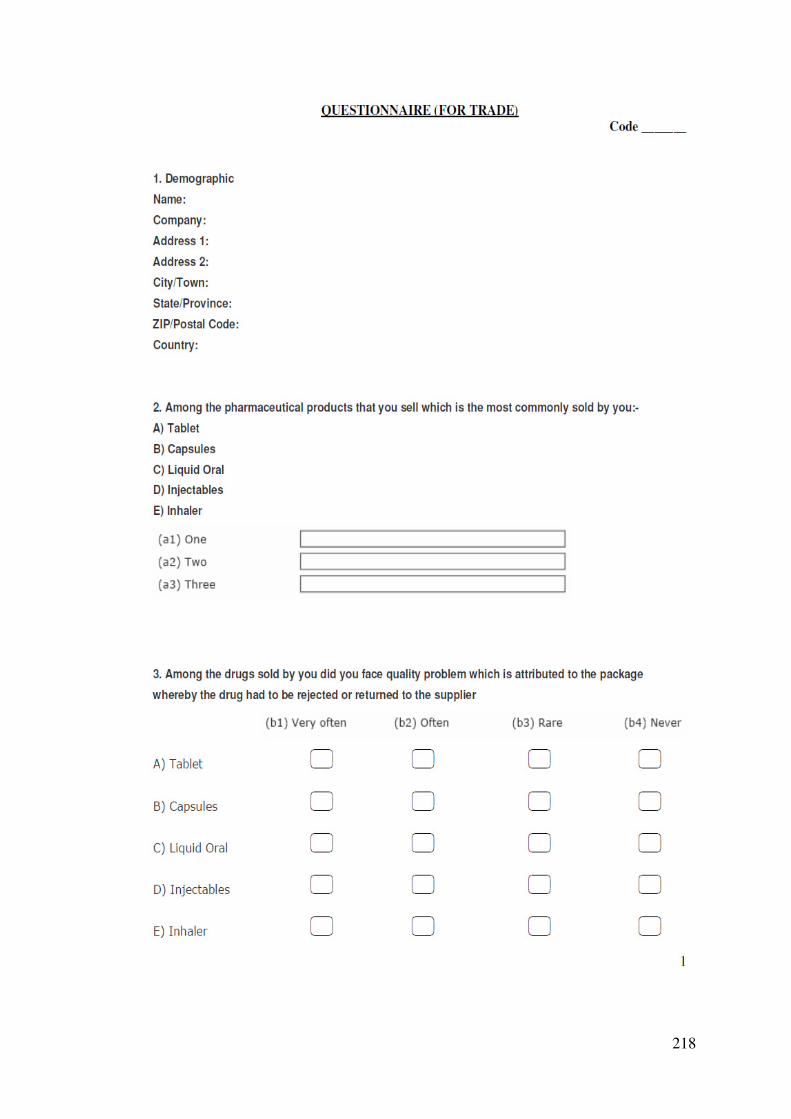
218
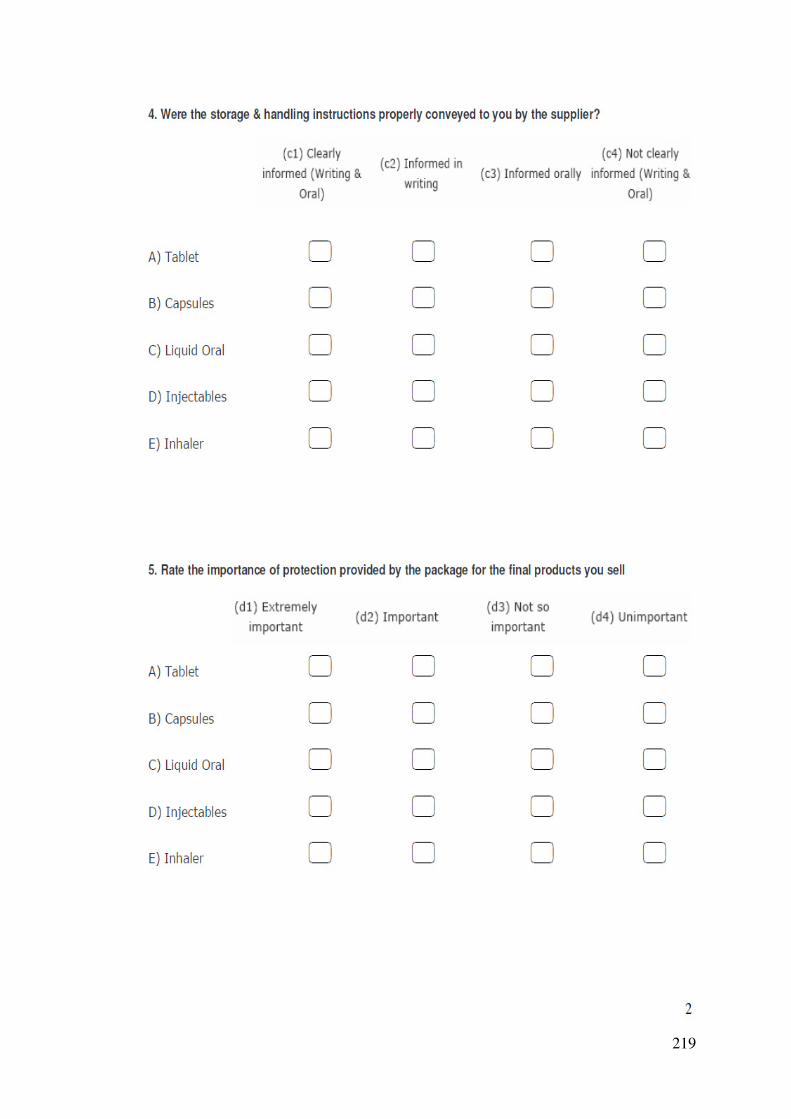
219
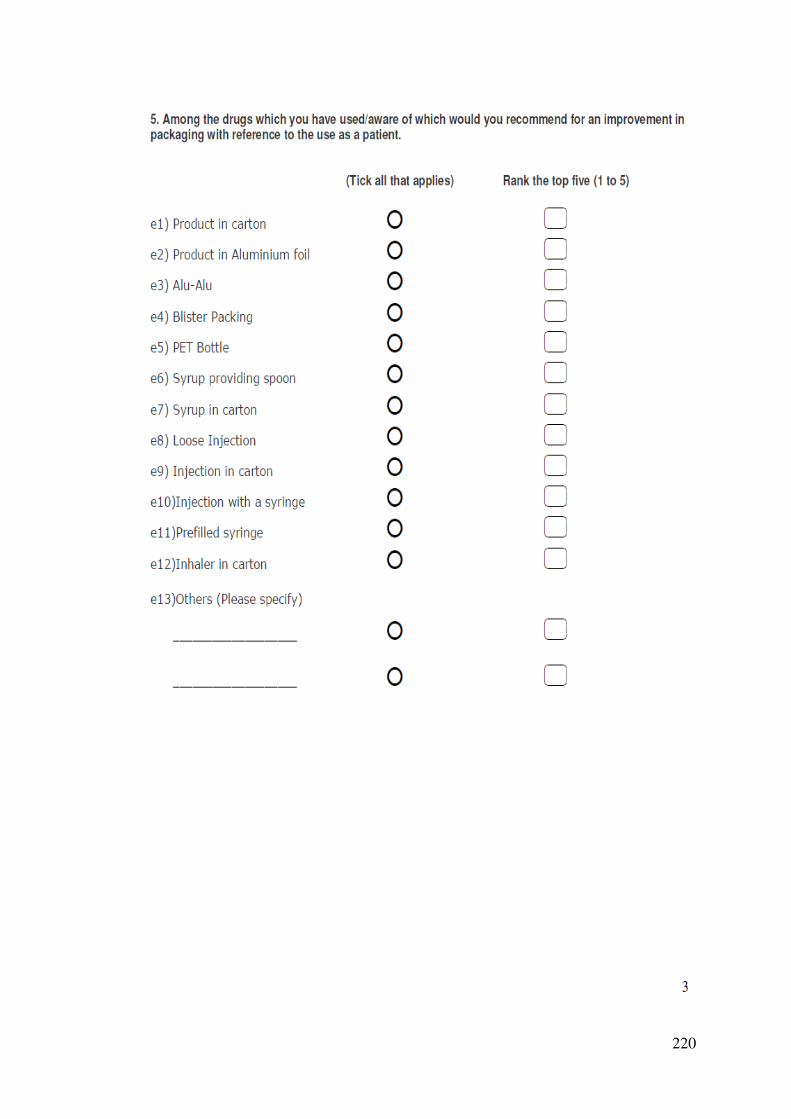
220
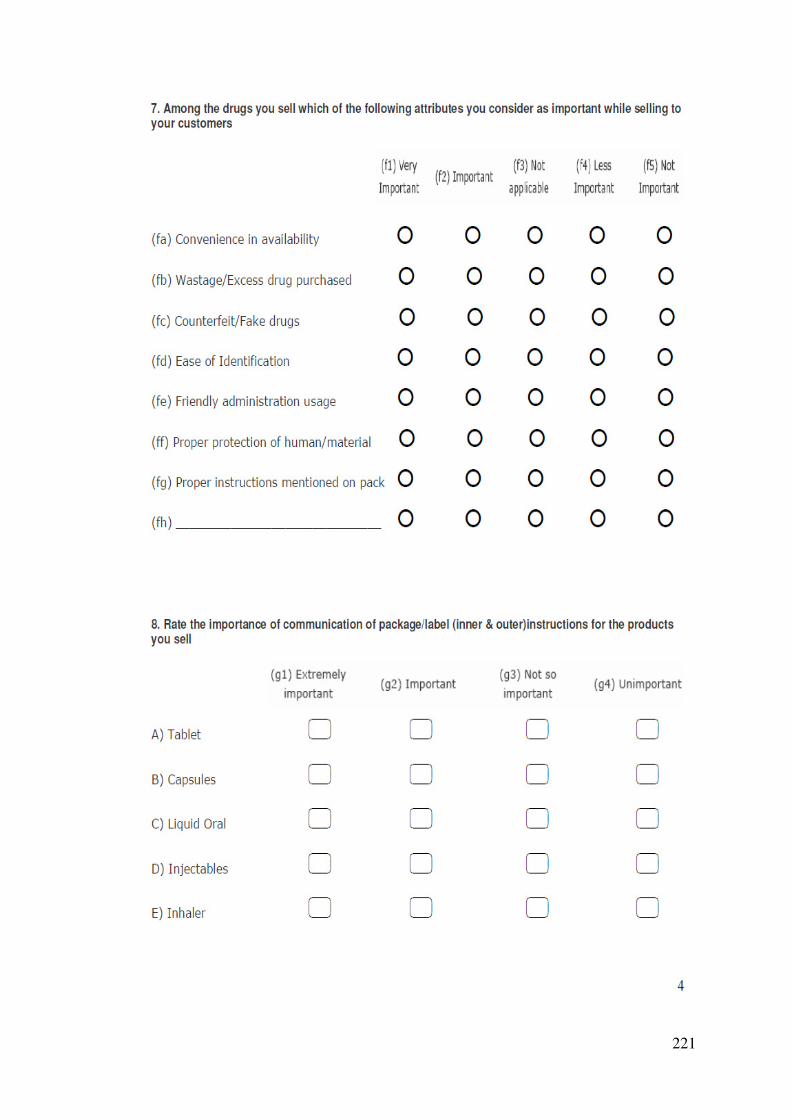
221
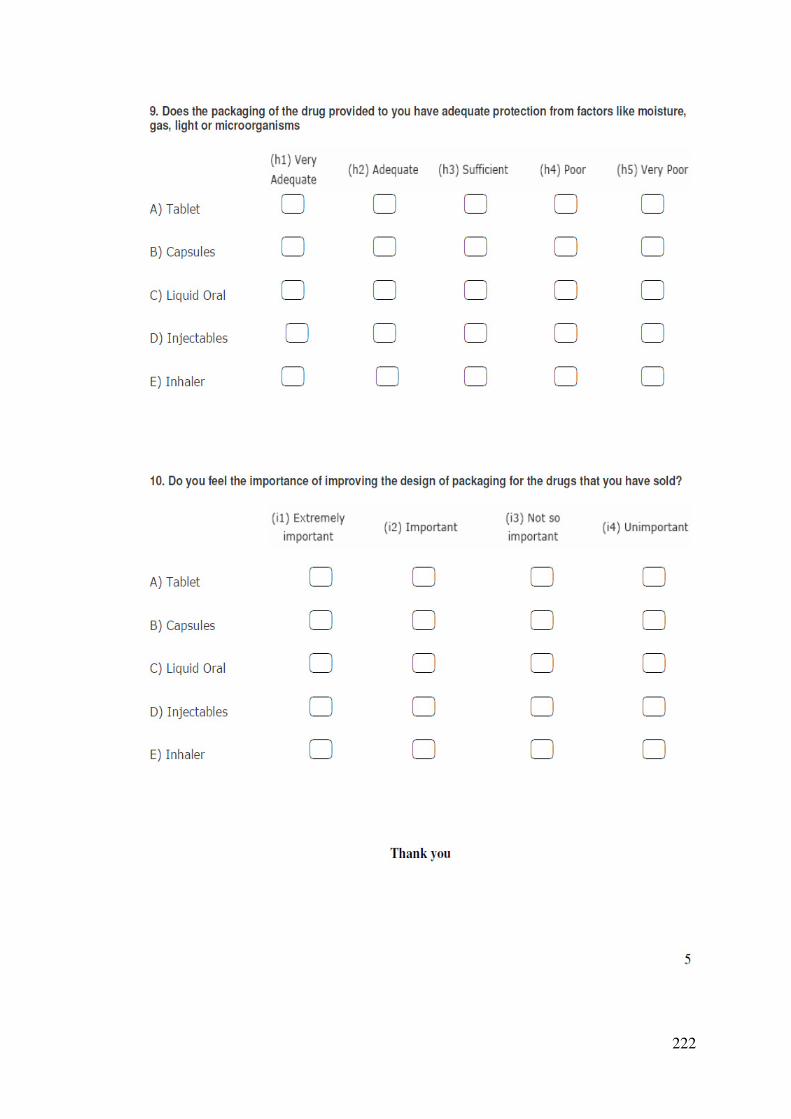
222