evaluating the effectiveness of integrated benders
TRANSCRIPT

Evaluating the Effectiveness of Integrated Benders
Decomposition Algorithm and Epsilon Constraint
Method for Multi-Objective Facility Location Problem
under Demand Uncertainty
Iman Rahimi1, Sai Hong Tang1, Abdollah Ahmadi2, Siti Azfanizam Binti Ahmad1, Lai
Soon Lee3, Adel M. Sharaf4
1. Department of Mechanical and Manufacturing Engineering, Faculty of Engineering, University Putra
Malaysia, Malaysia 2. Australian Energy Research Institute and the School of Electrical Engineering and
Telecommunications, University of New South Wales, Sydney, NSW 2032, Australia
3. Department of Mathematics, Faculty of Science, University Putra Malaysia, Malaysia 4. Department of Electrical and Computer Engineering, University of New Brunswick, Fredericton, NB,
Canada E3B 5A3
(Received: March 6, 2017; Revised: August 4, 2017; Accepted: August 27, 2017)
Abstract
One of the most challenging issues in multi-objective problems is finding Pareto
optimal points. This paper describes an algorithm based on Benders Decomposition
Algorithm (BDA) which tries to find Pareto solutions. For this aim, a multi-
objective facility location allocation model is proposed. In this case, an integrated
BDA and epsilon constraint method are proposed and it is shown that how Pareto
points in multi-objective facility location model can be found. Results are compared
with the classic form of BDA and the weighted sum method for demand uncertainty
and deterministic demands. To do this, Monte Carlo method with uniform function
is used, then the stability of the proposed method towards demand uncertainty is
shown. In order to evaluate the proposed algorithm, some performance metrics
including the number of Pareto points, mean ideal points, and maximum spread are
used, then the t-test analysis is done which points out that there is a significant
difference between aforementioned algorithms.
Keywords
Multi-objective optimisation, Benders decomposition algorithm, Demand
uncertainty.
Corresponding Author, Email: [email protected], [email protected]
Iranian Journal of Management Studies (IJMS) http://ijms.ut.ac.ir/
Vol. 10, No. 3, Summer 2017 Print ISSN: 2008-7055
pp. 551- 576 Online ISSN: 2345-3745
DOI: 10.22059/ijms.2017.229298.672575

552 (IJMS) Vol. 10, No. 3, Summer 2017
Introduction
Facility location problem is an important issue in many strategic
programs and has a crucial role in many transportation and
communication problems. Facility location problem has an impressive
effect on efficiency and cost, and has an application in transhipment,
switching, and sorting points as well as supply chain (Melo et al.,
2009; Rahimi et al., 2016; Tang et al., 2016). The capacitated facility
location problem extends this model by selecting from many possible
facilities for locating utilities which minimises the cost including the
sum of transportation costs and facilities opening cost. Based on the
model of Daskin et al. (2005), one of the core forms of capacitated
facility location is:
ij ij
i j
Min c z
(1)
subject to
,ij i
j
Z h i I
(2)
,ij j ij
i I
Z b X j J
(3)
0 ; ,ijZ i I j J
(4)
where I is the set of plants and J is the set of customers; Parameters
include cij The fixed cost of transporting between plant i and customer
j, hi The capacity of plant i, bj the demand of customer j; and the
decision variables include zil the amount of product transported
between plant i and customer j; Xij is equal to 1 if customer j is served
by plant i, 0 otherwise.
The objective Function (1) minimises the total cost (fixed facility
cost plus shipment). Equation (2) limits total products that should be
transported between facilities and customers for every customer.
Constraint (3) limits total products that should be transported to each
facility. Equation (4) is a simple non-negative equation.
However, several issues in facility location should be considered
such as cost, environment, social factors, efficiency, and so on.

Evaluating the Effectiveness of Integrated Benders Decomposition Algorithm and … 553
Performance measurement of facility location has been one of the
important keys of decision-making policies recently. Regarding this,
data envelopment analysis has been studied by some scholars
(Klimberg & Ratick, 2008; Moheb-Alizadeh et al., 2011). Data
Envelopment Analysis (DEA) is one of the mathematical
programmings having been used widely for measuring the
performance of decision-making units (DMUs) which uses the same
inputs and outputs. The DEA model was first introduced by Charnes
et al. (1978). One of the advantages of DEA is no need to convert
input or output measures to some common metrics, meaning that they
remain in their natural form. The fraction of the sum of weighted
output to the sum of weighted inputs is defined as the DEA score
(Mirghafoori et al., 2014; Danesh Asgari & Haeri, 2017; Torabi &
Mahlooji, 2017).
The most important issue in multi-objective optimisation is first
how to find Pareto optimal. Dabia et al. (2013) showed that a multi-
objective optimization problem is a non-deterministic polynomial NP-
hard problem. In Wang, Lai, and Shi’s study (2011), Pareto optimal
solutions are defined as the non-dominated solution for Multi-
Objective Optimization (MOO) problem. In this issue, several
approaches including metaheuristic and exact algorithms have been
developed to deal with multi-objective optimization problems.
Metaheuristic algorithms are approximate and usually non-
deterministic; Also, these methods are not problem-specific.
Metaheuristics are based on a systematic progression of random
evolution, and it has no mathematical proof, and its convergence
cannot be proved (Pishvaee et al., 2014). It has been proven that some
metaheuristics need some modifications to guarantee finding a local
optimum. Other main disadvantages of metaheuristics, when used for
optimisation, are mainly related to the apparent difficulties to control
diversity (Coello et al., 2007). Moreover, the role of the parameters of
the metaheuristic algorithms in its convergence and its loss of
diversity has been scarcely studied. It is valuable to notice that there is
no guarantee of the convergence of approximate methods. In contrast,
some mathematical programming by exhaustive search looks into all

554 (IJMS) Vol. 10, No. 3, Summer 2017
available space and tries to find the optimal solution, so it is
guaranteed to find the optimal solution. These approaches by
exhaustive search in all available search space, try to find the best
guaranteed optimal solutions among other solutions. One of these
approaches for solving these multi-objectives optimisation and
generating Pareto optimal is aggregating objectives using numerical
scalar weights. Using each weight results in the corresponding Pareto
solution and a varying number of scalar weights could produce the
corresponding set of Pareto solution. Weakness of the most current
methods is the lack of the well-distributed set of Pareto solutions
(Wang et al., 2011; Ismail-Yahaya & Messac, 2002).
Messac et al. (2003) applied normalised normal constraint method
for solving the multi-objective NP-hard problem and generating
Pareto frontier. Wang et al. (2011) applied normalised normal
constraint method used in Das and Dennis’s study (1998) for solving
their multi-objective NP-hard problem. They have used posterior
preference articulation approach and could produce special Pareto
solutions for DMs (decision makers). They have used their methods in
the four-echelon supply chain with six nodes including suppliers,
plants, warehouses and customers. However, they did not consider
uncertainty, different transportation modes in their multi-objectives
NP-hard problems.
Bender decomposition algorithm (BDA) is one of the techniques in
mathematical programming with guaranteed convergence. There are
two stages in Benders decomposition algorithm. The variables of the
original problem are split into two subsets so that a first-stage master
problem (MP) is solved with the first set of variables, and then the
solution of the first stage is used for the second stage so that the
second set of variables in the second stage is determined by a given
first-stage solution. If the sub-problem shows that master problem is
infeasible or is not optimal yet, then feasibility and optimality Benders
cuts are generated and added to the master problem, the algorithm is
repeated until no cuts can be generated (Benders, 1962).
Also, Benders decomposition provides a rich framework for
designing metaheuristics (Boschetti & Maniezzo, 2009). Boschetti and

Evaluating the Effectiveness of Integrated Benders Decomposition Algorithm and … 555
Maniezzo (2009) solved capacitated facility location problem as an
NP-hard problem with Benders decomposition metaheuristics. There
are some advantages of using BDA, for example, it is guaranteed that
this algorithm always converges and achieves an optimal solution;
moreover, it is based on algebra concepts (Pishvaee et al., 2014). In
this regard, Pishvaee et al. (2014) designed a multi-objective
possibility programming model for a real medical needle and syringe
supply chain network design problem under epistemic uncertainty of
input data. The resulted model is strongly NP-hard; a BDA is devised
to solve the model efficiently.
Abdolmohammadi and Kazemi (2013) developed BDA for
economic dispatch problem, also their algorithm provides a useful
framework for the non-convex region. Üster & Agrahari (2011) have
used strengthened cut for the convergence of lower and upper bounds
for their network design problem related to strategic decisions such as
location and capacity decisions. Osman and Demirli (2010) proposed
bilinear goal programming and BDA for their strategic problem. The
most contribution of their work is to reduce time in reaching an
optimal solution. In Yang and Lee’s (2012) work, reducing
computational time and the number of iteration are two main issues
which have been focused. They have proposed their approach to a
multiproduct batch plant scheduling problem. de Sá et al. (2013)
addressed BDA for single allocation hub location problem.
Recently, Abdolmohammadi and Kazemi (2013), and Charwand et
al. (2014) used Normal Boundary Intersection (NBI) and BDA for
their multi-objective framework; however, one drawback of the
combined NBI algorithm is that Pareto optimality solution is not
guaranteed (Das & Dennis, 1998; Ghane-Kanafi & Khorram, 2015).
Moreover, an uncertain parameter in supply chain network design
models is another important characteristic. The uncertainties can be
classified into two groups. They are random or stochastic, and non-
random or strategic uncertainties.
Aghezzaf (2005), Chan et al. (2001), Longinidis and Georgiadis
(2011), and Baghalian et al. (2013) are some authors who have
worked on uncertain demands. In this paper, demand uncertainty with

556 (IJMS) Vol. 10, No. 3, Summer 2017
Monte Carlo method would be discussed. Monte Carlo methods are
based on computing algorithm using repeated random number to
compute results (Rahimi et al., 2016). Table 1 reviews some works
which have applied BDA.
Table 1. A review of BDA
Author Description
Abdolmohammadi & Kazemi (2013) Heat and power economic dispatch
Üster & Agrahari (2011) Distribution network design
Montemanni (2006) Robust spanning tree problem
Kagan & Adams (1993) Multi-objective distribution planning problem
Osman & Demirli (2010) Integrating goal programming and BDA for
supplier selection
Oliveira et al. (2014) Petroleum product supply chain
de Sá et al. (2013) Hub location problem
Fortz & Poss (2009) Multi-layer network design
Çakır (2009) Multi commodity multi-mode distribution
planning
de Camargo et al. (2008) Multi allocation hub location problem
Esmaili et al. (2013) Hybrid power market
Chu & You (2013) Scheduling and dynamic optimisation
Al-Agtash & Yamin (2004) Electricity market
Charwand et al. (2015) Multi-objective electricity market
In the next section, the model is explained, then the classic form of
BDA, as well as the proposed method are applied to the model to find
the optimal Pareto solution. This model is an extension of Klimberg
and Ratick’s (2008); they have considered capacitated facility location
combined with data envelopment analysis as a bi-objective and
indeterministic model, then a new framework solution procedure has
been proposed for solving the proposed multi-objective facility
location problem under deterministic and uncertainty cases. For
demand uncertainty, Monte Carlo method with uniform function has
been proposed. Then, results of the proposed algorithm are compared
with the results found by the classic form of BDA, and the weighted
sum method and some statistical tests are examined to evaluate the
proposed solution approach.
Methodology
The problem above based on Klimberg and Ratick’s (2008) model is
as below:

Evaluating the Effectiveness of Integrated Benders Decomposition Algorithm and … 557
1 1
ax 1k l
kl
k l
M d
(5)
1 1 1
k l
kl kl k k
k l k
Min c b F y
(6)
.st
1
1k
kl
k
x l
(7)
,kl kx y k l (8)
1
,k
kl l
k
b dem l
(9)
min[ , ] , ,kl l mkl kb dem O y k l (10)
1
,I
ikl ikl kl
i
v I x k l
(11)
1
,J
jkl jkl kl kl
j
u o d x k l
(12)
1 1
0, , , , ( , )J I
jkl jrs ikl irs
j i
u o v I k l r s k r l s
(13)
u , , ,klj klj klo x k l j (14)
, ,kl klb x k l (15)
, , 0,1k l kx y (16)
, , , ,, , 0k l j k l j klu v b (17)
where k is the index of facility locations, l is the index of demand
locations, t is the set of inputs, f is the set of output.
i= 1. . . I: Inputs used at DMU
j= 1. . . J: Outputs produced at DMU
k= 1. . . r, . . ., KDMUs
dem(l) is the demands of the customer; Cap _k is the capacity of
facility k; is the cost of transportation from facility k to demand
point l; is equal to 1 if facility k serves demand l, 0 otherwise; yk is
equal to 1 if facility k is open; 0 otherwise; is the fixed cost of

558 (IJMS) Vol. 10, No. 3, Summer 2017
facility k; is the inefficiency of facility (DMU) k that serves
demand point l; are products which are transported between
facility k and demand point l; is the amount of the jth output for
the kth facility that serves demand point l; iklI is the amount of the ith
input for the kth facility which serves demand point l; uj is the weight
assigned to the jth output; vi is the weight assigned to the ith input.
Equation (5) maximises the total efficiency of all decision-making
units (DMUs), Equation (6) minimises the total cost including
transportation and facility location of DMUs. Constraint (7) makes
sure every demand must be satisfied by at least one facility. Constraint
(8) guarantees if one demand is served by one facility, that facility
must be open before. Equation (9) shows the demand of every
customer is equal to the total products that are transported from
facilities. Constraint (10) depicts maximum products which their
transport is equal to demand or capacity of the facility. Equation (11)
shows if facility k is open to serve demand l, then the sum of weighted
input of facility must be equal to 1; otherwise, 0. The variable kld is
defined as the inefficiency of DMU k. Therefore, constraint (12)
depicts efficiency of facility k that is open. Constraint (13) shows that
the sum of weighted output is less than the sum of corresponding
weighted inputs. Constraint (14) indicates that weight of output of
facility k which is open is less than 1. Equation (15) depicts that at
least one product is transported for demand l if facility k serves it.
Constraint (16) and (17) show that variables xk,l, yk are binary, and
variables, uk,l,j, vk,l,j, bkl are continuous. The problem mentioned above
is the capacitated formulation of combined DEA and facility location
model which simultaneously solves spatial efficiency and facility
efficiency. The first issue is measured by optimising cost while the
latter one is measured by DEA linear programming. The formulation
of this combination in a multi-objective framework has been able to
provide the decision makers with a way for measuring the interaction
between facility location pattern and those open sites’ performance.
These formulations obtain a trade-off between facility location and
facility efficiency, and may provide a strong approach for multi-
objective location analysis.

Evaluating the Effectiveness of Integrated Benders Decomposition Algorithm and … 559
The specific problem which is formulated in Equations (5) to (17)
is known as mixed integer programming optimization problem and is
defined as a combination of facility location problem and data
envelopment analysis. In the literature, several articles mentioned that
facility location problem is a complex issue and exact solution of this
kind of problem is NP-hard, and also an approximation of this
problem with a small error is known NP-hard (Fowler et al., 1981;
Megiddo & Tamir, 1982; Gonzalez, 1985).
The Proposed BDA
First of all, two objectives must be converted to a single one, in this
regard, epsilon constraint would be used. In this approach, the number
of objective functions is reduced, and the number of constraints is
increased. In minimization problem, an upper bound (epsilon value) is
considered for one of the objective functions as a new constraint
added to the model, then the problem is solved for the single objective
function (Laumanns et al., 2006; Aghaei et al., 2011; Khalili-
Damghani & Amiri, 2012).
First, for this purpose, initializing the value of epsilon, that can
change for constrained objective to find Pareto front, is used. Then,
the above problem is split into two parts; the master problem and sub-
problem that can be solved iteratively by using their solution
(Benders, 1962). The sub-problem includes continuous variables and
their related constraints, while the master problem includes integer
variables and a continuous one which relates the master and the sub-
problem together. The optimal solution for the master problem
provides lower bound for the objective function. By using this
solution that has been gained from the master problem and fixed
integer variables as inputs for the dual of the sub-problem, it is solved
resulting in upper bound for the objective function. Also, by solving
dual of primal sub-problem, one Benders cut is produced including
continuous variables that are added to the master problem. In the next
iteration, this cut is added to the master problem and then updates the
lower bound for the objective function that it is guaranteed which
current solution is not worse than previous lower bound. So, the

560 (IJMS) Vol. 10, No. 3, Summer 2017
master and the sub-problem are solved iteratively until the end. The
requirement for finishing this loop is to reduce the distance between
lower and upper bound. After finding one optimal point, value of
epsilon should be changed to obtain a new optimal point. BDA is
dependent to decompose one mixed integer programming into a
master problem and one sub-problem that iteratively would solve
using the other solution. The master problem includes only integer
variables and one auxiliary variable. The primal master problem and
the sub-problem are introduced as follow:
Primal master problem
1
.K
k k
k
Min F y
(18)
subject to
Equations (7), (8).
(19)
where Equation (18) is the binary section of Equation (6).
Benders sub-problem
Benders sub-problem (BSP (u, v|x, y)) is a maximisation problem that
finds the optimal value of continuous variable x, y for fixed integer
variables . The primal sub-problem is written as below:
1 1
k l
kl kl
k l
Min c b
(20)
subject to
1 1
1k l
kl
k l
d
(21)
1
,I
klikl ikl
i
v I x k l
(22)
1
,J
kljkl jkl kl
j
u o d x k l
(23)
1 1
0, , , , ( , )J I
jkl jrs ikl irs
j i
u o v I k l r s k r l s
(24)

Evaluating the Effectiveness of Integrated Benders Decomposition Algorithm and … 561
1
,k
kl l
k
b dem l
(25)
min[ , ] , ,kl l mkl kb dem O y k l (26)
u , , ,klklj kljo x k l j (27)
, ,klklb x k l (28)
Notice that here integer variables are fixed that already are found in
the previous step by solving the master problem.
For producing Benders cut for the master problem, dual of
( , , )BSP u v x y would be used ( 1 2 3 4 5 6 7 8, , , , , , ,kl kl kl klj kl kl klj kl ). For
using dual variables 1 2 3 4 5 6 7 8, , , , , , ,kl kl kl klj kl kl klj kl would be
employed for every Constraint (21)-(28). It is assumed that Equations
(22), (23), and (25) are considered as an inequality. By using these
variables, dual problem, 1 2 3 4 5 6 7 8( , , , , , , , , )kl kl kl klj kl kl klj klDBSP x y is
as follow:
1 2 4 5 6 7 8. . .x .dem .min[dem ]. .x .kl kl kl kl kl kl kl l kl l k kl kl klMin x x y (29)
.s t2 1 ,kl k l (30)
1 2,kl kl free (31)
4 5 6 7 8, , , , 0kl kl kl kl kl (32)
Benders’ master problem
Benders’ master problem is as follows:
max z (33)
subject to
1 2 4 5 6 7 8
1 1
1 . . .x .dem .min[dem ]. .x . ,k l
kl kl kl kl kl kl kl kl l kl l k kl kl kl
k l
z d x x y k l
(34)
1 2 4 5 6 7 8. . .x .dem .min[dem ]. .x . 0kl kl kl kl kl kl kl l kl l k kl kl klx x y (35)
Equations (7) and (8).
In this model, Equation (33) presents the objective function of the

562 (IJMS) Vol. 10, No. 3, Summer 2017
master problem. Equation (34) is the optimality cuts added to the
master problem. Also, in these equation dual parameters are from the
sub-problem; the solutions used are fixed in this step. Equation (35) is
the feasibility cut which in case the sub-problem is infeasible. It is
added to the master problem. Figure 1 shows the procedure of the
proposed method.
Fig. 1. Flowchart of the proposed method
where Equation (36) is as below:
1 2 4 5 6 7 8
1 1
1 . . .x .dem .min[dem ]. .x . ,k l
kl kl kl kl kl kl kl kl l kl l k kl kl kl
k l
d x x y k l
(36)

Evaluating the Effectiveness of Integrated Benders Decomposition Algorithm and … 563
Results
In this section, numerical analysis would be tested and compared with
classic BDA. Both cases, that are deterministic and uncertainty under
Monte Carlo method with the uniform function will be shown to
verify the stability of the proposed method towards different
conditions. GAMS software is especially designed for the above
model. To illustrate the proposed method, numerical analysis from
Klimberg and Ratick (2008) would be used. The proposed model and
solution approach are applied to a simulation data based on the real
case study. In this regard, the value of efficiency is based on DEA
efficiency and cost is based on Malaysia’s currency (Ringgit). There
are four facilities which tend to be located in 8 potential location sites
and 18 customer locations that their demand must be satisfied. It is
tried to use standard data ranged in real, so we simulated real data
from the website www.investpenang.gov, based on a starting business
in Malaysia. However, in this approach, classical BDA is applied for
finding Pareto points. This cost includes facility location and
transportation cost. When DEA objective is optimised, another one
(cost objective) increases significantly since the model tries to locate
the minimum number of facilities and assign demands to the minimum
available warehouses to maximise DEA efficiency score. The model is
formulated for multi-products plants, for this matter, Table 2 shows
demands of customers based on kilogram per unit. It has been
considered 8 products which should be served by 18 customer zones.
Table 2. The demand of customers
product Demand(kg)
i1 i2 i3 i4 i5 i6 i7 i8 i9 i10 i11 i12 i13 i14 i15 i16 i17 i18
product1 37 61 96 45 43 45 43 55 65 34 54 33 54 23 44 65 66 76
product2 64 53 54 78 29 27 35 52 27 44 28 31 59 60 67 30 60 76
product3 24 73 21 33 26 27 53 59 47 68 55 43 61 49 22 72 21 68
product4 26 65 40 26 56 79 71 79 74 37 68 50 26 68 38 45 74 56
product5 69 26 68 60 68 41 20 66 48 63 66 61 66 21 56 42 37 44
product6 52 33 76 77 68 76 74 66 72 39 63 24 51 35 55 29 72 50
product7 53 36 54 41 62 68 23 33 47 50 52 27 33 53 37 56 51 75
product8 46 45 53 38 66 22 55 59 56 58 27 44 52 71 76 63 57 59

564 (IJMS) Vol. 10, No. 3, Summer 2017
To facilitate sites in potential location, various plants with different
size and capacity are considered. Table 3 depicts fixed cost of opening
plants. The size of products, weights, distance, and type of vehicles
are factors which are considered to measure transportation cost. For
this issue, Table 4 implies transportation cost between plants and
customer zones.
Table 3. The fixed cost of opening plants in different candidate locations (*100 RM)
No j1 j2 j3 j4 j5 j6 j7 j8
p1 350 630 240 420 380 430 450 530
p2 520 420 360 450 430 510 740 510
p3 420 520 280 670 360 310 640 340
p4 360 480 650 720 780 680 630 520
Table 4. The transportation cost between facilities and customers (RM)
i1 i2 i3 i4 i5 i6 i7 i8 i9 i10 i11 i12 i13 i14 i15 i16 i17 i18
j1 805 850 598 850 990 931 869 528 823 962 500 564 697 761 681 969 874 900
j2 792 924 612 623 958 986 554 595 549 861 539 927 662 936 802 934 955 896
j3 966 898 960 614 676 924 963 677 778 673 899 639 548 636 588 699 922 975
j4 765 709 793 694 795 570 611 506 558 869 923 714 500 745 655 959 717 814
j5 829 972 881 721 846 676 518 752 585 761 957 833 508 986 940 633 709 548
j6 850 896 809 605 833 654 519 834 769 632 867 565 763 782 728 628 512 565
j7 942 550 958 804 610 818 834 819 546 858 817 812 771 768 994 988 939 659
j8 734 746 611 615 604 971 910 526 535 575 575 554 628 696 932 937 881 1000
As it is evident from the comparison of Figure 2 with Figure 3, the
proposed method is more able to capture more Pareto points, rather
than classic Benders decomposition under uncertainty condition. For
uncertainty, demands are assumed to be distributed by Monte Carlo
method and uniform function. The classic form of BDA under
uncertainty is fragile, but the integration of epsilon constraint and
BDA catches more suitable Pareto solution. Classic Benders
decomposition approach can find some Pareto points in deterministic
case. However, there is a drawback in finding true Pareto optimality
while the proposed method is more capable of finding more optimality
points in better quality and discipline. In other words, the proposed
algorithm benefits from epsilon constraint solution that could cover
non-convex points while the classic form of BDA and the weighted

Evaluating the Effectiveness of Integrated Benders Decomposition Algorithm and … 565
sum method possesses the weakness of not being able to find Pareto
points of the non-convex optimisation problem.
Fig. 2. Pareto front for uncertainty by classic BDA
Fig. 3. Pareto front for uncertainty case by the proposed method
Quality is the most important characteristic that is found in
applying the proposed BDA against the classic form of BDA under
uncertainty (Figs. 2 and 3). For uncertainty Monte Carlo method,
which relies on repeating, random sampling with uniform function is
used. As it is apparent from Figure 2, there is no quality in Pareto
optimality when classic BDA is used while the proposed method is
stable against uncertainty (Figure 3).
0
2
4
6
8
10
12
14
16
0 1000 2000 3000 4000 5000
effi
cien
cy
cost
Pareto optimality obtain by classic bender decomposition
0
2
4
6
8
10
12
14
16
0 500 1000 1500 2000 2500 3000 3500 4000
Eff
icie
ncy
Cost
Pareto optimality obtain by proposed method under
uncertainty

566 (IJMS) Vol. 10, No. 3, Summer 2017
In the next section, for further evaluating these algorithms, some
performance metrics including some Pareto points, mean ideal points,
and maximum spread are used which are described as below.
Number of Pareto Solution
To check the reflect of change and variation under different
conditions, design of experiment (DOE) is proposed, thus, Taguchi
method is suggested (Taguchi, 1986; Behmanesh & Rahimi, 2012). It
consists of five parameters including the fixed cost, the transportation
cost, the inputs, the outputs, and the demand as factors for DOE and
three levels including low level (number 1), medium level (number 2),
and high level (number 3) resulting in 27 experiments. Table 5 shows
the parameter set for the design of experiments that should be done.
The numbers allocated in Table 5 indicate the level of each parameter.
Table 5. Design of experiments
Factor A Factor B Factor C Factor D Factor E
1 1 1 1 1
1 1 1 1 2
1 1 1 1 3
1 2 2 2 1
1 2 2 2 2
1 2 2 2 3
1 3 3 3 1
1 3 3 3 2
1 3 3 3 3
2 1 2 3 1
2 1 2 3 2
2 1 2 3 3
2 2 3 1 1
2 2 3 1 2
2 2 3 1 3
2 3 1 2 1
2 3 1 2 2
2 3 1 2 3
3 1 3 2 1
3 1 3 2 2
3 1 3 2 3
3 2 1 3 1
3 2 1 3 2
3 2 1 3 3
3 3 2 1 1
3 3 2 1 2
3 3 2 1 3

Evaluating the Effectiveness of Integrated Benders Decomposition Algorithm and … 567
The first metric used to measure is the number of Pareto solution
that is gained with two algorithms. Based on experiments which are
designed and depicted in Table 5, 27 tests are run, and results have
been presented in Table 6.
Table 6. The number of Pareto solution for the weighted sum method and the proposed
algorithm
Experiment run The weighted sum method The proposed algorithm
1 3 13
2 3 14
3 3 14
4 3 15
5 4 13
6 4 14
7 4 14
8 5 14
9 5 13
10 5 14
11 4 15
12 4 14
13 5 13
14 3 14
15 4 14
16 5 13
17 4 14
18 4 15
19 5 14
20 3 14
21 4 14
22 4 14
23 3 14
24 4 14
25 4 14
26 4 14
27 4 14
From Table 6, it is observed that the proposed algorithm has more
Pareto points than the weighted sum method which is more desirable.
Mean Ideal Point (MID)
Another factor for measuring performance is mean ideal point which
means the closeness of Pareto point solutions and ideal points
(Arjmand & Najafi, 2015). This metric is formulated as below.

568 (IJMS) Vol. 10, No. 3, Summer 2017
1 2
1
n
j j
i
f f
MIDn
(37)
which n shows the number of Pareto solutions, and f1j, f2j implies the
first and the second objective values of the ith objective function.
With regard to the above, MID measurement for these two
algorithms is calculated and presented in Table 7.
Table 7. The mean ideal point for the sum weighted method and the proposed algorithm
Experiment run The weighted sum method The proposed algorithm
1 50.285 16.26
2 50.86 16.28
3 50.48 15.26
4 48.14 15.32
5 47.45 15.66
6 46.65 15.85
7 48.85 15.65
8 49.95 14.98
9 50.15 15.62
10 50.23 14.35
11 49.32 15.62
12 48.65 14.95
13 50.62 15.84
14 48.61 14.63
15 48.23 14.29
16 50.31 14.36
17 49.32 14.63
18 48.96 15.13
19 50.31 14.91
20 48.65 14.35
21 49.42 14.62
22 48.54 15.61
23 48.61 15.48
24 48.56 15.87
25 49.62 14.51
26 49.63 14.62
27 48.16 14
Table 7 presents that the proposed algorithm possesses is less mean
ideal points than the weighted sum method and these values are
preferable for us.
Evaluating the Effectiveness of Integrated Benders Decomposition Algorithm and … 569
Maximum Spread (MS)
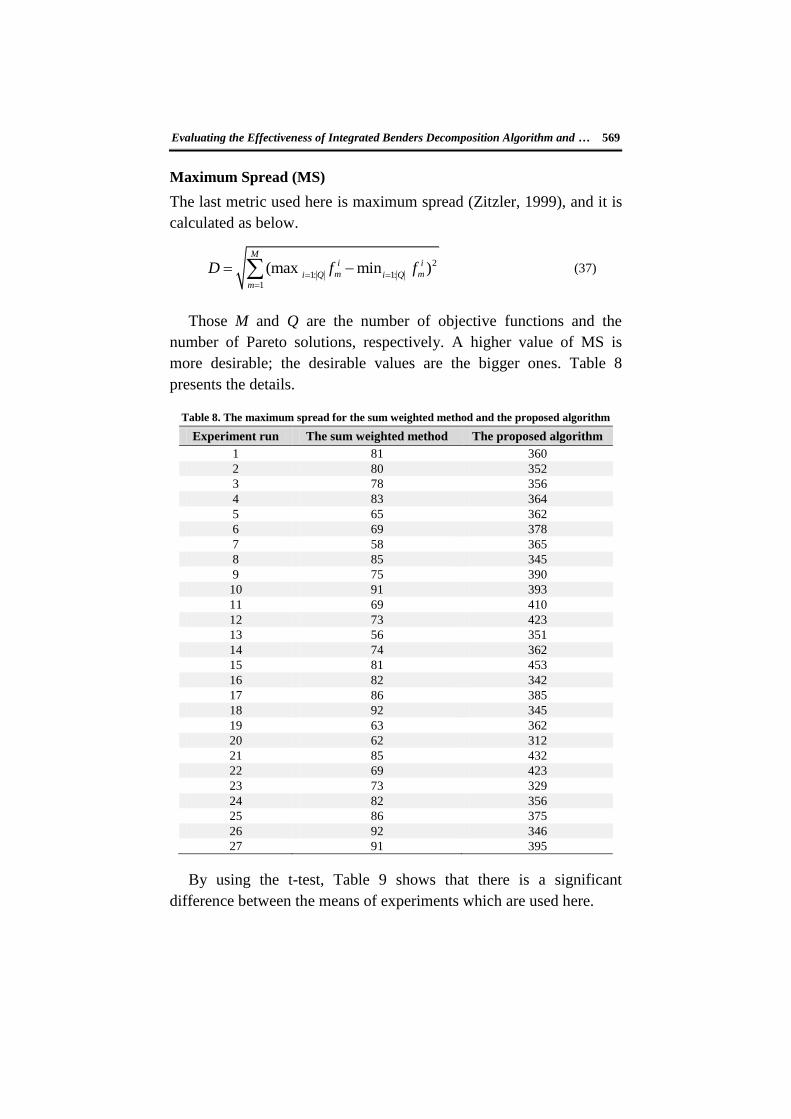
The last metric used here is maximum spread (Zitzler, 1999), and it is
calculated as below.
2
1: 1:1
(max min )M
i i
m mi Q i Qm
D f f
(37)
Those M and Q are the number of objective functions and the
number of Pareto solutions, respectively. A higher value of MS is
more desirable; the desirable values are the bigger ones. Table 8
presents the details.
Table 8. The maximum spread for the sum weighted method and the proposed algorithm
Experiment run The sum weighted method The proposed algorithm
1 81 360
2 80 352
3 78 356
4 83 364
5 65 362
6 69 378
7 58 365
8 85 345
9 75 390
10 91 393
11 69 410
12 73 423
13 56 351
14 74 362
15 81 453
16 82 342
17 86 385
18 92 345
19 63 362
20 62 312
21 85 432
22 69 423
23 73 329
24 82 356
25 86 375
26 92 346
27 91 395
By using the t-test, Table 9 shows that there is a significant
difference between the means of experiments which are used here.

570 (IJMS) Vol. 10, No. 3, Summer 2017
In the next section (Tables 10 and 11), same experiments are
designed to compare the effectiveness of the proposed algorithm and
the classic form of Benders decomposition.
Table 9. The t-test results for the sum weighted method and the proposed algorithm
The performance metrics The t-test
The p-value Result Final result
NPS 0 H0 is rejected proposed algorithm
MID 0 H0 is rejected proposed algorithm
MS 0 H0 is rejected proposed algorithm
Table 10. The results of NPS, MID, and MS for the classic BDA
Run NPS MID MS
1 4 40 65
2 5 39 62
3 5 42 36
4 5 45 59
5 4 44 75
6 4 39 74
7 4 45 76
8 5 38 72
9 3 37 71
10 3 46 70
11 4 51 65
12 3 36 68
13 4 44 67
14 5 44 76
15 5 38 73
16 5 37 71
17 4 42 72
18 4 38 70
19 4 37 64
20 4 44 65
21 5 33 63
22 5 41 62
23 4 43 60
24 4 49 69
25 3 39 73
26 3 38 74
27 3 52 75
Table 11. The t-test results for the comparison between the classic BDA and the proposed
algorithm
The performance metrics The t-test
The p-value Result Final result
NPS 0 H0 is rejected Proposed algorithm
MID 0.003 H0 is rejected Proposed algorithm
MS 0 H0 is rejected Proposed algorithm

Evaluating the Effectiveness of Integrated Benders Decomposition Algorithm and … 571
Regarding to Tables above and t-test results from the comparison
between the proposed algorithm, the classic BDA, and the sum
weighted method. It is observed that there is a significant difference
between these algorithms.
Conclusion
In this paper, integrated BDA and epsilon constraint have been
applied for multi-objective facility location model; the primary goal of
this model is to find the optimal number of potential customers, the
minimum cost and high efficiency to serve. In this regard, for the
uncertainty of demand, Monte Carlo approach is applied. Firstly, by
using epsilon constraint the proposed model converts into the single
one, then BDA is used, in this case, the original model is divided into
two segments; the master problem and the sub-problem. In this
approach, the master problem includes facility location objective and
strategic decision and the sub problem possesses DEA objective. This
model is an extension of Klimberg and Ratick (2008). The capacitated
facility is located in conjunction with the analysis of data coverage in
a deterministic approach, while the proposed model is considered with
the demand uncertainty. The studied approach is compared with the
classic BDA under deterministic and uncertainty cases. Results show
that the proposed approach is more stable in comparison with the
classic form of BDA and the weighted sum method. The proposed
algorithm has been applied for the particular problem which was
introduced by Klimberg and Ratick (2008) and has been compared
with the weighted sum method that Klimberg and Ratick (2008)
utilized to solve their problem. The statistical analysis and results
show that there exist significant improvements in the proposed
algorithm against the weighted sum method and the classic BDA.
As a future work, it is recommended to apply the proposed solution
approach for other multi-objective models. Also, it is interesting to use
some improvements regarding BDA /epsilon approach to accelerate/
improve the proposed algorithm. Regarding uncertainty, this paper
used Monte Carlo method, it is suggested to use other uncertainty
cases.

572 (IJMS) Vol. 10, No. 3, Summer 2017
References
Abdolmohammadi, H. R., & Kazemi, A. (2013). A benders decomposition
approach for a combined heat and power economic dispatch. Energy
Conversion and Management, 71, 21-31.
Aghaei, J., Amjady, N., & Shayanfar, H. A. (2011). Multi-objective
electricity market clearing considering dynamic security by
lexicographic optimization and augmented epsilon constraint method.
Applied Soft Computing, 11(4), 3846-3858.
Aghezzaf, E. (2005). Capacity planning and warehouse location in supply
chains with uncertain demands. Journal of the Operational Research
Society, 56(4), 453-462.
Al-Agtash, S., & Yamin, H. (2004). Optimal supply curve bidding using
Benders decomposition in competitive electricity markets. Electric
Power Systems Research, 71(3), 245-255.
Arjmand, M., & Najafi, A. A. (2015). Solving a multi-mode bi-objective
resource investment problem using meta-heuristic algorithms.
Advanced Computational Techniques in Electromagnetics, 2015(1),
41-58.
Baghalian, A., Rezapour, S., & Farahani, R. Z. (2013). Robust supply chain
network design with service level against disruptions and demand
uncertainties: A real-life case. European Journal of Operational
Research, 227(1), 199-215.
Behmanesh, R., & Rahimi, I. (2012). Using combination of optimized
recurrent neural network with design of experiments and regression
for control chart forecasting. Business Engineering and Industrial
Applications Colloquium, 435-439.
Benders, J. F. (1962). Partitioning procedures for solving mixed-variables
programming problems. Numerische Mathematik, 4(1), 238-252.
Boschetti, M., & Maniezzo, V. (2009). Benders decomposition, lagrangean
relaxation and metaheuristic design. Journal of Heuristics, 15(3), 283-
312.
Çakır, O. (2009). Benders decomposition applied to multi-commodity,
multi-mode distribution planning. Expert Systems with Applications,
36(4), 8212-8217.
Chan, Y., Carter, W. B., & Burnes, M. D. (2001). A multiple-depot,
multiple-vehicle, location-routing problem with stochastically
processed demands. Computers & Operations Research, 28(8), 803-
826.
Charnes, A., Cooper, W. W., & Rhodes, E. (1978). Measuring the efficiency

Evaluating the Effectiveness of Integrated Benders Decomposition Algorithm and … 573
of decision making units. European Journal of Operational Research,
2(6), 429-444.
Charwand, M., Ahmadi, A., Heidari, A. R., & Esmaeel Nezhad, A. (2014).
Benders decomposition and normal boundary intersection method for
multiobjective decision making framework for an electricity retailer in
energy markets. IEEE Systems Journal, 9(4), 1475-1484.
Chu, Y., & You, F. (2013). Integration of production scheduling and
dynamic optimization for multi-product CSTRs: Generalized Benders
decomposition coupled with global mixed-integer fractional
programming. Computers & Chemical Engineering, 58, 315-333.
Coello, C. A. C., Lamont, G. B., & Van Veldhuizen, D. A. (2007).
Evolutionary algorithms for solving multi-objective problems. New
York, NY: Springer.
Dabia, S., Talbi, E. G., Van Woensel, T., & De Kok, T. (2013).
Approximating multi-objective scheduling problems. Computers &
Operations Research, 40(5), 1165-1175.
Danesh Asgari, S., & Haeri, A. (2017). Selection of appropriate measures by
integrating the balanced scorecard and three-stage data envelopment
analysis approaches. Iranian Journal of Management Studies, 10(2),
527-550.
Das, I., & Dennis, J. E. (1998). Normal-boundary intersection: A new
method for generating the Pareto surface in nonlinear multicriteria
optimization problems. SIAM Journal on Optimization, 8(3), 631-657.
Daskin, M. S., Snyder, L. V., & Berger, R. T. (2005). Logistics systems:
Design and optimization. In Facility location in Supply chain design
(pp. 39-65). Heidelberg, Berlin: Springer.
de Camargo, R. S., Miranda, G. D., & Luna, H. (2008). Benders
decomposition for the uncapacitated multiple allocation hub location
problem. Computers & Operations Research, 35(4), 1047-1064.
de Sá, E. M., de Camargo, R. S., & de Miranda, G. (2013). An improved
Benders decomposition algorithm for the tree of hubs location
problem. European Journal of Operational Research, 226(2), 185-
202.
Esmaili, M., Ebadi, F., Shayanfar, H. A., & Jadid, S. (2013). Congestion
management in hybrid power markets using modified Benders
decomposition. Applied Energy, 102, 1004-1012.
Fortz, B., & Poss, M. (2009). An improved benders decomposition applied
to a multi-layer network design problem. Operations Research
Letters, 37(5), 359-364.
Fowler, R. J., Paterson, M. S., & Tanimoto, S. L. (1981). Optimal packing

574 (IJMS) Vol. 10, No. 3, Summer 2017
and covering in the plane are NP-complete. Information Processing
Letters, 12(3), 133-137.
Ghane-Kanafi, A., & Khorram, E. (2015). A new scalarization method for
finding the efficient frontier in non-convex multi-objective problems.
Applied Mathematical Modelling, 1-16. DOI:
10.1016/j.apm.2015.03.022.
Gonzalez, T. F. (1985). Clustering to minimize the maximum intercluster
distance. Theoretical Computer Science, 38, 293-306.
Ismail-Yahaya, A., & Messac, A. (2002). Effective generation of the Pareto
frontier using the normal constraint method. AIAA 40th Aerospace
Sciences Meeting and Exhibit, 1-12.
Kagan, N., & Adams, R. (1993). A Benders' decomposition approach to the
multi-objective distribution planning problem. International Journal
of Electrical Power & Energy Systems, 15(5), 259-271.
Khalili-Damghani, K., & Amiri, M. (2012). Solving binary-state multi-
objective reliability redundancy allocation series-parallel problem
using efficient epsilon-constraint, multi-start partial bound
enumeration algorithm, and DEA. Reliability Engineering & System
Safety, 103, 35-44.
Klimberg, R. K., & Ratick, S. J. (2008). Modeling data envelopment analysis
(DEA) efficient location/allocation decisions. Computers &
Operations Research, 35(2), 457-474.
Laumanns, M., Thiele, L., & Zitzler, E. (2006). An efficient, adaptive
parameter variation scheme for metaheuristics based on the epsilon-
constraint method. European Journal of Operational Research,
169(3), 932-942.
Longinidis, P., & Georgiadis, M. C. (2011). Integration of financial
statement analysis in the optimal design of supply chain networks
under demand uncertainty. International Journal of Production
Economics, 129(2), 262-276.
Megiddo, N., & Tamir, A. (1982). On the complexity of locating linear
facilities in the plane. Operations Research Letters, 1(5), 194-197.
Melo, M. T., Nickel, S., & Saldanha-Da-Gama, F. (2009). Facility location
and supply chain management–A review. European Journal of
Operational Research, 196(2), 401-412.
Messac, A., Ismail-Yahaya, A., & Mattson, C. A. (2003). The normalized
normal constraint method for generating the Pareto frontier. Structural
and Multidisciplinary Optimization, 25(2), 86-98.
Mirghafoori, S. H., Ardakani, F. A., & Azizi, F. (2014). Developing a

Evaluating the Effectiveness of Integrated Benders Decomposition Algorithm and … 575
method for risk analysis in tile and ceramic industry using failure
mode and effects analysis by data envelopment analysis. Iranian
Journal of Management Studies, 7(2), 229.
Moheb-Alizadeh, H., Rasouli, S., & Tavakkoli-Moghaddam, R. (2011). The
use of multi-criteria data envelopment analysis (MCDEA) for
location–allocation problems in a fuzzy environment. Expert Systems
with Applications, 38(5), 5687-5695.
Montemanni, R. (2006). A Benders decomposition approach for the robust
spanning tree problem with interval data. European Journal of
Operational Research, 174(3), 1479-1490.
Oliveira, F., Grossmann, I. E., & Hamacher, S. (2014). Accelerating Benders
stochastic decomposition for the optimization under uncertainty of the
petroleum product supply chain. Computers & Operations Research,
49, 47-58.
Osman, H., & Demirli, K. (2010). A bilinear goal programming model and a
modified Benders decomposition algorithm for supply chain
reconfiguration and supplier selection. International Journal of
Production Economics, 124(1), 97-105.
Pishvaee, M., Razmi, J., & Torabi, S. (2014). An accelerated Benders
decomposition algorithm for sustainable supply chain network design
under uncertainty: A case study of medical needle and syringe supply
chain. Transportation Research Part E: Logistics and Transportation
Review, 67, 14-38.
Rahimi, I., Askari, M., Tang, S., Lee, L., Azfanizam Binti Ahmad, S., &
Sharaf, A. M. (2016). Development model for supply chain network
design by demand uncertainty and mode selection. International
Journal of Applied Operational Research-An Open Access Journal,
6(1), 51-64.
Taguchi, G. (1986). Introduction to quality engineering: Designing quality
into products and processes. Quality and Reliability Engineering
International, 4, 198-199.
Tang, S. H., Rahimi, I., & Karimi, H. (2016). Objectives, products and
demand requirements in integrated supply chain network design: A
review. International Journal of Industrial and Systems Engineering,
23(2), 181-203.
Torabi, M., & Mahlooji, H. (2017). An integrated simulation-DEA approach
to multi-criteria ranking of scenarios for execution of operations in a
construction project. Iranian Journal of Management Studies, 9(4),
801-827.
Üster, H., & Agrahari, H. (2011). A Benders decomposition approach for a

576 (IJMS) Vol. 10, No. 3, Summer 2017
distribution network design problem with consolidation and capacity
considerations. Operations Research Letters, 39(2), 138-143.
Wang, F., Lai, X., & Shi, N. (2011). A multi-objective optimization for
green supply chain network design. Decision Support Systems, 51(2),
262-269.
Yang, Y., & Lee, J. M. (2012). A tighter cut generation strategy for
acceleration of Benders decomposition. Computers & Chemical
Engineering, 44, 84-93.
Zitzler, E. (1999). Evolutionary algorithms for multiobjective optimization:
Methods and applications (Doctoral dissertaion). ETH Zurich,
Switzerland.