evaluating interactive transect area assessments … · evaluating interactive transect area...
TRANSCRIPT

Higher Education Studies; Vol. 6, No. 4; 2016 ISSN 1925-4741 E-ISSN 1925-475X
Published by Canadian Center of Science and Education
90
Evaluating Interactive Transect Area Assessments Hands-On Instruction for Natural Resource Undergraduate Students
Daniel Unger1, Sarah Schwab1, Ryan Jacques1, Yanli Zhang1, I-Kuai Hung1 & David Kulhavy1 1 Arthur Temple College of Forestry and Agriculture, Stephen F. Austin State University, Nacogdoches, Texas, USA
Correspondence: Daniel Unger, Arthur Temple College of Forestry and Agriculture, Stephen F. Austin State University, Nacogdoches, Texas, 75962, USA. Tel: 1-936-468-2234. E-mail:[email protected]
Received: August 12, 2016 Accepted: September 12, 2016 Online Published: November 1, 2016
doi:10.5539/hes.v6n4p90 URL: http://dx.doi.org/10.5539/hes.v6n4p90
Abstract
Undergraduate students pursuing a Bachelor of Science in Spatial Science degree at Stephen F. Austin State University (SFASU) receive instruction in the spatial sciences with a focus on hands-on applications. All undergraduate students take the course Introduction to Spatial Science which includes a comprehensive overview of spatial science incorporating a comparison of standard inexpensive area assessment techniques with high-end computer based area assessment methodologies. Students within this course were instructed how to assess the area of a surface feature on an aerial image with a ruler applying the transect method. Student’s average Root Mean Square Error (RMSE) between a student’s transect derived area and surveyed area was 0.45, 0.13, 0.07, and 0.02 acres for 5, 10, 15, and 20 transect lines, respectfully. An ANOVA analysis of area assessment and area error assessment indicated that mean area and mean absolute area error were statistically different between transect line groups. In addition, the accuracy of area measured increased significantly as the number of transect lines increased which: (1) indicates students receiving hands-on instruction in estimating area using the transect method can record accurate area measurements after only a limited 2 hour introduction; (2) reveals the accuracy of the transect method is not user dependent; (3) shows area accuracy increases as the number of transects increases; and, (4) validates the interactive hands-on instruction methodology employed at SFASU.
Keywords: area assessment, accuracy, transect, user, natural resource
1. Introduction
Undergraduate students pursuing a Bachelor of Science degree in spatial science technology within the Arthur Temple College of Forestry and Agriculture (ATCOFA) at Stephen F. Austin State University (SFASU), Nacogdoches, Texas, focus on the management of natural resources from a multidisciplinary spatial science perspective. The mission of the Spatial Science program within ATCOFA is to maintain excellence in teaching, research and outreach to enhance the health and vitality of the environment through sustainable management, conservation, and protection of natural resources (Bullard, Coble, Darville, & Stephens-Williams, 2014).
Natural resource management incorporating spatial science has to be communicated to the stakeholders across the public, private and education sectors by “society-ready” professionals (Sample, Bixler, McDonough, Bullard, & Snieckus, 2015) to promote rigor, relevance and building relationships (Bullard, 2015). Students who decide to attend ATCOFA do so because they have chosen to pursue a career path based on three main items of concern where they can: make a difference, work outdoors, and use high end technology. To facilitate their career objectives undergraduate coursework within ATCOFA focuses on hands-on instruction, field exercises, and real-world applications technology and learn that precision and accuracy with field measurements is essential in spatial science analysis (Unger, Hung, Zhang, & Kulhavy, 2014; Unger, Kulhavy, Hung, & Zhang, 2014; Kulhavy, Unger, Zhang, Bedford, & Hung, 2016).
Kulhavy, Unger, Hung, and Douglass (2015) compared Pictometry®, LiDAR, and a laser range finder against a measured height with a telescoping pole to compare methods in a senior capstone course in spatial science emphasizing the one-on-one instruction throughout the ATCOFA spatial science curriculum. Kulhavy and Unger (2016) presented six undergraduate projects in a spatial science capstone course that incorporated Public Participation GIS (Geographic Information Systems) including Firewise, historic trail GIS analysis, accuracy assessment (Unger, Kulhavy, & Hung, 2013), litter control and a threatened plant, Hibiscus dasycalyx,
hes.ccsenet.org Higher Education Studies Vol. 6, No. 4; 2016
91
distribution. As part of this process, students used technical skills, active learning, and reflection to guide their work. Henley, Unger, Kulhavy, and Hung (2016) incorporated change detection in land-use cover classification over a 30 year period in a multiple-course service learning undergraduate spatial science research project.
For students pursuing a Spatial Science degree within ATCOFA knowing how to use simple and cost effective methodologies to derive the area of a specific geographic feature is crucial to the understanding and proper management of any natural resource. The purpose of this study was to assess the accuracy of student derived area assessments versus the actual area obtained via a land survey within a one-on-one interactive teaching environment.
2. Methods
All undergraduate students pursuing a Bachelor of Science degree in spatial science technology at SFASU take the course Introduction to Spatial Science which includes a comprehensive overview of the spatial sciences incorporating a comparison of standard inexpensive area assessment techniques with high-end computer based area assessment methodologies. The students are instructed, within a lecture and interactive hands-on lab format, how to assess the area of a surface feature using an aerial image and a ruler via the Transect Area assessment method (Avery, 1977). The cost effective nature and proven accuracy of the Transect Area method is its main appeal and requires only two pieces of equipment; an image and a standard ruler for measuring straight line distance.
Students are initially introduced to the simplicity of the Transect Method during a typical lecture format. Students are taught that with a simple inexpensive ruler you draw a series of lines across an aerial image that are equidistant from each other and perpendicular to the long axis of the object or area in question seen in the aerial image. The more lines drawn will increase the accuracy of any area assessment while drawing lines perpendicular to the object or area of interest will increase the likelihood of lines intersecting the area of concern. Once the lines are drawn, students are shown that the total length of all lines intersecting the area or object of interest divided by the total length of all lines drawn equates to the percentage of the aerial image occupied by the object or area in question. Using the scale of the aerial image (e.g., 1:12,000) students are shown how to calculate the total acreage of the aerial image. Finally, the students are shown that the acreage of the object or area of interest can then be found by multiplying the total area represented in the aerial image by the percentage of the aerial image occupied by the object or area of interest (Figure 1).
Once the lecture demonstration is over, the simplicity of the Transect Method is reinforced during an interactive 2 hour hands-on lab with an ATCOFA faculty member and a Teaching Assistant that allows the students to practice their ability to assess the area of an object or area in question. Forty students were given an aerial image of the football field at SFASU and were asked to quantify the area of the football field in question. A football field was chosen for its proximity to the students’ lab location and for ease of access to physically measure the actual dimensions of the football field (Figure 2).
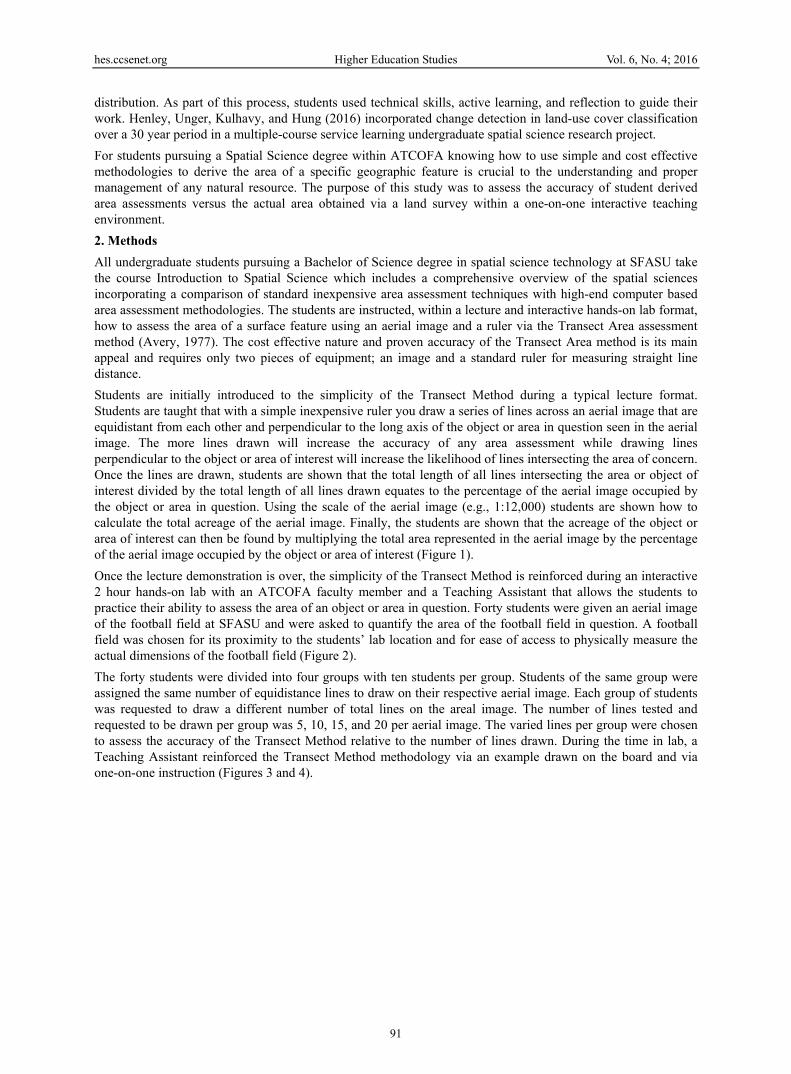
The forty students were divided into four groups with ten students per group. Students of the same group were assigned the same number of equidistance lines to draw on their respective aerial image. Each group of students was requested to draw a different number of total lines on the areal image. The number of lines tested and requested to be drawn per group was 5, 10, 15, and 20 per aerial image. The varied lines per group were chosen to assess the accuracy of the Transect Method relative to the number of lines drawn. During the time in lab, a Teaching Assistant reinforced the Transect Method methodology via an example drawn on the board and via one-on-one instruction (Figures 3 and 4).

hes.ccsenet.org Higher Education Studies Vol. 6, No. 4; 2016
92
Figure 1. Transect area method example using 5 lines with a 1:12,000 scale aerial photograph

hes.ccsenet.org Higher Education Studies Vol. 6, No. 4; 2016
93
Figure 2. Football field study site location at Stephen F. Austin State University
Figure 3. Teaching assistant explaining the Transect Area methodology during an interactive lab
hes.ccsenet.org Higher Education Studies Vol. 6, No. 4; 2016
94
Figure 4. Undergraduate students applying the Transect Area methodology during an interactive lab
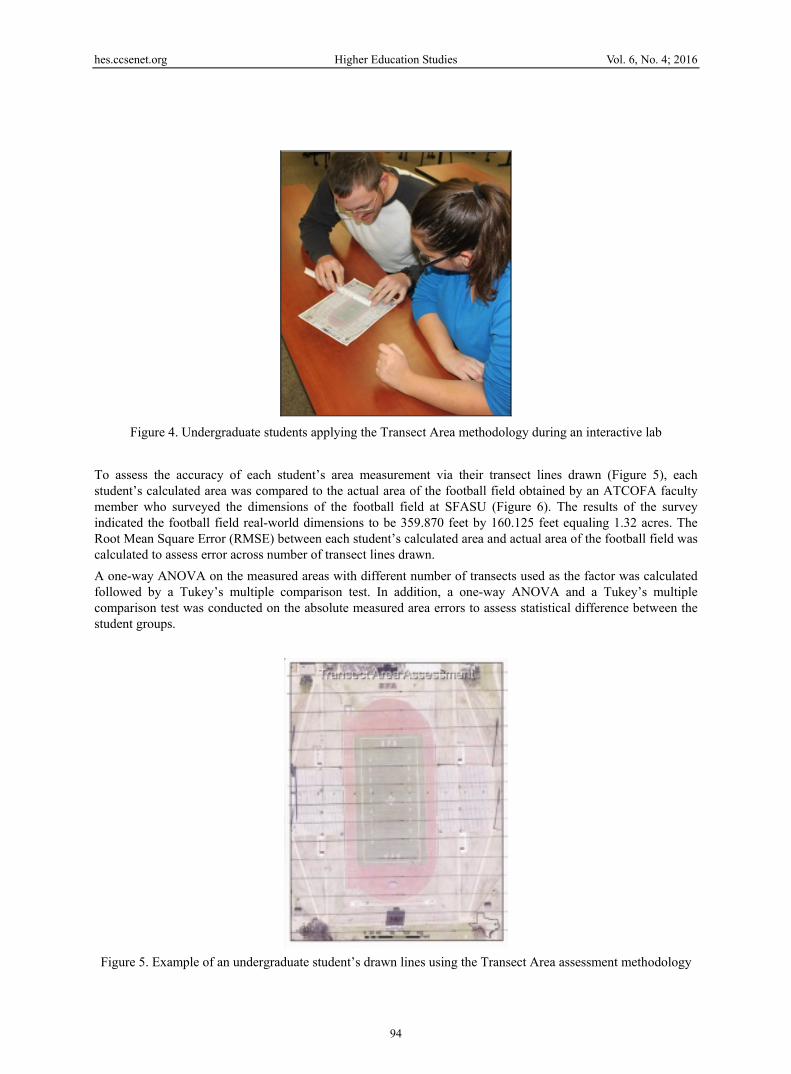
To assess the accuracy of each student’s area measurement via their transect lines drawn (Figure 5), each student’s calculated area was compared to the actual area of the football field obtained by an ATCOFA faculty member who surveyed the dimensions of the football field at SFASU (Figure 6). The results of the survey indicated the football field real-world dimensions to be 359.870 feet by 160.125 feet equaling 1.32 acres. The Root Mean Square Error (RMSE) between each student’s calculated area and actual area of the football field was calculated to assess error across number of transect lines drawn.
A one-way ANOVA on the measured areas with different number of transects used as the factor was calculated followed by a Tukey’s multiple comparison test. In addition, a one-way ANOVA and a Tukey’s multiple comparison test was conducted on the absolute measured area errors to assess statistical difference between the student groups.
Figure 5. Example of an undergraduate student’s drawn lines using the Transect Area assessment methodology

hes.ccsenet.org Higher Education Studies Vol. 6, No. 4; 2016
95
Figure 6. Surveying the dimensions of the football field at Stephen F. Austin State University
3. Results and Discussion
A summary of area errors presented in Table 1 is stratified by number of transects utilized per group to calculate each student’s individual area difference. When the number of transect increased, not only did the accuracy of the area measurement increase, but also the precision. All approaches overestimated the area except the one using 10 transects, which underestimated the area. There is an outlier in the group of 20 transects that is higher (1.37 ac) than the rest of the group (1.34 ac) (Figure 7). The RMSE between a student’s transect derived area and surveyed area was 0.45, 0.13, 0.07, and 0.02 acres for 5, 10, 15, and 20 transect lines, respectfully (Table 2). This reconfirms that the error of area measurement reduces when more transect lines are drawn on the aerial image for estimating the acreage of an area of interest.
A one-way ANOVA on the measured areas with a different number of transects used as the factor resulted in a p-value<0.001, revealing that the means of the areas measured among the four groups were significantly different. A subsequent Tukey multiple comparisons test indicated that each group’s area measurement was statistically different from others, with the 20-transect group achieving an estimated area (mean=1.343 ac) being closest to the actual area (1.32 ac) with a percent error of 1.74% (Table 3).
When taking absolute errors into account, the absolute difference between a transect measured area and the actual area for comparison, the results of a one-way ANOVA reflected what was found in the RMSE, with the group of 5 transects being the least accurate (mean=0.444 ac) and the group of 20 transects being the most accurate (mean=0.023 ac), and the difference is statistically significant (p<0.001). A Tukey multiple comparison test again identified that the absolute error of each group was statistically different from others. The increase in number of transects per group did increase the accuracy of the area measurements significantly across all of the four groups per number of transects used (Table 4).
Increasing the number of transects resulting in higher accuracy in area estimation is something expected. When compared to the ground measurement in terms of time and cost, the Transect Area method is beneficial when only a rough estimate is needed. For this classroom study, the 1.74% percent error with 20 transects is more than acceptable. Equipped with this knowledge and skillset, the students would conduct area assessment in the real world with confidence.

hes.ccsenet.org Higher Education Studies Vol. 6, No. 4; 2016
96
Table 1. Individual student measured area and area error per transect group
Number Observation Area Area Area
of Transects Actual Student Error
(acres) (acres) (acres)
1 1.32 1.62 0.30
2 1.32 1.78 0.46
3 1.32 1.79 0.47
4 1.32 1.78 0.46
5 5 1.32 1.79 0.47
6 1.32 1.74 0.42
7 1.32 1.78 0.46
8 1.32 1.78 0.46
9 1.32 1.79 0.47
10 1.32 1.79 0.47
1 1.32 1.18 -0.14
2 1.32 1.15 -0.17
3 1.32 1.15 -0.17
4 1.32 1.23 -0.09
10 5 1.32 1.19 -0.13
6 1.32 1.15 -0.17
7 1.32 1.19 -0.13
8 1.32 1.22 -0.10
9 1.32 1.23 -0.09
10 1.32 1.22 -0.10
1 1.32 1.38 0.06
2 1.32 1.39 0.07
3 1.32 1.39 0.07
4 1.32 1.39 0.07
15 5 1.32 1.39 0.07
6 1.32 1.39 0.07
7 1.32 1.39 0.07
8 1.32 1.40 0.08
9 1.32 1.38 0.06
10 1.32 1.39 0.07
1 1.32 1.34 0.02
2 1.32 1.34 0.02
3 1.32 1.34 0.02
4 1.32 1.34 0.02
20 5 1.32 1.37 0.05
6 1.32 1.34 0.02
7 1.32 1.34 0.02
8 1.32 1.34 0.02
9 1.32 1.34 0.02
10 1.32 1.34 0.02

hes.ccsenet.org Higher Education Studies Vol. 6, No. 4; 2016
97
Figure 7. Graph of area measurement relative to number of transects drawn
Table 2. Average RMSE per transect group
Number Number Percent Average RMSE
of Transects of Intersections of Intersections Area Error Area Error
(percent) (acres) (acres)
Five 3 60.00 0.44 0.45
Ten 4 40.00 -0.13 0.13
Fifteen 7 46.67 0.07 0.07
Twenty 9 45.00 0.02 0.02
Table 3. ANOVA results on the student measured area per transect group
Groups Count Sum Average Variance Tukey
Five 10 17.64 1.764 0.002782 A
Ten 10 11.91 1.191 0.001099 D
Fifteen 10 13.89 1.389 3.22E-05 B
Twenty 10 13.43 1.343 9.00E-05 C
Source of Variation SS df MS F P-value F crit
Between Groups 1.776548 3 0.592183 591.6894 1.14E-30 2.866266
Within Groups 0.03603 36 0.001001
Total 1.812578 39

hes.ccsenet.org Higher Education Studies Vol. 6, No. 4; 2016
98
Table 4. ANOVA results on the student measured area absolute error per transect group
Groups Count Sum Average Variance Tukey
Five 10 4.44 0.444 0.002782 A
Ten 10 1.29 0.129 0.001099 B
Fifteen 10 0.69 0.069 3.22E-05 C
Twenty 10 0.23 0.023 9.00E-05 D
Source of Variation SS df MS F P-value F crit
Between Groups 1.085108 3 0.361703 361.4013 6.43E-27 2.866266
Within Groups 0.03603 36 0.001001
Total 1.121138 39
4. Conclusions
Spatial science students graduating from ATCOFA, in addition to being introduced to high end technology, have also been introduced to proven traditional cost effective geospatial technologies within a one-on-one instruction methodology. The results indicate that students taking spatial science coursework within ATCOFA, which are designed to increase cognitive retention, can accurately assess the area of a surface feature with a high level of confidence throughout their future careers. Students responded to the exercise in a positive manner and worked in groups to solve complex natural resource activities. Reflection on what was learned and how each group approached the problem, by summarizing the hands-on lab results during the following formal lecture, was a way to incorporate and reinforce active learning in the course (Kulhavy & Unger, 2016). By introducing multiple methodologies, students graduating from SFASU are able to go into their careers confidently knowing that with the equipment available to them, whether it is high end technology or basic mapping tools, they will be able to provide an accurate conclusion when it comes to area assessment.
References
Avery, T. E. (1977). Interpretation of Aerial Photographs. Minneapolis, Minnesota: Burgess Publishing Company.
Bullard, S., Coble, D., Coble, T., Darville, R., & Stephens-Williams, P. (2014). Producing “Society-ready” foresters: A research-based process to revise the Bachelor of Science in Forestry curriculum at Stephen F. Austin State University (ATCOFA Monograph 1-2014). Arthur Temple College of Forestry and Agriculture, Austin State University, Nacogdoches, Texas.
Bullard, S. H. (2015). Forestry curricula for the 21st century—Maintaining rigor, communicating relevance, building relationships. Journal of Forestry, 113, 552-556. http://dx.doi.org/10.5849/jof.15-021
Henley, R. B., Unger, D. R., Kulhavy, D. L., & Hung, I. (2016). Incorporating applied undergraduate research in senior to graduate level remote sensing courses. International Journal of Higher Education, 5, 212-248.
Kulhavy, D. L., Unger, D. R., Hung, I., & Douglass, D. (2015). Integrating hands-on undergraduate research in an applied spatial science senior level capstone course. International Journal of Higher Education, 4(1), 52-60. http://dx.doi.org/10.5430/ijhe.v4n1p52
Kulhavy, D., & Unger, D. (2016). Service-learning and participation in a capstone spatial science course. Journal of Service-Learning in Higher Education, 5, 41-53.
Kulhavy, D. L., Unger, D. R., Zhang, Y., Bedford, P., & Hung, I. (2016). Comparing remotely sensed Pictometry® web based slope distance estimates with in situ total station and tape slope estimates. International Journal of Geospatial and Environmental Research, 3(1).
Sample, V. A., Bixler, R. P., McDonough, M. H., Bullard, S. H., & Snieckus, M. M. (2015). The promise and performance of forestry education in the United States: Results of a survey of forestry employers, graduates and educators. Journal of Forestry, 113, 528-537.
Unger, D. R., Kulhavy, D. L., & Hung, I. (2013). Validating the geometric accuracy of high spatial resolution multispectral data. GIScience and Remote Sensing, 50, 271-280. http://dx.doi.org/10.1117/1.JRS.8.083590
hes.ccsenet.org Higher Education Studies Vol. 6, No. 4; 2016
99
Unger, D. R., Hung, I., Zhang, Y., & Kulhavy, D. L. (2014). Evaluating GPS effectiveness for natural resource professionals: Integrating undergraduate students in the decision-making process. Journal of Studies in Education, 4, 30-44. http://dx.doi.org/10.5296/jse.v4i4.6389
Unger, D., Kulhavy, D., Hung, I., & Zhang, Y. (2014). Quantifying natural resources using field-based instruction and hands-on applications. Journal of Studies in Education, 4, 1-14. http://dx.doi.org/10.5296/jse.v4i2.5309
Copyrights
Copyright for this article is retained by the author(s), with first publication rights granted to the journal.
This is an open-access article distributed under the terms and conditions of the Creative Commons Attribution license (http://creativecommons.org/licenses/by/4.0/).