evaluating frozen beef and meat packaging material exposed to
TRANSCRIPT

EVALUATING FROZEN BEEF AND MEAT PACKAGING MATERIAL EXPOSED TOLOW LEVELS OF AMMONIA GAS
by
FARIS A. KARIM HUSSAIN
B.S., Al-Mustansiriya University, Iraq, 1991
A THESIS
Submitted in partial fulfillment of the requirements for the degree
MASTER OF SCIENCE
Food Science
KANSAS STATE UNIVERSITYManhattan, Kansas
2009
Approved by Major Professor
J. Scott Smith Animal Sci & Ind

ABSTRACT
Ammonia leaks in meat chilling/frozen storage or processing facilities are not
uncommon. Often the meat products are packaged in polymer films that theoretically protect the
product from contamination. Unfortunately, there is almost no data on whether ammonia can
permeate packaging films. The objectives of this study were to evaluated meat contaminated by
low levels of ammonia under frozen storage conditions (-17 ± 3 EC), and further evaluated the
permeability of common meat packaging films including: low density polyethylene (LDPE), 3
mil Cryovac (E-2300), and 3 mil vacuum (V-PA/PE) at freezing (-17 ± 3 EC) and room
temperatures (21 ± 3 EC).
Fresh beef Semitendinosus muscles were fabricated to form 10 x 5 x 2.3 cm steaks. The
packaging films were fabricated into 10 x 5 cm pouches and filled with 50 mL deionized water.
The meat and the pouches were exposed in a plexiglass enclosure, contained in a freezer, to 50,
100, 250, and 500 ppm ammonia gas (85 mL/min) for exposure times of 6, 12, 24, and 48 hr.
The ammonia levels in the meat samples were 34.2 (50 ppm exposure), 51.5 (100 ppm exp.),
81.1 (250 ppm exp.), and 116 ppm (500 ppm exp.), and the pH values ranged from 5.56 to 5.75
(control ranged from 5.31 to 5.43) at 48 hr. At freezing temperatures, ammonia residues
remained undetected, and no differences in pH were found in the pouches. At room temperature,
all pouches were slightly permeable to ammonia; the levels observed in the pouches were, 7.77
ppm (pH, 8.64) for E-2300, 5.94 ppm (pH, 8.38) for LDPE, and 0.89 ppm (pH, 7.23) for V-
PA/PE at 500 ppm exposure for 48 hr (unexposed samples pH ranged from 5.49 to 6.44).
The results showed that meat packaging materials have low ammonia permeability and
thus protect meat products exposed to ammonia exposure during frozen storage. Moreover, meat
content is low even with ammonia exposures as high as 500 ppm for up to 48 hr.

iii
TABLE OF CONTENTS
PAGE
LIST OF FIGURES ..................................................................................................................... vi
LIST OF TABLES ..................................................................................................................... viii
ACKNOWLEDGMENTS ........................................................................................................... ix
PART I: REVIEW OF LITERATURE .................................................................................... 1
INTRODUCTION ............................................................................................................. 1
CHEMICAL AND PHYSICAL PROPERTIES OF AMMONIA ..................................... 5
AMMONIA PRODUCTION, USE, AND DISPOSAL ..................................................... 9
AMMONIA TOXICITY .................................................................................................. 11
Oral Exposure ...................................................................................................... 13
Toxic Compounds Resulting from Ammoniation ................................................ 14
AMMONIA FOOD CONTAMINATION ....................................................................... 15
Wisconsin milk contamination 1985 ................................................................... 15
Illinois 2002 ......................................................................................................... 16
ECONOMIC EFFECTS OF AMMONIA FOOD CONTAMINATION ......................... 16
AMMONIA REGULATIONS FOR FOOD AND FOOD PRODUCTS ......................... 18
EFFECTS OF AMMONIA ON MEAT QUALITY AND PROPERTIES ...................... 20
Meat Color ........................................................................................................... 20
Meat Flavor and Odor .......................................................................................... 23
Meat pH ............................................................................................................... 24
Meat Tenderness .................................................................................................. 26
Meat Water Holding Capacity ............................................................................. 27
MEAT PACKAGING FUNCTIONS .............................................................................. 28
ENVIRONMENTAL EFFECTS ON PACKAGING PERMEABILITY ........................ 28
Temperature ......................................................................................................... 28

iv
Relative Humidity and Pressure .......................................................................... 29
FACTORS AFFECTING PACKAGE PERMEABILITY .............................................. 29
PROPERTIES OF SOME PLASTIC POLYMERS ........................................................ 30
Polyamide ............................................................................................................ 30
Polyolefin ............................................................................................................. 31
Low density polyethylene (LDPE) ...................................................................... 31
Polypropylene ...................................................................................................... 33
GENERAL MATERIALS REQUIREMENTS FOR MEAT PACKAGING .................. 34
REFERENCES ................................................................................................................ 36
PART II: PERMEABILITY OF MEAT PACKAGING MATERIALS TO LOW LEVELS
OF AMMONIA GAS ..................................................................................................... 46
ABSTRACT ..................................................................................................................... 46
INTRODUCTION ........................................................................................................... 47
MATERIALS AND METHODS ..................................................................................... 48
Experimental Design ............................................................................................ 48
Sample Preparation .............................................................................................. 50
Exposure Chamber ............................................................................................... 51
Exposure System Design ..................................................................................... 53
Procedure ............................................................................................................. 53
Indophenol Assay Ammonia Measurement ......................................................... 58
pH Determination ................................................................................................. 58
Statistical analysis ................................................................................................ 59
RESULTS AND DISCUSSION ...................................................................................... 59
pH ......................................................................................................................... 59
Ammonia levels ................................................................................................... 63
CONCLUSION ................................................................................................................ 67
FUTURE STUDIES ......................................................................................................... 68
REFERENCES ................................................................................................................ 69

v
PART III. FROZEN BEEF CONTAMINATION AFTER EXPOSURE TO LOW LEVELS
OF AMMONIA GAS ..................................................................................................... 71
ABSTRACT ..................................................................................................................... 71
INTRODUCTION ........................................................................................................... 72
MATERIALS AND METHODS ..................................................................................... 74
Experimental Design ............................................................................................ 74
Sample Preparation .............................................................................................. 75
Exposure Chamber ............................................................................................... 76
Exposure System Design ..................................................................................... 78
Operation Procedure ............................................................................................ 78
Indophenol Ammonia Measurement .................................................................... 79
pH Determination ................................................................................................. 80
Statistical Analysis ............................................................................................... 81
RESULTS AND DISCUSSION ...................................................................................... 82
Meat pH levels ..................................................................................................... 82
Meat Ammonia levels .......................................................................................... 83
CONCLUSION ................................................................................................................ 86
FUTURE STUDIES ......................................................................................................... 86
REFERENCES ................................................................................................................ 88
SUMMARY AND CONCLUSIONS .......................................................................................... 91
APPENDIX .................................................................................................................................. 92

vi
LIST OF FIGURES
FIGURE PAGE
1. Chemical structure of 4-methylimidazole and subsequent interchangeable
rearrangement .................................................................................................................. 15
2. The relationship among the three pigments color in the meat ......................................... 22
3. The change in total pH of Semitendinosus steaks over time when exposed to different
concentrations of ammonia .............................................................................................. 26
4. Chemical structure of Nylon 6 and Nylon 11 .................................................................. 31
5. Branched polymer polyethylene ...................................................................................... 32
6. Polypropylene types: (a) Iostactic, (b) Syndiotaqctic, and (c) Atactic ........................... 34
7. A general flow chart for the experiment process of the meat packaging materials ........ 49
8. Fabricated plastic films Cryovac, low density polyethylene, and vacuum with dimensions
of 10 × 5 cm and filled with 50 mL deionized water ....................................................... 50
9. Exposure chamber used in the experiment with two L-shape fittings mounted on the back
and 15 cm round front door ............................................................................................. 51
10. Water filled fabricated pouches inside the exposure chamber inside the freezer suspended
on two plexiglass bars ..................................................................................................... 52
11. The exposure system components ................................................................................... 54
12. Tubing connection between the system parts .................................................................. 55
13. Chamber flushing process and ammonia gas directions in the system ............................ 56
14. Movement directions of ammonia gas during exposure ................................................. 56
15. Water pH levels for Cryovac E-2300, LDPE, and vacuum (V-PA/PE) bags at 500 ppm
exposure for 6, 12, 24, and 48 hr at room temperature .................................................... 60
16. Water ammonia level means for Cryovac E-2300, LDPE, and vacuum (V-PA/PE) bags at
500 ppm for 6, 12, 24, and 48hr exposure at room temperature ...................................... 64
17. A general flow chart for processing and exposure of the steaks to ammonia ................ 75
18. Beef Semitendinosus muscle trimmed of external fat and fabricated to dimensions of 10 ×
5 × 2.3 cm ....................................................................................................................... 76
19. Meat samples attached to stainless steel hooks and suspended on two plexiglass bars
inside the freezer .............................................................................................................. 77
vii
20. Meat pH mean levels as a different from control at 50, 100, 250, and 500 ppm exposure
and 6, 12, 24, and 48hr at -17 ± 3 EC ............................................................................... 83
21. Levels of meat ammonia as a different from control at 50, 100, 250, and 500 ppm
exposure for 6, 12, 24, and 48hr at -17 ± 3 EC ................................................................ 85

viii
LIST OF TABLES
TABLE PAGE
1. List of some chemical and physical properties of ammonia .............................................. 8
2. Human physiological response to ammonia .................................................................... 12
3. Ammonia and its salt regulations in food, processed food, and animal feed .................. 19
4. Basic properties of various polyethylene films ............................................................... 33
5. Pouches exposure levels of ammonia measured with the MinRae 2000 ........................ 57
6. Cryovac E-2300 bag’s water pH levels at 50, 100, 250, and 500 ppm for 6, 12, 24, and
48hr exposure at room temperature ................................................................................. 61
7. Low density polyethylene bag’s water pH levels at 50, 100, 250, and 500 ppm for 6, 12,
24, and 48 hr exposure at room temperature ................................................................... 62
8. Vacuum bag’s water ammonia levels at 50, 100, 250, and 500 ppm for 6, 12, 24, and
48hr exposure at room temperature ................................................................................ 62
9. Vacuum bag’s water pH levels at 50, 100, 250, and 500 ppm for 6, 12, 24, and 48hr
exposure at room temperature .......................................................................................... 63
10. Cryovac E-2300 bag’s water ammonia levels at 50, 100, 250, and 500 ppm for 6, 12, 24,
and 48hr exposure at room temperature .......................................................................... 65
11. Ammonia levels in low density polyethylene bag’s water at 50, 100, 250, and 500 ppm
for 6, 12, 24, and 48hr exposure at room temperature .................................................... 65
12. Physical properties of selected packaging materials used to evaluate ammonia
permeability provided by suppliers .................................................................................. 67
13. Meat pH levels at 50, 100, 250, and 500 ppm exposure for 6, 12, 24, and 48 hr at
-17 ± 3 EC ........................................................................................................................ 81
14. Meat ammonia levels exposed at 50, 100, 250, and 500 ppm for 6, 12, 24, and 48 hr at -
17 ± 3 EC ......................................................................................................................... 85

ix
ACKNOWLEDGMENTS
I would like to express my heartfelt gratitude to my advisor Dr. J. Scott Smith for his
friendship, patience, and guidance through my degree program. I would also like to thank his
family for their support and friendship. I also extend thanks to my committee members, Dr.
Curtis L. Kastner and Dr. Tomas Herald for their suggestions, recommendations,
encouragement, and advice.
I wish to acknowledge my special thank and gratefulness to my father Abdul-Karim for
encouraging my curiosity and instilling the love of science, reading, and discovery.
My deepest thanks and appreciations to my mother Sahira who covered me with love and
care during my life. I deeply appreciate my brother Yasser who supported me during my studies
and to my brother Ali and my sister Zahraa for their love and care. I am indebted to my cousin
Sinna Mahdi and her husband Dr. Imad Khamis and their family for their support.
Finally, I would like to thank Kansas State University and its Department of Animal
Sciences and Industries for giving me the opportunity to pursue my master’s degree.

1
PART I: REVIEW OF LITERATURE
INTRODUCTION
Food safety and quality are goals of food science, food industry, and regulatory agencies,
and are a concern for consumer and public health organizations. Because food safety is
important to human health and food quality is important to consumers, the relationship between
food safety and food quality must be established and clarified. This would benefit not only the
food industry but also would facilitate decisions about food-related issues such as food
contamination, and help in evaluating critical control points and corrective actions in the hazard
analysis and critical control program (HACCP). Moreover, this information could be used in
insurance/customer claims involving food contamination (Al-Sahal 2003).
Food can have good quality but may still be unsafe. Many factors affect food quality and
safety, including temperature, oxygen, light, and chemicals. Temperature is the most important
in food value and acceptance. Temperature directly affects microbial growth, microbial
contamination, and chemical reactions, especially enzymes, as well as affecting the physical
properties of food. One of the oldest methods of preserving perishable food is freezing. Most
perishable foods are stored in a cold storage warehouses using a refrigerant like ammonia for
larger cold storage units or halocarbons for smaller or mid-size ones. Halocarbons like carbon
dioxide, sulfur dioxide, and methyl chloride have many advantages that make them good
refrigerants; they are non-toxic, non-flammable, and non-reactive. Conversely, their low
evaporation enthalpy, poor heating transfer, excessive pressure drop, and most importantly,
depleting the ozone layer, have made the refrigeration industry consider ammonia as an
alterative refrigerant. Ammonia has important advantages as a refrigerant: high efficiency in

2
providing cooling and freezing for food products (Holmstrom 1994), its relative low
environmental impact (Ross 1994), and its low production cost (Arnold 1993), with no impact on
the ozone layer. Ammonia is the refrigerant of choice for many food products.
Today, refrigeration with ammonia is the backbone of the food industry. It cools fruits,
vegetable, poultry, fish, beverages, dairy products, milk, and meat (Lorentzen 1988). Meat
production and processing require a large area for fabrication, handling, and storage. Most
fabrication facilities, slaughterhouses, and cold storage warehouses use ammonia as their
refrigerant (Arnold 1993; Ross 1994; Ross 1995; Sun 1998).
The disadvantages of using ammonia as a refrigerant include its toxicity and its
flammability. Ammonia is very explosive when mixed approximately one volume of ammonia
to two volumes of air, and much more so when mixed with oxygen (EPA 1995). Moreover,
ammonia itself can contaminate food products (Arnold 1993). Refrigerated warehouses using
ammonia as a refrigerant are subject to ammonia leaks due to typical equipment failures and
operator error; ammonia leaks are usually just a matter of time in a refrigerated/frozen food
storage facility. Leaks may be due to carelessness, but more often, they are due to equipment
issues (Ostner 1986).
High concentrations of ammonia affect many quality properties of meat, such as color
(Curda and Hruby 1987; Bonne et al. 1993), increased pH (Kassem and Johnston 1965; Anil
1971; Ireland 1988; Al-sahal 1995), increased water holding capacity (Anil 1971; Al-sahal
1995), persistent pink color after cooking (Smolskiy et al. 1985; Shaw et al. 1992), and altered
flavor (Ireland 1998; Hagyard et al. 1993; Guerrero and Arnau 1995). Ting and Henrickson
(1986) studied the effect of ammonia on meat tenderness, flavor, taste, water holding capacity,
and pH. The pH value is not a reliable indicator of the amount of the ammonia absorbed because

3
of the different buffering capacities of different foods (Kassem 1965). Furthermore, the odor of
ammonia from contaminated meat is not a good indicator of concentration level in contaminated
meat, because ammonia reacts with water and ice to form ammonium ions, which are odorless
(Dworkin et al. 2004).
Regulations and published information on food contaminated with ammonia is limited,
so contaminated products are held for an indeterminate period or condemned. The scientific
literature offers little guidance on evaluating product quality after exposure to ammonia
(Goodfellow et al. 1978). Some research has established the effects of high levels of ammonia
concentrations on meat quality, but the effects of low levels of ammonia on contaminated food
has not been covered, and the effect of time on contamination remains undetermined (Al-Sahal
2003).
In addition to refrigeration, most perishable foods currently are packed in plastic films
that protect food against external/internal influences that cause deterioration. In the 19th century,
pioneers like Nicholas Appert, Louis Pasteur, Samuel C. Prescott, and William L. Underwood
discovered the basic food packaging and preservation concepts that remain relevant today
(Wilson 2007). In the 20th century, inventions like glass bottles, cellophane wrap, aluminum
foil, and plastics gave packagers more flexibility (Lord 2008). Plastic packaging material is
functional, recyclable, lightweight, and widely used in food industry, so plastic packaging has
been increased markedly over the past 40 years. In 1991, plastics account for up to 50% of the
primary food packaging in the food industry, and polymers food wraps represent $211 million in
sales (Brewer and Harbers 1991).
Packaging encloses product using bags, pouches, cans, tubes, trays, or wraps. Packaging
follows the steps needed to contain and assemble food into product units for storage,

4
distribution, sale, and cooking. The main goal of packaging is to protect the product, increase
the shelf life, and maintain the product’s original conditions.
Packaging protects contents from contamination and spoilage, makes it easier to transport
food, store goods, in addition to providing a uniform measure of the contents (Hine 1995).
Protecting and preserving food is the principal role of food packaging (Robertson 2006).
Beardsell (1961) noted that packages should withstand the following conditions:
substantial change in temperature; humidity; vapor pressure; vibration through transportation;
low temperature and high air velocities in blast freezers; condensation from changes in
temperature and humidity; and weight of stacking under unfavorable conditions.
Package integrity and barrier characteristics are of concern in many areas of food
industry. Their importance in preserving commercial sterilized food in sealed packages is well
understood (Philips 1985; Denny 1989; Harper et al. 1995); this protection can be achieved with
single layer of polymer or multilayered films including different polymers.
Barrier materials are materials that possess low permeability to gases, vapors, and liquid.
Under this category, different types of barrier materials can be included: paper, plastic film
sheeting, fabrics and metallic foils, particle board, and wood laminates. In food packaging,
plastic materials are the most important, especially polyethylene, ethylene-vinyl alcohol
copolymers, polyvinylidene chloride, nylons, acrylic latex, high nitrile resins.
Gas permeability (transmission rate) and water vapor transmission rate (moisture
transmission rate) are the most important characteristics of barrier materials in food packaging,
but meat packaging requires special packaging materials because of special concerns during
storage.
Packaging films permeability depends on, among other things, molecular size and shape,

5
wetability, and the texture of the fabricated materials. Moreover, because permeability is a
molecular transport phenomenon, it is affected by the molecular orientation, degree of
crystallinity, and temperature. Kassem (1965) concluded that for ammonia vapor, the most
permeable packaging material was waxed paper, while Cryovac vacuum packaging was the least
permeable.
Package protection depends mainly on the package’s permeability to gases and vapors
that are harmful to the quality of the food products, and this permeability could be affected by
polymer properties, gas barrier properties of these polymers, and other properties that affect
permeability, which includes the size and the shape of the permeant molecule, polarity, and the
permeant temperature and pressure (Jasse et al. 1994). Even increasing the oxygen permeability
because of flex-cracking of the polymer used in all kinds of the packaging during transportation
may adversely affect food shelf-life (Mannheim and Miltz 1987).
Although meat contamination with high levels of ammonia has been investigated
extensively, there is almost no data available on meat contamination or whether ammonia can
permeate packaging films at levels below 500 ppm. Our research objectives were to measure the
levels of ammonia in exposed meat at freezing temperatures and evaluate the permeability of
three types of meat packaging materials at freezing and at room temperature after low levels of
ammonia exposure and different exposure times.
CHEMICAL AND PHYSICAL PROPERTIES OF AMMONIA
The ammonia molecule has a trigonal pyramid configuration with bond angles of 107E.
The pyramid structure consists of tri-hydrogen atoms and a nitrogen atom resonating between
equal stable positions at a distance of 0.360 D above and below the three hydrogen atoms’ plane.

6
This H-N-H bond angle of 107E is close to the tetrahedral angle of 109.5E. This electronic
arrangement of valence electrons in nitrogen is sp3 hybridized atomic orbitals (Jones 1997).
Ammonia is a colorless gas under standard conditions with a mass of 17.031 g/mol, a
boiling point of -33.3 EC, a freezing point of -77.7 EC, and a liquid density of 681.9 kg/m3 at -
33.3 EC and one atmosphere. Ammonia vapor density is 0.5967 (air = 1) (Table 1). Ammonia
gas is easily detectable by smell; most people can distinguish ammonia at 35 ppm and higher.
Trained people can detect ammonia at 5 ppm or even less (Raj 1982). Ammonia boils readily if
it is spilled and vaporizes, cooling its surroundings.
Approximately 1 ppm of ammonia (1 mg/liter) is equal to 0.70 mg/m3; however, this
value can vary according to the ambient atmosphere pressure and temperature. In liquid form,
ammonia is 60% of the weight of the water and as gas, is lighter than air at 25 EC and 1 bar
(Ostner 1986). Most commercially available ammonia forms are aqueous solutions. The most
common commercial formulation is 28-30% NH3 (Weast et al. 1988); at this concentration,
ammonia forms a nearly saturated solution in water.
Ammonia possesses a high affinity to water and dissolves readily in water or any product
containing water, forming an alkaline solution (aqua ammonia or ammonium hydroxide).
Ammonia in solution is usually called ammonium hydroxide and has been historically called
“spirit of hawthorn” (Windholz et al. 2001). Ammonium hydroxide acts as a weak base and is
partially ionized to ammonium (NH4+) and hydroxyl (HOG). This behavior refers to the polarity
of ammonia molecules and their ability to form hydrogen bonds. Furthermore, in aqueous
solution, ammonia acts as a base, because the nitrogen atom has a pair of unshared electrons that
can react with the H2O hydrogen ions, producing ammonium and hydroxide ions; the alkalinity
for the aqueous solution of ammonia relates to the hydroxide ions. The alkalinity of ammonia is
7
related to the availability of this unshared pair of electrons (Anil 1971; Mcmurray and Fay 1995)
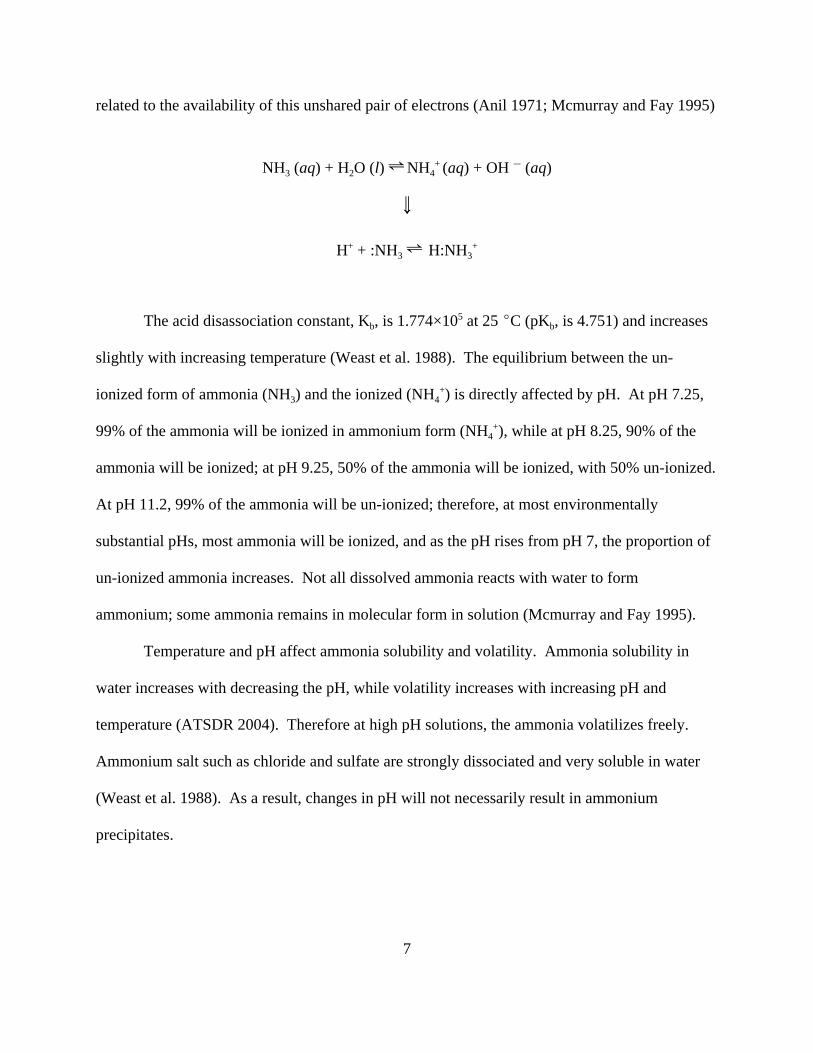
NH3 (aq) + H2O (l) º NH4+ (aq) + OH G (aq)
\
H+ + :NH3 º H:NH3+
The acid disassociation constant, Kb, is 1.774×10⁵ at 25 EC (pKb, is 4.751) and increases
slightly with increasing temperature (Weast et al. 1988). The equilibrium between the un-
ionized form of ammonia (NH3) and the ionized (NH4+) is directly affected by pH. At pH 7.25,
99% of the ammonia will be ionized in ammonium form (NH4+), while at pH 8.25, 90% of the
ammonia will be ionized; at pH 9.25, 50% of the ammonia will be ionized, with 50% un-ionized.
At pH 11.2, 99% of the ammonia will be un-ionized; therefore, at most environmentally
substantial pHs, most ammonia will be ionized, and as the pH rises from pH 7, the proportion of
un-ionized ammonia increases. Not all dissolved ammonia reacts with water to form
ammonium; some ammonia remains in molecular form in solution (Mcmurray and Fay 1995).
Temperature and pH affect ammonia solubility and volatility. Ammonia solubility in
water increases with decreasing the pH, while volatility increases with increasing pH and
temperature (ATSDR 2004). Therefore at high pH solutions, the ammonia volatilizes freely.
Ammonium salt such as chloride and sulfate are strongly dissociated and very soluble in water
(Weast et al. 1988). As a result, changes in pH will not necessarily result in ammonium
precipitates.

8
Table 1: List of some chemical and physical properties of ammonia1
Property Value Reference
Chemical formula NH3
Molecular weight 17.03 LeBlanc et al. 1978
Color Colorless LeBlanc et al. 1978
Physical state Gas at room temp. LeBlanc et al. 1978
Melting point -77.71 EC LeBlanc et al. 1978
Boiling point -33.35 EC LeBlanc et al. 1978
Density:
Gas 0.7710 g/L Weast et al. 1988
Liquid 0.6818 g/L (-33.35 EC; 1 atm) Windhozl 1983
Vapor density 0.5967 (air=1) Windhozl 1983
Specific gravity (25 EC) 0.747 g/L Lide 1998
Odor Sharp, Intensely irritating Sax & Lewis 1987
Odor threshold in air 48 ppm (34 mg/m3) Leonardos et al. 1969
Odor threshold in water 1.5 ppm Amoore 1983
pKa 9.26 (25 EC) Lide 1998
Solubility in water at 0 EC 47.8% (w/w) Budavari et al. 1996
Solubility in water at 25 EC 34% (w/w) LeBlanc et al. 1978
Vapor pressure:
Anhydrous NH3 8.5 atm (20 EC) Sax & Lewis 1987
Autoignition Temperature 650 EC LeBlanc et al. 1978
Flammability limits in air 16-25% LeBlanc et al. 1978
pH in water 11.6 (1 N) Windholz 20011Adapted from: ATSDR (2004)

9
AMMONIA PRODUCTION, USE, AND DISPOSAL
Ammonia is both a natural and manufactured chemical compound. Ammonia is an
essential product in the nitrogen cycle. In nature, the major source of the ammonia is microbial
production. Most nitrogen fixation in nature to usable forms (e.g., NH3) occurs because of
lightning strikes; microbial nitrogen fixation at the beginning of the 20th century has been
estimated at 90-130 teragrams (Tg; 1 teragram = one million metric tons) per year. Human
production also fixes nitrogen in useful forms. In 1999, human production of fixed nitrogen
(NH3) is estimated to be 140 Tg N per year, an amount that is similar to non-anthropogenic
source (NSF 1999; Socolow 1999).
Ammonia from decomposing animal excreta probably accounts for most of the ammonia
produced, with decaying organic materials from plants, dead animals, and the like contributing
significant amount (Dawson 1977; Crutzen 1983; Dawson and Farmer 1984; Galbally 1985;
Irwin and Williams 1988).
However, production of ammonia in the United States has declined over the past several
years. Increasing natural gas prices and weather related decreases in demands and closure of
several production plants have caused this decline. In 1999, the U.S. annual commercial
production capacity for ammonia was 16.6 million metric tons (CMR 1999), 15.7 million metric
tons in 2000 (SRI 2000), and 9.5 million metric tons in 2001 (Kramer 2002). In 2002, ammonia
production levels increased slightly to reach 10.8 million metric tons (Kramer 2003) because
natural gas prices went down.
Ammonia can be produced commercially in several ways. The modified Harber-Bosch
process is the usual commercial method for producing ammonia. This process was first
demonstrated in 1909 (Kramer 2000) and was commercially developed in Germany. The first

10
U.S. plant to use this process was built in Syracuse, New York, in 1921 (DOI 1985). In 1979,
98% of the produced ammonia in the United State was produced by Harber-Bosch process (EPA
1980; HSDB 2003). In this process, hydrogen (from the natural gas) and nitrogen (from the
atmosphere) are mixed at a ratio of 1 to 3 over a catalyst at high temperature and high pressure.
Any remaining unreacted gases are recirculated through the reactor and the ammonia is
collected. Ammonia may be produced as a by-product of coking coal, but the amount produced
is small compared to the amount produced by the modified Harber-Bosch process. Because
natural gas is used to produce ammonia, most industrial ammonia production occurs in areas
where natural gas is cheap and accessible.
The main commercial use of ammonia and ammonium compounds is in agricultural
fertilizers, representing 89-90% of commercially produced ammonia. Plastics, synthetic fibers
and resins, explosives, and other uses account for the rest (Kramer 2002, 2004). Kramer (2003)
categorized the direct use of ammonia as fertilizer based on the mass of nitrogen percentage in
each compound as follows: anhydrous ammonia, 26%, urea/ammonium nitrate solutions, 23%;
urea, 20%; ammonium nitrate, 4.5; ammonium sulfate, 2%; other forms, 3%; and multiple
nutrient forms, 21%. Most ammonium compounds and nitric acid are used directly in the
fertilizer production, usually to produce anhydrous ammonia.
Ammonia has a wide application in other industries as well. Ammonia is used as a
household cleaner, to inhibit corrosion, as a refrigerant, to purify water supplies, to make pulp
and paper, in metallurgy, in the food and beverage industry, and to make rubber. Ammonia is
used to manufacture pharmaceuticals and explosives and to produce various chemical
intermediates (LeBlanc et al. 1978; Sax and Lewis 1987). Ammonia may be released into air or
water as a gas or liquid, as regulated by federal, state, local governments. Because ammonia has

11
a high affinity to water, disposed ammonia may be diluted with water and neutralized with HCl
before discharging the chemical into surface waters. However, this generates a lot of heat, so
this method of disposing of ammonia is not desirable because of the related danger to personnel
involved in the process. Recovering ammonia from aqueous waste solutions is, however, a
viable option for many industries (HSDB 2003).
AMMONIA TOXICITY
Ammonia is strong local irritant and has a pungent odor. Ammonia is a corrosive
because of the alkalinity of ammonium hydroxide; when the chemical forms on mucous
membranes, it dissolves the cellular protein and causes corrosion. Ammonia primarily affects
the respiratory system and may cause severe damage, possibly leading to death. In general, the
following symptoms can be observed: pharyngitis, laryngitis, tracheobronchitis, nausea,
vomiting, increases salivation, and reflectoric bardycardia; edema of the glottis, laryngospasm,
bronchospasm, and interstitial lung edema are life-threatening symptoms (Coplin 1949). The
degree of ammonia toxicity and hazard to the human life depends on the concentration of
ammonia, length of exposure, and mechanism of exposure (Lessenger 1985). Table 2 illustrates
human physiological response to different levels of ammonia exposure. The general cause for
ammonia irritation in humans comes from the alkalinity when ammonia dissolves in body fluids.
The respiratory system, eyes, and skin are more susceptible to ammonia than other parts of the
body. Death by suffocation can be caused by breathing air containing 5000 ppm of ammonia.
Exposure to ammonia at 2000 ppm for a few seconds may result in skin burns and blistering and
may lead to acute lung edema. Moreover, exposure to ammonia concentrations higher than 700
ppm will cause eye injure that may cause loss of sight (Slack and James 1973; WHO 1986). For
12
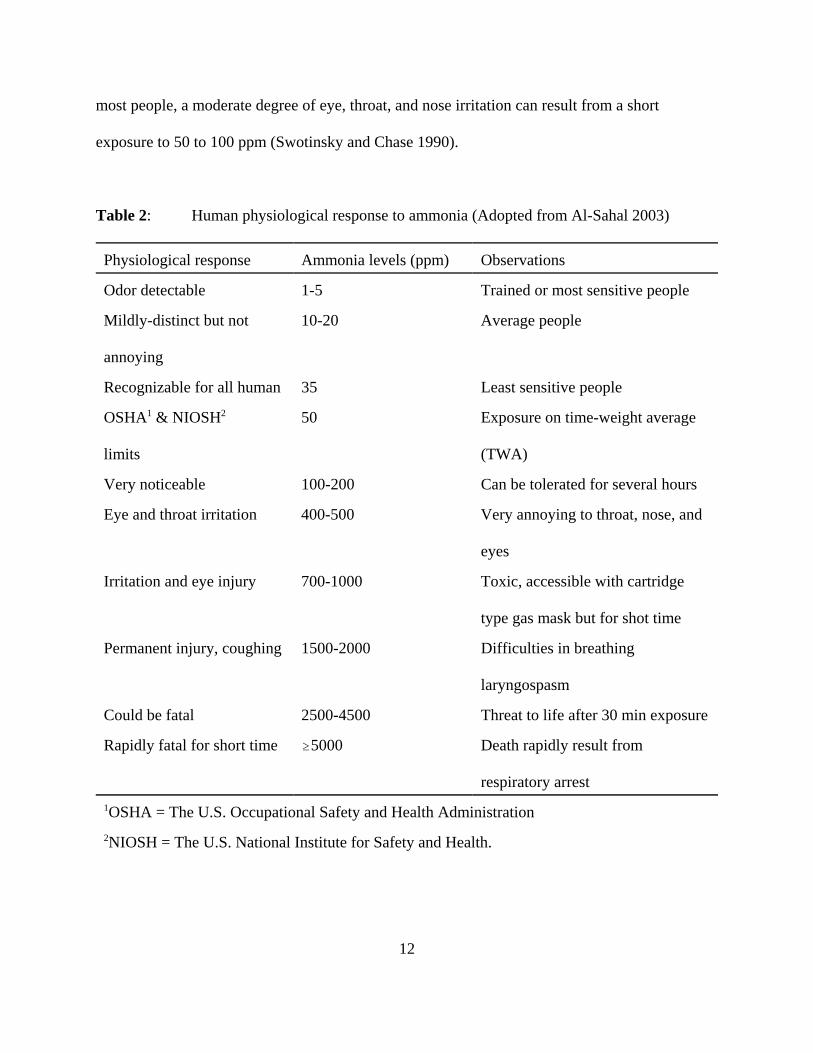
most people, a moderate degree of eye, throat, and nose irritation can result from a short
exposure to 50 to 100 ppm (Swotinsky and Chase 1990).
Table 2: Human physiological response to ammonia (Adopted from Al-Sahal 2003)
Physiological response Ammonia levels (ppm) Observations
Odor detectable 1-5 Trained or most sensitive people
Mildly-distinct but not
annoying
10-20 Average people
Recognizable for all human 35 Least sensitive people
OSHA1 & NIOSH2
limits
50 Exposure on time-weight average
(TWA)
Very noticeable 100-200 Can be tolerated for several hours
Eye and throat irritation 400-500 Very annoying to throat, nose, and
eyes
Irritation and eye injury 700-1000 Toxic, accessible with cartridge
type gas mask but for shot time
Permanent injury, coughing 1500-2000 Difficulties in breathing
laryngospasm
Could be fatal 2500-4500 Threat to life after 30 min exposure
Rapidly fatal for short time $5000 Death rapidly result from
respiratory arrest1OSHA = The U.S. Occupational Safety and Health Administration2NIOSH = The U.S. National Institute for Safety and Health.

13
Oral Exposure
Humans suffer ammonia toxicity by inhalation, dermal contact, and ingestion. In the
food industry, oral ingestion of ammonia is a major concern. One ammonia contamination
occurred in Wisconsin in 1985, the second incident occurred in Illinois in 2002. In the first
incident, children suffered from mouth/throat burn and nausea when children consumed
contaminated milk with ammonia (530 to 1,524 ppm; normal 1.4 ppm), while vomiting, nausea,
headache, and stomachache were the symptoms among the children who consumed
contaminated chicken tenders (138 to 2,468 ppm; normal 75 to 95 ppm) in the second incident.
The symptoms in the Illinois incident were more severe because of the high levels of ammonia
in the tenders. The literature supplies little information about ammonia oral toxicity; more
research is needed in this topic.
The scientific literature provides a few animal studies that document the effects of
ammonia contamination. Karplyuk et al. (1989) fed three generations of rats with meat that was
contaminated with ammonia levels of 0.1% (1000 ppm) and 0.3% (3000 ppm). At 3000 ppm,
each generation suffered from system damage during the first six months of the experiment: liver
damage, central nervous system damage, and reduced cholinesterase activity in the blood. At
1000 ppm, the rats still suffered from reduced lactate dehydrogenase and
alanineaminotransferase activity.
In another study, ammonium chloride was given to mice, guinea pigs, rats, rabbits, and
dogs to study the effects of metabolic acidosis, defined as formation of hydrogen ions from the
metabolism of ammonium ions to urea. The ingestion of ammonium chloride in doses of 500 to
1,000 mg/kg/day for 1-8 days induced metabolic acidosis in mice, guinea pigs, rats, rabbits, and
dogs (WHO 1986). Metabolic acidosis can cause a variety of changes in neurological,

14
pulmonary, cardiovascular, gastrointestinal, musculoskeletal function, as well as hematological
and clinical chemistry parameters.
Toxic Compounds Resulting from Ammoniation
Ammonia can be added to a cattle feed to increase food digestibility, dry matter intake,
and the nutritive value of poor quality roughage (Birkelo et al. 1986). Ammoniation is also used
to reduce the spoilage in high quality forages baled or stored with high moisture content.
Ammoniation prevents heating and subsequent microbial proliferation, fermentation, and mold
(Thorlacius and Robertson 1984; Atwal et al. 1986). However, feeding cattle molasses treated
with ammonia can cause “bovine bonkers” or “crazy cow syndrome”. Many cases of ammonia
intoxication in cattle were reported after cattle were fed treated grass straw or grain straw
(Bergstrom 1991). Winggins and Wise (1955) reported pyrazine and 4-methylimidazole (4-MeI)
in molasses treated with ammonia while Morgan and Edward (1986) referred to 4-
methylimidazole as a cause of the intoxication. Cattle fed ammoniated feed exhibited toxic
effects, especially in the central nervous system (Perdok and Leng 1987). Symptom included ear
twitching, salivation, stampeding, convulsions, trembling, and death (Morgan and Edward 1986).
Nishie et al. (1969, 1970) reported similar effects in mice fed different types of imidazole, 1-
methylimidazole, 2- methylimidazole, 4-methylimidazole, and pyrazine derivatives. The
toxicity of the pyrazine derivatives was low; most probably, the stronger effects were caused by
4-MeI from the ammoniated feed.
4-methylimidazole is a colorless heterocyclic compound formed from the reaction
between ammonia and a reducing sugar with heat (Simeone 1992; Yuan and Burka 1995).
Bergstrom (1991) found heating, moisture content, amount of reducing sugar, and amount of the

15
ammonia were all important in forming 4-MeI (Figure 1). Theoretically, 4-MeI formed in
ammoniated grass through the reaction between ammonia and the sugar of the hays or forage
during the preservation and heating process. Currently, hay is treated with anhydrous ammonia
(35 g/kg dry matter) and heated it to 90 EC for 15 hr during curing (Manson et al. 1989).
Figure 1: Chemical structure of 4-methylimidazole and subsequent interchangeable
rearrangement
AMMONIA FOOD CONTAMINATION
Ammonia food contamination was reported as a food outbreak twice in the United States.
The first incident occurred in Wisconsin in 1985, and the second incident occurred in Illinois in
2002.
Wisconsin milk contamination 1985
Two elementary schools in Wisconsin suffered ammonia contamination of milk on
October 30, 1985 (CDC 1986). The school children reported burning in the mouth and throat
within 1 hr of drinking contaminated milk. The incident occurred when the milk was packed in
half-pint containers that were contaminated by a high-pressure ammonia leak in the product
cooler. Analysis of the remaining milk in the containers showed an ammonia level of 530 ppm
to 1,524 ppm (normal is 1.4 ppm; Hiroshi 2000). The contaminated milk had elevated pH of 9.1
HCN
CH
N H3C
HCN
CH
NH3C

16
to 10.0 (normal is 6.7-6.9) due to ammonia contamination.
Illinois 2002
Several dozen schoolchildren in Illinois suffered from ammonia exposure from chicken
tenders on November 25, 2002 (Dworkin et al. 2004). The schoolchildren reported nausea,
headache, and stomach ache. The USDA-FSIS laboratory analyzed the remaining contaminated
chicken tenders and found a level of 138 ppm to 2,468 ppm of ammonia. It should be noted that
typical background levels for uncontaminated chicken tenders (nuggets) for the test used in this
evaluation ranged from 75-95 ppm (Hijaz et al. 2007).
ECONOMIC EFFECTS OF AMMONIA FOOD CONTAMINATION
Even though ammonia has many advantages as refrigerant, its toxicity remains the major
disadvantage. In many cases, ammonia leaks have resulted in multi-million dollars losses (EPA
2001). Arnold (1993) noted what affects the degree of ammonia food contamination: exposure
time, temperature, ammonia concentration, product types, and packaging. According to
Goodfellow et al (1978), three different methods to determine if ammonia contaminates food is
suitable for human consumption: pH values, sensory analysis, and ammonia concentration
levels. The food is safe for humans if the pH does not exceed the normal (uncontaminated) pH
by more than 1.0, its sensory analysis panel score is 5.0 or higher, and its ammonia level is not
more than 1000 ppm (Goodfellow et al.1978).
Ammonia leaks are not uncommon. In January 1964, a leak occurred in a commercial
plant in Knoxville, Tennessee, involving several food products. The amount of ammonia
released was estimated at 100 pounds (Kassem 1995). The largest ammonia leak incident
17
occurred in Florida in 1974 in a commercial cold storage warehouse (Goodfellow et al. 1978).
The total value of damaged product was $45,000,000, including 121 types of products in
150,281 cases and 939 lots. In February 1994, another ammonia leak occurred in Olympic Cold
Storage in Washington. Fifty eight tons of frozen seafood and vegetables worth around several
hundred thousand dollars were exposed in an ammonia spill. All the contaminated foods were
condemned because of high levels of ammonia in the analyzed samples and a strong ammonia
odor.
Another ammonia leak occurred in Virginia on September 30, 1999, in the S. Wallace
Edwards & Sons cold storage facility. The contaminated food product was 70,000 pounds of
ham. Because of the public safety concerns, the product was destroyed (USCOA 2003).
Two recalls were issued in 2001 for ammonia contamination. In December 19, 2001,
Stewart’s Beverages, Inc., in New York recalled several beverage products because of possible
contamination with ammonia. The recalled products involved different beverage flavors in
different sizes. All the contaminated products were produced by a third party company, Hillside
Bottling in New Jersey (FDA 2008h). Also in December 19, 2001, another product, sparkling
soda in 16 oz glass bottles also produced by Hillside Bottling in New Jersey was recalled by
Mistic Brands, Inc., because of potential ammonia contamination (FDA 2008i). Obviously, in
these cases, the possible ammonia contamination occurred at Hillside Bottling.
Recently on November 17, 2006, Birds Eye Foods voluntarily recalled frozen cooked
winter squash due to possible ammonia contamination. In all, Birds Eye recalled approximately
three million packages. The cooked winter squash was produced by a third party, Chase Farms,
in Walkersville, Michigan (FDA 2006).

18
AMMONIA REGULATIONS FOR FOOD AND FOOD PRODUCTS
The FDA (1973) has determined that normal concentrations of ammonia and ammonium
compounds present in food are GRAS (generally recognized as safe) food ingredients presented
no risk. Ammonia and ammonium ions are essential components of normal metabolic processes.
However, some restrictions have been established by FDA for allowable levels of ammonium
salts in food and food processing: 0.04–3.2% ammonium bicarbonate in baked goods, grain,
snack foods, and reconstituted vegetables; 2.0% ammonium carbonate in baked goods, gelatins,
and puddings; 0.001% ammonium chloride in baked goods; 0.8% ammonium chloride in
condiments and relishes; 0.6–0.8% ammonium hydroxide in baked goods, cheeses, gelatins, and
puddings; 0.01% monobasic ammonium phosphate in baked goods; 1.1% dibasic ammonium
phosphate in baked goods; 0.003% dibasic ammonium phosphate in nonalcoholic beverages; and
0.012% dibasic ammonium phosphate for condiments and relishes (ATSDR 2004).
Anhydrous ammonia is consider GRAS and approved for use as an antimicrobial agent in
lean finely textured beef according to good manufacture practice (USDA-FSIS 2009). In
addition, ammonium ion is regulated by the Clean Water Effluent Guidelines for the meat
products (EPA 2002j). Beef Products, Inc. (BPI), produces lean trim treated with anhydrous
ammonia to increase its pH and to eliminate pathogenic microorganisms (Niebur and Dickson
2003). Table 3 lists ammonia and ammonium salt regulations in food, processed food, and
animal feed.

19
Table 3: Ammonia and its salt regulations in food, processed food, and animal feed
Agency Ammonium salt/ion In Regulations Reference
EPA Ammonium ion Meat products Clean water
effluent guidelines
EPA 2002j
EPA Ammonium chloride
Ammonium hydroxide
Ammonium sulfate
Pesticide for
raw agricultural
commodities
Tolerance exempt
when used with
GAP
EPA 2002e
40CFR180.1001c
EPA Ammonium nitrate Growing crops Tolerance exempt
if used with GAP
EPA 2002e
40CFR180.1001d
EPA Fungicide ammonia Corn grain feed
oranges, etc.
Tolerance exempt
if used with GAP
EPA 2002f
0CFR180.1003
FDA Ammonium chloride Direct food
substances
GRAS FDA 2008a
21CFR 184.1138
FDA Ammonium hydroxide Direct food
substances
GRAS FDA 2008b
21CFR 184.1139
FDA Ammonium sulfate Direct food
substances
GRAS FDA 2008c
21CFR 184.1143
FDA Anhydrous ammonia Animal
feeding and
drinking water
Permitted FDA 2008e
21CFR 57.180
FDA Ammonium hydroxide Animal feeding GRAS when use
with GMP or GFP
FDA 2008f 1CFR
582.1139
USDA Ammonium hydroxide Meat brine Less than 11.6 pH USDA-FSIS
2009. 7120.1, 18
EPA = Environmental Protection Agency; FDA = Food and Drug Administration; GFP =
Good Feeding Practice; GMP = Good Manufacture Practice; GRAS = Generally Recognized
as Safe; USDA = United State Department of Agriculture

20
EFFECTS OF AMMONIA ON MEAT QUALITY AND PROPERTIES
Ammonia contamination of meat is obvious if the change in the meat pH rises by more
than 1.0 unit or a smell of ammonia presents when contaminated meat is cooked. For meat to
develop signs of contamination, the ammonia contamination must be relatively high (>15 ppm)
and/or the exposure time relatively long (> 120 min) (CSIRO 2002). Not only does
contaminated meat have elevated pH, but water holding capacity, color, tenderness, flavor,
juiciness, and texture also change (Al-Sahal 2003; Ting and Henrickson 1986). The degree of
change in the meat quality depends on ammonia exposure concentration, exposure time, type of
meat, type of cut, temperature, humidity, meat surface condition, and the distance between the
meat and the leakage source (Tuengerthal 1979). Several researchers have pointed out the color
darkening effect (Curda and Hruby 1987; Bonne et al. 1993; Al-Sahal 1995), while the presence
of pink color after cooking was noticed by Smolskiy et al. (1985) and Shaw et al. (1992).
Ammonia’s effect on meat flavor was studied by Ireland (1988), Hagyard et al. (1993), and
Guerrero and Arnau (1995). Increased meat pH was characterized by Kassem and Johnston
(1965), Herrmann and Johnston (1966), Anil (1971), Ireland (1988) and, Al-Sahal (1995). Meat
tenderness was investigated by Anil (1971) and Herman (1965). Anil (1971) and Al-Sahal
(1995) indicated that meat contaminated by ammonia had higher water holding capacity than
control. The type of food packing materials also affects the level of contamination. Wax paper
was most permeable to ammonia, while Cryovac vacuum packaging was less permeable
(Kassem 1965).
Meat Color
Meat color and meat appearance are most important to consumers purchasing meat. The

21
meat myoglobin molecule is responsible for the fresh meat color, and any change in this
pigment will change meat appearance and color. Moreover, the level of the myoglobin not only
affects the color of meat but the type of myoglobin and its chemical form, along with
characteristics of other meat components, also affect the color (Lawrie 1998).
To prevent meat color from deteriorating, most fresh meat producers have recently begun
to introduce carbon monoxide gas into packages. Carbon monoxide binds to myoglobin to
produce a bright color (carboximyoglobin) identical to the bright color produced by the oxygen-
myoglobin reaction (oxymayoglobin). Figure 2 shows the reaction between meat pigments with
oxygen and the developing color resulting from this interaction.
Treating meat with ammonia can also prevent meat from losing its color during storage
or cooking. Kassem (1965) exposed ground beef to 10 mL of ammonium hydroxide (NH3OH)
for 60 hr at -23 EC, and after aerating for 30 min at room temperature, the ground beef was
wrapped in three different types on packaging materials (waxed paper, regular, polyethylene, and
Cryovac wraps). Kassem (1965) concluded that a grayish color formed on the surface of the
ground beef (most noticeable in the regular wrap and the waxed paper wrap) with no color
change inside the ground beef. His results showed a significant difference between the treated
ground meat samples and the control in color, with no significant differences among the treated
ground beef samples. Smolskiy et al. (1985) concluded that sausage produced from meat treated
with 0.1 - 0.15% (1000-1500 ppm) ammonia had a more intensive pinkish color than the control.
Bonne et al. (1993) investigated beef and sheep carcasses in a refrigeration unit leaking
ammonia. They noticed meat contaminated with ammonia had a bright red color that did not
change even after 24 hr. Ammonia preserves meat color even after cooking. Shaw et al. (1992)
studied the effects of ammonia exposure and the pH on the pink color in cooked pork. Their

22
conclusion was ammonia treatment enhanced the pink color in the cooked pork meat rather than
changing in the cooked meat pH. Al-Sahal (2003) studied the effect of high ammonia exposure
on cooked beef muscles. He found that contaminated cooked beef muscle was more pink in
color than the uncontaminated muscle. Ammonia increases meat pH, and high pH protects the
myoglobin molecule from denaturation, which could explain the bright red color of the
contaminated meat. Kropf and Hunt (1998) indicated that high pH is important to produce the
bright red color in cooked meat.
In general, meat color depends on the availability of myoglobin and the fiber content of
the meat. However, meat type affects the formation of the bright red color. For example,
chicken has less myoglobin, so color in chicken meat will not change as color in beef or pork
meat does. Al-Sahal (1995) showed chicken meat contaminated with ammonia changes color
less than contaminated beef or pork.
Figure 2: The relationship among the three pigments color in the meat. Adapted from
Robertson (2006)
OxymyoglobinO2Mb
(Bright red)
Low O2(0.5- 1.0%)(Rapid)
Low O2 (0.5- 1.0%)
Myoglobin Mb
(Purple)Oxidation
Reduction (MRA)Metmyoglobin
MetMb(Brown)
Red
uctio
n pl
us
Oxy
gena
tion Oxygenatio n
Auto
xidat
ion
(Slo
w)
High O2(Rapid)
Deoxygenation

23
Meat Flavor and Odor
The higher ammonia concentration and the longer the exposure time the more effect has
on meat flavor and odor (Al-Sahal 2003). Bonne et al. (1993) investigated an ammonia leak in a
slaughterhouse where it was easy to detect ammonia odor on the contaminated carcasses surface.
However, aeration the carcasses for several hours in air clean cold room was effective to
eliminate ammonia odor. Kassem (1965) investigate an ammonia leak incident in a Knoxville
company in 1964 where different foods were packed in different packaging material (regular,
polyethylene, waxed paper, and Cryovac), concluding that ammonia altered the flavor and the
odor of the packed food. The sliced beef in a barbecue sauce had an ammonia odor and of
flavor. In addition, whole chicken in Cryovac packaging was not affected due to the
impermeability of the package. He also concluded that the packaging type changed how
ammonia affected the food and wax paper was the most permeable, while Cryovac was the least
permeable. Another study he performed. It was an organoleptic evaluation to a contaminated
ground beef packaged in the same packaging materials. The testers were unable to notice any
difference between the contaminated samples and the control, but they were able to detect
ammonia odor.
The effect of ammonia on meat was studied by Ireland (1988), who exposed lamb loins
to 2 M of ammonia gas at 4, 6, 16, and 32 min. Even with low ammonia concentrations, meat
flavor and odor changed from the control, as did the texture (more sloppy) and the color (much
paler).
Guerrero and Arnau (1995) noticed a change in ham flavor when they treated an exposed
ham with mites and their eggs with air saturated with ammonia for 24 hr to study the effect of
ammonia on eliminating the mites and their eggs from the ham. They concluded that, after one

24
day of treatment, ammonia was effective to eliminate all mites stages but also altered the ham
flavor and it was noticeable even after 7 days. In a study conducted by Hagyard et al. (1993),
levels of ammonium hydroxide solution (2 M), caused lamb loins to develop a rancid flavor after
3 months of storage at freezing temperature of -20 EC (twenty four month maximum storage
time for lamb loins at -18 EC; USDA-FSIS 2008); they concluded that ammonia contamination
reduced meat shelf life and freezing temperatures did not prevent damage to meat flavor.
In general, people can smell ammonia at a level as low as 10 to 20 ppm (Raj 1982). In
the Wisconsin incident (1985), no one detected any ammonia odor in the contaminated milk
level (CDC 1986). In a previous research in our own laboratory, we could not detect ammonia
odor in beef contaminated with ammonia at 1000 ppm. The ammonium ion has no odor and thus
when ammonia reacts with water in the food, it forms ammonium ions, which are odorless
(Massachusetts Department of Public Health 1998). Also the longer contaminated food is stored
the more chance that the ammonia odor will not be present due to ammonia volatility.
Meat pH
Meat pH is important to meat quality. pH can affect meat color, texture, enzymatic
reactions, and the water holding capacity of the meat. Exposing meat to ammonia will mostly
affect the outer layer of the meat surface (Anil 1971). Herrmann (1965) studied the effect of
high ammonia concentration on pork and beef meat surfaces. He noticed an increase in the
exposed meat pH compared to unexposed meat. Herrmann and Johnston (1966) studied the
change in the pH in four layers of a meat contaminated with ammonia. They found a significant
increase in pH for the first outer layer, with less increase in pH in the second layer, the third
layer, and the fourth layer. They concluded storage temperature (-28, -18, and -9.4 EC) had little

25
effect on pH level.
Anil (1971) studied the effect of temperature and ammonia absorption on the pH in beef
muscle. Anil (1971) exposed beef muscle to 10 milliliters of liquid ammonia for 72 hr at -4 EC.
The pH and the ammonia levels increased significantly in the exposed muscle, the ammonia
concentration in the first outer layer (0.6 cm) was higher than in the second layer (0.6 cm). The
third layer did not differ significantly from the control. Anil (1971) concluded that storage
temperature did not influence the distribution of ammonia within the meat layers.
Al-Sahal (2003) studied pH in beef muscle after it was exposed to high levels of
ammonia (500, 1000, 2500, and 5000 ppm and 0, 5, 10, and 20 min of exposure times).
Exposing meat to 5000 ppm for 20 minutes elevated the pH by 1 unit (Figure 3). The pH of the
beef steak surface was higher than the inner portion. Moreover, the total pH for a ground sample
from the same steak was lower than surface pH; the sample’s pH was diluted by the grinding and
by mixing the outer and the inner portions of the sample. In other research, adding 0.1 to 1.5%
(1000 to 15000 ppm) ammonia to meat processed into sausage elevated the sausage pH by one
pH unit (Smolskiy et al. 1985). However, pH is not a reliable indicator for ammonia
contamination in meat (Kassem 1965; Ireland 1988; Hagyard et al. 1993; Hijaz et al. 2007). The
buffering capacity of different meat types may affect the ammonia sufficiently to influence the
pH (Al-Sahal 1995).

26
Figure 3: The change in total pH of Semitendinosus steaks over time when exposed to
different concentrations of ammonia. Adapted from Al-Sahal (2003)
Meat Tenderness
Muscle fibers, connective tissues, and adipose tissues each influence meat tenderness
(Judge et al. 1989). Cover et al. (1962) described meat tenderness as softness to tongue and
cheek, ease of fragmentation, resistant to tooth pressure, resistance after chewing, adhesion, and
mealiness. Increasing meat’s water holding capacity by increasing the pH of the meat increases
tenderness. Herrmann (1965) studied the effect of ammonia on the tenderness of meat. He
exposed beef samples to ammonia for 24 hr at -28 EC, -18 EC, and -9.4 EC. Tenderness in
exposed meat improved at -28 EC and -9.4 EC compared with the unexposed control. However,
a sampling error may have occurred because the tenderness from the control did not differ
significantly from the ammonia treated sample at -18 EC.
Anil (1971) also noted that exposing beef samples to 10 mL ammonium hydroxide
solution for 72 hr effectively increased tenderness of meat. Anil pointed out that the meat
surface was more tenderer than the inner portion.
5.25.45.65.86.06.26.46.66.8
0 5 10 20
Exposure Time (min)
pH
5000 ppm 2500 ppm1000 ppm 500 ppm0 ppm

27
Meat Water Holding Capacity
During meat processing, meat loses water as well as any added water. Meat water
holding capacity (WHC), is the ability of meat to retain water under external forces like
grinding, cutting, centrifuging, heating, or pressing (Jauregui et al. 1981; Judge et al. 1989).
Hamm (1986) studied WHC using freezing, pH, thawing, heating, and postmortem changes. The
WHC of meat is mainly controlled by the protein net charge in the meat muscle, if the meat pH
is normal (around 7) at slaughter. Postmortem glycolysis in muscle causes an accumulation of
lactic acid, which results in a rapid decline in muscle pH to 5.5-5.6 (Greaser 1986). The iso-
electric point (equal charges of positive and negative in the protein net) for the meat is near pH 5
(Aberle et al. 2001). Equality in the net charge means WHC is minimal, so adding ammonia to
meat either intentionally or unintentionally will elevate meat pH and increase the net charge,
resulting in increased WHC and thus tenderness.
Al-Sahal (2003) assigned meat to different ammonia exposures (500, 1000, 2500, and
5000 ppm) and different exposure times (0, 5, 10, and 20 min) to test WHC. His results
confirmed a significant increase in WHC for meat exposed to concentrations of 2,500 ppm and
5,000 ppm at 5, 10, and 20 min. At 10,000 ppm ammonia exposure and 0, 3, 6, 12, 24, and 48 hr
exposure time, Al-Sahal (1995) noticed an increase in WHC of beef, chicken, and pork; at 5,000
ppm, WHC was significantly increased for the beef. He concluded that the different buffering
capacities of beef and the chicken may affect WHC. Smolskiy et al. (1985) concluded that
ammonia contaminated ground beef used to make sausage showed increased pH and WHC. In
another study, WHC increased in ammonia contaminated uncooked beef muscles and ammonia
contaminated cooked muscle (Anil 1971).

28
MEAT PACKAGING FUNCTIONS
Protecting meat from external hazards is the primary function of meat packaging. At the
same time, the packaging materials themselves should have no effect on meat. The packaging
materials chosen should meet minimum technical, legislative, environmental, and commercial
requirements (George 2000). Moreover, the food package should function as preservation
containment, protection, communication, identification, convenience, and distribution
(Robertson 1993; Soroka 1999).
ENVIRONMENTAL EFFECTS ON PACKAGING PERMEABILITY
Temperature
Both the diffusion coefficient (D) and the solubility coefficient (S) of a penetrate
determine the permeability coefficient (P). Both the diffusion coefficient and the solubility
coefficient depend on the temperature. Measuring the permeability coefficient or the vapor
transmission rate is not valid without reference to the test temperature (Plastic Design Library
1995). The effect of the temperature on the solubility coefficient can differ according to type of
penetrans. Permanent gases like oxygen and sparingly soluble gases and vapors increase with
increasing temperature, in such gases increasing the temperature increases the solubility
coefficient resulting in increasing the permeability, while increasing the temperature in
condensable gases such as ammonia and sulfur dioxide decreases the solubility coefficient
resulting in decreasing the permeability in general (Plastic Design Library 1995). Water vapor
permeation usually increases with increasing temperature, depending on the barrier and the
moisture content of the barrier. Increasing the temperature of organic vapors generally increases
the permeability but interferes with the swelling of the barrier materials.

29
Relative Humidity and Pressure
Diffusion of water through certain packaging materials depends on water concentration
due to the plasticizing effects of water on those materials that can lead to increase the
permeability. Therefore, water vapor transmission rate is affected by differences in relative
humidity. Thus, measuring relative humidity is important in correctly interpretating the
permeability measurement. Moreover, some packaging materials absorb water, which can
increase their permeability because of the elasticizing effect of the water. At normal pressure,
the solubility coefficient for permanent gases is proportional to their partial pressure, because at
normal pressure, the permanent gases follow Henry’s Law “At a constant temperature, the
amount of a given gas dissolved in a given type and volume of liquid is directly proportional to
the partial pressure of that gas in equilibrium with that liquid”. Thus, their permeation rates are
generally independent of pressure. For readily soluble gases, which do not obey Henry’s Law,
the permeation rates relate complexly to pressure. For these gases, measuring the pressure is
very important in correcting the permeation rate. For sparingly soluble vapors such as water
vapor in polyolefin, the permeation rate is proportional to the vapor pressure different across the
barrier wall.
FACTORS AFFECTING PACKAGE PERMEABILITY
The permeability of the polymeric packaging materials depends on two factors: the
diffusion and the sorption of gases and vapors. Both chemical structure and methods of
fabrication, including processing conditions of the packaging materials, influence permeability
coefficients. Moreover, the permeability of the packaging materials depends on polymer
structural parameters, including crystallinity, polarity, cross-linking, grafting, tacticity, and free

30
volume (Jasse 1994). In general, gas permeation rates through packaging plastic depends on
type of plastic, thickness, surface area, methods of processing, concentration or partial pressure
of the permeant molecule, and storage temperature (Kirwan et al. 2003). In addition, the
permeability of packaging materials to water vapor is depending upon material permeability,
surface area, and temperature (George 2000).
PROPERTIES OF SOME PLASTIC POLYMERS
Polyamide
Polyamide, or nylon, is a linear condensation thermoplastic made from monomers with
amine and carboxylic acid functional groups resulting in amide (-CONH-) linkage in the main
polymer chain that provide mechanical strength and barrier properties (Robertson 2006).
Because of the polarity of the polyamide (PA), the PAs are highly permeable to water vapor,
although their permeability to O2 and other gases is fairly low when dry. For most applications,
PAs are combined with low density polyethylene (LDPE) to add heat stability and a moisture
barrier to the packaging materials. Multilayer films containing a PA layer are used principally in
vacuum packages for processed meat and cheese (Robertson 2006). Identification for PA refers
to the number of carbon atoms in the diamine followed by the diacid. Nylon 6 and nylon 11 are
the most used forms of PA (Figure 4). Nylon 11 has twice the distance between amide groups
than nylon 6 and consequently is intermediate in properties between nylon 6 and polyethylene
(Brydson 1999a). Biaxially oriented PA film is highly heat resistant and resistant to stress,
cracking, and puncture. It has good clarity and is easily thermoformed with good barrier
property (Coles et al. 2003).

31
Figure 4: (a) Chemical structure of Nylon 6 (b) Chemical structure of Nylon 11
Polyolefin
Polyolefin refers to group of plastics based on propylene and ethylene, an important class
of thermoplastic packaging materials. Olefin means oil-forming and was originally the name of
ethylene (Robertson 2006). Polyolefin is widely used for meat and meat products especially for
poultry products for it tight, hermetically sealed package. However, Polyolefin are known to
absorb oil-based flavors (Jenkins and Harrington 1991).
Under Polyolefin, two major classes can be classified including polyethylene (PE) and
polypropylene (PP)
Low density polyethylene (LDPE)
LDPE is the largest volume single polymer used in the food packaging in both the film
and blow-molded form (Robertson 2006). LDPE is commonly used for packaging individually
quick frozen foods although it provides relatively poor protection from oxygen and good
protection from water vapor (George 2000). Figure 5 shows the polyethylene structure which is
basically a polymerization of -CH2-. A wide range of pressures and temperatures can be applied
in polymerization of polyethylene. In commercial production, pressure between 1,000 to 3,000
(CH2)5N
H
O
C
H
N
O
C
n
(CH2)10N
H
C
H
N
O
C
n
O
(a) (b)

32
atmospheres and temperatures of 100 to 350 EC are usually applied. Because of this, the simple
structure of polyethylene (unbranched -CH2-) is disturbed and long branches and short branches
form (Robertson 2006).
Figure 5: Branched polymer polyethylene
Polyethylene is classified into three major types: low density (LDPE), medium density
(MDPE), and high density (HDPE). LDPE is a good water vapor and poor oxygen barrier and
can form heat seals (Ozen and Mauer 2004). The number of CH3groups in 1,000 atoms of
carbon identifies each type of polyethylene. Table 4 shows the major types of polyethylene and
some of their physical properties.
The different of properties of the many grades of LDPE follow (Brydson 1999):
1- Variation in the degree of short chain branching in the polymer.
2- Variation in the degree of the long chain in the polymer.
3- Variation in the average molecular weight.
4- Variation in the molecular weight distribution (which may in part depend on the long chain
branching).
5- The presence of small of co-monomer residue.
C C C C C C C C
H
H H
H
H
H
H
H
H
H
H
HH H
HC
C
C
H
H
H
HH H
H

33
6- The presence of impurities or polymerization residues, some of which may be combined with
the polymer.
Table 4: Basic properties of various polyethylene films1
Type of Polyethylene Moisture Vapor
Transmission
Gas Transmission
O2 CO2
CH3 Group per
1000 Cs
LDPE (920 kg m-3) 1.4 500 1350 20-33
MDPE (940 kg m-3) 0.6 225 500 5-7
HDPE (960 kg m-3) 0.3 125 350 <1.5 1Transmission rate unite (g mm m-2 day-1). Adapted and modified from (Robertson 2006)
Polypropylene
Polypropylene has similar molecular structure to PE in some respect but it is more
complicated and has lower density, low water vapor transmission, and medium gas permeability
(Robertson 2006). It is a linear polymer containing little or no unsaturation and can be
subcategoriesd into three different stereo types Isotactic; Syndiotactic; and Atactic depending on
the distribution of the methyl group on either side of the polymer chain. Types of the catalyst
and polymerization conditions determine the stereo type of the PP. The three types of
polypropylene are displayed in Figure 6. Isotactic PP, is the most common commercial form of
polypropylene, it has good chemical and heat resistance but poor transparency. The relatively
high temperature resistant of PP permits its use as a sealing layer in retortable pouches
(Robertson 2006). In addition, PP films have limited food packaging application because of
their low cold temperature resistant. Copolymer mixtures with ethylene are used to improve cold

34
resistant and heat stability as well as materials strength and seal strength (Johannes and Otto
2000)
Figure 6: Polypropylene types: (a) Iostactic, (b) Syndiotaqctic, and (c) Atactic
GENERAL MATERIALS REQUIREMENTS FOR MEAT PACKAGING
Jenkins and Harrington (1991) summarized the general requirements for meat packaging
materials that can be apply for all products that including: clarity; resistance to cracking,
puncture, and pinhole formation; good oxygen barrier properties; good sealability; and easy
opening/closing. Moreover, the FDA and USDA regulations are usually concern about
migration of unapproved chemical substances through the contact layer of the package and reach
the food. U.S. legal requirements concerning food packaging are published in the Code of
Federal Regulation (CFR) title 21 volume 2 subpart 110.80. The section stated that "Packaging
process and material shall not transmit contaminant or objectable substances to the product".
Extending meat shelf life, prevent color discoloration, and fat rancidity are main requirements
for packages that intended to use for processed meat products, these adverse reaction are due to
oxygen and accelerated by light. In today’s applications, low oxygen permeability materials (0.2
C C C C C C C
C C C
(a) C C C C C C C
C C
(b)
C
C C C C C C C
C
C
C
C
C
C C
C
(c)

35
cc/100 in2.atm/24 hr at 50% R.H.) are used to structure meat processed packaging materials
(Jenkins and Harrington 1991). In addition, preventing freezing effects including discoloration
and frost formation inside the package are the most important features in this regard (Robertson
2006).

36
REFERENCES
Aberle ED, Forrest JC, Gerrard DE, Mills EW. 2001. Principles of meat science. 4th ed. Iowa:
Kendal/Hunt. Publishing Company.
Al-Sahal AA. 2003. Safety and quality assessment for beef exposed to low level of ammonia.
PhD Dissertation. Kansas State University, Manhattan, Kansas.
Al-Sahal AA. 1995. The effect of ammonia concentration and exposure time on the quality of
muscle tissue. MS. Thesis, Oklahoma State University, Stillwater, Oklahoma.
Amoore JE, Hautala E. 1983. Odor as an aid to chemical safety: Odor thresholds compared
with threshold limit values and volatilities for 214 industrial chemicals in air and water
dilution. J Appl Toxicol 3(6):272-290.
Anil N. 1971. Effect of ammonia on water-holding capacity and tenderness of frozen beef
muscle. MS. Theses, University of Tennessee, Knoxville.
Arnold M. 1993. The big chill ammonia finds its niche as a refrigerant. Food Processing
54(12):45,47.
ATSDR. 2004. Toxicological profile for ammonia. US Agency for toxic substances and disease
registry. www.atsdr.cdc.gov/toxprofiles/tp126-c4.pdf (Accessed on May 2009).
Atwal AS, Heslop LC, Lievers LC. 1986. Effectiveness of anhydrous ammonia as a
preservative for high-moisture alfalfa hay in large round bales. Can J Anim Sci
66(3):743-753.
Beardsell AC. 1961. Relating frozen food containers to realities of storage and distribution.
Quick Frozen Foods 24-271.
Bergstrom J. 1991. Factors affecting the formation of 4-Methylimidazole in ammonia-treated
fodder. J Agric Food Chem. 39(8):1422-1425.
Birkelo CP, Johnson DE, Ward GM. 1986. Net energy value of ammoniated wheat straw. J
Anim Sci 63(6):2044-2052.
Bonne R, Alteza C, Guerin D, Marestang L. 1993. Use of total volatile basic nitrogen as
measure of ammonia contamination of carcasses at the abattoir. Point-Veterinaire
24:150,749-750.
Brewer MS, Harbers CAZ. 1991. Effects of packaging on color and physical characteristics of
ground pork in long-term frozen storage. J Food Sci. 56(2):363-370.

37
Brydson JA. 1999. Plastic Materials, 7th ed. Oxford, London: Butterworth-Heineman. p213.
Brydson JA. 1999a. Plastic Materials, 7th ed. Oxford, London: Butterworth-Heineman. p488.
Budavari S, O'Neil MJ, Smith A. 1996. The Merck index, 12th ed. White house Station, New
Jersey: Merck & Co. Inc., 87.
CDC. 1986. Epidemiological notes and reports ammonia contamination in a milk processing
plan--Wisconsin. Morbidity and Mortality Weekly Report 35(17):274-5.
CMR. 1999. Chemical profile ammonia. Chemical Market Reporter. November 29, 1999.
Coles R, Mcdowell D, Kirwan MJ editors. 2003. Food Packaging Technology. Florida: CRC
Press. p197.
Coplin WM. 1949. Lancent 241:95.
Cover S, Hostetler RL, Ritchey SJ. 1962. Tenderness of beef. IV. Relations of shear force and
fiber extensibility to juiciness and six component of tenderness. J Food Sci 27(6):527-
536.
Crutzen PJ. 1983. Atmospheric interactions--homogeneous gas reactions of C, N, and S
containing compounds. In: Bolin B, Cook RB, eds. The major biogeochemical cycles and
their interactions. Chichester: John Wiley & Sons. p67-113.
CSIRO. 2002. Assessing meat quality after ammonia leaks. Australian Commonwealth
Scientific and Research Organization. http://www.meatupdaste.csiro.au/ammonia_leaks
.pdf. (Accessed May 2009).
Curda D, Hruby J. 1987. Quality of food contaminated by ammonia. Processing of 17th
International Congress of Refrigeration, Vienna C:364-368.
Dawson GA. 1977. Atmospheric ammonia from undisturbed and. J Geophys Res 82(21):3125-
3133.
Dawson GA, Farmer JC. 1984. Highly soluble atmospheric trace gases in the Southwestern
United States. I. Inorganic species: NH3, HNO3, SO3. J Geophys Res 89(D3):4779-
4787.
Denny CB. 1989. Industry action to ensure plastic package integrity. Food Technol 43(12):88.
DOI. 1985. Nitrogen (ammonia). Bureau of mines Bulletin 675. Washington, DC: Department
of the Interior.

38
Dowrkin MS, Patel A, Fennell M, Vollmer M, Bailey S, Bloom J, Mudhar K, Lucht R. 2004.
An outbreak of ammonia poisoning from chicken tenders served in a school lunch. J
Food Protection 67(6):1299-1302.
EPA. 1980. Source category survey: Ammonia manufacturing industry. Research Triangle Park,
NC: U.S. Environmental Protection Agency, Office of Air Quality, EPA450380014.
EPA. 1995. Control and pollution prevention options for ammonia emissions. Control
Technology Center: EPA-456/R-95-002.
EPA. 2001. Hazards of ammonia release at ammonia refrigeration facilities (update).
http://yosemite.epa.gov/oswer/ceppoweb.nsf/vwResourcesByFilename/ammonia.pdf/$Fil
e/ammonia.pdf. (Accessed May 2009).
EPA. 2002e. Tolerances and exemptions from tolerances for pesticide chemicals in food.
Exemptions from the requirement of a tolerance. U.S. Environmental Protection Agency.
Code of Federal Regulations. 40 CFR 180.1001(c) and (d) .http://frwebgate.access.gpo.
gov/cgi-bin /get-cfr.cgi?TITLE=40&PART=180&SECTION=1001&YEAR=1999
&TYPE=PDF (Accessed May 2009).
EPA. 2002f. Tolerances and exemptions from tolerances for pesticide chemicals in food.
Ammonia; exemption from the requirement of a tolerance. U.S. Environmental
Protection Agency. Code of Federal Regulations. 40 CFR 180.1003. http://frwebgate.
access.gpo.gov/cgi-bin/get-cfr.cgi?TITLE=40&PART=180&SECTION=1003&YEAR
=1999&TYPE=PDF (Accessed May 2009).
EPA. 2002j. Effluent guidelines and standards. CFR Title 40: Protection of Environment. U.S.
Environmental Protection Agency. http://www.epa.gov/docs/epacfr40/chapt-I.info/subch-
N.htm (Accessed May 2009).
FDA. 1973. GRAS (generally recognized as safe) food ingredients - ammonium ion. U.S. Food
and Drug Administration. PB221235.
FDA. 2008a. Direct food substances affirmed as generally recognized as safe. Ammonium
chloride. U.S. Food and Drug Administration. Code of Federal Regulations. 21 CFR
184.1138. http://www.accessdata.fda.gov/scripts/cdrh/cfdocs/cfcfr/CFRSearch.cfm?
fr=184.1138 (Accessed May 2009).
39
FDA. 2008b. Direct food substances affirmed as generally recognized as safe. Ammonium
hydroxide. U.S. Food and Drug Administration. Code of Federal Regulations. 21 CFR
184.1139 http://www.accessdata.fda.gov/scripts/cdrh/cfdocs/cfcfr/CFRSearch.cfm?fr=
184.1139 (Accessed May 2009).
FDA. 2008c. Direct food substances affirmed as generally recognized as safe. Ammonium
sulfate. U.S. Food and Drug Administration. Code of Federal Regulations. 21 CFR
184.1143. http://www.accessdata.fda.gov/scripts/cdrh/cfdocs/cfcfr/CFRSearch.cfm?
fr=184.1143 (Accessed May 2009).
FDA. 2008e. Food additives permitted in feed and drinking water of animals. Anhydrous
ammonia. U.S. Food and Drug Administration. Code of Federal Regulations. 21 CFR
573.180. http://edocket.access.gpo.gov/cfr_2008/aprqtr/pdf/21cfr573.180.pdf (Accessed
May 2009).
FDA. 2008f. Substances generally recognized as safe. Ammonium hydroxide. U.S. Food and
Drug Administration. Code of Federal Regulations. 21 CFR 582.1139.
http://www.accessdata.fda.gov/scripts/cdrh/cfdocs/cfcfr/CFRSearch.cfm?
fr=582.1139(Accessed May 2009).
FDA. 2008h. Stewart’s Beverages, Inc. recalls sodas because of possible health risk.
http://www.fda.gov/oc/po/firmrecalls/stewartsbev12_01.html (Accessed May 2009).
FDA. 2008i. Mistic Brands, Inc. recalls clear sparkling sodas because of possible health risk
http://www.fda.gov/oc/po/firmrecalls/mistic12_01.html (Accessed May 2009).
FDA. 2006. Birds eye foods is voluntarily recalling frozen cooked winter squash due to
potential contamination. http://www.fda.gov/oc/po/firmrecalls/birdseye11_06.html.
(Accessed May 2009).
Galbally IE. 1985. The emission of nitrogen to the remote atmosphere: Background paper.
NATO ASI Ser C 159:27-53.
George M. 2000. Selecting packaging for frozen food products. In: Managing frozen foods.
Kennedy CJ, editor. Florida: CRC Press Inc.
Goodfellow SJ, Bordeaux FM, Masters BA, Brown WL, Johnston MR. 1978. Assuring quality
after ammonia leaks. Food Product Develop 12(9):32-35.

40
Greaser ML. 1986. Conversion of muscle to meat. In: Bechtel JP, editor. Muscle as food.
Florida: Academic Press, Inc. p279-320.
Guerrero L, Arnau J. 1995. Dry cured ham, chemical methods to control mites.
Fleischwirtschaft Int. 2:84-86.
Hagyard C, Cummings T, Martin A. 1993. Effect of ammonia exposure on subsequent rancid
flavor development in lamp. J Muscle Food 4(3):245-251.
Hamm R. 1986. Functional properties of the myofibrillar system and their measurements. In:
Bechtel PJ, editor. Muscle as food. Florida: Academic Press, Inc. p 279-320.
Harper CL, Blakistone BA, Litchfield JB, Morris SA. 1995. Development in food packaging
integrity testing. Trends Food Sci. Technol. 6(10):336-340.
Herrmann EE Jr. 1965. The effects of ammonia on frozen beef and pork musculature. MS.
Thesis. University of Tennessee, Knoxville.
Herrmann EE Jr, Johnston MR. 1966. The effect of ammonia on frozen beef and pork
musculature. Proceedings of the Association of Southern Agriculture Workers Annual
Convention 63:163.
Hine T. 1995. The total package: The evaluation and secret meaning of boxes, bottles, cans and
tubes. Little Brown, New York.
Hiroshi S. 2000. Physiological significance of milk ammonia levels in prevention of liver and
metabolic disorders in cattle. Shokuniku ni kansuru Josei Kenkyu Chosa Seika
Hokokusho (translated from Japanese Language). 18:75-79
Holmstrom P. 1994. Ammonia versus freons as a refrigerant in the dairy industry. Scand Dairy
Info 8(3):46-47.
Hijaz F, Smith JS, Kastner CL. 2007. Evaluation of various ammonia assays for testing of
contaminated muscle food products. J Food Science 72(5):253-57.
HSDB. 2003. Ammonia. Hazardous Substances Data Bank. National Library of Medicine.
http://toxnet.nlm.nih.gov. (Accessed May 2009).
Ireland TL. 1988. Ammonia contamination of lamp. Proceedings of the Twenty-Fifth Meat
Industry Research Conference 855: 60:61.
Irwin JG, Williams NL. 1988. Acid rain: Chemistry and transport. Environ Pollut 50:29-59.

41
Jasse B, Seuvere AM, Mathlouthi M. 1994. Permeability and structure in polymeric packaging
materials. In: Mathlouthi M. editor. Food Packaging and Preservation. . Glasgow,
London: Chapman and Hall. p1-20.
Jauregui CA, Regenstein JM, Baker RC. 1981. A simple centrifugal method for measuring
expressible moisture, a water-binding property of muscle foods. J Food Sci
46(4):1271,1273.
Jenkins WA, Harrington JP. 1991. Packaging Foods with Plastics. Lancaster: Technomic
Publishing Co., Inc
Johannes B and Otto P. 2000. Characteristics of Plastic Materials. In: Piringer OG and Baner
AL. Plastic Packaging Materials for Food. Weinheim Germany. WILEY-VCH. p23
Jones M Jr. 1997. Organic chemistry. New York: W.W. Norton & Company. p 17-22 .
Judge MD, Aberle ED, Forrest JC, Hedrick HB, Merkel RA. 1989. Principles of meat science .
2nd. ed. Iowa: Kendall/Hunt Publishing Company.
Karplyuk IA, Nigmatullina GN, Stepanova EN. 1989. Possible harmful effect of meat
containing ammonia on experimental animals. Voprosy-Pitaniya 5:58-61.
Kassem AA. 1965. The effect of ammonia on frozen foods. MS. Thesis, University of
Tennessee, Knoxville.
Kassem AA, Johnston MR. 1995. The effect of ammonia on frozen foods. Proceedings of the
Association of Southern Agriculture Workers Annual Convention 63:16. 8(1):23-24.
Kirwan MJ and Strawbridge JW. 2003. Plastic in Food Packaging. Cole R, McDowell D,
Kirwan MJ. editors. In: Food Packaging Technology. Florida: CRC Press. p175.
Kramer DA. 2000. Nitrogen. U.S. Geological survey minerals yearbook.
http://minerals.usgs.gov/minerals/pubs/commodity/nitrogen/480400.pdf (Accessed May
2009).
Kramer DA. 2002. Nitrogen (fixed)ammonia. U.S. Geological survey, mineral commodity
summaries. http://minerals.usgs.gov/minerals/pubs/commodity/nitrogen/480302.pdf.
(Accessed May 2009).
Kramer DA. 2003. Nitrogen. U.S. Geological survey minerals yearbook.
http://minerals.usgs.gov/minerals/pubs/commodity/nitrogen/nitromyb02.pdf. (Accessed
May 2009).

42
Kramer DA. 2004. Nitrogen (fixed) ammonia. U.S. Geological survey, mineral commodity
summaries. http://minerals.usgs.gov/minerals/pubs/commodity/nitrogen/nitromcs04.pdf
(Accessed May 2009).
Kropf DH, Hunt MC. 1998. End point cooking temperature and meat color. Proceedings of the
Fifty-First Annual Reciprocal Meat Conference. 51:144-148.
Lawrie RA. 1998. Lawrie’s meat science. 6th. ed. United Kingdom: Technomic Publishing
Company. p212-229.
LeBlanc JR, Madhavan S, Porter RE. 1978. Ammonia. In: Grayson M, Eckroth D, editors.
Kirk-Othmer encyclopedia of chemical technology. 3rd ed. Vol. 2. New York: John
Wiley & Sons, Inc. pp470-516.
Leonardos G, Kendall D, Barnard N. 1969. Odor threshold determinations of 53 odorant
chemicals. J Air Pollut Control Assoc 19:91-95.
Lessenger JE. 1985. Medical management retention of anhydrous ammonia emergencies.
Lide DR. 1998. CRC handbook of chemistry and physics. 79th ed. Florida: CRC Press, Inc.
Lord JB. 2008. The food industry in the United State. In “Developing new food products for a
changing marketplace” 2nd ed., editors. Brody AL and Lord J. CRS Press Inc, Florida.
p1-23.
Lorentzen G. 1988. Ammonia: An excellent alternative. Int. J Refrig 11:248-252.
Mannheim CH and Miltz J. 1987. Interaction between laminated and citrus products.
International Federation of Fruit Juice Producers, Symposium XIX, Den Haag P. p137.
Mason VC, Keene AS, Cook JE, Cooper EM, Hartley RD. 1989. Oven and stack ammoniation
of grass hays. Anim Feed Sci Technol. 24(3-4):299-311.
Massachusetts Department of Public Health Division of Food and Drugs Food Protection
Program. 1998. Guidelines for evaluating food products for salvage and reconditioning.
http://www.mass.gov/Eeohhs2/docs/dph/environmental/foodsafety/salvage_recondition.p
df. (Accessed May 2009).
McMurry J, Fay RC. 1995. Chemistry. New Jersey: Prentice Hall. p300-301, 514.
Morgan SE, Edwards WC. 1986. Bovine bonkers: new terminology for an old problem a
review of toxicity problem associated with ammonia feeds. Vet Human Toxicol 28:16-
18.

43
Niebuhr SE, Dicknson. 2003. Impact of pH enhancement on population of Salmonella, Listeria
monocytogenes, and Escherichia coli O 157:H7 in boneless lean beef trimming. J Food
Protect 66(5):874-877.
Nishie K, Waiss AC, Keyl AC. 1969. Toxicity of methylimidazoles. Toxicolo Appl Pharmacol
14(2):301-307.
Nishie K, Waiss AC, Keyl AC. 1970. Pharmacology of alkyl and hydroxyalkylpyrazine.
Toxicolo Appl Pharmacol 17(1):244-249.
NSF. 1999. Interim report: environmental science and engineering for the 21st century. The
role of the National Science Foundation. Arlington, Virgenia: National Science
Foundation. NSB 99-133.
Ostner WA. 1986. The ammonia spill: before-during-after. In: Crisis Management Manual.
International Association of Refrigeration Warehouses. Bethesda, Maryland.
Ozen BF, Mauer LJ. 2004. Food Packaging. In: Smith JS, HuiYH editors. Food Processing
Principles and applications. Iowa: Blackwell Publishing. p120
Perdok HB, Leng RA. 1987. Hyperexcitability in cattle fed ammoniated roughages. Anim Feed
Sci Technol 17(2):121-143.
Philips FA. 1985. FDA’s viewpoint on package integrity. N.Y. State Agric. Exp. Station
Special Rep. 58:33-36.
Plastics Design Library Staff. 1995. Permeability and Other Film Properties of Plastics and
Elastomers. William Andrew Publishing/Plastics Design Library.http://knovel.com/
web/portal/browse/display?_EXT_KNOVEL_DISPLAY_bookid=376&VerticalID=0.
(Accessed May 2009).
USCOA. 2003. Edwards & Sons v. Cincinnati Insurance Co. United State Court of Appeal
http://pacer.ca4.uscourts.gov/opinion.pdf/021885.P.pdf (Accessed May 2009).
Raj P. 1982. Ammonia. In: Bennett GF, Feates FS, Wilder I, editors. Hazardous Materials
Spills Handbook. New York: McGraw-Hill, Inc. p10-51.
Robertson GL. 2006. Structure and Related Properties of plastic Polymers. In: Food
Packaging Principles and Practices, 2nd ed. Florida: CRC Press. p9-42.
Robertson GL. 1993. Food Packaging. New York: Marcel Dekker.
Ross W. 1995. CFC-free refrigeration plant for slaughterhouses. Fleischwirtschaft Int (1):10,12.

44
Ross W. 1994. Ammonia refrigerant plants at poultry abattoir. Food Market Technol.
Sax NI, Lewis RJ, editors. 1987. Hawley's condensed chemical dictionary. New York: Van
Nostrand Reinhold. p1288.
Simeone AM. 1992. Physiological response to the feeding of ammoniated orchardgrass hay and
orchardgrass hay plus 4-methylimidazole. MS Thesis, University of Kentucky,
Lexington.
Shaw DE, Claus JR, Stewart KK. 1992. Effect of ammonia exposure on fresh pork: a distinct
pink color after cooking. J Muscle Foods 3(2):169-174.
Slack AV, James RG. 1973. Ammonia Vol. 2. New York: Mercel Dekker, Inc. p38-39.
Smolskiy NT, Krishtafovich VI, Kosnyreva LM. 1985. Characteristic of colour formation in
cooked sausage made from meat exposed to ammonia vapours. Plant/Operation Progress
4(1):20-25.
Socolow RH. 1999. Nitrogen management and the future of food: Lessons from the
management of energy and carbon. Proc Natl Acad Sci USA 96:6001-6008.
Soroka W. 1999. Fundamentals of food packaging technology, 2nd ed. Institute of packaging
professionals
SRI. 2000. Directory of chemical producers USA. Menlo Park, California: SRI International.
p457-463.
Sun DAW. 1998. The aqua-ammonia absorption system: an alternative option for food
refrigeration. J Food Proces Preserv 22(5):371-386.
Swotinsky RB, Chase KH. 1990. Health effect of exposure to ammonia: scant information.
Amer J Indst Med 17(4):515-521.
Thorlacius SO, Robertson JA. 1984. Effectiveness of anhydrous ammonia as a preservative for
high-moisture hay. Can J Anim Sci 64(4):867-880.
Ting RS, Henrickson RL. 1986. The effect of ammonia on meat quality. MS. Thesis.
Oklahoma State University, Stillwater, Oklahoma.
Tuengerthal SH. 1979. Reduction in the value of frozen meat due to ammonia escaping from a
break in the refrigeration unit. Fleischwirtschaft 59(11):1632, 1634-1636.

45
USDA-FSIS. 2008. Mail order food safety. http:/ www.fsis.usda.gov/pdf/mail_order_food_
safety.pdf (Accessed May 2009).
USDA-FSIS. 2009. Safe and suitable ingredients used in the production of meat and poultry
products. Driective 71201, amend 18. http:/www.fsis.usda.gov/OPPDE/rdad/FSIS
directives/7120.1.htm (Accessed May 2009).
Weast RC, Astle MJ, Beyer WH, editors. 1988. CRC Handbook of chemistry and physics. Boca
Raton, Florida: CRC Press, Inc.
Wigginis L F, Wise WS. 1955. The nature of ammoniated molasses. Int Sugar J 57:435-437.
Wilson C. 2007. Frontiers of intelligent and active packaging for fruits and vegetables, CRS
Press, Boca Raton, Fla.
Windholz M, Budavari S, Blumetti RF, et al., editors. 2001. The Merck index, 13th ed. New
Jersey : Merck & Co., Inc.
WHO. 1986. Ammonia: environmental health criteria 54. World Heath Organization,
International Program on Chemistry Safety, Geneva.
Yuan JH, Burka LT. 1995. Toxicokinetics of 4-methylimidazole in the male F344 rat.
Xenobiotica 25(8):885-894.

46
PART II: PERMEABILITY OF MEAT PACKAGING MATERIALS TO LOW LEVELS
OF AMMONIA GAS*
ABSTRACT
Meat products are packaged in polymer films that theoretically should protect the product
from exterior contamination. Unfortunately, there is almost no data on ammonia permeability of
packaging films. Thus, we chose to investigate common meat packaging films 2.2 mil low
density polyethylene (LDPE), 3 mil Cryovac multilayer polyolefin (E-2300), and 3 mil vacuum
0.6 mil polyamide/2.4 mil polyethylene (V-PA/PE) and their permeability to ammonia. The
films were fabricated into 10 x 5 cm pouches and filled with 50 mL deionized water. Pouches
were placed in a plexiglass enclosure in a 1.3 CUF freezer and exposed to 50, 100, 250, and 500
ppm ammonia gas at 6, 12, 24, and 48 hr in -17 ± 3 EC and 21 ± 3 EC. At freezing temperatures,
no ammonia residues were detected and no differences in pH were found. At room temperature,
the ammonia concentrations and the pH increased significantly (P < 0.05) in the water with
increasing exposure time and ammonia concentrations. The maximum average levels observed
in the water were 7.77 ppm for Cryovac (E-2300), 5.94 ppm for LDPE, and 0.89 ppm for V-
PA/PE at 500 ppm exposure for 48 hr at 21 ± 3 EC. The maximum average pH values observed
were 8.64 for E-2300, 8.38 for LDPE, and 7.23 for V-PA/PE (unexposed ranged from 5.49 to
6.44) with exposure of 500 ppm at 48 hr. The results showed that meat packaging materials
have low ammonia permeability and thus protect meat products exposed to ammonia exposure
during frozen storage.
_______________________________________
*Presented in part at IFT Annual Meeting, June 7, 2009, # 060-12 (http://www.am-fe.ift.org/cms)

47
INTRODUCTION
Ammonia is the refrigerant of choice for food products and the refrigeration backbone in
the food industry (IIAR 2006). Ammonia has important advantages as a refrigerant: high
efficiency in providing cooling and freezing for food products (Holmstrom 1994), relatively low
environmental impact (Ross 1994), and low production costs (Arnold 1993) with no impact on
the ozone layer.
The food industry uses refrigeration with ammonia to cool fruits, vegetables, poultry,
fish, beverages, dairy products, milk, and meat (Lorentzen 1988). Most fabrication facilities,
slaughterhouses, and cold storage warehouses use ammonia as their refrigerant (Ross 1995; Sun
1998). With typical equipment failures and operator error, ammonia leaks will occur in
refrigerated/frozen food storage facilities. Carelessness may be part of the problem, but more
often equipment failures are the issue (Ostner 1986).
Beside refrigeration and freezing, most perishable foods currently are packed in plastic
films to protect food against external/internal deterioration. Package integrity and barrier
characteristics are important in many areas of the food industry. Their importance in preserving
and protecting commercial sterilized food in sealed packages has been well investigated (Denny
1989; Harper et al. 1995) A single layer or multilayered polymer films of different polymer
materials can sufficiently protect food (Jasse et al. 1994).
Package protection means the material is not permeability to gases and vapors harmful to
the quality/safety of the food products. Permeability through any plastic film is measured by the
permeability coefficient (P = D × S) that describes the transfer of a total mass at a steady state
through plastic materials (Crank 1975). In this equation, P is the permeability coefficient; D is
the diffusion coefficient (a measure of the transportation speed of the molecule through a plastic

48
film); and S is the solubility coefficient that measures the number of the permeant molecules
moving through a plastic film. The properties of polymers that affect the permeability are
crystallinity; polarity; chain to chain packing ability; glass transition temperature; size, shape,
and polarity of the permeant; temperature; and pressure (Pascat 1986; Sperling 1992; Robertson
1993). In addition, the permeant temperature and pressure are important in permeability to gases
and vapors (Jasse et al. 1994). The stages through which a permeant molecules permeates
polymers are the following (Ashley 1985): (1) absorption of the permeant onto the polymer
surface; (2) solubilization of the permeant in the polymer texture; (3) diffusion of the permeant
through the polymer along a concentration gradient; and (4) desorption of the permeant from the
other polymer surface. Mannheim and Miltz (1987) concluded that an increase in oxygen
permeability due to flex-cracking of the polymer during transportation may adversely affect food
shelf life.
The literatures offer almost no data regarding permeability of food packaging to
ammonia gas. In addition, there is a lack of information related to the level of protection that
food packaging materials can provide during an exposure to ammonia gas. The objectives of
this research were to evaluate the permeability of three different packaging materials commonly
used in the meat industry to low levels of ammonia exposure at different times in freezing and
room temperature.
MATERIALS AND METHODS
Experimental Design
Three different meat packaging materials, 2.2 mil low density polyethylene (LDPE)
(Manchester Packaging Co., Saint James, Missouri, USA); 3 mil Cryovac multilayer polyolefin

49
(E-2300) (Cryovac Sealed Air Corporation, Duncan, South Carolina, USA); and 3 mil vacuum
0.06 mil polyamide/2.4 mil polyethylene (V-PA/PE) (Ultravac Solutions LLC, Kansas City,
Missouri, USA), were randomly assigned to a flow rate of 85 mL/min and various ammonia
concentrations at different exposure times and temperatures at -17 ± 3 EC and at 21 ± 3 EC. The
average ammonia concentrations used were 0 (control), 50, 100, 250, and 500 ppm with
exposure times of 0 (control), 6, 12, 24, and 48 hr. The over all experiment process was
replicated three times. A plexiglass box was used as an exposure chamber and was inserted
inside a freezer (1.3 CUF; Haier America, New York, USA). The experiment was carried out in
a fume hood with air flow rate of 123 FPM (Labconco Corporation, Kansas City, Missouri,
USA). The experiment steps are depicted in Figure 7.
Prefabricated (10 × 5 cm) 50 mL water filled Cryovac E-2300, LDPE, and V-PA/PE pouches „
Placed in freezer for 4-6 hr„
Inserted four pouches of each type (total of 12 samples) into freezer 1.3 CUF (-17 ± 3 EC)„
Applied flow rate of 85 mL/min of ammonia gas (50, 100, 250, and 500 ppm)„
Withdrew one pouch of each type only at certain time of 6, 12, 24, and 48 hr„
Thawed overnight at 4-8 EC in a refrigerator„
Measured pH values and ammonia levels for each pouches water„
Repeated the process, applying the same ammonia concentrations and exposure times at room temperature (21 ± 3 EC) without freezing the samples.
Figure 7: A general flow chart for the experiment process of the meat packaging materials

50
Sample Preparation
Plastic films were sealed to 10 cm × 5 cm pouches using a Midwest Pacific
impulse heat sealer (J. J. Elemer Corp., St. Louis, Missouri, USA), and filled with 50 mL of
deionized water (Figure 8).
Figure 8: Fabricated plastic films Cryovac, low density polyethylene, and vacuum with
dimensions of 10 × 5 cm and filled with 50 mL deionized water
A pinhole was made in one corner of the pouch to remove any trapped air. Each pouch
was approximately 2.3 cm thick. In the experiment performed under freezing conditions, the
pouches were placed inside an air tight 1.7 L plastic container (Lock and Lock, Heritage Mint,
Ltd. Scottsdale, Arizona, USA) and inserted into a freezer for 4-6 hr until the pouches were
frozen. Frozen pouches were assigned to different ammonia exposures for different times. In
the room temperature experiment, pouches were fabricated and filled with deionized water and
assigned directly to the experiment. Pouches were coded and placed randomly in a treatment
chamber for a total of twelve samples for each treatment replicate combination. One pouch of
each kind was removed at 6, 12, 24, and 48 hr for freezing temperature treatment and room
temperature treatment.

51
Exposure Chamber
A clear plexiglass box measuring 38W × 13.5D × 36H cm (18.5 L) was used as a
treatment chamber (see Figure 9). The exposure chamber was tested for leaks and proper seal by
inserting a ToxiRae PGM-30 Photo-Ionization Detector (PID) (accuracy ± 2 ppm or ± 10% of
the reading; RAE Systems, California, USA) into the chamber and locking the chamber. The
detector was operated and calibrated according to the ToxiRae PGM-30 instruction manual. The
ToxiRae PGM-30 can detect ammonia levels and store the data. The detector is also portable
and rechargeable and has a screen that displays readings. A concentration of 50 ppm of
ammonia gas was introduced into the chamber from a calibrated 50 ppm (± 2%) ammonia gas
cylinder.
Figure 9: Exposure chamber used in the experiment with two L-shape fittings mounted on
the back and 15 cm round front door
When the concentration of 50 ppm was reached and detected, the ammonia gas supply
was stopped, and the chamber was locked. After 7 hr, the detector was removed, and the
readings were recorded, after analyzing the detector’s data no depleting in the ammonia

52
concentration was found inside the chamber, the box had no leaks. In addition, the chamber was
pressurized with air, locked, and immersed in a water bath. No bubbles were observed coming
from the chamber during this test.
The pouches were inserted into the chamber through a round front door (15 cm dia) and
were attached to stainless steel hooks, suspended on two plexiglass bars attached horizontally
between the left and the right side of the box (Figure 10). On the back side of the chamber, two
L-shape threaded fittings were mounted to serve as gas inlet and outlet, one in the upper right
and the other in the lower left; these allow the ammonia gas to be homogeneously distributed
throughout the chamber.
Figure 10: Water filled fabricated pouches inside the exposure chamber inside the freezer
suspended on two plexiglass bars

53
Exposure System Design
The exposure system (See Figure 11) was designed to simulate the true conditions of low
level of ammonia exposure and to manually control the ammonia flow rate entering the chamber
while maintaining the desired level of ammonia concentration. The ammonia cylinder was
connected to a 0-65 mm gas flow regulator inlet (Cole-Parmer Instrument Company, Vernon,
Illinois, USA), and the gas regulator outlet was fitted to a T-shaped plastic connector. The
exposure chamber and the detector were attached to the connector. The chamber outlet was
assembled with a T-shaped tube connector hocked to a one-way plastic valve (TETRA
Technologies, Inc., The Woodlands, TX, USA) to prevent the ambient air from entering into the
chamber and diluting the ammonia concentration, especially under freezing conditions. The
valve served as a pressure release device to prevent breakage in the chamber if pressure levels
became too high during flushing. A second gas flow regulator identical to the first one
connected to the other end of the one-way valve to monitor the ammonia exhaust flow rate.
The other end of the T-shaped connector was attached to a glass heat exchanger in order
warm the ammonia gas before reaching the detector, especially in the experiments that were
performed under freezing temperatures. Plastic tubing (TYGON S-50-HL, class VI, size 0.46 ×
0.16 cm) was used to combine the system parts together. Figure 12 shows the tubing
connections between the freezer and the inlet gas flow regulator; MiniRae 2000 PID; heat
exchanger; and the outlet gas regulator.
Procedure
The ammonia gas cylinders were obtained from Linweld, Inc., (Manhattan, Kansas,
USA) and were manufactured by Matheson Tri-Gas, Inc., (Joliet, Illinois, USA) with
concentrations of 50, 100, 250, 500, and 1000 ppm ( calibrated concentration were 48.8, 90.0,

54
238.7, 474.0, and 992.0 ppm; ±2% in air). Two cylinders were used in each treatment. The
1000 ppm ammonia concentration cylinder introduced ammonia at the desired level to flush the
chamber (Figure 13) while maintaining a continuous exposure of the required ammonia
concentration for the required time with 50, 100, 250, and 500 ppm concentration cylinders
(Figure 14).
Figure 11: The exposure system components: low ammonia concentration tank, inlet gas
flow regulator, MiniRae 2000 detector, glass heat exchanger, freezer, and outlet
flow regulator

55
Figure 12: Tubing connection between the system parts
A stainless steel, single stage regulator (Air Products, Brown Welding, Salina, Kansas,
USA) was mounted on the low concentration cylinder to control the flow rate pressure of
ammonia gas into the gas flow regulator. The temperature inside the chamber was monitored
with a Smart button data logger (Accuracy: ± 1.0 EC from -30 EC to 45 EC) (ACR Systems, Inc.,
Surrey, British Columbia, Canada).

56
Figure 13: Chamber flushing process and ammonia gas directions in the system. The
chamber was flushed using the higher ammonia concentration cylinder (1000
ppm), and the reading was recorded using MiniRae 2000 photo ionization
detector
Figure 14: Movement directions of ammonia gas during exposure
Freezer
Smart Button
Chamber
Heat Exchanger
High ConcentrationAmmonia Tank
MiniRae 2000(PID)One Way
Valve
Gas Regulator
Blocker
Freezer
Smart Button
Chamber
Low ConcentrationAmmonia Tank
Heat Exchanger
High ConcentrationAmmonia Tank
MiniRae 2000(PID)
One WayValve
Blocker
Gas Flow Rate Adjuster
Gas Regulator
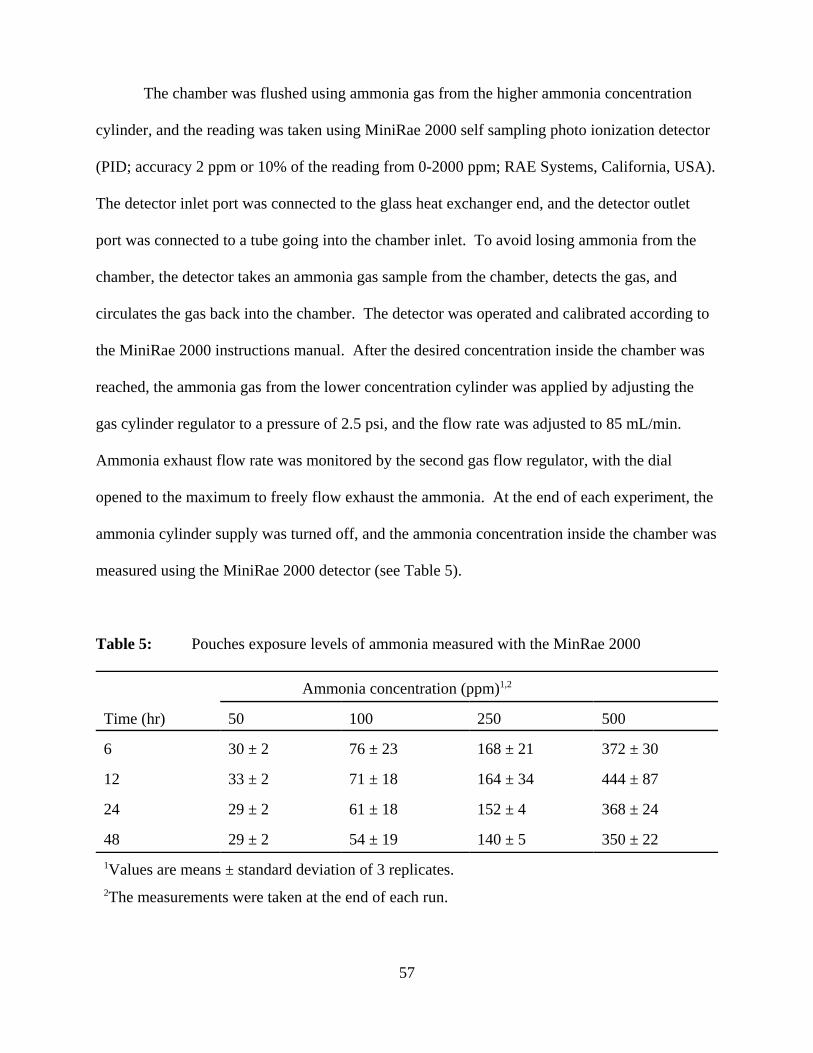
57
The chamber was flushed using ammonia gas from the higher ammonia concentration
cylinder, and the reading was taken using MiniRae 2000 self sampling photo ionization detector
(PID; accuracy 2 ppm or 10% of the reading from 0-2000 ppm; RAE Systems, California, USA).
The detector inlet port was connected to the glass heat exchanger end, and the detector outlet
port was connected to a tube going into the chamber inlet. To avoid losing ammonia from the
chamber, the detector takes an ammonia gas sample from the chamber, detects the gas, and
circulates the gas back into the chamber. The detector was operated and calibrated according to
the MiniRae 2000 instructions manual. After the desired concentration inside the chamber was
reached, the ammonia gas from the lower concentration cylinder was applied by adjusting the
gas cylinder regulator to a pressure of 2.5 psi, and the flow rate was adjusted to 85 mL/min.
Ammonia exhaust flow rate was monitored by the second gas flow regulator, with the dial
opened to the maximum to freely flow exhaust the ammonia. At the end of each experiment, the
ammonia cylinder supply was turned off, and the ammonia concentration inside the chamber was
measured using the MiniRae 2000 detector (see Table 5).
Table 5: Pouches exposure levels of ammonia measured with the MinRae 2000
Ammonia concentration (ppm)1,2
Time (hr) 50 100 250 500
6 30 ± 2 76 ± 23 168 ± 21 372 ± 30
12 33 ± 2 71 ± 18 164 ± 34 444 ± 87
24 29 ± 2 61 ± 18 152 ± 4 368 ± 24
48 29 ± 2 54 ± 19 140 ± 5 350 ± 221Values are means ± standard deviation of 3 replicates. 2The measurements were taken at the end of each run.

58
Indophenol Assay Ammonia Measurement
Sodium hypochlorite solution (10-15% available chlorine) and sodium nitroferricyanide
(III) dihydrate were purchased from Sigma Chemical Co. (St. Louis, Missouri, USA.). Phenol,
sodium hydroxide, sodium phosphate dibasic dodecahydrate, and a GenesysTm 10 visible
spectrophotometer were purchased from Fisher Scientific Co. (Pittsburgh, Pennsylvania, USA).
The reagents were prepared and stored according to Broderick and Kang (1980).
Ammonia in the water pouches exposed at freezing temperatures was determined by
defrosting the pouches overnight at 4-8 EC in a refrigerator and transferring 200 µL of the water
to a glass test tube. The water was mixed with 2.5 mL phenol reagent and 2 mL hypochlorite
reagent. The test tube was placed in a 95 EC water bath for 5 min and allowed to stand at room
temperature until ~25 EC. To construct the standard curve, solutions of 0.05, 0.1, 0.25, 0.5, 0.75,
1.0, 2.5, 5.0, 7.5, and 10 ppm ammonia as nitrogen (N) were prepared from the commercial
standard 1000 ppm ammonium chloride (Thermo Electron Corporation, Miami, Florida, USA).
The blank was prepared using 200 µL of distilled water. Finally, the 630 nm spectrum was used
to scan the samples and the standards using a GenesysTm 10 visible spectrophotometer. To
measure the ammonia levels in water pouches at room temperature, 200 µL of the water was
transferred directly to a glass test tube and the procedure continued from there.
pH Determination
Water pH was measured directly by inserting the pH meter probe in the pouches (Denver
Instruments UP-5 pH meter, single electrode, Denver Instrument, Denver, Colorado, USA). pH
of each sample was measured twice after temperature stabilized between 20-25 EC. Frozen
samples were defrosted at room temperature before pH was determined.

59
Statistical analysis
The statistical analysis system (Version 9.1, SAS Institute, Inc., Cary, N.Y., USA; 2002)
was used for data analysis. The experiment design was a three way analysis of variance 4×4×3
for ammonia levels and 4×4×3 and the control time (0 hr) for pH values using PROC
GLM/TUKEY to determine significant differences among the treatment means at P < 0.05.
RESULTS AND DISCUSSION
pH
No significant change in the pouches water pH was observed when the pouches exposed
to ammonia gas at freezing temperature (-17 ± 3 EC). In the experiment conducted at room
temperature (21 ± 3 EC), the overall model (time and concentration) showed significant
increases in pH (P < 0.05) for all packaging types as exposure time increased and as ammonia
concentration increased (Table 6, 7, and 9). Figure 15 shows the pH levels for E-2300, LDPE,
and V-PA/PE at 500 ppm ammonia exposure and 6, 12, 24, and 48 hr of exposure time. Post hoc
analysis showed that the main effect of exposure time and concentration was significant (P <
0.05). Although, time and concentration showed significant interaction (P < 0.05). There was
no significant interaction between bag type and ammonia concentration (P < 0.0523). That lack
of significant interaction indicates that pH increased independently of increasing the ammonia
concentrations and the bag type. In addition, there was no significant interaction between bag
type, ammonia concentration, and time (P < 0.9997). However, the interaction between time and
bag type was significant (P < 0.05). The maximum differences values in the pH from the control
mean were 2.71 ± 0.8 for the E-2300, 2.45 ± 0.97 for LDPE, and 1.30 ± 1.04 for V-PA/PE when
the pouches were exposed to 500 ppm for 48 hr.
Generally, the alkalinity of ammonia increases water pH because ammonium hydroxide

60
forms. Ammonium hydroxide is a weak base that is partly ionized in water to form ammonium
(NH4+) and hydroxyl (OH-) ions (the alkalinity property for the aqueous solution of ammonia
relates to hydroxide ions) according to the equilibrium:
NH3 + H2O » [NH4OH] » NH4+ + OH-
Table 6 lists the Cryovac E-2300 pH values. The water in E-2300 exhibited the
maximum pH level. Statistical analysis showed significant increases in pH (P < 0.05) as
exposure time increased and as ammonia concentration increased. However, the interaction
between exposure time and ammonia concentration showed no significant relationship (P <
0.0893).
Figure 15: Water pH levels for Cryovac E-2300, LDPE, and vacuum (V-PA/PE) bags at 500
ppm exposure for 6, 12, 24, and 48 hr at room temperature
The LDPE showed pH profile similar to Cryovac E-2300 (Table 7). The statistical
5.05.56.06.57.07.58.08.59.0
6 12 24 48Time (hr)
pH
E-2300LDPEV- PA/PE

61
analysis for pH related to exposure time and ammonia exposure concentration showed
significant results (P < 0.05), whereas no significant interaction was found between them (P <
0.4591). V-PA/PE showed significant results (P < 0.05) in the overall model as exposure time
and ammonia concentration increased. Post hoc analysis showed no significant interaction
between the time and the ammonia concentration (P < 0.9764). V-PA/PE was less permeable to
ammonia (Table 8).
Table 6: Cryovac E-2300 bag’s water pH levels at 50, 100, 250, and 500 ppm for 6, 12, 24,
and 48hr exposure at room temperature
Ammonia concentration (ppm)1
Time (hr) 50 100 250 500
Control (0) 5.52 ± 0.02aC 5.52 ± 0.11aD 5.77 ± 0.26aC 5.93 ± 0.48aC
6 5.99 ± 0.01bBC 6.04 ± 0.20bCD 6.32 ± 0.06abBC 6.97 ± 0.48aBC
12 6.17 ± 0.05cBC 6.35 ± 0.02bcBC 6.64 ± 0.11bBC 7.19 ± 0.25aBC
24 6.40 ± 0.07bAB 6.63 ± 0.06bB 7.26 ± 0.42abAB 7.85 ± 0.70aAB
48 7.12 ± 0.66aA 7.43 ± 0.41aA 8.40 ± 0.85aA 8.64 ± 0.60aA
1Values are means ± standard deviation of 3 replicates.
a-cMeans with different superscript letters within the row are significant different at P < 0.05.
A-DMeans with different superscript letters within the column are significant different at P < 0.05.
This increasing pH over time (P < 0.05) may be attributed to the effect of V-PA/PE
materials on pH (see Table 9). Test where conducted to determine the effect of the pouches on
pH, and water in the V-PA/PE was elevated by 0.2 pH unit; no significant effects were found in
E-2300 or LDPE.

62
Table 7: Low density polyethylene bag’s water pH levels at 50, 100, 250, and 500 ppm for
6, 12, 24, and 48 hr exposure at room temperature
Ammonia concentration (ppm)1
Time (hr) 50 100 250 500
Control (0) 5.52 ± 0.02aC 5.52 ± 0.11aD 5.77 ± 0.26aC 5.93 ± 0.48aB
6 5.93 ± 0.04bBC 5.99 ± 0.12bC 6.15 ± 0.30bBC 6.99 ± 0.50aAB
12 6.17 ± 0.03cBC 6.28 ± 0.05cBC 6.66 ± 0.04bBC 7.22 ± 0.24aAB
24 6.42 ± 0.03bAB 6.62 ± 0.07bB 7.11 ± 0.26abAB 7.85 ± 0.62aA
48 7.09 ± 0.58aA 7.30 ± 0.32aA 8.24 ± 0.87aA 8.39 ± 0.75aA
1Values are means ± standard deviation of 3 replicates.
a-cMeans with different superscript letters within the row are significant different at P < 0.05.
A-DMeans with different superscript letters within the column are significant different at P < 0.05.
Table 8: Vacuum bag’s water ammonia levels at 50, 100, 250, and 500 ppm for 6, 12, 24,
and 48hr exposure at room temperature
Ammonia concentration (ppm)1,2
Time (hr)3 50 100 250 500
6 NDa NDa NDa NDa
12 NDa NDa NDa 0.23 ± 0.07abc
24 NDa NDa 0.14 ± 0.13ac 0.47 ± 0.15b
48 NDa NDa 0.34 ± 0.18bc 0.89 ± 0.20d
1Values are means ± standard deviation of 3 replicates.
2Means with different superscript letters are significant different at P < 0.05.
3At time 0 (control), ammonia level was 0.00 ppm for all concentrations.

63
Table 9: Vacuum bag’s water pH levels at 50, 100, 250, and 500 ppm for 6, 12, 24, and
48hr exposure at room temperature
Ammonia concentration (ppm)1
Time (hr) 50 100 250 500
Control (0) 5.52 ± 0.02aC 5.52 ± 0.11aD 5.77 ± 0.26aC 5.93 ± 0.48aB
6 5.84 ± 0.12bBC 5.76 ± 0.09bC 5.94 ± 0.07bBC 6.20 ± 0.62aAB
12 5.92 ± 0.06cBC 5.92 ± 0.13cBC 6.15 ± 0.04bBC 6.33 ± 0.54aAB
24 6.04 ± 0.09bAB 6.22 ± 0.22bB 6.28 ± 0.21abAB 6.65 ± 0.74aA
48 6.24 ± 0.09aA 6.32 ± 0.17aA 6.96 ± 0.47aA 7.23 ± 1.27aA
1Values are means ± standard deviation of 3 replicates.
a-cMeans with different superscript letters within the row are significant different at P < 0.05.
A-DMeans with different superscript letters within the column are significant different at P < 0.05.
Ammonia levels
Non significant change in the pouches water ammonia concentration was observed when
the pouches exposed to ammonia at freezing temperature (-17 ± 3 EC). The overall model
showed significant increases in ammonia levels in all pouches water (P < 0.05) as exposure time
and ammonia concentration increased at 21 ± 3 EC. Post hoc analysis showed that the main effect
of exposure time and concentration were statically significant (P < 0.05). Exposure time and
concentration showed significant interaction (P < 0.05), as did exposure time and bag type (P <
0.05),concentration and bag type (P < 0.05), and exposure time and bag type and concentration (P
< 0.05). Two methods for determining ammonia levels less than 10 ppm in the pouches: the ion
selective electrode (ISE) and the indophenol method were evaluated. Hijaz et al. (2007)
concluded that the ion selective electrode (ISE) and the indophenol methods are precise enough to

64
detect ammonia concentrations in meat. The ISE method was unstable and time consuming it if
used to measure low levels of ammonia. Although, the indophenol method offers many
advantages: 1) high sensitivity (up to 0.03 ppm), 2) smaller sample size, 3) easily prepared
reagent, and 4) short measuring time. Therefore, we concluded that the indophenol method was
more suitable for our research needs. The research does show that the indophenol method gives
more precise results when used to measure low levels of ammonia in ruminal fluid (Broderick and
Kang 1980). The ammonia levels in water increased significantly (P < 0.05) with increasing
exposure time (6, 12, 24, and 48 hr) and ammonia concentration (50, 100, 250, and 500 ppm).
Figure 16 shows the average ammonia values from the control (0 ppm) for the exposed pouches
at 500 ppm ammonia exposure for 48 hr. The maximum ammonia absorptions as they differed
from the control were 77.7 ± 0.67 for E-2300, 5.94 ± 0.16 for LDPE, and 0.89 ± 0.20 for V-
PA/PE. Table 10 shows the ammonia content of the exposed Cryovac E-2300, Table 11 shows
LDPE, and Table 8 shows V-PA/PE. Ammonia levels increased significantly (P < 0.05) with
increasing ammonia concentrations and exposure times. In addition, the interaction between
exposure time and ammonia levels was significant (P < 0.05) for all types of packaging materials.
Figure 16: Water ammonia level means for Cryovac E-2300, LDPE, and vacuum (V-PA/PE)
bags at 500 ppm for 6, 12, 24, and 48hr exposure at room temperature
0.0
2.0
4.0
6.0
8.0
6 12 24 48
Time (hr)
Am
mon
ia (p
pm)
E-2300LDPEV-PA/PE

65
Table 10: Cryovac E-2300 bag’s water ammonia levels at 50, 100, 250, and 500 ppm for 6,
12, 24, and 48hr exposure at room temperature
Ammonia concentration (ppm)1,2
Time (hr)3 50 100 250 500
6 NDa NDa 0.41 ± 0.15ab 0.80 ± 0.24bc
12 NDa 0.45 ± 0.06ab 0.93 ± 0.17bc 1.78 ± 0.18d
24 0.37 ± 0.01ab 0.87 ± 0.05bc 1.95 ± 0.48d 4.20 ± 0.44e
48 0.73 ± 0.05ab 1.46 ± 0.06cd 3.98 ± 0.66e 7.77 ± 0.67f
1Values are means ± standard deviation of 3 replicates.
2Mean with different superscript letters significantly different at P < 0.05.
3At time 0 (control), ammonia level was 0.00 ppm for all concentrations.
Table 11: Ammonia levels in low density polyethylene bag’s water at 50, 100, 250, and 500
ppm for 6, 12, 24, and 48hr exposure at room temperature
Ammonia concentration (ppm)1,2
Time (hr)3 50 100 250 500
6 NDa NDa 0.27 ± 0.24ab 0.67 ± 0.26bc
12 NDa 0.38 ± 0.04ab 0.73 ± 0.21bc 1.62 ± 0.30d
24 0.31 ± 0.03ab 0.70 ± 0.04bc 1.45 ± 0.31d 3.27 ± 0.12e
48 0.58 ± 0.03ab 1.19 ± 0.04cd 2.80 ± 0.49e 5.94 ± 0.16f
1Values are means ± standard deviation of 3 replicates.
2Mean with different superscript letters significantly different at P < 0.05.
3At time 0 (control), ammonia level was 0.00 ppm for all concentrations.

66
Table 12 shows the vendors reported transmission rates of water vapor and oxygen for
Cryovac E-2300, LDPE, and V-PA/PE used in this research. Cryovac E-2300 is more permeable
to oxygen (5000 cc/m2/24hr/atm) and water vapor (9.3 g/m2/24hr/atm) than LDPE and V-PA/PE.
It is more permeable to ammonia than LDPE and V-PA/PE. However, we tested the E-2300
under normal conditions without exposing it to a vacuum or to heat , unlike the process described
by Teixeira et al. (1986) that required vacuum sealing vacuum packaging machine and inserting
of vacuum pack in a hot water (88.7 EC) to shrink.
LDPE had a slightly different permeability profile than E-2300. Oxygen (3743
cc/m2/24hr/atm) and water vapor (8.3g/m2/24hr/atm) transmission rates were slightly lower than
the E-2300. Although E-2300 film is thicker (3 mil) than LDPE (2.2 mil), E-2300 was more
permeable to ammonia. The V-PA/PE was the least permeable to ammonia given its oxygen (60-
70 cc/m2/24hr/atm) and water vapor (6.3 cc/m2/24hr/atm) transmission rates. This low
permeability to ammonia could be due to the film’s two layers properties especially the
polyamide one in the V-PA/PE, which is a good barrier to gases and aromatics (Mauer and Ozen
2004). When the pouches were exposed to ammonia gas at freezing temperatures (-17 ± 3 EC),
no changes in water ammonia levels or pH values were observed, possibly because of the testing
temperature. All pouches were permeable to ammonia at room temperature (21 ± 3 EC). The
permeant temperature and pressure make food packaging more permeable to gases and vapors
(Jasse et al. 1994). We applied ammonia gas at a specified flow rate, so we should see no change
in the permeability transmission rate because of pressure.
Although ammonia has a high affinity to water, dissolving readily in water or any product
containing water, the saturation point for ammonia remained unknown in this experiment because
the reaction between ammonia and water in the pouches was continuous until the saturation point
was reached.
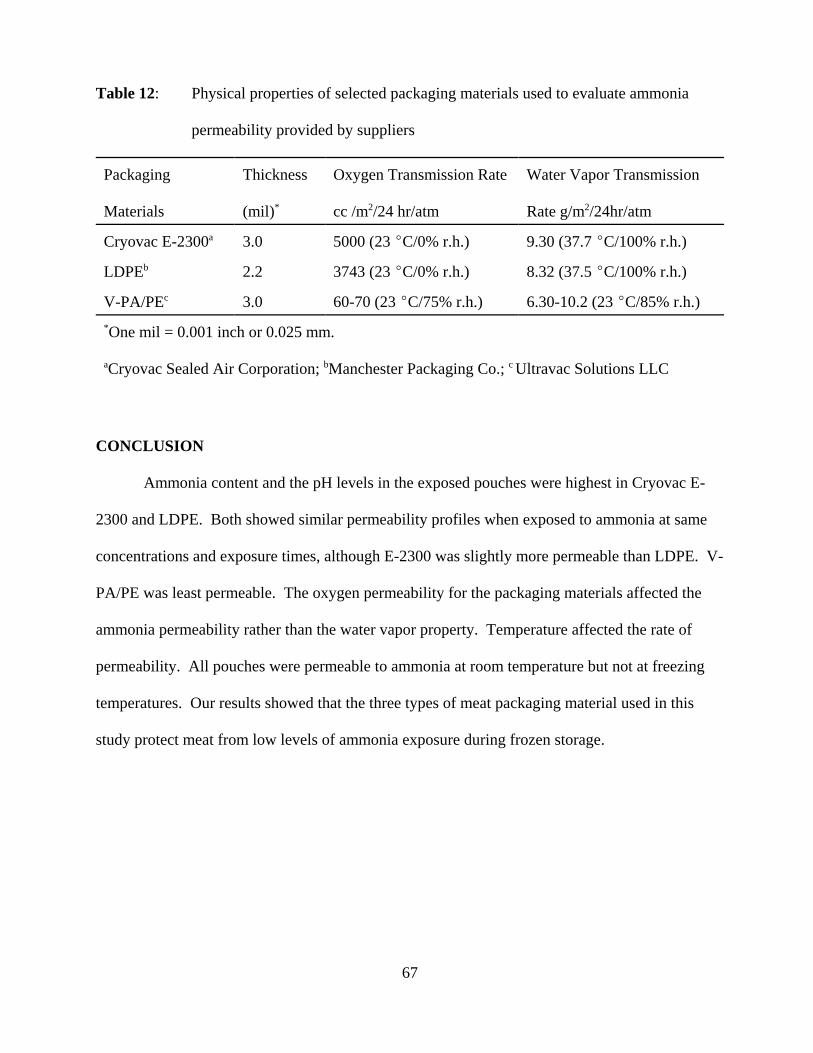
67
Table 12: Physical properties of selected packaging materials used to evaluate ammonia
permeability provided by suppliers
Packaging
Materials
Thickness
(mil)*
Oxygen Transmission Rate
cc /m2/24 hr/atm
Water Vapor Transmission
Rate g/m2/24hr/atm
Cryovac E-2300a 3.0 5000 (23 EC/0% r.h.) 9.30 (37.7 EC/100% r.h.)
LDPEb 2.2 3743 (23 EC/0% r.h.) 8.32 (37.5 EC/100% r.h.)
V-PA/PEc 3.0 60-70 (23 EC/75% r.h.) 6.30-10.2 (23 EC/85% r.h.)*One mil = 0.001 inch or 0.025 mm.
aCryovac Sealed Air Corporation; bManchester Packaging Co.; c Ultravac Solutions LLC
CONCLUSION
Ammonia content and the pH levels in the exposed pouches were highest in Cryovac E-
2300 and LDPE. Both showed similar permeability profiles when exposed to ammonia at same
concentrations and exposure times, although E-2300 was slightly more permeable than LDPE. V-
PA/PE was least permeable. The oxygen permeability for the packaging materials affected the
ammonia permeability rather than the water vapor property. Temperature affected the rate of
permeability. All pouches were permeable to ammonia at room temperature but not at freezing
temperatures. Our results showed that the three types of meat packaging material used in this
study protect meat from low levels of ammonia exposure during frozen storage.

68
FUTURE STUDIES
Although the three types of packaging materials tested here protected meat from ammonia
contamination, the reaction between those materials and ammonia has not yet been clarified and
more investigation is needed. In addition, more researches are needed to investigate the safety of
chemical compounds that result from the reaction between ammonia and the packaging materials.
Moreover, the literature provides little information about ammonia contamination at high
concentrations (6,000 ppm to10,000 ppm) for less than 8 hr under freezing conditions (-18 EC)
that occur when ammonia leak happen during the time needed to relocate the contaminated
product to an contaminated area. Because ammonia leaks often occur in frozen/refrigerated
warehouses, information regarding the level of protection that the packaging materials can
provide at 4 EC is essential and should be researched.

69
REFERENCES
Arnold M. 1993. The big chill ammonia finds its niche as a refrigerant. Food Processing
54(12):45,47.
Ashley RJ. 1985. Permeability and plastic packaging. In: Comyn J , editor. Polymer
permeability. London: Elsevier. p269-308.
Broderick GA, Kang J H. 1980. Automated simultaneous determination of ammonia and total
amino acids in ruminal fluid and in vitro media. J Dairy Sci 63(1):64-75.
Crank J. 1975. The mathematics of diffusion, 2nd ed. London: Oxford University Press.
Denny CB. 1989. Industry action to ensure plastic package integrity. Food Technol 43(12):88.
Harper CL, Blakistone BA, Litchfield JB, Morris SA. 1995. Development in food packaging
integrity testing. Trends Food Sci Technol 6(10):336-340.
Hijaz F, Smith JS, Kastner CL. 2007. Evaluation of various ammonia assays for testing of
contaminated muscle food products. J Food Sci 72(5):253-57.
Holmstrom P. 1994. Ammonia versus freons as a refrigerant in the dairy industry. Scand Dairy
Info 8(3):46-47.
IIAR. 2006. Ammonia: the natural refrigeration of choice. International Institute of ammonia
refrigeration. An IIAR green paper. p5. https://www.iiar.org/aar/aar_greenpaper.pdf
(Accessed May 2009)
Jasse B, Seuvre AM, Mathlouthi M. 1994. Permeability and structure in polymeric packaging
materials. In: Mathlouthi M. editor. Food Packaging and Preservation. Glasgow, London:
Chapman and Hall. p1-20.
Lorentzen G. 1988. Ammonia: an excellent alternative. Int. J Refrig 11:248-252.
Mannheim CH and Miltz J. 1987. Interaction between laminated and citrus products.
International Federation of Fruit Juice Producers, Symposium XIX, Den Haag P. p137.
Mauer LJ and Ozen BF. 2004. Food packaging. In: Smith JS and Hui YH, editors. Food
processing principles and applications. Iowa: Blachwell Publishing. p121.
Ostner WA. 1986. The ammonia spill: before-during-after. In: Vastine WJ, editor. Crisis
Management Manual. Bethesda, Maryland: International Association of Refrigerated
Warehouse. Section 2. p18-27.
Pascat B. 1986. Study of some factors affecting permeability. In: Mothlouthi M, editor. Food
Packaging and Preservation. London: Elsevier Applied Science. p7-24.

70
Robertson GL. 1993. Food Packaging. New York: Marcel Dekker.
Ross W. 1995. CFC-free refrigeration plant for slaughterhouses. Fleischwirtschaft Int (1):10, 12.
Ross W. 1994. Ammonia refrigerant plants at poultry abattoir. Food Market Technol 8(1):23-24
Sperling LH. 1992. Introduction to physical polymer science. New York: Wiley.
Sun DAW. 1998. The aqua-ammonia absorption system: An alternative option for food
refrigeration. J Food Proces Preserv 22(5):371-386.
Teixeira AA, Dolande JJ, Otwell WS. 1986. Quality improvement and process feasability of
quick-frozen vacuum-packed tuna steaks. Florida Sea Grant College. Technical Paper
No.39.

71
PART III. FROZEN BEEF CONTAMINATION AFTER EXPOSURE TO LOW LEVELS
OF AMMONIA GAS*
ABSTRACT
Regulations and publications about food contaminated during ammonia refrigerant leaks
provide limited information, which means that products are often held for an indeterminate period
or condemned. Moreover, the scientific literature and regulatory agencies offer little guidance on
disposing of products exposed to low levels of ammonia refrigerant gas. In this study, we
evaluated meat contaminated with low levels of ammonia under frozen storage conditions. Fresh
beef Semitendinosus muscles were trimmed of external fat and fabricated to 10H x 5W x 2.3D cm
steaks. The steaks were exposed to 50, 100, 250, and 500 ppm ammonia gas (85 mL/min) in a
plexiglass enclosure contained in a 1.3 CUF freezer, for 6, 12, 24, and 48 hr at -17 ± 3 EC. The
ammonia in the contaminated meat was analyzed using the indophenol method, and the meat pH
was measured according to the AOAC Int. # 981.12 method. Both ammonia levels and pH values
increased significantly (P < 0.05) in the exposed meat with increasing exposure times and
ammonia concentrations. The ammonia levels were 34.2, 51.5, 81.1, and 116 ppm, and the pH
values ranged from 5.56 to 5.75 (control range 5.31-5.43) when the meat was exposed to 50, 100,
250, 500 ppm at 48hr. However, to declare meat contaminated with ammonia, its ammonia
content should be more than 1000 ppm and its pH should be more than 1.0 unit than the
background. Our results showed that meat content is low even with ammonia exposures as high
as 500 ppm at freezing temperatures.
________________________________________
*Presented in part at IFT Annual Meeting, June 7 2009, # 060-12 (http://www.am-fe.ift.org/cms)

72
INTRODUCTION
Food safety and quality are objectives for food science, food industry, regulatory agencies,
consumer and public health organizations. Research is intended to establish and clarify issues
that would benefit the food industry, regulators, and members of the food industry to make an a
accurate decisions. Establishing critical control points and discovering corrective actions in a
hazard analysis and critical control program (HACCP) may be used in insurance/customer claims
involving food contamination (Al-Sahal 2003).
Food refrigeration is one of the oldest methods to preserve and keep food safe. Currently,
the food industry uses refrigeration with ammonia to cool fruits, vegetables, poultry, fish,
beverages, dairy products, milk, and meat (Lorentzen 1988). Meat production and processing
requires large areas for fabrication, handling, and storage. Most fabrication facilities,
slaughterhouses, and cold storage warehouses use ammonia as their refrigerant (Ross 1995; Sun
1998). With typical equipment failures and operator error, ammonia leaks will occur in
refrigerated/frozen food storage facilities. Carelessness may be the problem, but more often
equipment failures are the issue (Ostner 1986). Because published information and data on
assessing meat contamination with ammonia are limited, especially after low levels of ammonia
exposure, what to do in cases of meat contamination with low level of ammonia exposure remains
uncertain and complex (Goodfellow et al.1978).
Several factors affect the degree of ammonia contamination in meat, including ammonia
concentration, exposure time, temperature, humidity, type of meat, type of cut, condition of the
meat surface, and the distance of the meat from the ammonia leakage point (Tuengerthal 1979).
Frozen or refrigerated meat contaminated by ammonia is unsuitable for human use and can
poison the consumer (Dworkin et al. 2004).

73
Two food borne illness outbreaks caused by ammonia were reported in the United States.
The first outbreak was reported in two elementary school children in Wisconsin in 1985 within
one hour of drinking contaminated milk (CDC 1986). The second outbreak occurred in several
dozen school children in Illinois in 2002 within one hour of eating contaminated chicken tenders
(Dworkin et al. 2004). Symptoms among children in both incidents included stomachache,
headache, nausea, vomiting, diarrhea, and mouth burning. However, meat contaminated by low
levels of ammonia (less than 1000 ppm) with no change in pH, taste, or smell is safe for human
consumption (Goodfellow et al.1978). No direct regulations specify how much ammonia is
allowed in food products. Most forms of ammonia, such as bicarbonate, chloride, sulfate,
alginate, citrate, phosphate, and ammonium hydroxide are generally recognized as safe (GRAS)
when used under good manufacturing practice (GMP). Ammonium hydroxide is listed as GRAS
for leavening, pH control, surface-finishing agent, and as a boiler water additive (21 CFR 2003).
According to the Food Safety Inspection Services (FSIS) Directives # 7120.1, anhydrous
ammonia is approved for use as an antimicrobial agent in lean finely textured beef according to
GMP (USDA-FSIS 2009). In fact, Beef Product Inc. (BPI) treats meat trim with anhydrous
ammonia to enhance the pH to eliminate pathogenic microorganisms like E. coli O157:H7,
Salmonella, and Listeria Monocytogenes (Niebuhr and Dickson 2003).
High concentrations of ammonia affect many quality properties of meat: darkened color
(Curda and Hruby 1987; Bonne et al. 1993); increased pH (Anil 1971; Ireland 1988); increased
water holding capacity (Anil 1971; Al-Sahal 1995); persistent pink color after cooking (Smolskiy
et al. 1985; Shaw et al. 1992); and meat flavor (Guerrero and Arnau 1995; Ireland 1998). Ting
and Henrickson (1986) studied the effect of ammonia on meat tenderness, flavor, taste, water
holding capacity, and pH.

74
pH is not a reliable indicator of the amount of the ammonia absorbed because of the
different buffering capacities of different foods (Kassem 1965). Hagyard et al. (1993) exposed
lamb loins to 2 M ammonium hydroxide for 16 or 32 min and concluded that pH cannot be used
as an indicator of ammonia contamination because 0.5 or 1.0 pH unit is within the normal pH
range in lamb. Moreover, ammonia odor in contaminated meat is not a good indicator of the
ammonia concentration in contaminated meat because ammonia reacts with water and ice to form
ammonium ions, which do not have an odor (Dworkin et al. 2004).
Research has established the effects of high levels of ammonia concentrations on meat
quality (Al-Sahal 2003), but for levels of ammonia concentrations below 500 ppm, no research
was conducted and little information exists. Our research objectives were to measure the
absorbency levels and changes in the pH in meat exposed to low levels of ammonia for different
times under freezing conditions ranging from -17 ± 3 EC.
MATERIALS AND METHODS
Experimental Design
Fresh beef Semitendinosus muscle was randomly assigned to a various ammonia
concentrations at different exposure times at -17 ± 3 EC. The average ammonia concentrations
used were 0 (control), 50, 100, 250, and 500 ppm with exposure times of 0 (control), 6, 12, 24,
and 48 hr. This procedure was replicated three times in a plexiglass box inside a freezer 1.3 CUF.
The sequenced diagram below (Figure 17) shows the steps of the experiment.

75
Sample Preparation
Beef Semitendinosus muscle meat was obtained from a supermarket, the samples ranged
from 2-3 wk postmortem Semitendinosus muscles (USDA choice) were trimmed of external fat
and sliced into steaks (2.3 cm; Cabela’s meat slicer, Sidney, Nebraska, USA).
Beef Semitendinosus fabricated steak (10H x 5W x 2.3D cm)
„Freeze for 4-6 hr in a freezer (-18 EC)
„Inserted four steaks into exposure chamber into a freezer 1.3 CFT (-17 ± 3 EC)
„Applied flow rate of 85 mL/min of ammonia gas with concentrations of 50, 100, 250, and 500
ppm
„Withdrew one steak each at 6, 12, 24, and 48 hr
„
Thawed overnight at 4-8 EC in a refrigerator
„Measured pH value and ammonia level for each sample
Figure 17: A general flow chart for processing and exposure of the steaks to ammonia
The steaks were trimmed with a knife to dimensions of 10 cm × 5 cm (Figure 18). The
steaks were placed in a freezer for 4-6 hr inside an air tight 1.7 L plastic container (Lock and
Lock, Heritage Mint, Ltd. Scottsdale, Arizona, USA) until frozen. The meat samples were
weighed after preparation two times, once when they were fresh and later after removing the ice
layer from the top of the frozen samples. All samples were assigned randomly to a treatment with

76
four samples in each treatment replicate. At the end of each experiment, one meat sample was
withdrawn at 6, 12, 24, and 48 hr of exposure to ammonia, the iced layer removed from the
sample because the ammonia gas is approximable three times more soluble in ice than water at -
30 EC (CSIRO 2002).
Figure 18: Beef Semitendinosus muscle trimmed of external fat and fabricated to dimensions
of 10 × 5 × 2.3 cm
Exposure Chamber
A clear plexiglass box measuring 38W × 13.5D × 36H cm (18.5 L) was constructed as a
treatment chamber. The chamber was tested for leaks and proper seal by inserting a ToxiRae
PGM-30 Photo-Ionization Detector (PID) (RAE Systems, California, USA) into the chamber and
locking the chamber. The detector was calibrated and operated according to the ToxiRae PGM-
30 instruction manual. The ToxiRae PGM-30, which is portable, rechargeable, and small with a
screen that displays readings, can detect ammonia levels during a specified time period and store
the data. A concentration of 50 ppm of ammonia gas was introduced into the chamber from a
calibrated 50 ppm (± 2%) ammonia gas cylinder. After a concentration of 50 ppm was reached,

77
the ammonia gas supply was stopped, and the chamber was locked. After 7 hr, the detector was
pulled out of the chamber, and the readings were recorded. Another simple test checked the seal
on the chamber: it was pressurized with air, locked, and immersed in a water bath. This ensured
that the chamber sealed perfectly, with no observed bubbles.
The meat samples were inserted into the chamber through a round front door (15 cm in
dia) and were attached to stainless steel hooks (Figure 19), suspended on two plexiglass bars
attached horizontally between the left and the right sides of the box. On the back side of the
chamber, two L-shape threaded fittings were mounted to serve as gas inlet and outlet, one on the
upper right part and the other on the lower left part; in these positions, the ammonia gas could be
homogeneously distributed throughout the chamber to ensure each sample had the same exposure
rate.
Figure 19: Meat samples attached to stainless steel hooks and suspended on two plexiglass
bars inside the freezer
78
Exposure System Design
The system (Figure 11) was used in this experiment to test meat packaging. The ammonia
cylinder was connected to a 0-65 mm gas flow regulator inlet, and the gas regulator outlet was
fitted to a T-shaped plastic connector. The exposure chamber and the detector were attached to
the connector. The chamber outlet was assembled with a T-shaped tube connector hocked to a
one-way plastic valve to prevent the ambient air from entering into the chamber and diluting the
ammonia concentration, especially under freezing conditions. The valve also serves as pressure
release device to prevent breakage in the chamber if pressure levels became too high during
flushing. A second gas flow regulator connected to the other end of the one-way valve to monitor
the ammonia exhaust flow rate.
The other end of the T-shaped connector was attached to a glass heat exchanger in order
warm the ammonia gas before it reaches the detector, especially in the experiments which was
performed under freezing temperatures. Combining together the system parts were assembled
using plastic tubing.
Operation Procedure
The ammonia gas cylinders with concentrations of 50, 100, 250, 500, and 1000 ppm (
calibrated concentrations were 48.8, 90.0, 238.7, 474.0, and 992 ppm; ± 2% in air) were used in
the experiment. Two ammonia gas cylinders were used in each treatment. The 1000 ppm
ammonia cylinder was used to flush the chamber, while maintaining a continuous exposure of the
required ammonia concentration for the time needed using 50, 100, 250, and 500 ppm cylinders.
A stainless steel single stage regulator was mounted on the low concentration cylinder to control
the flow rate pressure of the ammonia gas into the gas flow regulator. The temperature inside the

79
chamber was monitored with a Smartbutton data logger. The chamber was flushed using
ammonia gas from the higher ammonia concentration cylinder, and a reading was taken using
MiniRae 2000 self sampling photo ionization detector. The detector inlet port was connected to
the glass heat exchanger end, and the detector outlet port was connected to a tube going into the
chamber inlet. To avoid losing ammonia from the chamber, the detector removed an ammonia
gas sample from the chamber, detects it, and circulates it back into the chamber. The detector
was operated and calibrated according to the MiniRae 2000 instructions manual. After the
desired concentration inside the chamber was reached, the ammonia gas from the lower
concentration cylinder was applied by adjusting the gas cylinder regulator to a pressure of 2.5 psi,
and the flow rate was adjusted by adjusting the gas flow regulator to 85 mL/min. Ammonia
exhaust flow rate was monitored by the second gas flow regulator, with the dial opened to the
maximum to give free flow to the ammonia exhaust. At the end of each experiment, the ammonia
flow was stopped, and the concentration inside the chamber was measured using the MiniRae
2000 detector (see Table 5).
Indophenol Ammonia Measurement
The ion selective electrode and the indophenol methods are precise enough to detect
ammonia concentrations in meat (Hijaz et al. 2007). The indophenol method offers many
advantages: high sensitivity (up to 0.03 ppm), small sample size (1.0 gram with recovery of 94 to
113%; Hijaz et al. 2007), and easily prepared reagent. Moreover, this method may be used with
different protein precipitation acids. Sodium hypochlorite solution (10-15% available chlorine),
sodium nitroferricyanide (III) dihydrate, and trichloroacetic acid were purchased from Sigma
Chemical Co. (St. Louis, Missouri, USA). Phenol, sodium hydroxide, sodium phosphate dibasic

80
dodecahydrate, and a GenesysTm 10 visible spectrophotometer were purchased from Fisher
Scientific Co. (Pittsburgh, Pennsylvania, USA). The reagents were prepared and stored according
to Broderick and Kang (1980). While still frozen and after removing the glazed ice layer from
the surface, the steak from each treatment was ground two times through a fine blade (0.4 cm)
using an electric grinder (Rival, Fontana, California, USA).
One gram of the ground eye of round beef (Semitendinosus) was transferred to a 15 mL
screw top disposable centrifuge tube to determine ammonia concentration using the indophenol
method. Trichloroacetic acid TCA (10 mL; 2%) was added to precipitate protein from the
sample, and the mixture was vortexed for 2 min and then allowed to stand for 10 min. The
mixture was centrifuged at 2500 rpm for 5 min and then filtered through No.4 Whatman filter
paper. The volume was adjusted to 14 mL by rinsing the filter paper with 2% TCA. Of the
filtrate, 200 µL was transferred to a glass test tube and mixed with 2.5 mL phenol reagent and 2
mL hypochlorite reagent. The test tube was placed in a 95 EC water bath for 5 min and allowed
to stand at room temperature to cool to 20- 25 EC. Finally, the ammonia levels were measured at
630 nm using GenesysTm 10 visible spectrophotometer. To construct the standard curve,
solutions of 1.0, 2.5, 5.0, 7.5, 10.0, 25.0, and 35.0 ppm ammonia as nitrogen (N) were prepared
from the commercial standard 1000 ppm ammonium chloride (Thermo Electron Corporation,
Beverly, Miami, USA); the blank was prepared using 200 µL of distilled water.
pH Determination
Two aliquots were used from each ground samples for pH analysis. The meat pH was
measured according to AOAC Int. (2002) method #981.12 using a Denver Instruments UP-5 pH
meter (single electrode, Denver Instrument, Denver, Colorado, USA). The meat samples were

81
measured in duplicate (Table 13). From each ground sample, 5 g were diluted with 45 mL of
distilled water and blended for 30 sec at medium speed using a Waring blender (Waring
Laboratory, Torrington, USA).
Statistical Analysis
SAS (Version 9.1, SAS Institute Inc., Cary, NY, USA, 2002) was used for the data
analysis. The experimental design was a two way complete factorial design (4 × 4) analysis and
the control time (0 hr) using PROC GLM/ TUKEY to determine significant differences among
treatments at P < 0.05.
Table 13: Meat pH levels at 50, 100, 250, and 500 ppm exposure for 6, 12, 24, and 48 hr at
-17 ± 3 EC
Ammonia concentration (ppm)1,2
Time (hr) 50 100 250 500
0 (control) 5.43 ± 0.00bc 5.40 ± 0.00ab 5.34 ± 0.00a 5.43 ± 0.00bc
6 5.51 ± 0.06cde 5.48 ± 0.01bcd 5.48 ± 0.09bc 5.55 ± 0.02def
12 5.53 ± 0.03cde 5.52 ± 0.01cde 5.50 ± 0.04bcd 5.58 ± 0.03def
24 5.54 ± 0.07def 5.54 ± 0.04def 5.52 ± 0.01cde 5.64 ± 0.03f
48 5.62 ± 0.08ef 5.57 ± 0.04def 5.60 ± 0.03def 5.75 ± 0.05g
1Values are means ± standard deviation of 3 replicates.
2Mean with different superscript letters significantly different at P < 0.05.

82
RESULTS AND DISCUSSION
Meat pH levels
Overall, pH increased significantly (P < 0.05) as exposure time and ammonia
concentration increased. Post hoc analysis showed that the main effect of time and concentration
were statically significant (P < 0.05) for both factors although there was significant interaction
between time and concentration (P < 0.0142). That significant interaction indicates that the pH
increased with increasing time and concentration. The difference values in the pH from the
control were 0.19, 0.17, 0.25, and 0.32 when the meat was exposed to 500 ppm at 6, 12, 24, and
48 hr. Generally, the alkalinity of ammonia increases the pH of meat (Anil 1971; Al-Sahal 2003).
Figure 20 shows average pH values as a different from the control for the exposed meat for all
treatments combinations. Al-Sahal (2003) had similar results after exposing meat to different
ammonia concentrations for different times. His results showed that to raise the pH by 1.0 pH
unit required 683 ppm of ammonia in the meat, which he achieved by exposing beef to 5000 ppm
for 20 min. Moreover, similar results occurred when Al-Sahal (1995) exposed beef to even
higher concentrations of ammonia.
Al-Sahal (1995) found 25,000 ppm exposure for 3 hr could increase the pH by 1.0 unit.
In our study, the maximum increase in the pH for the control was 0.32 pH unit after exposing the
meat to 500 ppm for 48 hr in freezing conditions. Moreover, Al-Sahal (2003) used a 0.9 cm thick
steak, while Al-Sahal (1995) used a 1.27 cm thick steak. In this study, the beef steak was 2.3 cm
thick. Differences in absorbed ammonia levels were likely due to the thickness of the meat,
which is what Al-Sahal (2003) also stated.
Smolskiy et al. (1985) concluded that the pH of ground beef increased by 1 pH unit or
more when exposed to 1000-1500 ppm (0.1 - 0.15%) ammonia. Other studies found that

83
treatment temperature had no effect on the pH of contaminated meat (Anil 1971; Herrmann and
Johnston 1966).
Other differences in results may be due to how meat was exposed. This study exposed
meat to ammonia continuously, whereas all previous studies exposed meat to ammonia using
fixed volumes of ammonia concentrations.
Figure 20: Meat pH mean levels as a different from control at 50, 100, 250, and 500 ppm
exposure and 6, 12, 24, and 48hr at -17 ± 3 EC
Meat Ammonia levels
The ammonia content of exposed meat is presented in Table 14. Ammonia levels of
samples increased significantly (P < 0.05) with increasing exposure time (6, 12, 24, 48 hr) and
ammonia concentration (50, 100, 250, and 500 ppm). Figure 21 shows average ammonia values
as a different from the control for exposed meat for all treatments combinations. The ammonia
absorptions, as they differed from the control, were 34.2, 51.4, 81.1, and 116.3 ppm when meat
was exposed to 50, 100, 250, and 500 ppm for 48 hr. The overall model showed significant
0.0
0.1
0.2
0.3
6 12 24 48Time (hr)
pH
500 ppm250 ppm100 ppm50 ppm

84
increases (P < 0.05) in ammonia levels for all samples as both exposure time and ammonia
concentration increased. Post hoc analysis showed that the main effect of time and concentration
are both statically significant (P < 0.05). There was a significant interaction between time and
concentration (P < 0.05), which indicates that ammonia level increases depended on different
exposure times and concentrations levels. The high affinity of the ammonia to water means that
ammonia is mainly absorbed by meat water (75%). In this research, the saturation point for
ammonia remained unknown because the reaction between ammonia and water in the meat was
continuous until the saturation point was reached.
Al-Sahal (2003) exposed meat in an enclosure to a fixed volume of ammonia gas with
different ammonia concentrations (500, 1000, 2500, and 5000 ppm) and different exposure times
(5, 10, and 20 min) at room temperature (20-25 EC). His results indicate that ammonia
concentrations increased 1-10 times in meat 0.9 cm thick. In our research, ammonia
concentration increased by 1-5 times when the meat was exposed to a flow rate of 85 mL/min for
continuous exposure at -17 ± 3 EC. The differences in the absorption levels between our results
and Al-Sahal’s (2003) report may be due to differences in exposure temperature, sample size, and
ammonia exposure concentrations and times.

85
Table 14: Meat ammonia levels exposed at 50, 100, 250, and 500 ppm for 6, 12, 24, and 48
hr at -17 ± 3 EC
Ammonia concentration (ppm)1,2,3
Time (hr) 50 100 250 500
0 (control) 51.5 ± 0.00a 97.8 ± 0.00cde 110 ± 0.00efgh 141 ± 0.00gh
6 57.1 ± 2.10ab 108 ± 4.64def 125 ± 3.21efgh 175 ± 10.9ij
12 68.5 ± 16.5abc 124 ± 10.7efgh 146 ± 8.71hi 191 ± 7.11j
24 74.9 ± 7.67abc 130 ± 7.61fgh 153 ± 10.9hi 199 ± 8.46j
48 85.8 ± 13.4bcd 149 ± 10.5hi 191 ± 12.2j 257 ± 24.6k
1Values are means ± standard deviation of 3 replicates.
2Meat protein was precipitated with 2% trichloroacetic acid.
3Mean with different superscript letters significantly different at P < 0.05.
Figure 21: Levels of meat ammonia as a different from control at 50, 100, 250, and 500
ppm exposure for 6, 12, 24, and 48hr at -17 ± 3 EC
0.020.040.060.080.0
100.0120.0
6 12 24 48Time (hr)
Am
mon
ia (p
pm) 500 ppm
250 ppm100 ppm50 ppm

86
CONCLUSION
The maximum increase of ammonia in exposed meat was 116.3 ppm. While pH raised
0.32 units when meat was exposed to 500 ppm ammonia for 48 hr. According to Goodfellow
(1978) recommendation to consider meat is contaminated with ammonia including: meat
ammonia content should be more than 1000 ppm (0.1%), its pH should be more than 1.0 unit than
the background, and its sensory panel score is less than 5.0 on a hedonic scale. Our research
result showed that, even with a concentration of 500 ppm of ammonia and 48 hr of exposure time
the meant ammonia content was less than 1000 ppm and the pH did not exceed by 1.0 unit than
the normal back ground. However, the reaction between meat water and the ammonia is
continuous until the saturation is reached, which remains unknown in this study. Furthermore,
pH is not a good indicator of the level of ammonia contamination in meat; sensory analysis would
be better to evaluate contaminated meat safety and acceptability.
FUTURE STUDIES
The literature provides little information about contamination with ammonia at high
concentrations (6,000 ppm to10,000 ppm) for less than 8 hr in frozen conditions (-18 EC). More
studies are also needed to investigate the effects of low ammonia contamination (< 500 ppm) on
meat quality and acceptability with exposure for 72 hr or more. Moreover, ammonia is often
added to meat to retain its color during storage or to prolong the shelf life by reducing microbial
count. Studies of food safety should evaluate levels of 4-methylimidazole due to its
carcinogenicity to human, which forms in the presence of heat, reducing sugar, and ammonia, in
marinated meat cooked on a grill. The literature provides little information regarding the
mechanism of how ammonia affects the meat color during storage or cooking. In addition, more

87
research in needed concerning ways that the meat industry can treat/recycle the contaminated
meat and make it safe and acceptable for human consumption. Ammonia is added to ground beef
and steaks to preserve the color and to prolong the shelf life and considered by FDA as GRAS.
However, there is no regulation about what levels of ammonia differentiate between contaminated
and non contaminated meat. Extensive research is needed to determine the threshold values for
contamination by ammonia in meat and meat products, such information would help the meat
industry and the regulatory to facilitate a decision when ever a contamination with ammonia
occurs. In addition, it would inform the costumer about the safety of a product if become
contaminated with ammonia.

88
REFERENCES
Al-Sahal AA. 2003. Safety and quality assessment of beef exposed to low levels of ammonia
[PhD thesis]. Manhattan, KS. Kansas State University. p169. Available from: Kansas
State University catalog: LD2668 .D5 ANSC 2003 A47.
Al-Sahal AA. 1995. The effect of ammonia concentration and exposure time on the quality of
muscle tissue. MS. Thesis, Oklahoma State University, Stillwater, Oklahoma.
Anil N. 1971. Effect of ammonia on water-holding capacity and tenderness of frozen beef
muscle. MS. Thesis, University of Tennessee, Knoxville.
AOAC International. 2002. Official methods #981.12. 17 ed, rev#1. pH of acidified foods.
Official methods of analysis, Gaithersburg, Maryland, USA.
Bonne R, Alteza C, Guerin D, Marestang L. 1993. Use of total volatile basic nitrogen as
measure of ammonia contamination of carcasses at the abattoir. Point-Veterinaire
24:150,749-750.
Broderick GA, Kang J H. 1980. Automated simultaneous determination of ammonia and total
amino acids in ruminal fluid and in vitro media. J Dairy Sci 63(1):64-75.
CDC. 1986. Epidemiological notes and reports ammonia contamination in a milk processing
plan--Wisconsin. Morbidity and Mortality Weekly Report 35(17):274-5.
CFR 21. 2003. Food and Drugs, Part 184-Direct Food Substances Affirmed as Generally
Recognized as Safe, Ammonia compounds, parts 184.1133-184.1148. http://www.
cfsan.fda.gov/~lrd/FCF184.html (Accessed May 2009).
CSIRO. 2002. Assessing meat quality after ammonia leaks. Australian Commonwealth
Scientific and Research Organization. http://www.meatupdaste.csiro.au/ammonia_leaks
.pdf. (Accessed May 2009).
Curda D, Hruby J. 1987. Quality of food contaminated by ammonia. Proceedings of 17th
International Congress of Refrigeration, Vienna C:364-368.
Dowrkin MS, Patel A, Fennell M, Vollmer M, Bailey S, Bloom J, Mudhar K, Lucht R. 2004. An
outbreak of ammonia poisoning from chicken tenders served in a school lunch. J Food
Protec 67(6):1299-1302.
Goodfellow SJ, Bordeaux FM, Masters BA, Brown WL, Johnston MR. 1978. Assuring quality
after ammonia leaks. Food Product Develop 12(9):32-35.
89
Guerrero L, Arnau J. 1995. Dry cured ham, chemical methods to control mites.
Fleischwirtschaft Int. 75(4):482-483.
Hagyard C, Cummings T, Martin A. 1993. Effect of ammonia exposure on subsequent rancid
flavor development in lamb. J Muscle Foods 4(3):245-251.
Herrmann EE Jr, Johnston MR. 1966. The effect of ammonia on frozen beef and pork
musculature. Proceedings of the Association of Southern Agriculture Workers Annual
Convention, North Carolina. 63:163.
Hijaz F, Smith JS, Kastner CL. 2007. Evaluation of various ammonia assays for testing of
contaminated muscle food products. J Food Sci 72 (5):253-57.
Ireland TL. 1988. Ammonia contamination of lamb. Proceedings of the Twenty-Fifth Meat
Industry Research Conference 855:60-61; New Zealand: Meat Industry Research of New
Zealand (MIRINZ).
Kassem AA. 1965. The effect of ammonia on frozen foods. MS. Thesis, University of
Tennessee, Knoxville.
Kassem AA, Johnston MR. 1995. The effect of ammonia on frozen foods. Proceedings of the
Association of Southern Agriculture Workers, Annual Convention 63:163. 8(1):23-24.
Lorentzen G. 1988. Ammonia: an excellent alternative. Int J Refrig 11:248-252.
Niebuhr SE, Dickson JS. 2003. Impact of pH enhancement on population of Salmonella, Listeria
monocytogenes, and Escherichia coli O157:H7 in boneless lean beef trimming. J Food
Protection 66(5):874-877.
Ostner WA. 1986. The ammonia spill: before-during-after. In: Vastine WJ, editor. Crisis
Management Manual. Bethesda, Maryland: International Association of Refrigerated
Warehouse. Section 2 p18-27.
Ross W. 1995. CFC-free refrigeration plant for slaughterhouses. Fleischwirtschaft Int (1):10, 12.
Ross W. 1994. Ammonia refrigerant plants at poultry abattoir. Food Market Technol. 8(1):23-
24
Shaw DE, Claus JR, Stewart KK. 1992. Effect of ammonia exposure on fresh pork: a distinct
pink color after cooking. J Muscle Foods 3(2):169-174.
Smolskiy NT, Krishtafovich VI, Kosnyreva LM. 1985. Characteristic of colour formation in
cooked sausage made from meat exposed to ammonia vapours. Plant/Operation Progress
4(1):20-25.

90
Sun DAW. 1998. The aqua-ammonia absorption system: an alternative option for food
refrigeration. J Food Proces Preserv 22(5):371-386.
Ting RS, Henrickson RL. 1986. The effect of ammonia on meat quality. MS. Thesis.
Oklahoma State University, Stillwater, Oklahoma.
Tuengerthal SH. 1979. Reduction in the value of frozen meat due to ammonia escaping from a
break in the refrigeration unit. Die Fleischawirtschaft 59:1632, 1634-1636.
USDA-FSIS. 2009. Safe and suitable ingredients used in the production of meat and poultry
products. Available from: http://www.fsis.usda.gov/OPPDE/rdad/FSISdirectives
/7120.1.htm (Accessed May 2009).

91
SUMMARY AND CONCLUSIONS
The temperature affected the permeability of the tested packaging materials when exposed
to ammonia. In freezing conditions experiment (-17 ± 3 EC), all packaging films showed no
permeability to ammonia or changing in their water pH. While, in experiment performed in room
temperature conditions (21 ± 3 EC), Cryovac E2300, LDPE, and V-PA/PE encountered
permeability to ammonia and changed in their water pH. Each packaging material used in this
research showed low permeability to ammonia. Due to the vacuum (V-PA/PE) multilayer film
structure, it was least permeable to ammonia gas followed by LDPE and Cryovac E-2300. In
addition, high permeability of Cryovac E2300 to oxygen affected the over all transmission rate
through the film materials and thus resulted in greater transmission of ammonia compared to
LDPE and V-PA/PE. However, the ammonia levels passing through the packaging materials
were low even with 500 ppm ammonia exposure for 48 hr. The ammonia levels in the water in
the pouches, affected the pH values with a ratio that corresponded to ammonia concentrations.
The highest pH level, expressed as a difference from the control, resulted in Cryovac E-2300 and
was 2.71 pH units with exposure of 500 ppm for 48 hr. However, our results showed that the
three types of meat packaging material used in this study protect meat from low levels of
ammonia exposure during frozen storage.
Meat ammonia and pH increased with increasing ammonia concentrations and exposure
time. The maximum ammonia and pH values were 116.3 ppm and 0.32 pH unit with exposure of
500 ppm and 48 hr. The requirements for food to be considered safe for humans consumption, its
ammonia content not more 1000 ppm and its pH is not more than 1.0 above the normal
background. Our results showed that, the ammonia level and pH were within the acceptable
levels. Frozen meat contaminated with 500 ppm ammonia gas for up to 48 hr can be considered
safe for humans consumption.

92
APPENDIX
Ammonia gas flow rate calculations ............................................................................................. 94
FIGURES PAGE
Figure A.1. Specifications sheet for vacuum film .................................................................... 95
Figure A.2. Specifications sheet for low density polyethylene film ........................................ 96
Figure A.3. Specifications sheet for Cryovac E-2300 film ...................................................... 97
Figure A.4. Temperature reading using Smartbutton data logger during the experiment ....... 98
Figure A.5. Standard curve used to calculate the ammonia concentrations in the pouches water
(first replicate) with 50 ppm ammonia exposure at 6, 12, 24, and 48 hr in room
temperature exposure ............................................................................................ 99
Figure A.6. Standard curve used to calculate the ammonia concentrations in the pouches water
(first replicate) with 100 ppm ammonia exposure at 6, 12, 24, and 48 hr in room
temperature exposure ............................................................................................ 99
Figure A.7. Standard curve used to calculate the ammonia concentrations in the pouches water
(first replicate) with 250 ppm ammonia exposure at 6, 12, 24, and 48 hr in room
temperature exposure .......................................................................................... 100
Figure A.8. Standard curve used to calculate the ammonia concentrations in the pouches water
(first replicate) with 500 ppm ammonia exposure at 6, 12, 24, and 48 hr in room
temperature exposure .......................................................................................... 100
Figure A.9. Standard curve used to calculate the ammonia concentrations in steaks with 50
ppm ammonia exposure at 6, 12, 24, and 48 hr at freezing temperature
exposure .............................................................................................................. 101

93
Figure A.10. Standard curve used to calculate the ammonia concentrations in steaks with 100
ppm ammonia exposure at 6, 12, 24, and 48 hr at freezing temperature
exposure .............................................................................................................. 101
Figure A.11. Standard curve used to calculate the ammonia concentrations in steaks with 250
ppm ammonia exposure at 6, 12, 24, and 48 hr at freezing temperature exposure (-
17 ± 3 EC) ........................................................................................................... 102
Figure A.12. Standard curve used to calculate the ammonia concentrations in steaks with 500
ppm ammonia exposure at 6, 12, 24, and 48 hr at freezing temperature exposure (-
17 ± 3 EC) ........................................................................................................... 102
Figure A.13. Pouches water ammonia levels. (a) at 50 ppm, (b) at 100 ppm, (c) at 250 ppm,
and (d) 500 ppm ammonia exposure and 6, 12, 24, and 48 hr at 21 ± 3 EC ...... 103
Figure A.14. Pouches water pH levels as different form control for (a) Cryovac E-2300, (b)
LDPE, and (c) vacuum V-PA/PE with 50, 100, 250, and 500 ppm ammonia
exposure at 6, 12, 24, and 48 hr at 21 ± 3 EC ..................................................... 104
Figure A.15. Ammonia concentration over time measured with the ToxiRae PGM-30 in the
sealed exposure chamber to test the chamber integrity ...................................... 105
TABLE PAGE
Table A.1. pH and ammonia levels inside the pouches water as different from the control
without exposure at 6, 12, 24, and 48 hr at 21 ± 3 EC ........................................ 105

94
Ammonia gas flow rate calculations
The flowing equations were used to calculate the ammonia equivalent air flow rate:
Q air = K gas × Q gas
K gas = GTactTo
PoP act
× ×
Where
Q air = equivalent air flow capacity at Standard Conditions (SPT).
Q gas = maximum flow of metered gas.
G = specific gravity of metered gas which is 0.5963 for ammonia gas (G = 1 for air).
T act = absolute temperature at flow condition, deg R or deg K.
T o = absolute temperature at STP, deg R (530) or deg K (294)
P act = pressure at flow conditions (psia)
P o = pressure at STP (14.7 psia)
In our research the testing conditions were:
Q gas = 45 mil/min; T act = 25 EC (298.2 EK); P act = 2.5 psi
G = 0.5963 for ammonia gas (G = 1 for air)
After Calculations
Q air = 84.9 mil/min

95
Figure A.1. Specifications sheet for vacuum film

96
Figure A.2. Specifications sheet for low density polyethylene film

97
Figure A.3. Specifications sheet for Cryovac E-2300 film
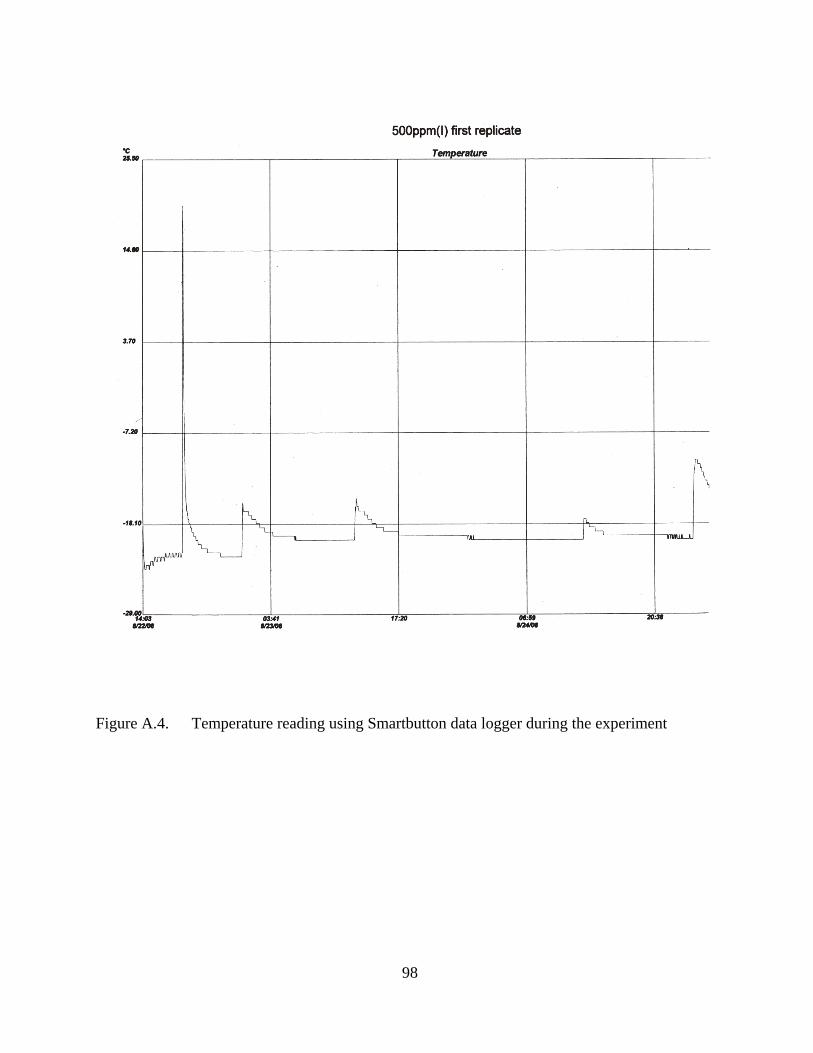
98
Figure A.4. Temperature reading using Smartbutton data logger during the experiment

99
Figure A.5. Standard curve used to calculate the ammonia concentrations in the pouches water
with 50 ppm ammonia exposure at 6, 12, 24, and 48 hr at 21 ± 3 EC
Figure A.6. Standard curve used to calculate the ammonia concentrations in the pouches water
with 100 ppm ammonia exposure at 6, 12, 24, and 48 hr at 21 ± 3 EC
y = 0.0574x - 0.0004R2 = 0.9995
0.00
0.05
0.10
0.15
0.20
0.0 0.5 1.0 1.5 2.0 2.5 3.0
Ammonia as nitrogen concentration (ppm)
Abs
orba
nce
(630
nm
)
y = 0.0588x - 0.0011R2 = 0.9998
0.00
0.10
0.20
0.30
0.40
0 1 2 3 4 5 6
Ammonia as nitrogen concentration (ppm)
Abs
orba
nce
(630
nm)

100
Figure A.7. Standard curve used to calculate the ammonia concentrations in the pouches water
with 250 ppm ammonia exposure at 6, 12, 24, and 48 hr at 21 ± 3 EC
Figure A.8. Standard curve used to calculate the ammonia concentrations in the pouches water
with 500 ppm ammonia exposure at 6, 12, 24, and 48 hr at 21 ± 3 EC
y = 0.0557x + 0.0012R2 = 0.9999
0.00
0.10
0.20
0.30
0.40
0.50
0.60
0 2 4 6 8 10 12
Ammoni a as ni trogen concentration (ppm)
Abs
orba
nce
(630
nm)
y = 0.0672x + 0.0011R2 = 0.9999
0.00
0.20
0.40
0.60
0.80
0 2 4 6 8 10 12
Ammonia as nitrogen concentration (ppm)
Abs
orba
nce
(630
nm)

101
Figure A.9. Standard curve used to calculate the ammonia concentrations in steaks with 50
ppm ammonia exposure at 6, 12, 24, and 48 hr at -17 ± 3 EC
Figure A.10. Standard curve used to calculate the ammonia concentrations in steaks with 100
ppm ammonia exposure at 6, 12, 24, and 48 hr at -17 ± 3 EC
y = 0.0609x + 0.0054R2 = 0.9999
0
0.5
1
1.5
2
0 5 10 15 20 25 30Ammonia as nitrogen concentration (ppm)
Abs
orba
nce
(630
nm
)
y = 0.0682x - 0.0003R2 = 0.9991
0
1
2
0 5 10 15 20 25 30
Ammonia as nitrogen concentration (ppm)
Abs
orba
nce
(630
nm)

102
Figure A.11. Standard curve used to calculate the ammonia concentrations in steaks with 250
ppm ammonia exposure at 6, 12, 24, and 48 hr at -17 ± 3 EC
Figure A.12. Standard curve used to calculate the ammonia concentrations in steaks with 500
ppm ammonia exposure at 6, 12, 24, and 48 hr at -17 ± 3 EC
y = 0.0561x + 0.0118R2 = 0.9999
0.0
0.5
1.0
1.5
2.0
2.5
0 10 20 30 40
Ammonia as nitrogen concentration (ppm)
Abs
orba
nce
(630
nm
)
y = 0.0684x - 0.0053R2 = 0.9998
00.5
11.5
22.5
3
0 10 20 30 40
Ammonia as nitrogen concentration (ppm)
Abs
orba
nce
(630
nm)
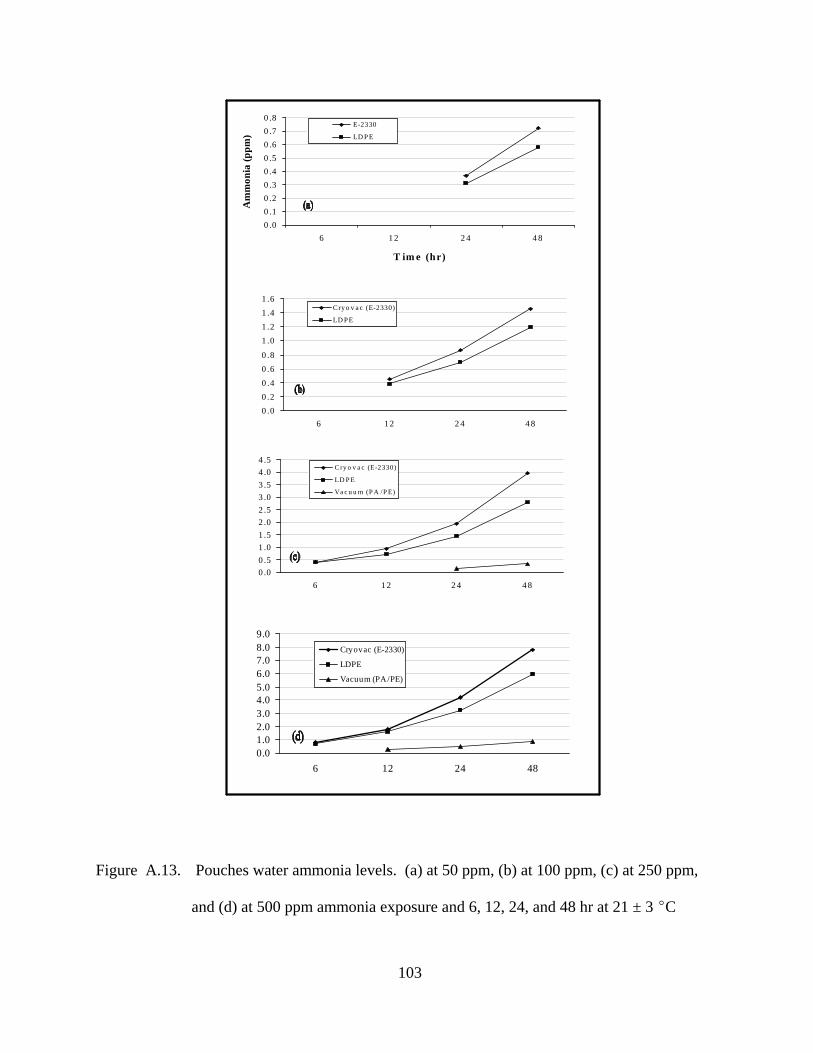
103
Figure A.13. Pouches water ammonia levels. (a) at 50 ppm, (b) at 100 ppm, (c) at 250 ppm,
and (d) at 500 ppm ammonia exposure and 6, 12, 24, and 48 hr at 21 ± 3 EC
0 .00 .10 .20 .30 .40 .50 .60 .70 .8
6 1 2 2 4 4 8
T im e (hr)A
mm
onia
(ppm
)
E-2330
LD P E
0 .00 .51 .01 .52 .02 .53 .03 .54 .04 .5
6 1 2 2 4 4 8
C ry o v a c (E-2330)
LD P E
Va c u u m (P A /P E)
0 .00 .20 .40 .60 .8
1 .01 .21 .41 .6
6 1 2 2 4 4 8
Cry o v a c (E-2330)
LD PE
0.01.02.03.04.05.06.07.08.09.0
6 12 24 48
Cryovac (E-2330)
LDPE
Vacuum (PA/PE)

104
Figure A.14. Pouches water pH levels as different form control for (a) Cryovac E-2300, (b)
LDPE, and (c) vacuum V-PA/PE with 50, 100, 250, and 500 ppm ammonia
exposure at 6, 12, 24, and 48 hr at 21 ± 3 EC
0.00.51.01.52.02.53.0
6 12 24 48Time (hr)
pH
500 ppm 250 ppm 100 ppm50 ppm
0.00.51.01.52.02.53.0
6 12 24 48
500 ppm250 ppm100 ppm50 ppm
0.00.20.40.60.81.01.21.4
6 12 24 48
500 ppm250 ppm100 ppm50 ppm

105
Figure A.15. Ammonia concentration over time measured with the ToxiRae PGM-30 in the
sealed exposure chamber to test the chamber integrity
The depletion in ammonia concentration over time is correlated to the detector
performance not due to losing ammonia concentration from the chamber (personal
communication).
Table A.1. pH and ammonia levels inside the pouches water as a different from the control
without exposure at 6, 12, 24, and 48 hr at 21 ± 3 EC
pH Ammonia Concentration (ppm)
Time Cryovac E-2300 LDPE V-PA/PE Cryovac E-2300 LDPE V-PA/PE
6 0.03 0.00 0.20 0.00 0.00 0.00
12 0.09 0.00 0.18 0.00 0.00 0.00
24 0.06 0.00 0.18 0.00 0.00 0.00
48 0.05 0.00 0.17 0.00 0.00 0.00