european union south korea - european external … · korean economy is one of the fastest growing...
TRANSCRIPT

1
FACT FILE
EUROPEAN UNION - SOUTH KOREA
TRADE AND INVESTMENT RELATIONS
EDITION 2015
OVERVIEW
The European Union (EU) is, since July 2013, composed of 28 Member States1. It is the world’s largest
economy with a population of 507 million people and an annual Gross Domestic Product (GDP) of over 13
trillion euro (18.5 trillion USD) representing about 23%2 of the world economy. The average GDP per capita in
the EU is estimated at 36,699 USD3. The EU is also the world’s largest trading block, accounting for 14.8% of
global merchandise trade and 22.6% of trade in services in 2014.
With a GDP of over 1.41 billion USD, the Korean economy ranked at 13th place in the world in 2014
4. The
Korean population reached over 51 million the same year, bringing the GDP per capita to 27,971 USD5. The
Korean economy is one of the fastest growing among the advanced economies, and is particularly open to
international trade: South Korea ranked as the world's 5th largest exporter in 2014
6.
The EU is now South Korea's third largest trade partner and its third largest export market (representing
9.1% of total exports) after China and the US and ahead of Japan in 2014. The EU is South Korea's
second largest import market (representing 11.9%) after China in 2014. Moreover, in the fast growing
services area, bilateral EU-Korea trade reached some16.2 billion euro in 20137.
As for foreign direct investment, the EU is the largest investor in South Korea with over 6.5 trillion USD8
in 2014. The accumulated European FDI from 2008 to 2014 is over 33.8 trillion USD, which is almost the
double of the second largest investor, Japan.
1 Austria, Belgium, Bulgaria, Croatia, Cyprus, Czech Republic, Germany, Denmark, Spain, Estonia, Finland, France, Greece, Hungary,
Ireland, Italy, Latvia, Lithuania, Luxembourg, Malta, the Netherlands, Poland, Portugal, Romania, Slovakia, Slovenia, Sweden, United
Kingdom.
2 Eurostat data. 2014 figures in current price in euro terms.
3 Purchasing power parity, IMF WEO October 2014
4 World Fact Book
5 Purchasing power parity
6 World Fact Book
7 Eurostat data. Figures for the year 2014 were not available at the time of publishing.
8 Ministry of Trade, Industry and Energy (Republic of Korea). Foreign direct investment figures for the year 2014 were not available in
Eurostat at the time of publishing.
2
EU- SOUTH KOREA TRADE IN GOODS:
DYNAMIC GROWTH BUT STILL LAGGING BEHIND POTENTIAL
The EU-South Korea merchandise trade volume (imports+exports) has been characterized by strong
growth during most of the last decade. It has however experienced a contraction in 2009, in line with the
slowdown of global trade due to the economic crisis.
By 2014 the total volume of bilateral trade between the EU and South Korea amounted to over 82 billion
euro (over 101.7 trillion Korean won) and South Korea was the EU’s 8th largest supplier. EU trade with
Korea accounted for 2.4% of total EU external trade in 2014.
Whilst South Korea's exports to the EU increased by 1.3% to 38.8 billion euro in 2014, the EU remained
the 3rd
largest destination of Korean exports, behind China and the USA and represents about 9.1% of
Korean exports.
As for EU exports to South Korea, they increased by 8% to almost 43.2 billion euro in 2014 and South
Korea's share of EU exports represented 2.5% of total EU exports.
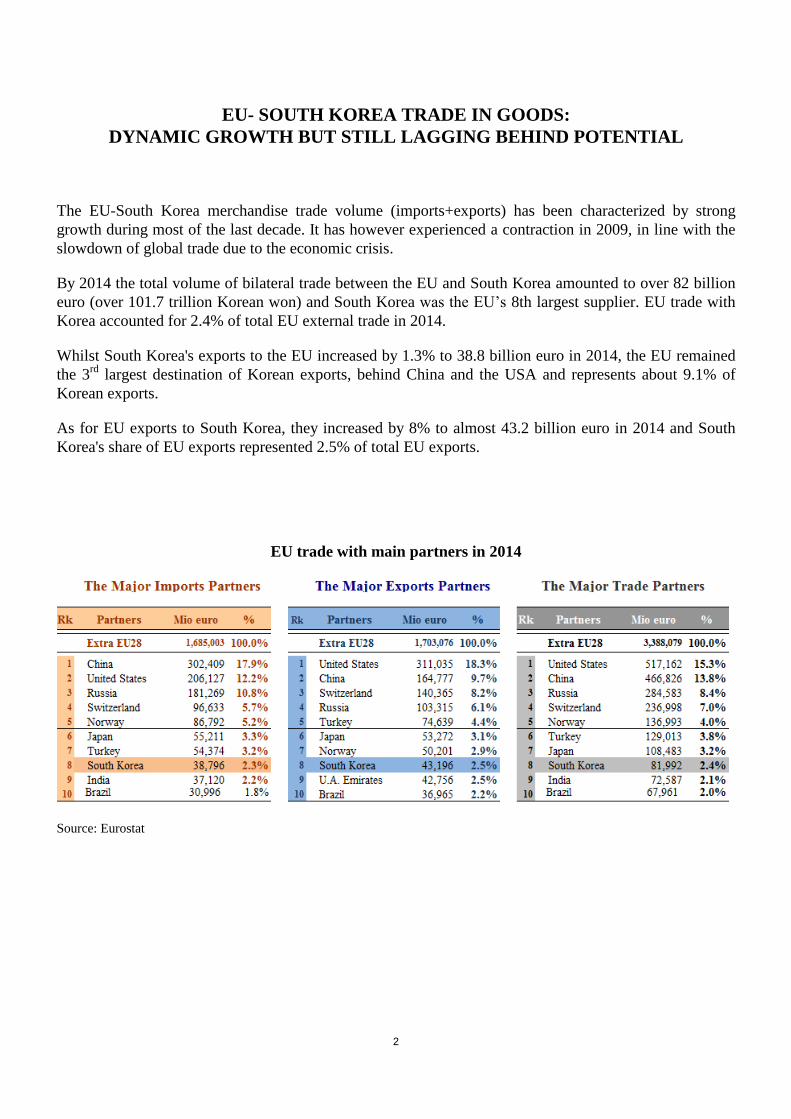
EU trade with main partners in 2014
Source: Eurostat
3
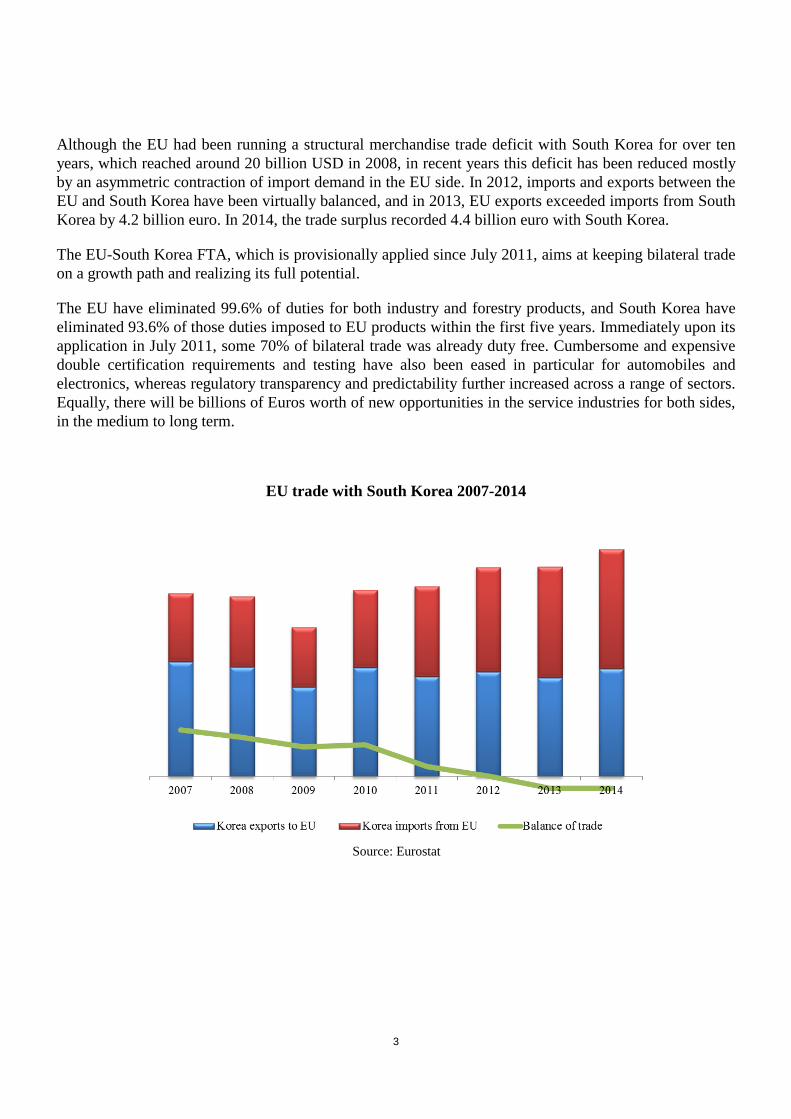
Although the EU had been running a structural merchandise trade deficit with South Korea for over ten
years, which reached around 20 billion USD in 2008, in recent years this deficit has been reduced mostly
by an asymmetric contraction of import demand in the EU side. In 2012, imports and exports between the
EU and South Korea have been virtually balanced, and in 2013, EU exports exceeded imports from South
Korea by 4.2 billion euro. In 2014, the trade surplus recorded 4.4 billion euro with South Korea.
The EU-South Korea FTA, which is provisionally applied since July 2011, aims at keeping bilateral trade
on a growth path and realizing its full potential.
The EU have eliminated 99.6% of duties for both industry and forestry products, and South Korea have
eliminated 93.6% of those duties imposed to EU products within the first five years. Immediately upon its
application in July 2011, some 70% of bilateral trade was already duty free. Cumbersome and expensive
double certification requirements and testing have also been eased in particular for automobiles and
electronics, whereas regulatory transparency and predictability further increased across a range of sectors.
Equally, there will be billions of Euros worth of new opportunities in the service industries for both sides,
in the medium to long term.
EU trade with South Korea 2007-2014
Source: Eurostat

4
SOUTH KOREA IS THE 8th
MOST IMPORTANT SUPPLIER OF THE
EUROPEAN UNION
In 2014, the EU’s imports of goods from South Korea amounted to 38.8 billion euro, making South Korea
the 8th
supplier of merchandise to the EU with a share of 2.3% of total EU imports from the world.
Manufactured products dominated Korean sales to the EU. Machinery and transport equipment (61.2%,
mainly ships and passenger cars), made up the bulk of EU imports representing a total value of over 23.8
billion euro worth of Korean exports to the EU market in 2014.
European Union, Imports from South Korea
SITC Rev.3
(UN, WTO/ITS)
Product Groups
2010 2012 2013 2014
Millions
euro %
Millions
euro %
Millions
euro %
Millions
euro %
0000 - Total 39,391 100.0% 37,861 100.0% 35,840 100.0% 38,796 100.0%
1000 - Primary products 1,915 4.9% 2,864 7.6% 2,728 7.6% 3,161 8.2%
1100 – Agricultural products
(Food (incl. Fish) &
Raw Materials)
430 1.1% 579 1.5% 594 1.7% 674 1.7%
1200 - Fuels and mining
products 1,484 3.8% 2,284 6.0% 2,134 6.0% 2,487 6.4%
2000 - Manufactures 37,148 94.3% 34,666 91.6% 32,935 91.9% 35,423 91.3%
2100 - Iron and steel 1,217 3.1% 1,410 3.7% 1,462 4.1% 1,603 4.1%
2200 - Chemicals 1,832 4.7% 2,506 6.6% 3,067 8.6% 3,872 10.0%
2300 - Other semi-
manufactures 1,660 4.2% 1,994 5.3% 1,994 5.6% 2,123 5.5%
2400 - Machinery and
transport equipment 28,836 73.2% 24,296 64.2% 22,229 62.0% 23,752 61.2%
2410 - Office and
telecommunication
equipment
12,758 32.4% 7,539 19.9% 7,143 19.9% 6,939 17.9%
2420 - Transport
equipment 11,509 29.2% 11,689 30.9% 9,556 26.7% 10,429 26.9%
2430 - Other machinery 4,570 11.6% 5,067 13.4% 5,530 15.4% 6,384 16.5%
2500 - Textiles 579 1.5% 699 1.8% 731 2.0% 777 2.0%
2600 - Clothing 140 0.4% 136 0.4% 121 0.3% 132 0.3%
2700 - Other manufactures 2,884 7.3% 3,626 9.6% 3,330 9.3% 3,163 8.2%
0.0%
0.0%
3000 - Other products 291 0.7% 168 0.4% 163 0.5% 158 0.4%
Source: Eurostat

5
The main destination of Korean exports to the EU is Germany followed by the UK, the Netherlands, and
Slovakia. However, the geographical breakdown of the import statistics must be taken with caution as
often imported products enter through major sea ports in some Member States, but are destined to a
different country. Also a considerable share of import of intermediary goods is concentrated in Member
States where Korean companies built production facilities.
Korean merchandise exports to the EU by Member State in 2014
Source: Eurostat

6
…AND THE 8th
LARGEST EXPORT MARKET FOR EU PRODUCTS
Exports from the EU to South Korea reached a value of 43.2 billion euro in 2014, which represents 2.5%
of total EU exports, ranking South Korea at 8th
export market for EU products, just after Norway.
Machinery and transport equipment are the main EU export categories amounting respectively to 25.6%
and 20.6% of the total export value. 14.2% of EU exports are generated by chemicals and it is worth
noting that the EU was also exporting around 2.5 billion euro worth of agricultural, food and fisheries
products to South Korea.
European Union, Exports to South Korea
SITC Rev.3
(UN, WTO/ITS)
Product Groups
2010 2012 2013 2014
Millions
euro %
Millions
euro %
Millions
euro %
Millions
euro %
0000 - Total 27,957 100.0% 37,763 100.0% 39,968 100.0% 43,196 100.0%
1000 - Primary products 2,841 10.2% 6,722 17.8% 6,294 15.7% 6,446 14.9%
1100 – Agricultural products
(Food (incl. Fish) &
Raw Materials)
1,564 5.6% 2,074 5.5% 2,136 5.3% 2,478 5.7%
1200 - Fuels and mining
products 1,277 4.6% 4,648 12.3% 4,159 10.4% 3,968 9.2%
2000 - Manufactures 24,332 87.0% 30,101 79.7% 32,713 81.8% 35,387 81.9%
2100 - Iron and steel 857 3.1% 1,128 3.0% 1,253 3.1% 1,127 2.6%
2200 - Chemicals 4,768 17.1% 5,781 15.3% 5,732 14.3% 6,151 14.2%
2300 - Other semi-
manufactures 1,370 4.9% 1,681 4.5% 1,746 4.4% 1,816 4.2%
2400 - Machinery and
transport equipment 14,235 50.9% 17,418 46.1% 19,569 49.0% 21,554 49.9%
2410 - Office and
telecommunication
equipment
1,345 4.8% 1,414 3.7% 1,567 3.9% 1,555 3.6%
2420 - Transport
equipment 4,138 14.8% 5,750 15.2% 6,604 16.5% 8,901 20.6%
2430 - Other machinery 8,708 31.1% 10,143 26.9% 11,256 28.2% 11,071 25.6%
2500 - Textiles 223 0.8% 247 0.7% 257 0.6% 290 0.7%
2600 - Clothing 285 1.0% 444 1.2% 492 1.2% 587 1.4%
2700 - Other manufactures 2,585 9.2% 3,378 8.9% 3,641 9.1% 3,858 8.9%
3000 - Other products 444 1.6% 575 1.5% 677 1.7% 1,003 2.3%
Source: Eurostat
7
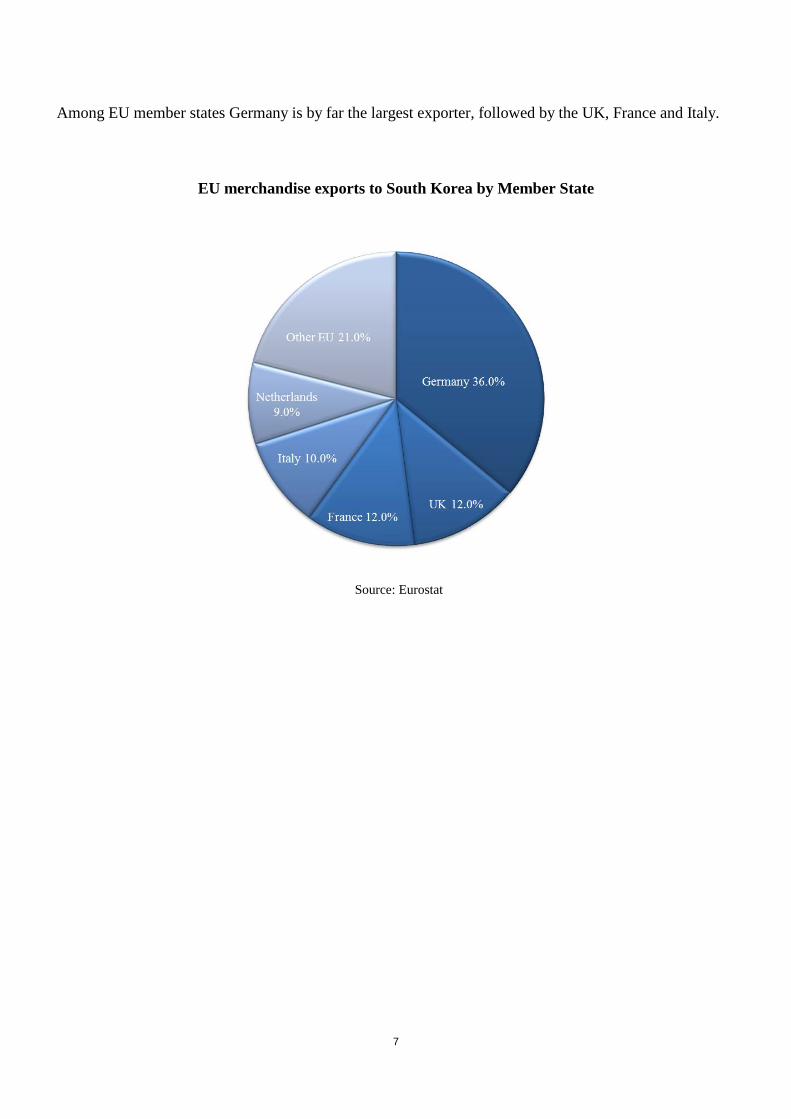
Among EU member states Germany is by far the largest exporter, followed by the UK, France and Italy.
EU merchandise exports to South Korea by Member State
Source: Eurostat

8
KOREAN MERCHANDISE TRADE
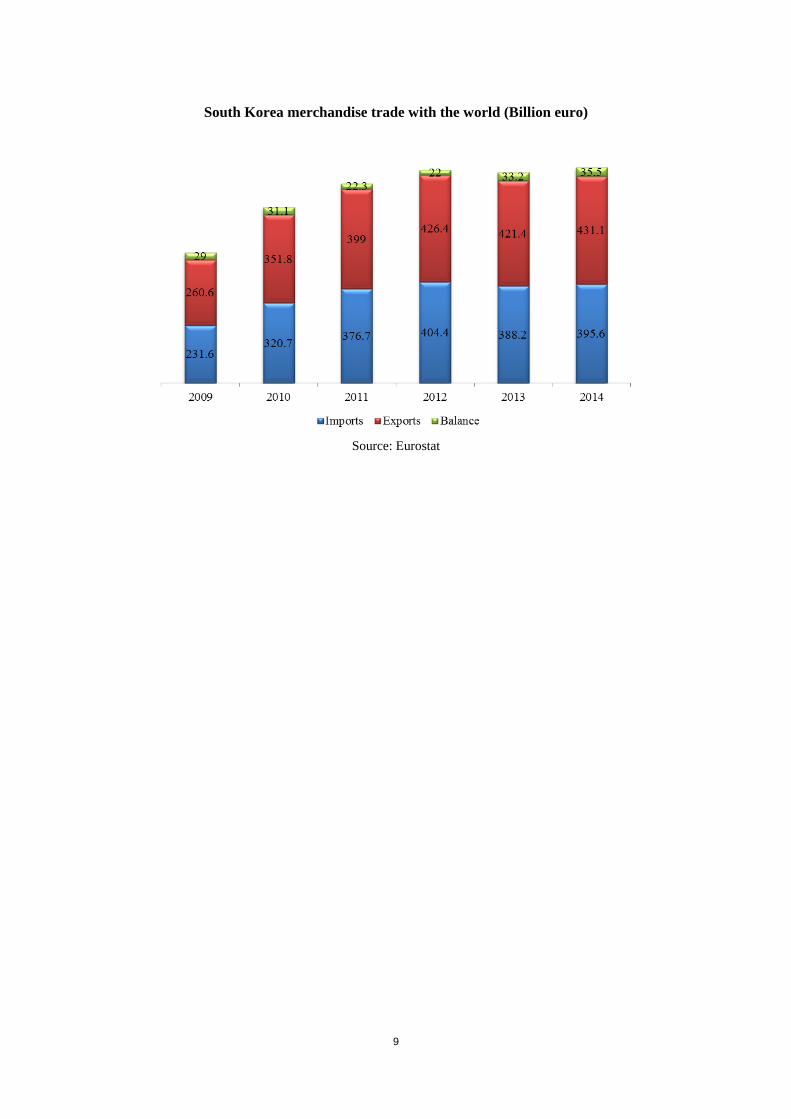
Having reached for the first time 1 trillion USD in 2011, and coming back from a low of under 700
million USD in 2009, South Korea’s external trade experienced a small decline in 2012 due to renewed
macroeconomic uncertainties in its main partners, not least the EU, and recorded a slight increase in 2013
and in 2014.
The Korean trade balance reached record surpluses in 2009 and 2010. After a slight decline in 2011 and
2012, Korean trade balance reached 33.2 billion euro surplus in 2013. In 2014, Korean trade surplus
reached a record of 35.5 billion euro.
The EU is South Korea's third largest trade partner after China and the USA.
In terms of export, EU is the third largest export market representing 9.1% of total exports after China
(25.4%) and the US (12.3%) and ahead of Japan (5.6%). This is in spite of the fact that exports from
South Korea to the EU in 2014 have been strongly affected by the macroeconomic situation, and the
demand contraction in the euro area and other European countries.
On the import side, China maintained its position as South Korea’s biggest supplier (17.1%). The EU is
now Korea's second supplier ahead of Japan (10.2%), with 11.9% of Korean imports and its share is
increasing.
South Korea trade with main partners in 2014
Source: Eurostat
9
South Korea merchandise trade with the world (Billion euro)
Source: Eurostat

10
COMMERCIAL SERVICES:
A GROWING MARKET FOR BILATERAL EXCHANGES
In the services area, total bilateral trade reached 16.2 billion euro in 20139, representing around 1.4% of
the EU’s total trade in services with the rest of the world.
EU sales to South Korea amounted to 10.6 billion euro in 2013, up by 18% compared to the previous
year, whereas EU purchases from South Korea reached 5.6 billion euro up by 11% compared to 2012. In
line with the trend in bilateral merchandise trade, the EU showed a structural surplus with South Korea in
the services sector, totaling 4.9 billion euro in 2013.
In 201210
, on the EU import side, transport was the main component representing about half of EU
imports followed by other business services.
The largest item of EU exports in 201211
was also the transport sector, and sea transport in particular, with
2.5 billion euro in exports. Business services follow in importance with nearly 2.9 billion euro, including
legal, accounting, consulting and other services. These have all been growing fast, as they include areas
where EU companies are strongly specialised.
Services are one of the domains to benefit most, in relative terms, from the Free Trade Agreement
between the EU and South Korea. Market access conditions are expected to further improve in a number
of service sectors, with potential benefits for industry and other economic sectors which will benefit from
a wider range of competitive and high-quality business services.
Trade in total services EU-28 with South Korea (billion euro)
Source: Eurostat
9 Eurostat data. Figures for the year 2014 were not available at the time of publishing.
10 Eurostat data. Due to the change of statistics calculation methods, detailed figures for the year 2013 and 2014 were not available at the
time of publishing.
11 Eurostat data. Due to the change of statistics calculation methods, figures for the year 2013 and 2014 were not available at the time of
publishing.

11
EU27* trade in services with South Korea (million euro)
EU Purchase (EU Imports)
2008 2009 2010 2011 2012
2012
% extra-EU
Current account, Services 5,013 3,808 4,644 4,488 4,711 0.9%
Transportation 2,433 1,601 2,277 2,073 2,231 1.9%
Sea transport 1,265 868 1,206 1,020 1,158
Air transport 686 437 606 684 747
Other transport 478 298 463 371 326
Travel 170 172 115 142 131 0.1%
Other services 2,407 2,028 2,241 2,268 2,344 0.8%
Communications services 46 51 52 57 67 0.4%
Construction services 267 275 211 241 203 2.6%
Insurance services 68 52 68 64 87 0.8%
Financial services 246 159 335 190 182 0.8%
Computer and information services 52 57 61 73 105 0.6%
Royalties and license fees 184 243 289 219 150 0.3%
Other business services 1,503 1,154 1,180 1,389 1,400 1.0%
Personal, cultural and recreational services 13 13 19 14 24 0.4%
Government services, n.i.e. 29 24 27 21 125 2.0%
Services not allocated 5 3 6 1 2 0.7%
Commercial services 4,985 3,784 4,616 4,468 4,586 0.9%
EU Sales (EU Exports)
2008 2009 2010 2011 2012
2012
% extra-EU
Current account, Services 8,088 6,568 8,533 8,994 9,654 1.5%
Transportation 3,598 2,476 3,210 3,158 3,372 2.3%
Sea transport 2,857 1,931 2,497 2,424 2,565
Air transport 639 445 598 610 684
Other transport 102 101 114 126 122
Travel 542 470 527 634 634 0.7%
Other services 3,944 3,617 4,788 5,200 5,645 1.3%
Communications services 77 75 82 141 276 1.3%
Construction services 299 251 191 196 244 1.5%
Insurance services -71 14 112 144 205 0.9%
Financial services 405 326 378 367 373 0.7%
Computer and information services 151 129 170 238 456 1.0%
Royalties and license fees 843 772 1,138 1,123 1,031 2.6%
Other business services 2,174 1,914 2,590 2,827 2,915 1.4%
Personal, cultural and recreational services 47 48 102 143 130 1.5%
Government services, n.i.e. 19 89 26 19 16 0.2%
Services not allocated -1 2 5 1 2 1.2%
Commercial services 8,069 6,479 8,507 8,975 9,639 1.5%
Source: Eurostat

12
EU-SOUTH KOREA FOREIGN DIRECT INVESTMENT RELATIONS
Inflows of foreign direct investment (FDI) into South Korea have increased remarkably since the
liberalization of the FDI regime after the financial crisis in 1997.
After a slowdown in 2007, FDI flows in South Korea were quick to recover in the following years, and
have benefited from Korea's policy of concluding FTAs with major trade partners. EU companies were
the largest contributors to inflows into the country from 2008 to 2014 with investments stocks totalling
33.9 billion USD, which represents 34% of total investment into Korea. 12
EU companies are consistently the largest investors in South Korea since 1962 (when records became
available). EU companies have put considerable trust and confidence in South Korea and demonstrated an
outstanding long-term commitment.
FDI into South Korea Unit: US$1000
2008 2009 2010 2011 2012 2013 2014
2008-2014
% of Total
Total 11,710,519 11,483,991 13,070,169 13,669,418 16,286,003 14,548,051 19,003,095 100%
EU 6,338,618 5,296,641 3,195,616 5,032,416 2,714,294 4,801,802 6,503,826 34%
Japan 1,422,717 1,934,253 2,083,233 2,284,287 4,541,484 2,689,660 2,487,648 17%
USA 1,328,187 1,486,456 1,974,448 2,372,008 3,674,194 3,525,161 3,609,141 18%
Singapore 915,808 436,413 772,977 611,306 1,405,407 431,044 1,672,654 6%
Hong Kong 242,019 773,486 91,790 572,573 1,669,800 976,484 1,061,042 5%
China 336,436 160,505 414,467 650,675 727,052 481,186 1,189,362 4%
Canada 89,617 303,225 480,345 738,913 393,769 387,599 572,071 3%
Malaysia 53,028 84,322 105,822 93,492 182,158 54,500 28,234 1%
Australia 68,549 224,515 7,009 90,889 152,568 50,491 139,833 1%
Source: MOTIE. Notification basis.
12 Ministry of Trade, Industry and Energy (Republic of Korea). Foreign direct investment figures for the year 2014 were not available in
Eurostat at the time of publishing.

13
In terms of sectorial breakdown, in the past seven years 56.9% of EU investment in South Korea has been
undertaken in the services sector, 40.2% in the manufacturing sector, and 2.9% in the utilities and
construction sectors.
Within the services sector, the FDIs in the finance, banking and insurance accounted for 24.6% of the
total FDIs from 2008 to 2014, and those in the wholesale and retail sector 14.1%. The largest part of
investment in the manufacturing sector went to chemicals (13%) and electrical and electronic equipment
(6%).
FDI from EU into South Korea
FDI from EU into Korea 2008-2014
1000 USD %
Services
Wholesale & Retail 4,768,467 14.1%
Accommodation & Food services 180,459 0.5%
Transport & Logistics 292,140 0.9%
Communications 14,852 0.0%
Finance, Banking & Insurance 8,331,562 24.6%
Real Estate & Leasing 1,202,892 3.5%
Business Services 4,065,227 12.0%
Culture, Entertainment 277,001 0.8%
Public, Other Services 141,553 0.4%
TOTAL Services 19,274,154 56.9%
Manufacturing
Food products 538,331 1.6%
Fibers, textiles, clothing 385,471 1.1%
Paper & Wood 24,084 0.1%
Chemicals 4,398,904 13.0%
Medicaments 926,085 2.7%
Non-metallic minerals 2,493,834 7.4%
Metals 836,887 2.5%
Machinery & equipment 840,231 2.5%
Electrical & Electronics 2,029,863 6.0%
Transportation machinery 884,271 2.6%
Other 267,222 0.8%
TOTAL Manufacturing 13,625,183 40.2%
Electricity, Gas, Water supply & Construction 986,425 2.9%
Agriculture, Fisheries, Mining 870 0.0%
Grand total 33,886,631 100.0%
Source: MOTIE

14
South Korea's FDI to the EU in the past seven years was led by the service sector with 51.7%, followed by
the mining (28.1%) and the manufacturing sector (15.5%).
Within the services sector, the FDIs in the finance and insurance accounted for 13.8% of the total FDIs
from 2008 to 2014, followed by the real estate and leasing services with 13.3%. Science and Technology
occupied 12.1%.
FDI from South Korea into the EU
Korea FDI into the EU 2008-2014
1000 USD %
Services
Wholesale & Retail 2,255,932 8.4%
Transport & Logistics 706,143 2.6%
Accommodation & Food Services 17,859 0.1%
Publication, Film, ICT and Information Service 180,280 0.7%
Finance & Insurance 3,705,513 13.8%
Real Estate & Leasing 3,575,334 13.3%
Science & Technology Services 3,238,157 12.1%
Infrastructure Services 179,914 0.7%
Education Services 3,549 0.0%
Health & Social Services 348 0.0%
Culture, Entertainment & Sports 1,190 0.0%
Associations & Individual Services 749 0.0%
TOTAL Services 13,864,968 51.7%
Manufacturing 4,152,456 15.5%
Agriculture, Fisheries & Forestry 20,490 0.1%
Mining 7,535,128 28.1%
Electricity, Gas & Water supply 665,470 2.5%
Environment 47 0.0%
Construction 587,572 2.2%
Grand Total 26,826,131 100.0%
Source: KEXIM Bank

15
EU FDI into South Korea, 2008-2014
Looking at the breakdown of the 33.9 billion USD of EU FDI by Member States13
, for the past seven
years the Netherlands were the largest source of investment with a 26.4% share, followed by UK and
Malta with 16.7% and 15.9% respectively.
Source: MOTIE
South Korea FDI into the EU, 2008-2014
Korean companies invested a total of 31.2 billion USD in the EU between 2008 and 2014.
When looking at a country-by-country breakdown of investment made by Korean firms, the Netherlands
have attracted the largest amount of investment (31.2%), followed by the UK and Ireland.14
Source: South Korea Eximbank
13 In a globalised world, companies establish themselves according to strategic and legal considerations. For this reasons FDI statistics must
be treated with caution as to the actual geographical origin.
14 Source: The Export-Import Bank of South Korea. Notification basis.