european tuna farming sector: presentation and challenges
TRANSCRIPT

Apostolos TzoumasFEAP Tuna Commission
Apostolos TzoumasFEAP Tuna Commission
European Tuna Farming Sector: Presentation and ChallengesEuropean Tuna Farming
Sector: Presentation and Challenges
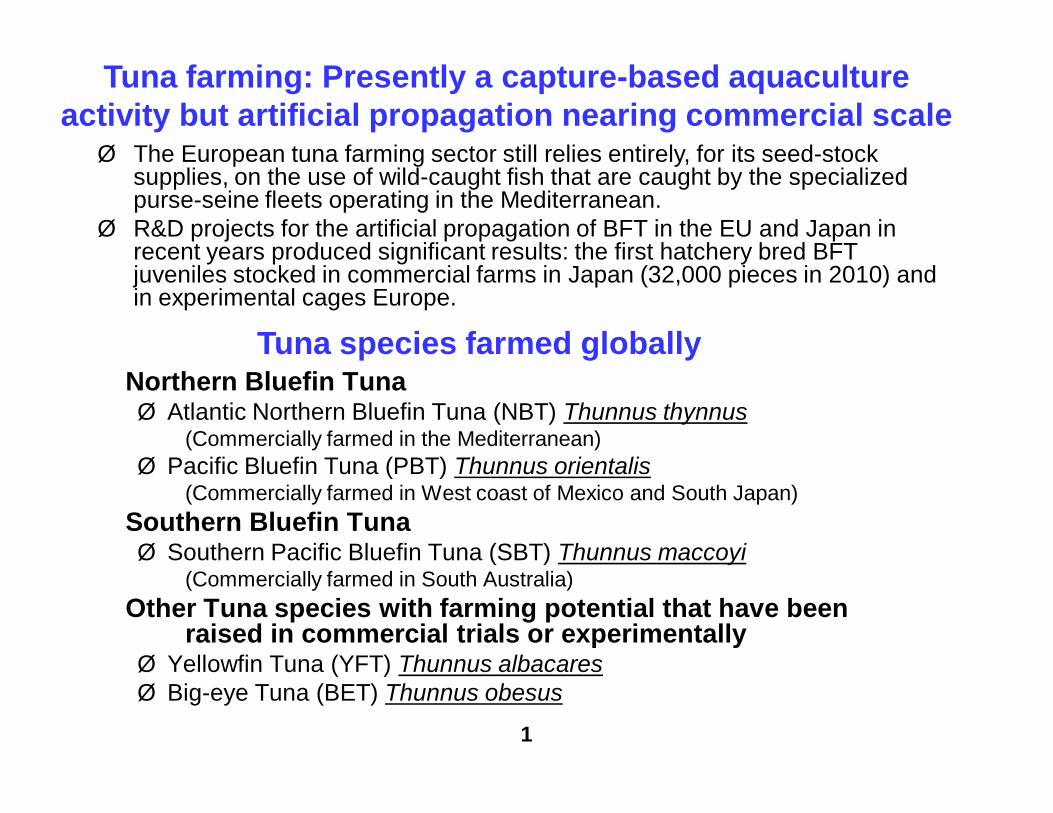
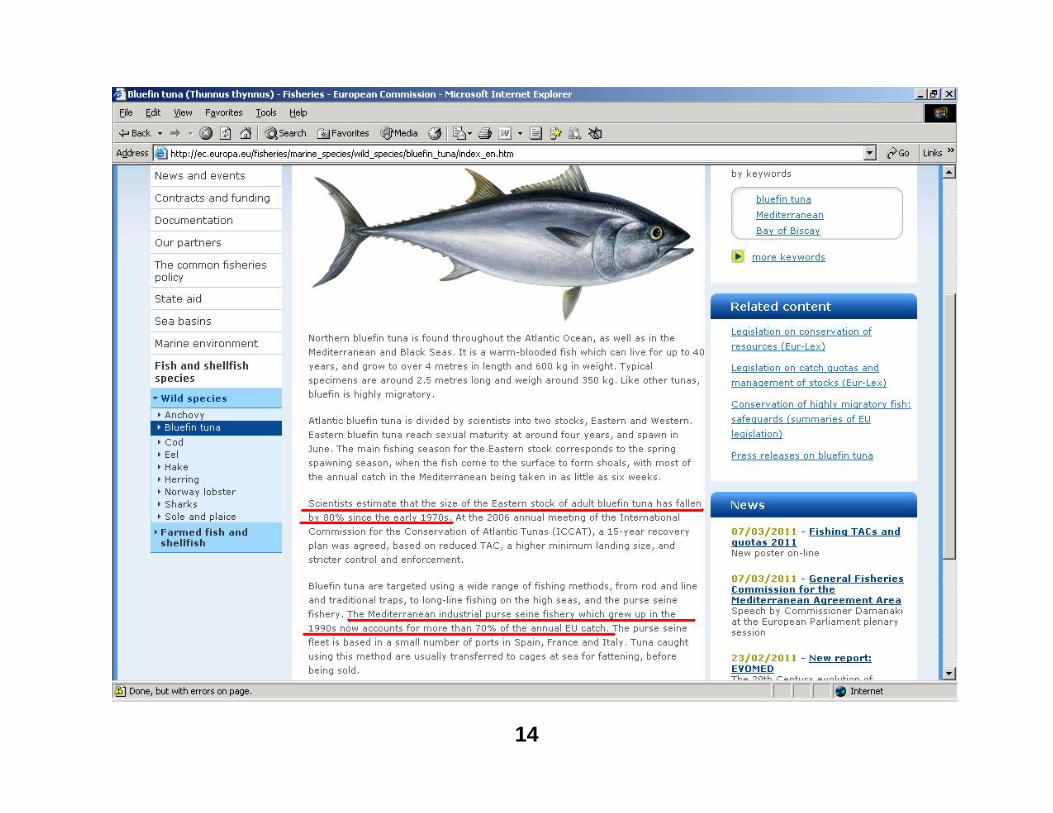
Northern Bluefin TunaØ Atlantic Northern Bluefin Tuna (NBT) Thunnus thynnus
(Commercially farmed in the Mediterranean)Ø Pacific Bluefin Tuna (PBT) Thunnus orientalis
(Commercially farmed in West coast of Mexico and South Japan)Southern Bluefin TunaØ Southern Pacific Bluefin Tuna (SBT) Thunnus maccoyi
(Commercially farmed in South Australia)Other Tuna species with farming potential that have been
raised in commercial trials or experimentallyØ Yellowfin Tuna (YFT) Thunnus albacaresØ Big-eye Tuna (BET) Thunnus obesus
1
Tuna species farmed globally
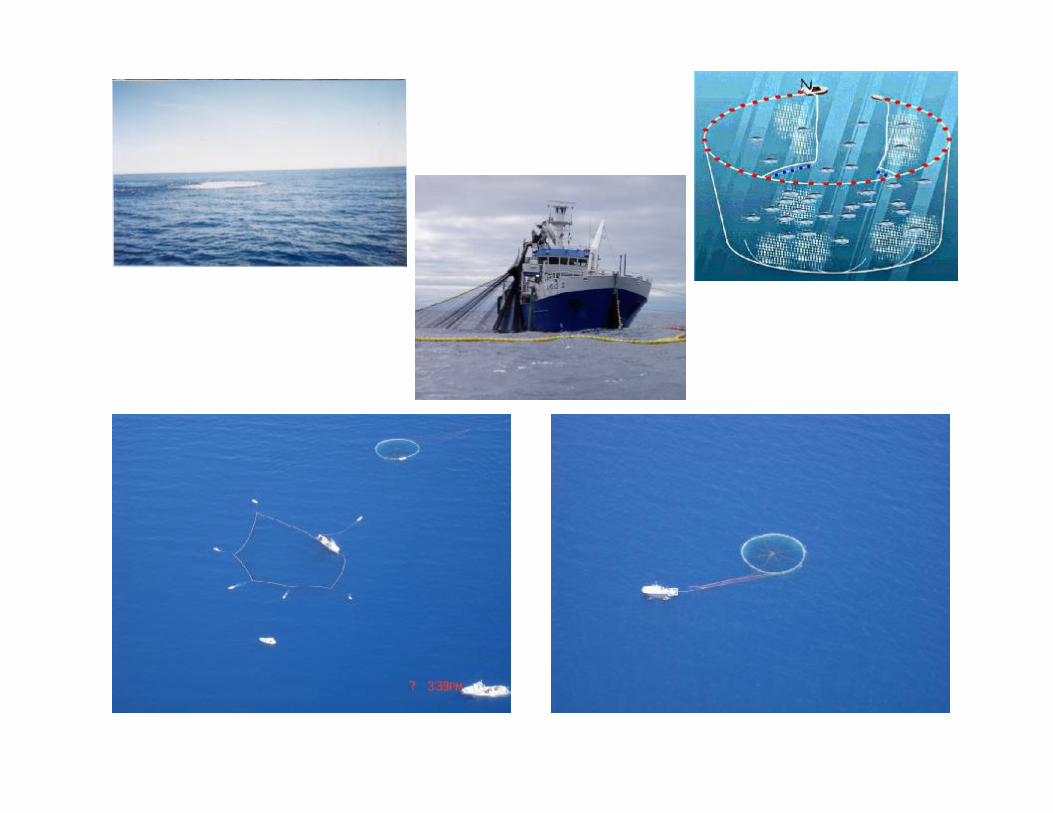
Tuna farming: Presently a capture-based aquaculture activity but artificial propagation nearing commercial scaleØ The European tuna farming sector still relies entirely, for its seed-stock
supplies, on the use of wild-caught fish that are caught by the specialized purse-seine fleets operating in the Mediterranean.
Ø R&D projects for the artificial propagation of BFT in the EU and Japan in recent years produced significant results: the first hatchery bred BFT juveniles stocked in commercial farms in Japan (32,000 pieces in 2010) and in experimental cages Europe.
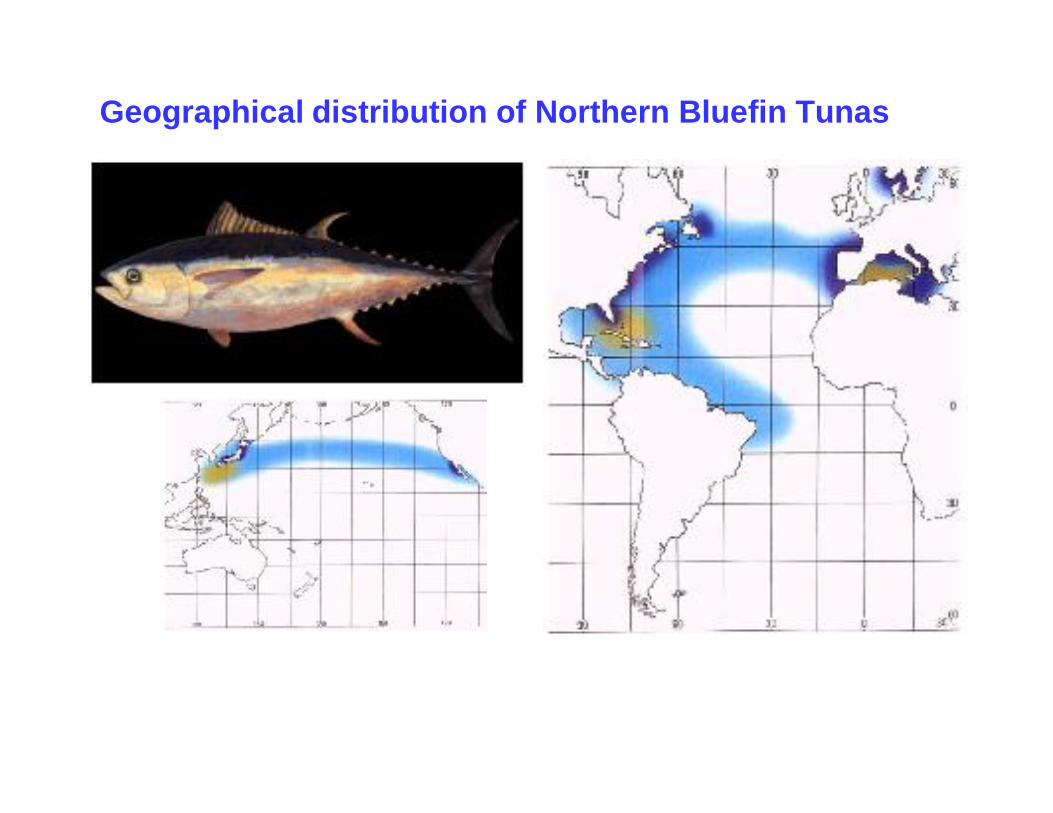
Geographical distribution of Northern Bluefin Tunas

Geographical Distribution of Southern Bluefin Tuna
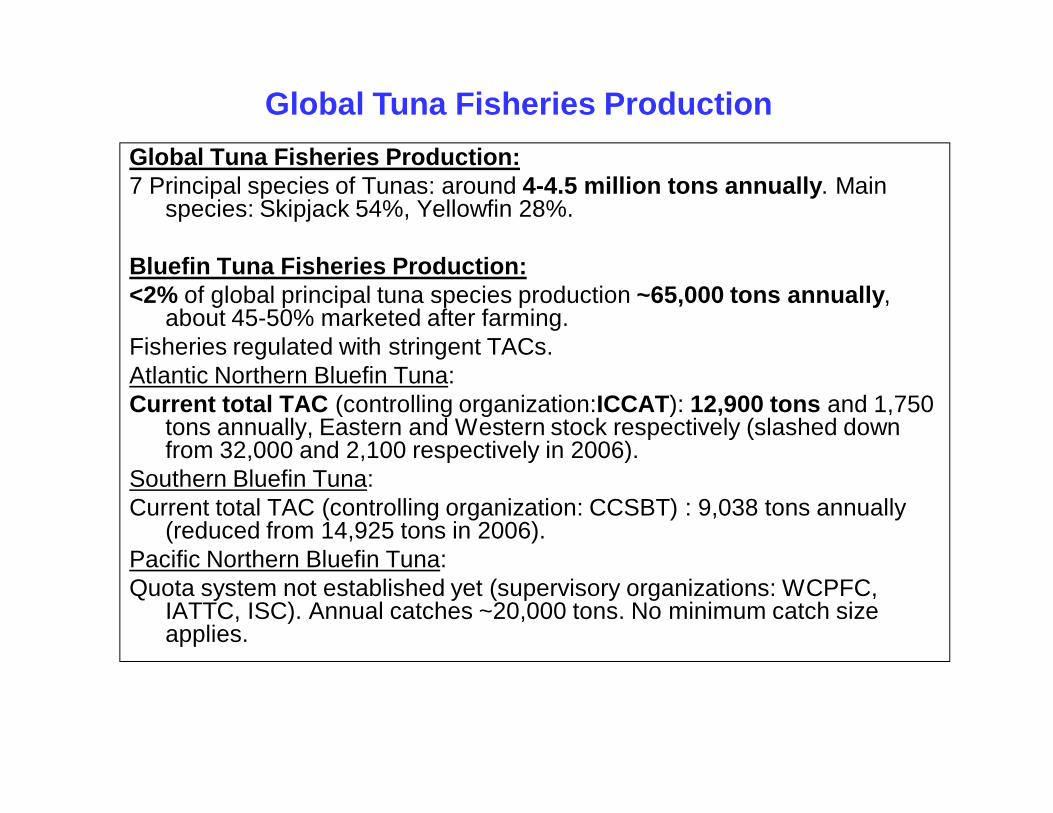
Global Tuna Fisheries Production:7 Principal species of Tunas: around 4-4.5 million tons annually. Main
species: Skipjack 54%, Yellowfin 28%.
Bluefin Tuna Fisheries Production:<2% of global principal tuna species production ~65,000 tons annually,
about 45-50% marketed after farming. Fisheries regulated with stringent TACs.Atlantic Northern Bluefin Tuna: Current total TAC (controlling organization:ICCAT): 12,900 tons and 1,750
tons annually, Eastern and Western stock respectively (slashed down from 32,000 and 2,100 respectively in 2006).
Southern Bluefin Tuna: Current total TAC (controlling organization: CCSBT) : 9,038 tons annually
(reduced from 14,925 tons in 2006). Pacific Northern Bluefin Tuna: Quota system not established yet (supervisory organizations: WCPFC,
IATTC, ISC). Annual catches ~20,000 tons. No minimum catch size applies.
Global Tuna Fisheries Production
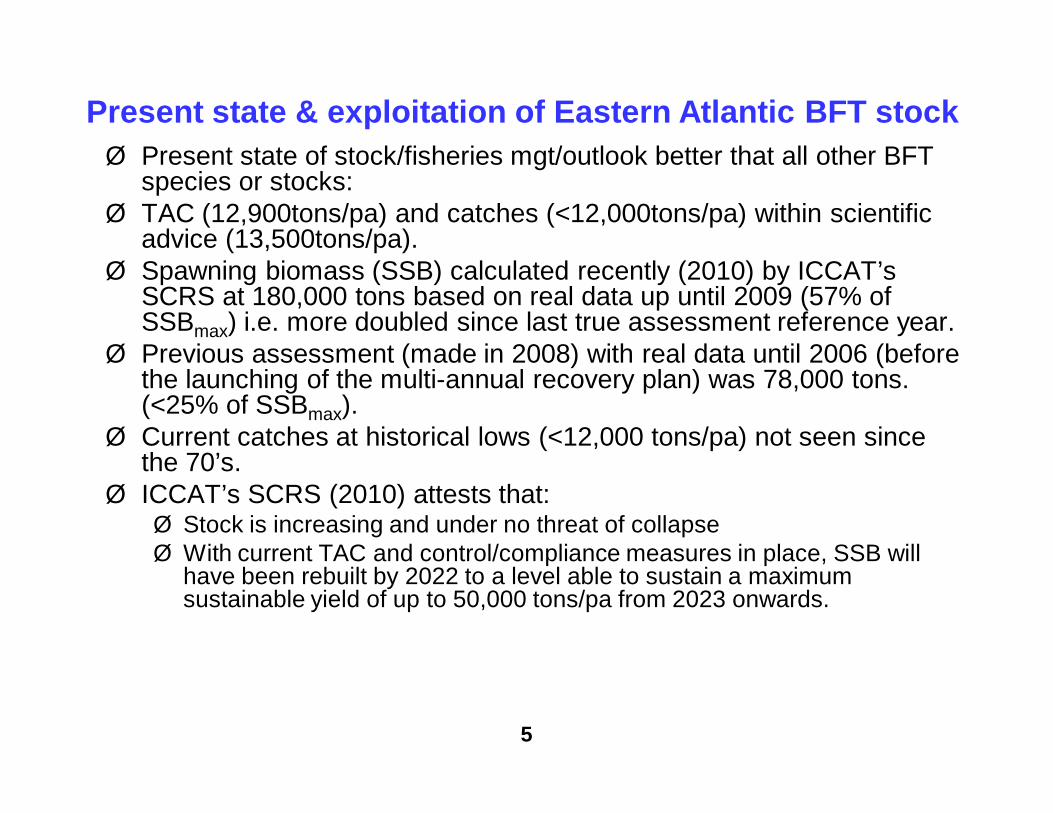
Ø Present state of stock/fisheries mgt/outlook better that all other BFT species or stocks:
Ø TAC (12,900tons/pa) and catches (<12,000tons/pa) within scientific advice (13,500tons/pa).
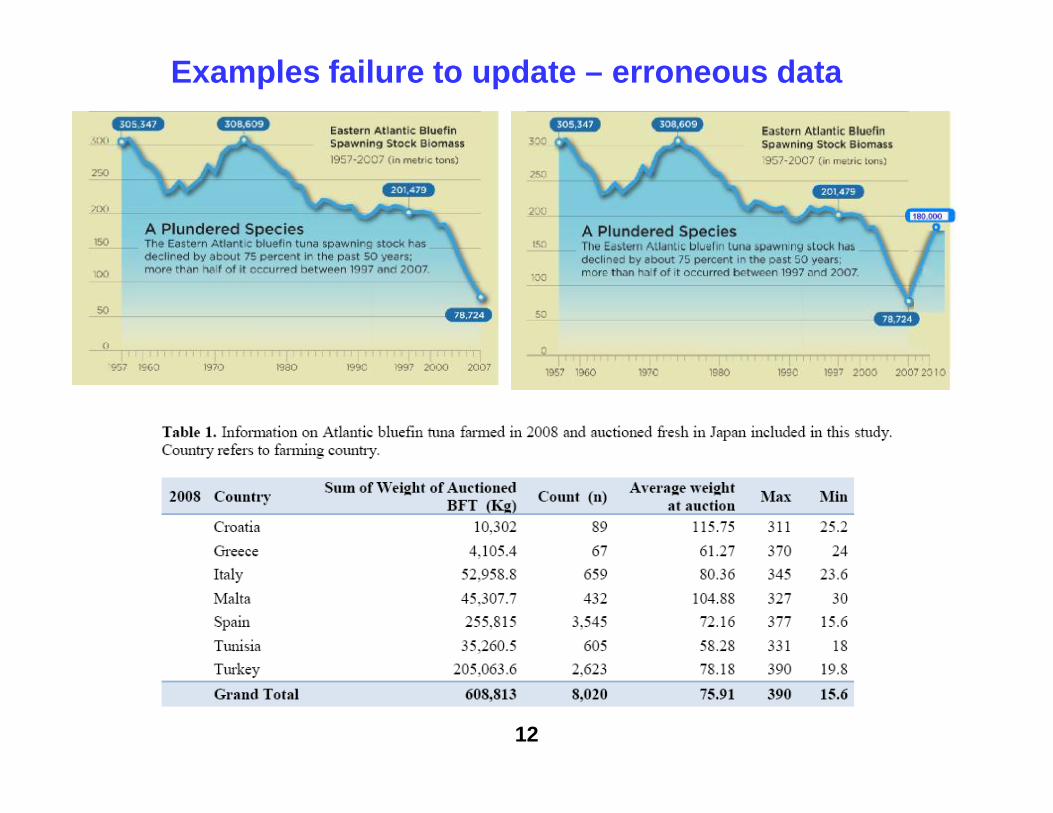
Ø Spawning biomass (SSB) calculated recently (2010) by ICCAT’s SCRS at 180,000 tons based on real data up until 2009 (57% of SSBmax) i.e. more doubled since last true assessment reference year.
Ø Previous assessment (made in 2008) with real data until 2006 (before the launching of the multi-annual recovery plan) was 78,000 tons. (<25% of SSBmax).
Ø Current catches at historical lows (<12,000 tons/pa) not seen since the 70’s.
Ø ICCAT’s SCRS (2010) attests that:Ø Stock is increasing and under no threat of collapseØ With current TAC and control/compliance measures in place, SSB will
have been rebuilt by 2022 to a level able to sustain a maximum sustainable yield of up to 50,000 tons/pa from 2023 onwards.
5
Present state & exploitation of Eastern Atlantic BFT stock

Principle Tuna Catches Per Species (’000 MT) (Source: Globefish)
0
500
1000
1500
2000
2500
1985 1990 1995 2000 2005
Skipjack
Yellowfin
Bigeye
Albacore
Bluefin
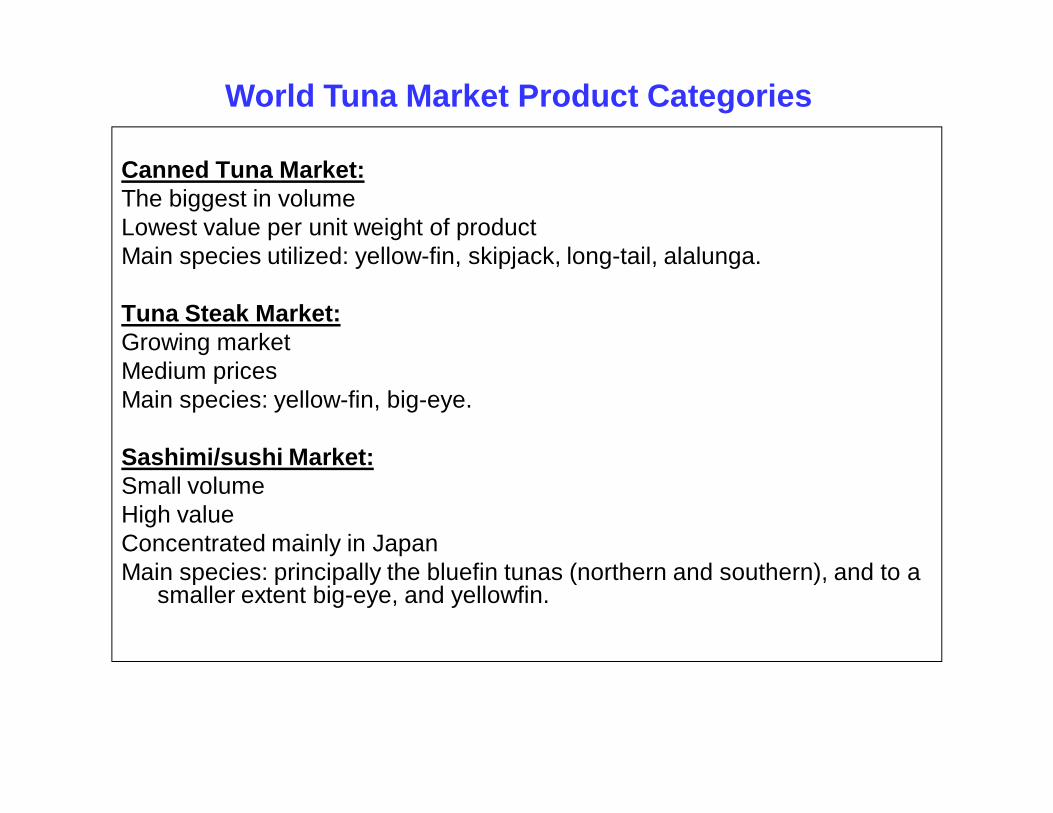
Canned Tuna Market:The biggest in volumeLowest value per unit weight of productMain species utilized: yellow-fin, skipjack, long-tail, alalunga.
Tuna Steak Market:Growing marketMedium pricesMain species: yellow-fin, big-eye.
Sashimi/sushi Market:Small volumeHigh valueConcentrated mainly in JapanMain species: principally the bluefin tunas (northern and southern), and to a
smaller extent big-eye, and yellowfin.
World Tuna Market Product Categories
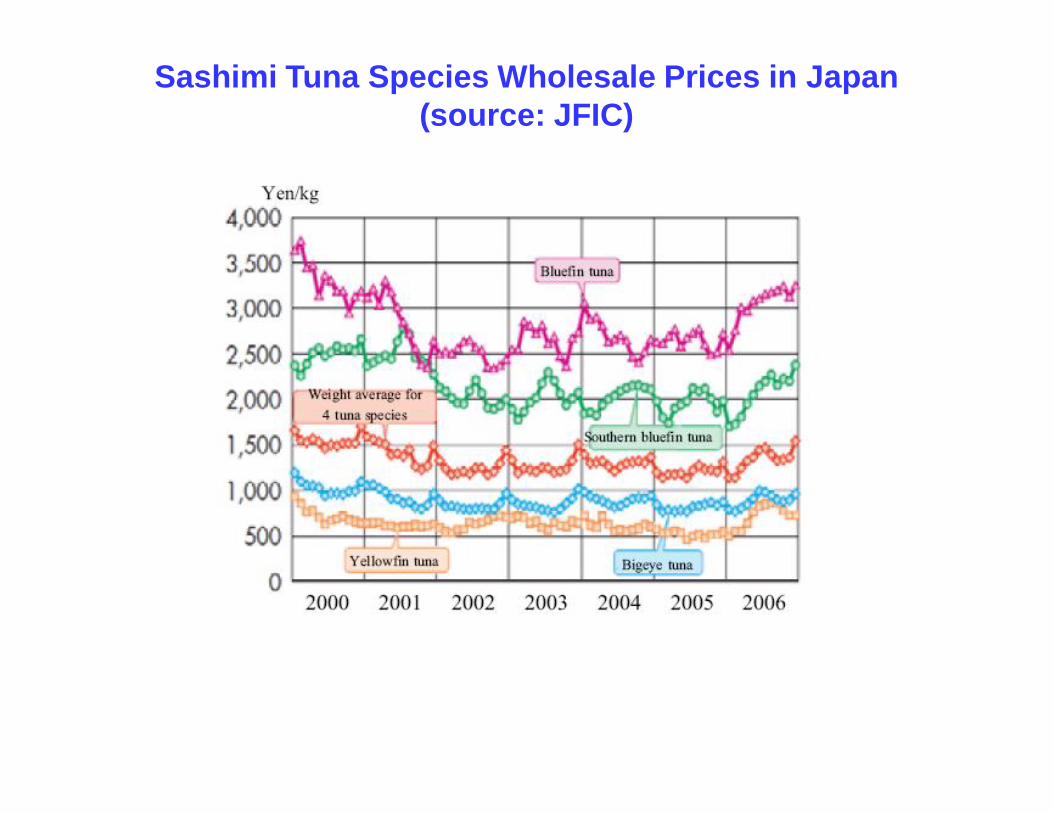
Sashimi Tuna Species Wholesale Prices in Japan(source: JFIC)
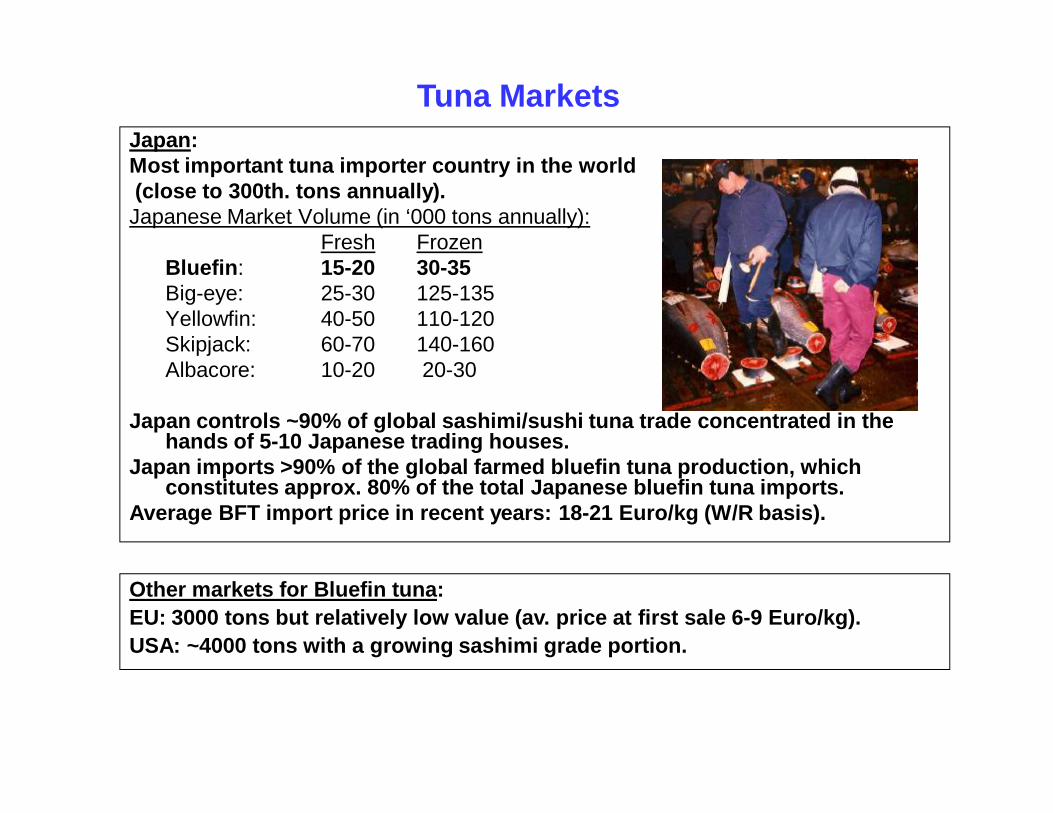
Japan: Most important tuna importer country in the world(close to 300th. tons annually). Japanese Market Volume (in ‘000 tons annually):
Fresh FrozenBluefin: 15-20 30-35Big-eye: 25-30 125-135Yellowfin: 40-50 110-120Skipjack: 60-70 140-160Albacore: 10-20 20-30
200-250000 τόνους τόνων Japan controls ~90% of global sashimi/sushi tuna trade concentrated in the
hands of 5-10 Japanese trading houses. Japan imports >90% of the global farmed bluefin tuna production, which
constitutes approx. 80% of the total Japanese bluefin tuna imports.Average BFT import price in recent years: 18-21 Euro/kg (W/R basis).
Tuna Markets
Other markets for Bluefin tuna: EU: 3000 tons but relatively low value (av. price at first sale 6-9 Euro/kg).USA: ~4000 tons with a growing sashimi grade portion.

10
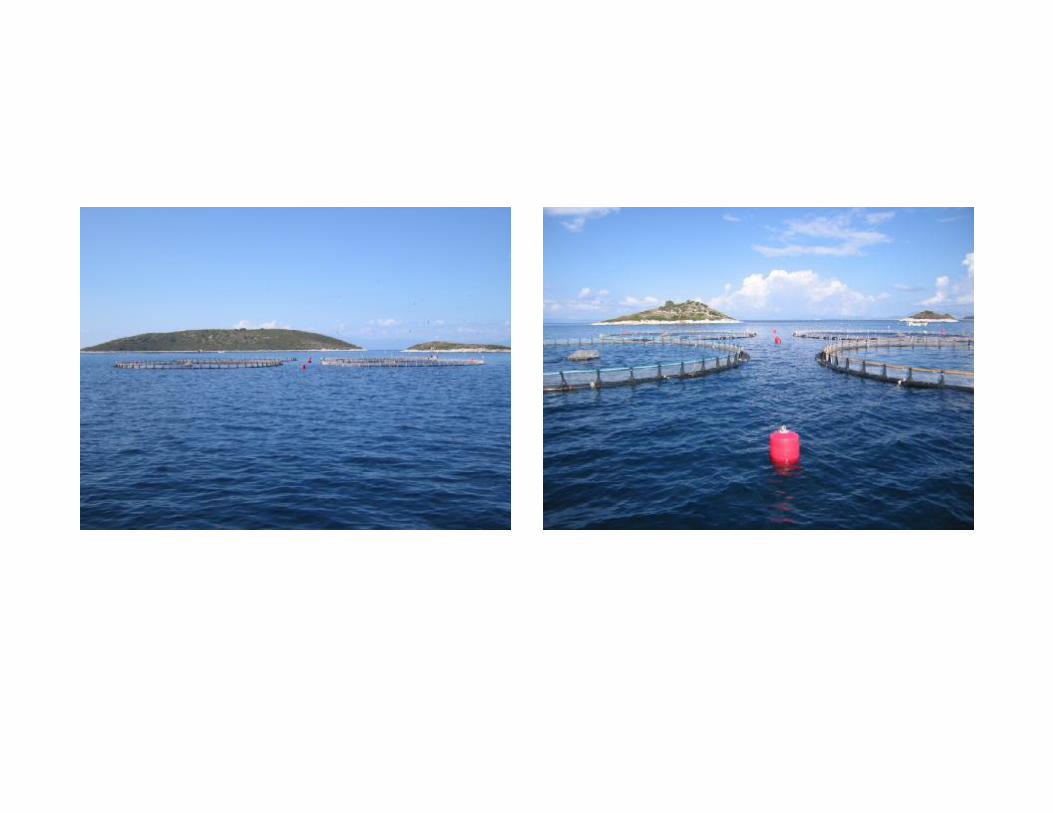
European/Mediterranean tuna farming sector: Facts and Figures
Ø Sector utilizes the finite and low value purse-seine fishery catch: 5,000 tons in 2010 (37% of total TAC) valued 30 mi. Euro to produce a value addition of more than 4-fold through: Ø 40%+ weight increase from growth/fattening (7,000 tons output)Ø 330% increase of sales price (from 6 to 20 Euro/kg) through quality
improvement: 99% sashimi grade output (from around 40% at start) and with optimum fat content (increased to 30%+ from 5-8% at start).
Ø In the past 4 years the sector has been compelled to a forced volume reduction and restructuring due to reduced wild seed availability caused by TAC reductions, and governments restricting the TAC allocation given to the purse seiners sector in favor of other commercial gear.
Ø Production and sales volumes reduced by >50% : Ø 2010: No. of operating Farms in the Med. 17 (7 in the EU); Sales volume: ~9,500
tons W/R (50% in the EU); Turnover: ~180 mi. Euro; FT Employment: ~500.Ø 2006: No. of operating Farms in the Med. 38 (18 in the EU); Sales volume: 24,500
tons W/R (60% in the EU); Turnover: ~400 mi. Euro; FT Employment: ~1,200.Ø One would expect that the sector would benefit from a sales price increase
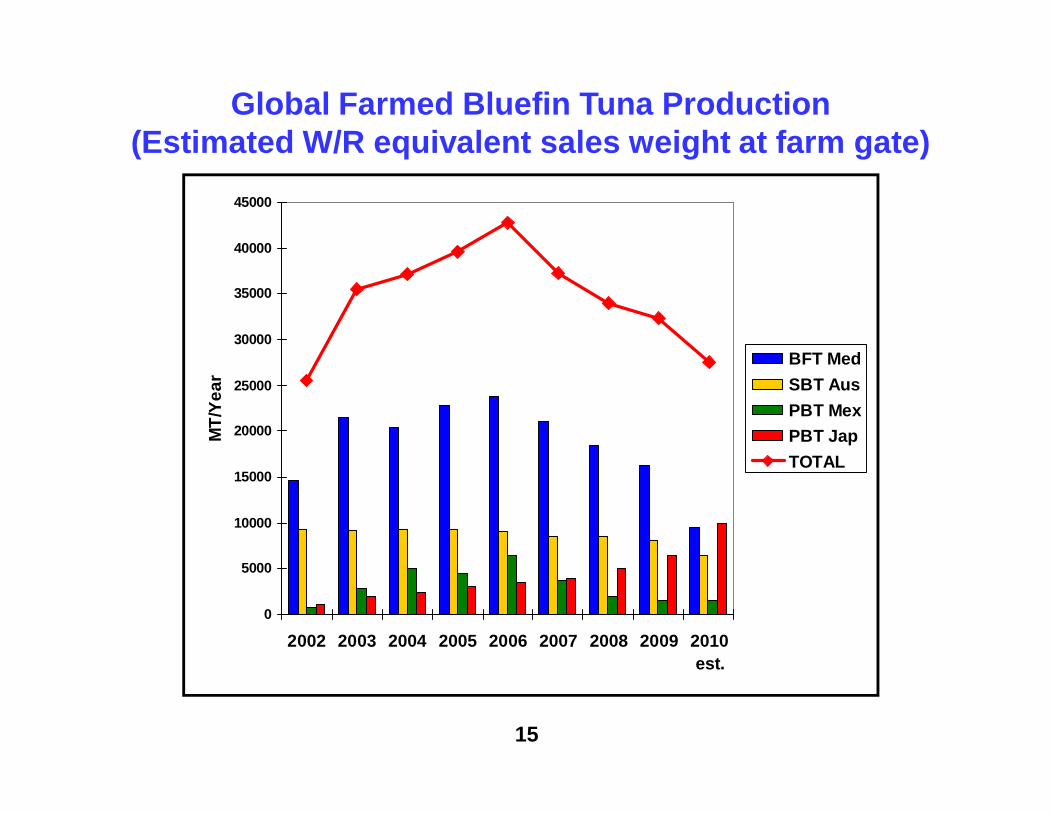
following the reduced supply to the market, however this did not happen because the competitor Japanese BFT farming sector – aided by the regulatory deficits in the mgt of the Pacific BFT fisheries – increased rapidly its output (>2.5 times in the same period) covering the void.
Ø As a result of the above and also the cost of the new measures and procedures imposed, economies of scale deteriorated and profitability margins diminished.
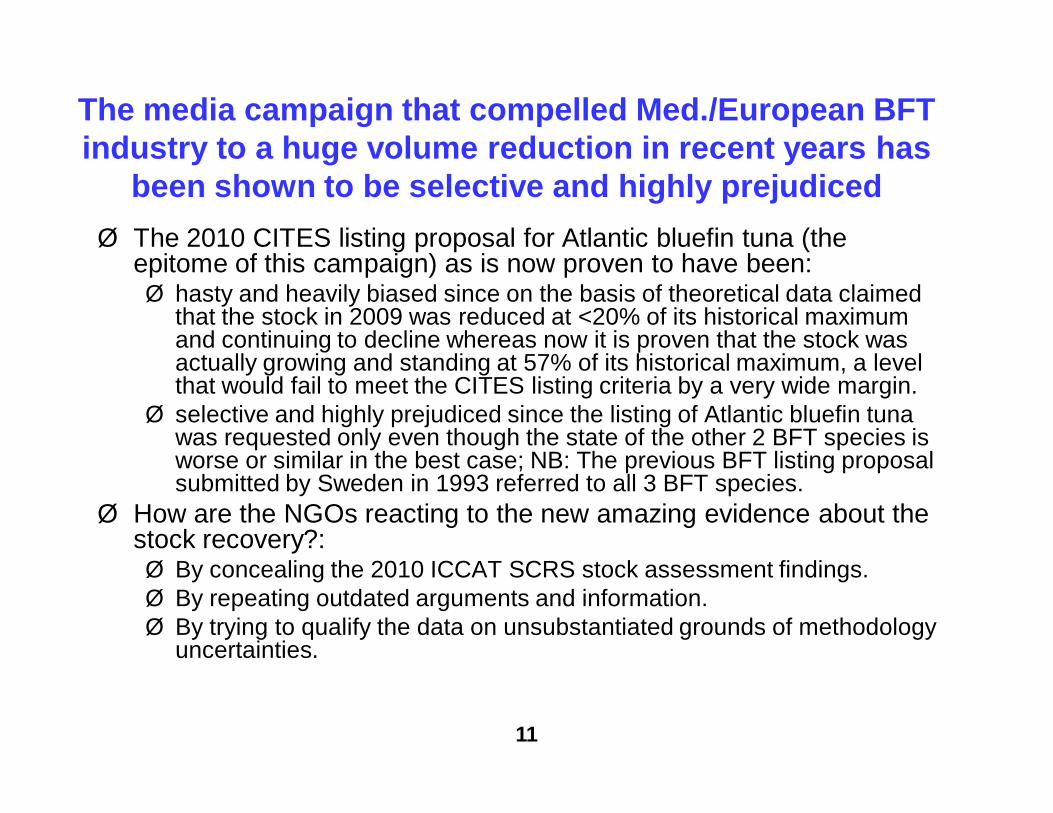
Ø The 2010 CITES listing proposal for Atlantic bluefin tuna (the epitome of this campaign) as is now proven to have been:Ø hasty and heavily biased since on the basis of theoretical data claimed
that the stock in 2009 was reduced at <20% of its historical maximum and continuing to decline whereas now it is proven that the stock was actually growing and standing at 57% of its historical maximum, a level that would fail to meet the CITES listing criteria by a very wide margin.
Ø selective and highly prejudiced since the listing of Atlantic bluefin tuna was requested only even though the state of the other 2 BFT species is worse or similar in the best case; NB: The previous BFT listing proposal submitted by Sweden in 1993 referred to all 3 BFT species.
Ø How are the NGOs reacting to the new amazing evidence about the stock recovery?:Ø By concealing the 2010 ICCAT SCRS stock assessment findings.Ø By repeating outdated arguments and information.Ø By trying to qualify the data on unsubstantiated grounds of methodology
uncertainties.
11
The media campaign that compelled Med./European BFT industry to a huge volume reduction in recent years has
been shown to be selective and highly prejudiced
12
Examples failure to update – erroneous data
13
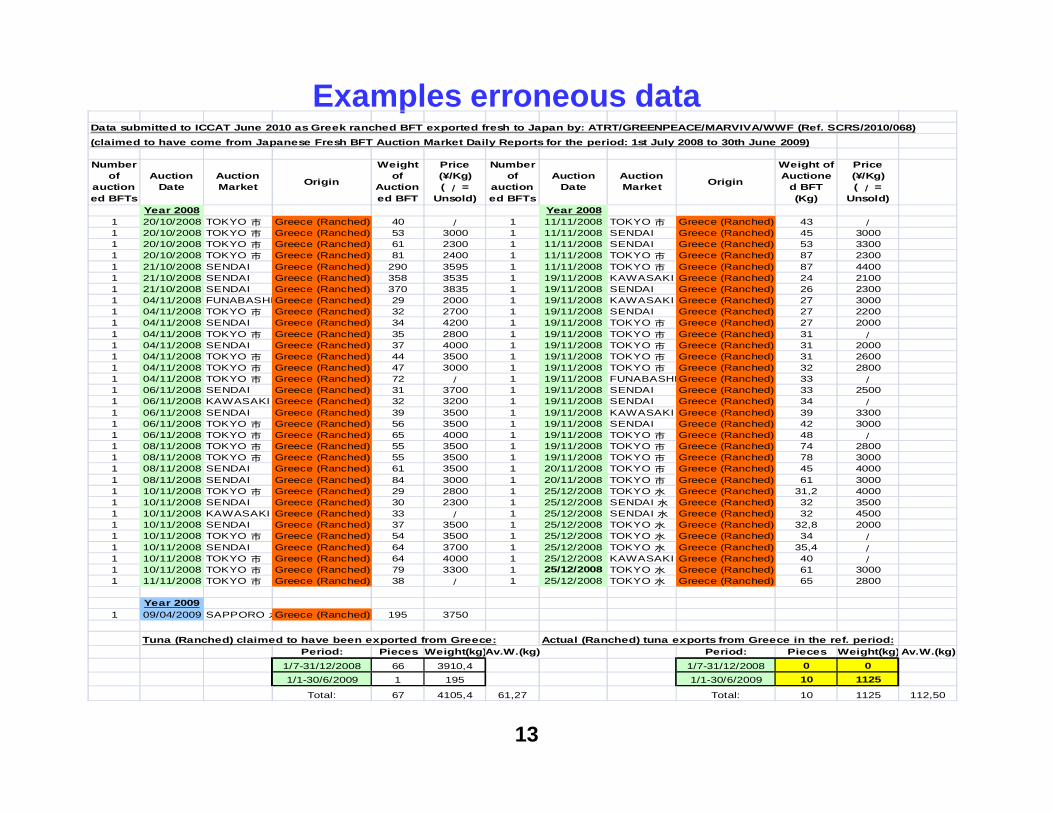
Examples erroneous dataData submitted to ICCAT June 2010 as Greek ranched BFT exported fresh to Japan by: ATRT/GREENPEACE/MARVIVA/WWF (Ref. SCRS/2010/068)(claimed to have come from Japanese Fresh BFT Auction Market Daily Reports for the period: 1st July 2008 to 30th June 2009)
Number of
auctioned BFTs
Auction Date
Auction Market Origin
Weight of
Auctioned BFT
Price (¥/Kg) ( / =
Unsold)
Number of
auctioned BFTs
Auction Date
Auction Market Origin
Weight of Auctione
d BFT (Kg)
Price (¥/Kg) ( / =
Unsold)Year 2008 Year 2008
1 20/10/2008 TOKYO 市 Greece (Ranched) 40 / 1 11/11/2008 TOKYO 市 Greece (Ranched) 43 /1 20/10/2008 TOKYO 市 Greece (Ranched) 53 3000 1 11/11/2008 SENDAI Greece (Ranched) 45 30001 20/10/2008 TOKYO 市 Greece (Ranched) 61 2300 1 11/11/2008 SENDAI Greece (Ranched) 53 33001 20/10/2008 TOKYO 市 Greece (Ranched) 81 2400 1 11/11/2008 TOKYO 市 Greece (Ranched) 87 23001 21/10/2008 SENDAI Greece (Ranched) 290 3595 1 11/11/2008 TOKYO 市 Greece (Ranched) 87 44001 21/10/2008 SENDAI Greece (Ranched) 358 3535 1 19/11/2008 KAWASAKI Greece (Ranched) 24 21001 21/10/2008 SENDAI Greece (Ranched) 370 3835 1 19/11/2008 SENDAI Greece (Ranched) 26 23001 04/11/2008 FUNABASHIGreece (Ranched) 29 2000 1 19/11/2008 KAWASAKI Greece (Ranched) 27 30001 04/11/2008 TOKYO 市 Greece (Ranched) 32 2700 1 19/11/2008 SENDAI Greece (Ranched) 27 22001 04/11/2008 SENDAI Greece (Ranched) 34 4200 1 19/11/2008 TOKYO 市 Greece (Ranched) 27 20001 04/11/2008 TOKYO 市 Greece (Ranched) 35 2800 1 19/11/2008 TOKYO 市 Greece (Ranched) 31 /1 04/11/2008 SENDAI Greece (Ranched) 37 4000 1 19/11/2008 TOKYO 市 Greece (Ranched) 31 20001 04/11/2008 TOKYO 市 Greece (Ranched) 44 3500 1 19/11/2008 TOKYO 市 Greece (Ranched) 31 26001 04/11/2008 TOKYO 市 Greece (Ranched) 47 3000 1 19/11/2008 TOKYO 市 Greece (Ranched) 32 28001 04/11/2008 TOKYO 市 Greece (Ranched) 72 / 1 19/11/2008 FUNABASHIGreece (Ranched) 33 /1 06/11/2008 SENDAI Greece (Ranched) 31 3700 1 19/11/2008 SENDAI Greece (Ranched) 33 25001 06/11/2008 KAWASAKI Greece (Ranched) 32 3200 1 19/11/2008 SENDAI Greece (Ranched) 34 /1 06/11/2008 SENDAI Greece (Ranched) 39 3500 1 19/11/2008 KAWASAKI Greece (Ranched) 39 33001 06/11/2008 TOKYO 市 Greece (Ranched) 56 3500 1 19/11/2008 SENDAI Greece (Ranched) 42 30001 06/11/2008 TOKYO 市 Greece (Ranched) 65 4000 1 19/11/2008 TOKYO 市 Greece (Ranched) 48 /1 08/11/2008 TOKYO 市 Greece (Ranched) 55 3500 1 19/11/2008 TOKYO 市 Greece (Ranched) 74 28001 08/11/2008 TOKYO 市 Greece (Ranched) 55 3500 1 19/11/2008 TOKYO 市 Greece (Ranched) 78 30001 08/11/2008 SENDAI Greece (Ranched) 61 3500 1 20/11/2008 TOKYO 市 Greece (Ranched) 45 40001 08/11/2008 SENDAI Greece (Ranched) 84 3000 1 20/11/2008 TOKYO 市 Greece (Ranched) 61 30001 10/11/2008 TOKYO 市 Greece (Ranched) 29 2800 1 25/12/2008 TOKYO 水 Greece (Ranched) 31,2 40001 10/11/2008 SENDAI Greece (Ranched) 30 2300 1 25/12/2008 SENDAI 水 Greece (Ranched) 32 35001 10/11/2008 KAWASAKI Greece (Ranched) 33 / 1 25/12/2008 SENDAI 水 Greece (Ranched) 32 45001 10/11/2008 SENDAI Greece (Ranched) 37 3500 1 25/12/2008 TOKYO 水 Greece (Ranched) 32,8 20001 10/11/2008 TOKYO 市 Greece (Ranched) 54 3500 1 25/12/2008 TOKYO 水 Greece (Ranched) 34 /1 10/11/2008 SENDAI Greece (Ranched) 64 3700 1 25/12/2008 TOKYO 水 Greece (Ranched) 35,4 /1 10/11/2008 TOKYO 市 Greece (Ranched) 64 4000 1 25/12/2008 KAWASAKI Greece (Ranched) 40 /1 10/11/2008 TOKYO 市 Greece (Ranched) 79 3300 1 25/12/2008 TOKYO 水 Greece (Ranched) 61 30001 11/11/2008 TOKYO 市 Greece (Ranched) 38 / 1 25/12/2008 TOKYO 水 Greece (Ranched) 65 2800
Year 20091 09/04/2009 SAPPORO 水Greece (Ranched) 195 3750
Tuna (Ranched) claimed to have been exported from Greece: Actual (Ranched) tuna exports from Greece in the ref. period:Period: Pieces Weight(kg)Av.W.(kg) Period: Pieces Weight(kg)Av.W.(kg)
1/7-31/12/2008 66 3910,4 1/7-31/12/2008 0 01/1-30/6/2009 1 195 1/1-30/6/2009 10 1125
Total: 67 4105,4 61,27 Total: 10 1125 112,50
14
15
Global Farmed Bluefin Tuna Production(Estimated W/R equivalent sales weight at farm gate)
0
5000
10000
15000
20000
25000
30000
35000
40000
45000
2002 2003 2004 2005 2006 2007 2008 2009 2010est.
MT/
Year
BFT MedSBT AusPBT MexPBT JapTOTAL

16
Mediterranean farmed bluefin tuna production(W/R weight basis ex-farm)
0
1.000
2.000
3.000
4.000
5.000
6.000
7.000
8.000
2002 2003 2004 2005 2006 2007 2008 2009 2010est.
MT/
Year
SPAIN MALTA CROATIA TURKEY TUNISIAITALY GREECE CYPRUS LIBYA
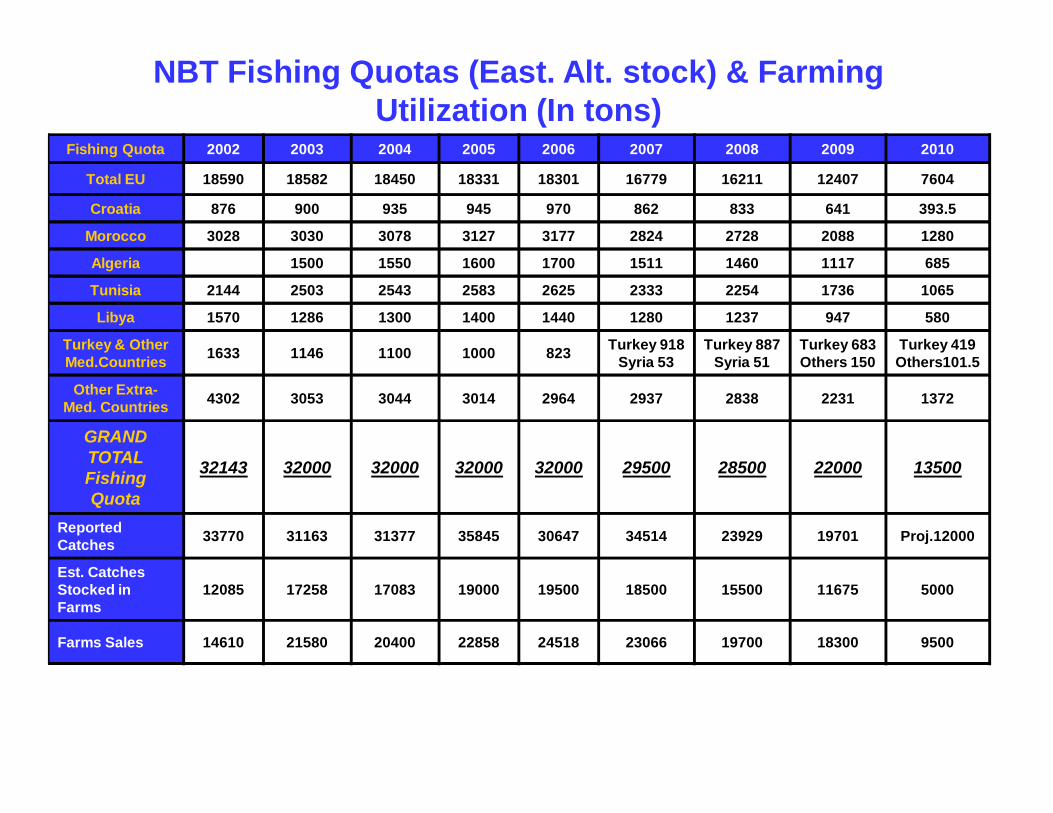
Fishing Quota 2002 2003 2004 2005 2006 2007 2008 2009 2010
Total EU 18590 18582 18450 18331 18301 16779 16211 12407 7604
Croatia 876 900 935 945 970 862 833 641 393.5
Morocco 3028 3030 3078 3127 3177 2824 2728 2088 1280
Algeria 1500 1550 1600 1700 1511 1460 1117 685
Tunisia 2144 2503 2543 2583 2625 2333 2254 1736 1065
Libya 1570 1286 1300 1400 1440 1280 1237 947 580
Turkey & Other Med.Countries 1633 1146 1100 1000 823 Turkey 918
Syria 53Turkey 887
Syria 51Turkey 683 Others 150
Turkey 419 Others101.5
Other Extra-Med. Countries 4302 3053 3044 3014 2964 2937 2838 2231 1372
GRAND TOTAL Fishing Quota
32143 32000 32000 32000 32000 29500 28500 22000 13500
Reported Catches 33770 31163 31377 35845 30647 34514 23929 19701 Proj.12000
Est. Catches Stocked in Farms
12085 17258 17083 19000 19500 18500 15500 11675 5000
Farms Sales 14610 21580 20400 22858 24518 23066 19700 18300 9500
NBT Fishing Quotas (East. Alt. stock) & Farming Utilization (In tons)
As attested by ICCAT’s SCRS (2010) the eastern Atlantic wild BFT stock:Ø Is increasing and under no threat of collapseØ With current TAC and control/compliance measures in place, SSB will have been rebuilt by
2022 to a level able to sustain a maximum sustainable yield of up to 50,000 tons/pa from 2023 onwards.
Ø The European tuna farming producers vow to continue their adherence to the principles of sustainability and traceability for the long-term sustainable exploitation of the wild BFT stock and request:
Ø The support of the EP’s Fisheries Committee, so that:Ø No further restrictions to the BFT-E fishery and farming activities are imposed
above and beyond those which scientific advice understands to be necessary for the protection and sustainable exploitation of the stock and the present jobs in the bluefin tuna farming sector are preserved.
Ø The commercial interests of the European tuna farming sector are protected against unfair competition practices and media bias.
Ø ICCAT is assisted/funded in order to continue and increase its efforts to improve the data and knowledge about the wild stock and its research programs on BFT (GBYP).
Ø Research and other initiatives at EU level aiming to close the life cycle of Atlantic bluefin tuna and make possible the artificial propagation and controlled production of the species are fully supported and encouraged.
18
Conclusions